Copyright © 2014 Oracle and/or its affiliates. All rights reserved. |
How To Monitor Your MySQL Estate
Mark Swarbrick Principle Presales Consultant
MySQL Webinar Series 3/4
Copyright © 2014 Oracle and/or its affiliates. All rights reserved. |
Safe Harbor Statement The following is intended to outline our general product direcFon. It is intended for informaFon purposes only, and may not be incorporated into any contract. It is not a commitment to deliver any material, code, or funcFonality, and should not be relied upon in making purchasing decisions. The development, release, and Fming of any features or funcFonality described for Oracle’s products remains at the sole discreFon of Oracle.
3

Copyright © 2014 Oracle and/or its affiliates. All rights reserved. |
MySQL Enterprise Monitor: Agenda
Why MySQL Enterprise EdiFon?
Overview & Architecture
InstallaFon & ConfiguraFon
Features & Benefits
AddiFonal Info & Case Studies
4
1
2
3
4
5
Copyright © 2014 Oracle and/or its affiliates. All rights reserved. |
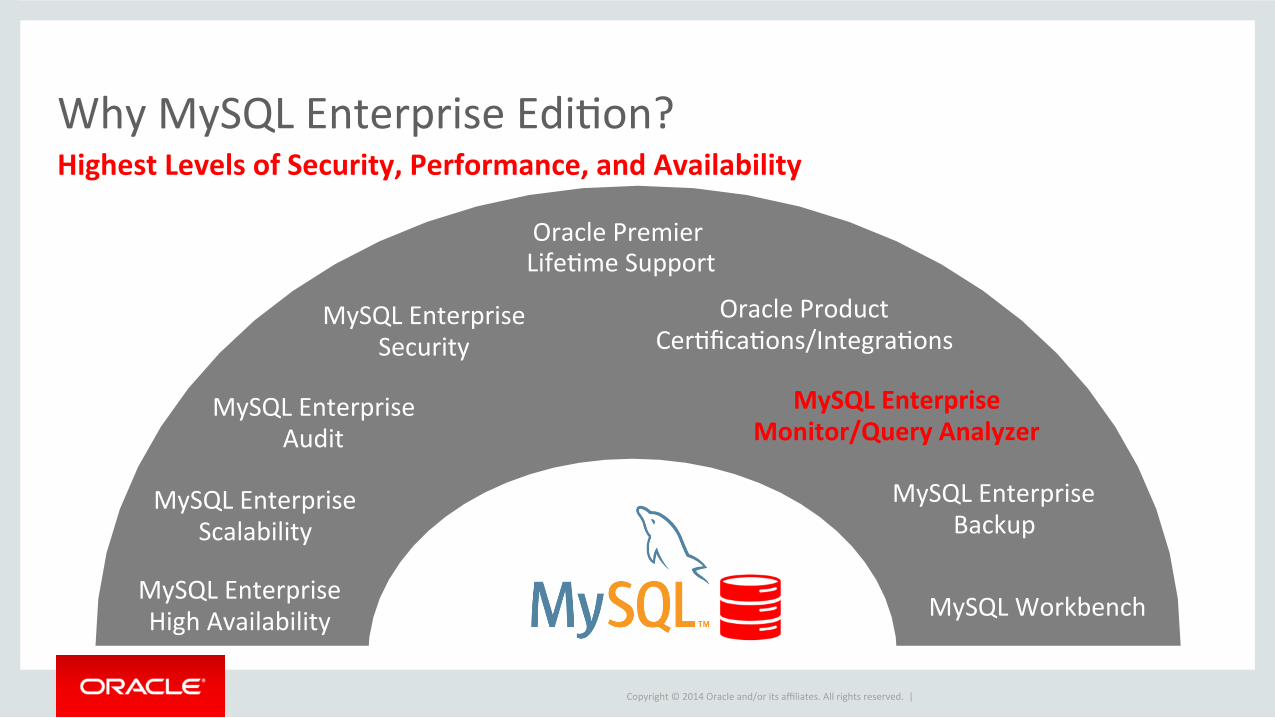
Oracle Premier LifeFme Support
Oracle Product CerFficaFons/IntegraFons
MySQL Enterprise High Availability
MySQL Enterprise Security
MySQL Enterprise Scalability
MySQL Enterprise Backup
MySQL Enterprise Monitor/Query Analyzer
MySQL Workbench
MySQL Enterprise Audit
Why MySQL Enterprise EdiFon? Highest Levels of Security, Performance, and Availability

Copyright © 2014 Oracle and/or its affiliates. All rights reserved. |
Overview & Architecture
6

Copyright © 2014 Oracle and/or its affiliates. All rights reserved. |
MySQL Enterprise Monitor
7
ApplicaFon Big Fish Games is a global leader in the online games industry and distributes more games worldwide than any other online site. Key Business Benefit MySQL Query Analyzer provides a consolidated view of query acFviFes and execuFon details, and has enabled Big Fish Games to quickly idenFfy poorly running queries and tackle the root causes directly in the SQL code. Why MySQL Enterprise EdiFon? “With the MySQL Query Analyzer, we were able to iden9fy and analyze problema9c SQL code, and triple our database performance. More importantly, we were able to accomplish this in three days, rather than taking weeks.” -‐-‐ Keith Souhrada, SoLware Development Engineer, Big Fish Games
Copyright © 2014 Oracle and/or its affiliates. All rights reserved. |
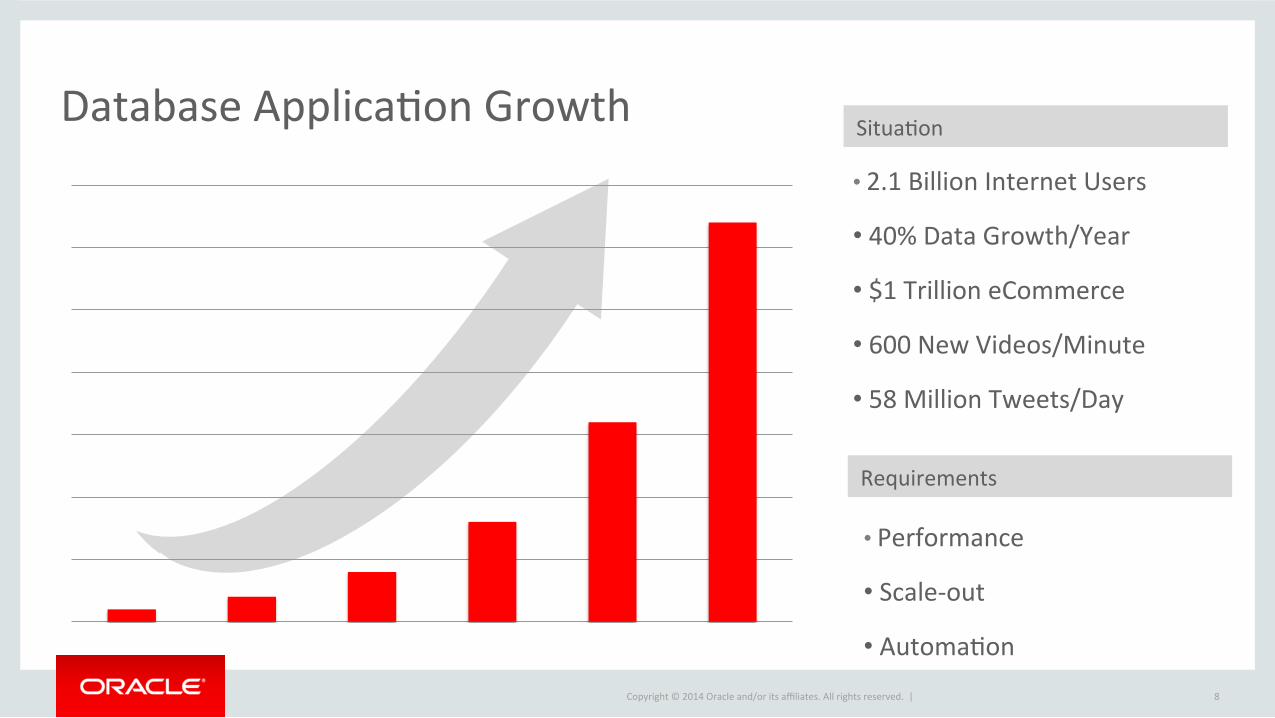
Database ApplicaFon Growth • 2.1 Billion Internet Users
• 40% Data Growth/Year
• $1 Trillion eCommerce
• 600 New Videos/Minute
• 58 Million Tweets/Day
SituaFon
Requirements
• Performance
• Scale-‐out
• AutomaFon
8

Copyright © 2014 Oracle and/or its affiliates. All rights reserved. |
MySQL DBA Checklist 1. Ensure your producFon databases are available ✔ 2. Monitor MySQL performance throughout the day ✔ 3. Verify that MySQL replicaFon is working properly ✔ 4. Confirm that backups have completed successfully ✔ 5. Monitor disk space to ensure MySQL won’t run out of space ✔ 6. Regularly monitor and idenFfy blocking issues ✔ 7. Verify there have been no changes to database schema ✔ 8. Check OS metrics for unusual events ✔ 9. Check for security vulnerabiliFes ✔ 10. Monitor and analyze memory usage ✔
9
Copyright © 2014 Oracle and/or its affiliates. All rights reserved. |
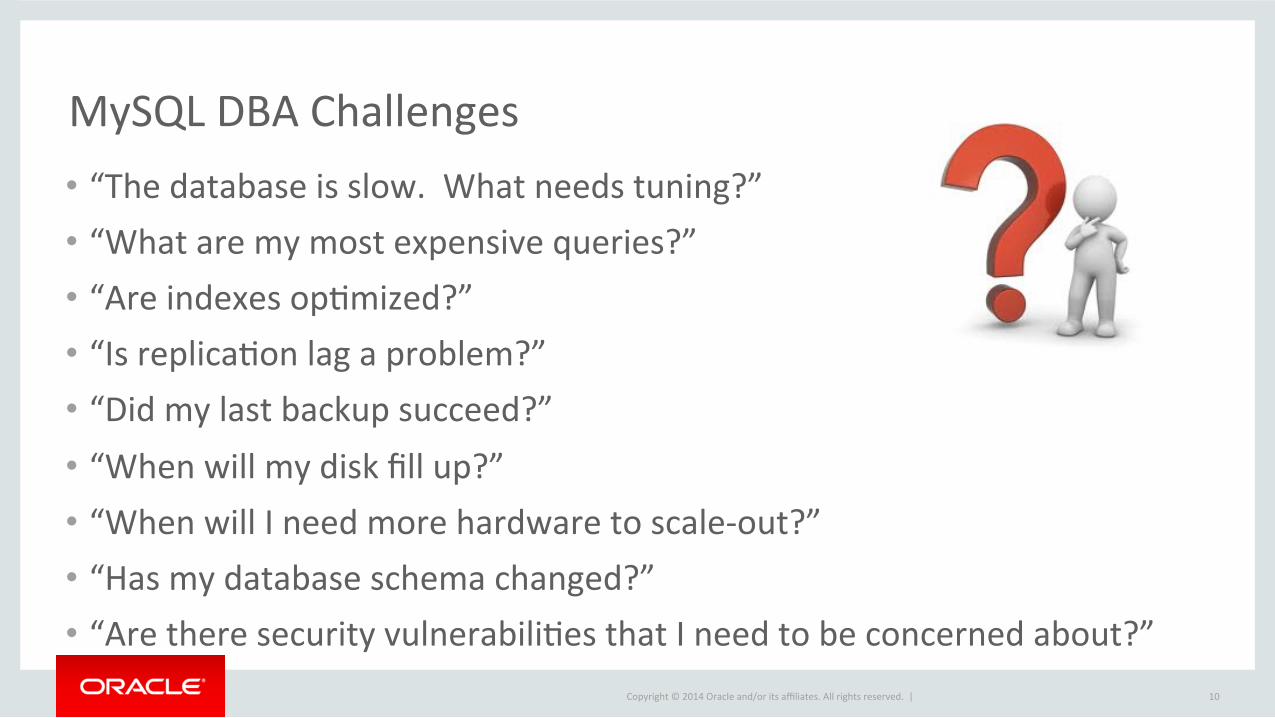
MySQL DBA Challenges • “The database is slow. What needs tuning?” • “What are my most expensive queries?” • “Are indexes opFmized?” • “Is replicaFon lag a problem?” • “Did my last backup succeed?” • “When will my disk fill up?” • “When will I need more hardware to scale-‐out?” • “Has my database schema changed?” • “Are there security vulnerabiliFes that I need to be concerned about?”
10

Copyright © 2014 Oracle and/or its affiliates. All rights reserved. |
MySQL Enterprise Monitor
11
• Start monitoring MySQL in 10 minutes • Real-‐Fme MySQL performance and availability monitoring
• Visually find & fix problem queries • Disk monitoring for capacity planning • Cloud friendly architecture
– No agents required – Policy driven configuraFon – Easy integraFon with DevOps tools
Copyright © 2014 Oracle and/or its affiliates. All rights reserved. |
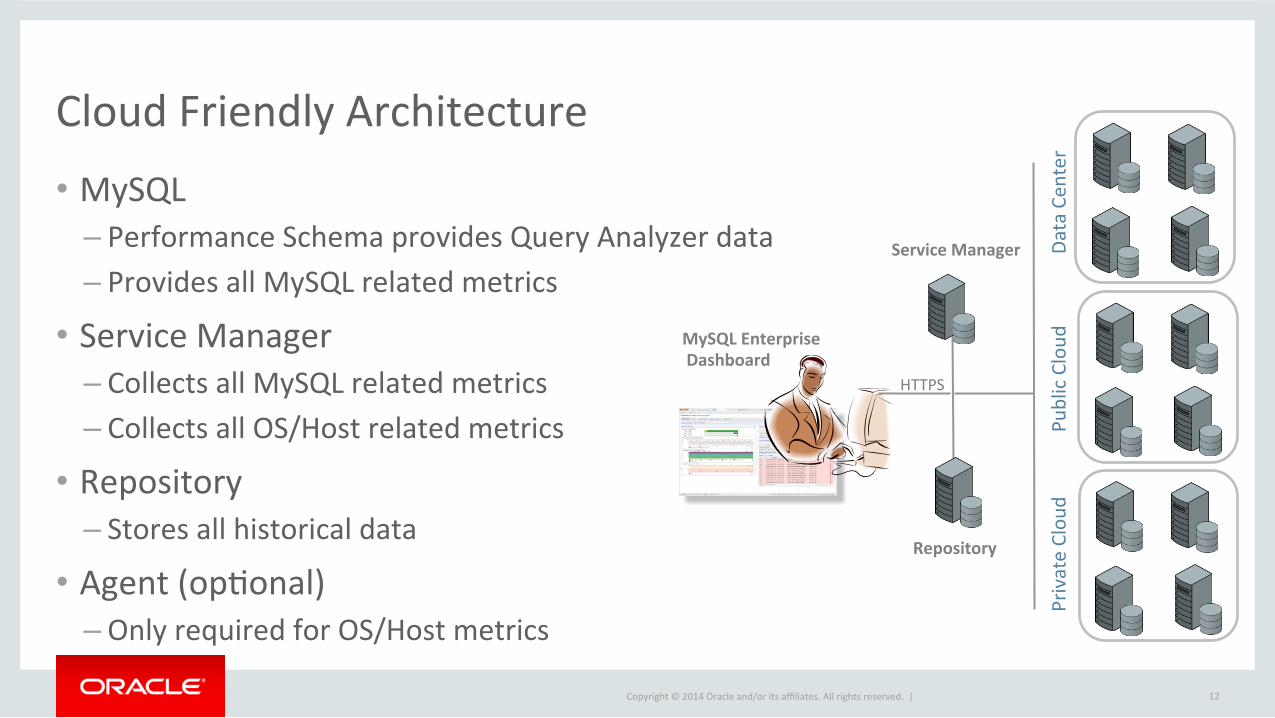
Cloud Friendly Architecture • MySQL
– Performance Schema provides Query Analyzer data – Provides all MySQL related metrics
• Service Manager – Collects all MySQL related metrics – Collects all OS/Host related metrics
• Repository – Stores all historical data
• Agent (opFonal) – Only required for OS/Host metrics
12
MySQL Enterprise Dashboard
Service Manager
Repository
HTTPS
Data Cen
ter
Public Cloud
Private Clou
d

Copyright © 2014 Oracle and/or its affiliates. All rights reserved. |
InstallaFon & ConfiguraFon • Install the Service Manager
– shell> ./mysqlmonitor-‐3.0.X.XXXX-‐…-‐installer.bin
• Up and Running in 10 minutes – Auto-‐discovery of MySQL servers – Advisors are pre-‐configured – Advisors are pre-‐scheduled
• CustomizaFon – Centralized configuraFon dashboard – Advisors – Event handling
13

Copyright © 2014 Oracle and/or its affiliates. All rights reserved. |
MySQL Enterprise Dashboard
14
"The MySQL Enterprise Monitor is an absolute must for any DBA who takes his work seriously.” Adrian Baumann System Specialist Federal Office of InformaFon Technology & TelecommunicaFons
• SLA monitoring • Real-‐Fme performance monitoring • Alerts & noFficaFons • MySQL best pracFce advisors
Copyright © 2014 Oracle and/or its affiliates. All rights reserved. |
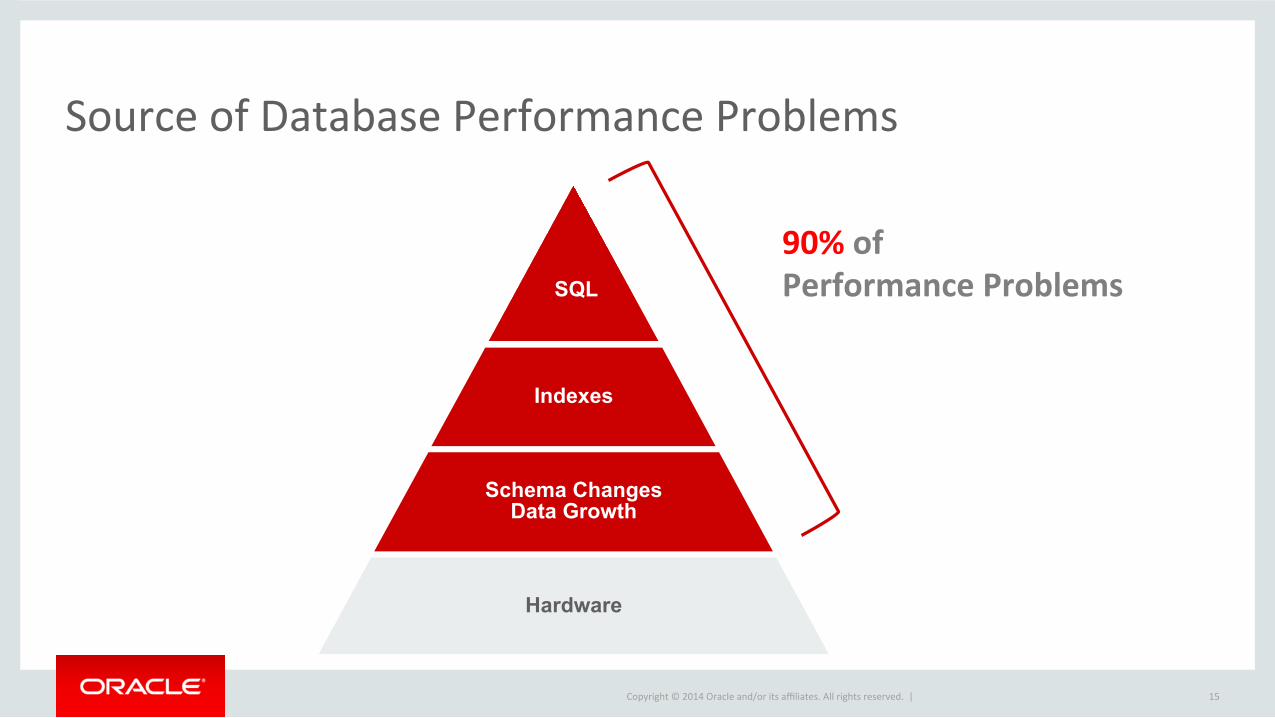
Hardware
Schema Changes Data Growth
Indexes
SQL
90% of Performance Problems
Source of Database Performance Problems
15

Copyright © 2014 Oracle and/or its affiliates. All rights reserved. |
MySQL Performance Schema • IdenFfy performance boqlenecks • IdenFfy problemaFc queries • Get real Fme insight into locks • See exactly what is happening within MySQL
• Get real Fme insight into MySQL internals
• Get real Fme insight into query execuFons
16
mysql> select * from host_summary_by_stages; +-‐-‐-‐-‐-‐-‐+-‐-‐-‐-‐-‐-‐-‐-‐-‐-‐-‐-‐-‐-‐-‐-‐-‐-‐-‐-‐-‐-‐-‐-‐-‐-‐-‐-‐-‐-‐-‐-‐+-‐-‐-‐-‐-‐-‐-‐+-‐-‐-‐-‐-‐-‐-‐-‐-‐-‐-‐+-‐-‐-‐-‐-‐-‐-‐-‐-‐-‐-‐+ | host | event_name | total | wait_sum | wait_avg | +-‐-‐-‐-‐-‐-‐+-‐-‐-‐-‐-‐-‐-‐-‐-‐-‐-‐-‐-‐-‐-‐-‐-‐-‐-‐-‐-‐-‐-‐-‐-‐-‐-‐-‐-‐-‐-‐-‐+-‐-‐-‐-‐-‐-‐-‐+-‐-‐-‐-‐-‐-‐-‐-‐-‐-‐-‐+-‐-‐-‐-‐-‐-‐-‐-‐-‐-‐-‐+ | hal | stage/sql/Opening tables | 889 | 1.97 ms | 2.22 us | | hal | stage/sql/Creating sort index | 4 | 1.79 ms | 446.30 us | | hal | stage/sql/init | 10 | 312.27 us | 31.23 us | | hal | stage/sql/checking permissions | 10 | 300.62 us | 30.06 us | | hal | stage/sql/freeing items | 5 | 85.89 us | 17.18 us | | hal | stage/sql/statistics | 5 | 79.15 us | 15.83 us | | hal | stage/sql/preparing | 5 | 69.12 us | 13.82 us | | hal | stage/sql/optimizing | 5 | 53.11 us | 10.62 us | | hal | stage/sql/Sending data | 5 | 44.66 us | 8.93 us | | hal | stage/sql/closing tables | 5 | 37.54 us | 7.51 us | | hal | stage/sql/System lock | 5 | 34.28 us | 6.86 us | | hal | stage/sql/query end | 5 | 24.37 us | 4.87 us | | hal | stage/sql/end | 5 | 8.60 us | 1.72 us | | hal | stage/sql/Sorting result | 5 | 8.33 us | 1.67 us | | hal | stage/sql/executing | 5 | 5.37 us | 1.07 us | | hal | stage/sql/cleaning up | 5 | 4.60 us | 919.00 ns | +-‐-‐-‐-‐-‐-‐+-‐-‐-‐-‐-‐-‐-‐-‐-‐-‐-‐-‐-‐-‐-‐-‐-‐-‐-‐-‐-‐-‐-‐-‐-‐-‐-‐-‐-‐-‐-‐-‐+-‐-‐-‐-‐-‐-‐-‐+-‐-‐-‐-‐-‐-‐-‐-‐-‐-‐-‐+-‐-‐-‐-‐-‐-‐-‐-‐-‐-‐-‐+
Copyright © 2014 Oracle and/or its affiliates. All rights reserved. |
Solving real world problems
• The following examples are taken from the Mark Leith’s ps_helper project, which is a set of views into performance_schema. – hqp://www.markleith.co.uk/ps_helper/
• This will offer some simple examples demonstraFng the power of performance_schema, while also hopefully sparking some ideas about what kind of custom queries you can create on your own.
Copyright © 2014 Oracle and/or its affiliates. All rights reserved. |
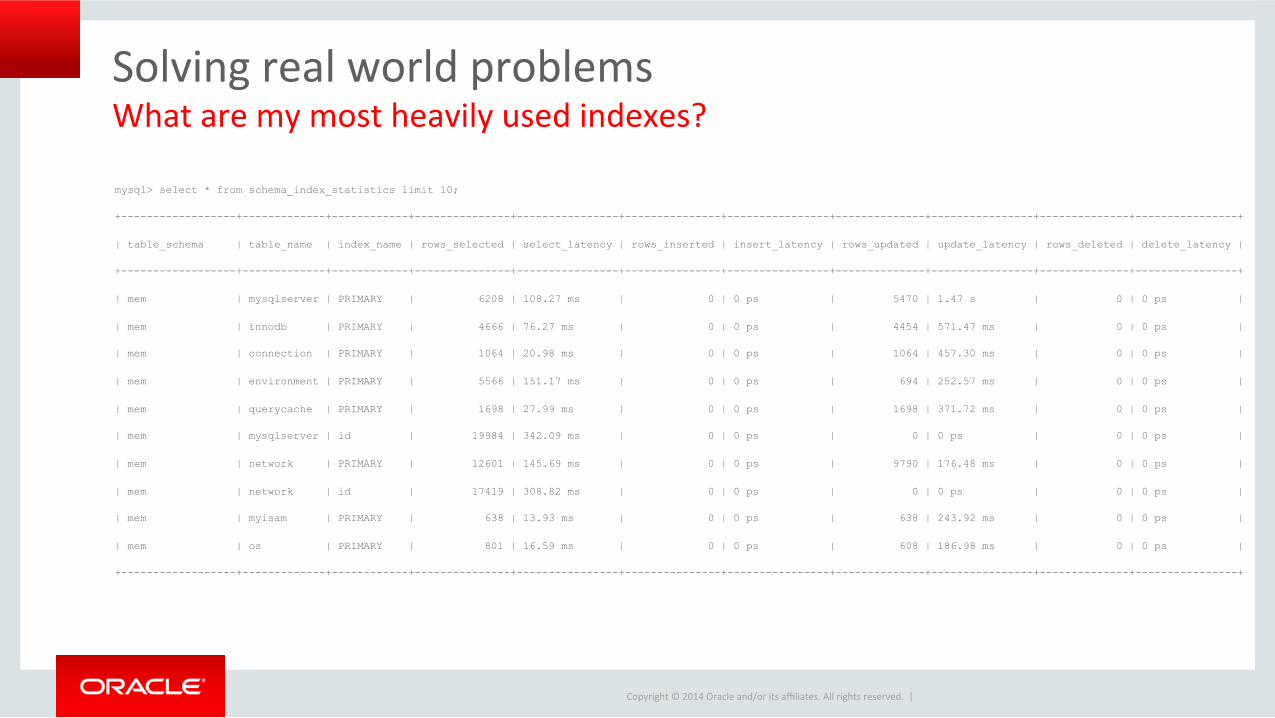
Solving real world problems
mysql> select * from schema_index_statistics limit 10;
+------------------+-------------+------------+---------------+----------------+---------------+----------------+--------------+----------------+--------------+----------------+
| table_schema | table_name | index_name | rows_selected | select_latency | rows_inserted | insert_latency | rows_updated | update_latency | rows_deleted | delete_latency |
+------------------+-------------+------------+---------------+----------------+---------------+----------------+--------------+----------------+--------------+----------------+
| mem | mysqlserver | PRIMARY | 6208 | 108.27 ms | 0 | 0 ps | 5470 | 1.47 s | 0 | 0 ps |
| mem | innodb | PRIMARY | 4666 | 76.27 ms | 0 | 0 ps | 4454 | 571.47 ms | 0 | 0 ps |
| mem | connection | PRIMARY | 1064 | 20.98 ms | 0 | 0 ps | 1064 | 457.30 ms | 0 | 0 ps |
| mem | environment | PRIMARY | 5566 | 151.17 ms | 0 | 0 ps | 694 | 252.57 ms | 0 | 0 ps |
| mem | querycache | PRIMARY | 1698 | 27.99 ms | 0 | 0 ps | 1698 | 371.72 ms | 0 | 0 ps |
| mem | mysqlserver | id | 19984 | 342.09 ms | 0 | 0 ps | 0 | 0 ps | 0 | 0 ps |
| mem | network | PRIMARY | 12601 | 145.69 ms | 0 | 0 ps | 9790 | 176.48 ms | 0 | 0 ps |
| mem | network | id | 17419 | 308.82 ms | 0 | 0 ps | 0 | 0 ps | 0 | 0 ps |
| mem | myisam | PRIMARY | 638 | 13.93 ms | 0 | 0 ps | 638 | 243.92 ms | 0 | 0 ps |
| mem | os | PRIMARY | 801 | 16.59 ms | 0 | 0 ps | 608 | 186.98 ms | 0 | 0 ps |
+------------------+-------------+------------+---------------+----------------+---------------+----------------+--------------+----------------+--------------+----------------+
What are my most heavily used indexes?

Copyright © 2014 Oracle and/or its affiliates. All rights reserved. |
Solving real world problems
mysql> select * from schema_table_staFsFcs limit 1\G
*************************** 1. row ***************************
table_schema: sys
table_name: server_error
rows_fetched: 0
fetch_latency: 0 ps
rows_inserted: 875
insert_latency: 78.38 ms
rows_updated: 0
update_latency: 0 ps
rows_deleted: 0
delete_latency: 0 ps
io_read_requests: 14
io_read: 4.63 KiB
io_read_latency: 72.63 us
io_write_requests: 23
io_write: 6.31 KiB
io_write_latency: 362.83 us
io_misc_requests: 19
io_misc_latency: 5.86 ms
What are my most heavily used tables?

Copyright © 2014 Oracle and/or its affiliates. All rights reserved. |
Solving real world problems
mysql> select * from schema_tables_with_full_table_scans limit 5;
+------------------+-------------------+-------------------+
| object_schema | object_name | rows_full_scanned |
+------------------+-------------------+-------------------+
| mem | rule_alarms | 1210 |
| mem30__advisors | advisor_schedules | 1021 |
| mem30__inventory | agent | 498 |
| mem | dc_p_string | 449 |
| mem30__inventory | mysqlserver | 294 |
+------------------+-------------------+-------------------+
What tables am I doing full table scans on?

Copyright © 2014 Oracle and/or its affiliates. All rights reserved. |
Solving real world problems
mysql> select * from schema_unused_indexes;
+---------------------------+-------------------------------+--------------------------------------------------------+
| object_schema | object_name | index_name |
+---------------------------+-------------------------------+--------------------------------------------------------+
| mem | dc_p_double | PRIMARY |
| mem | dc_p_double | end_time |
| mem | dc_p_long | PRIMARY |
| mem | dc_p_long | end_time |
| mem | dc_p_string | begin_time |
| mem | dc_p_string | end_time |
...
What indexes aren’t being used at all?
Copyright © 2014 Oracle and/or its affiliates. All rights reserved. |
Solving real world problems
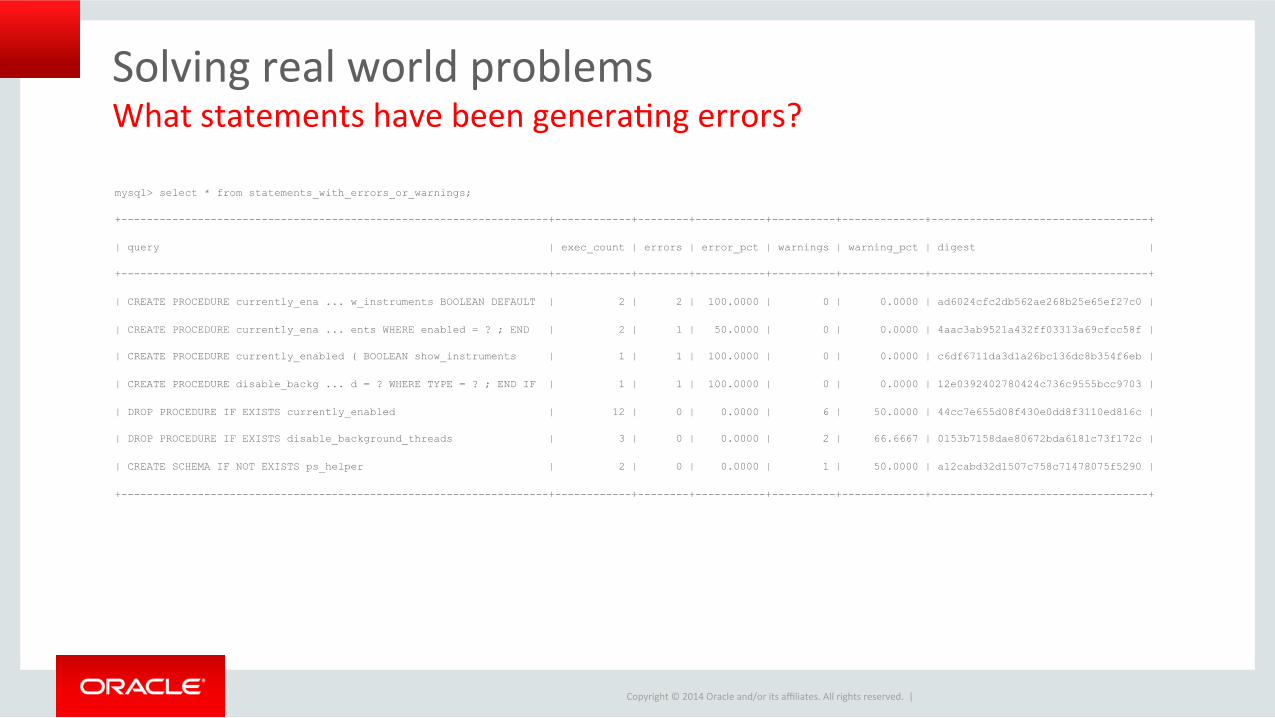
mysql> select * from statements_with_errors_or_warnings;
+-------------------------------------------------------------------+------------+--------+-----------+----------+-------------+----------------------------------+
| query | exec_count | errors | error_pct | warnings | warning_pct | digest |
+-------------------------------------------------------------------+------------+--------+-----------+----------+-------------+----------------------------------+
| CREATE PROCEDURE currently_ena ... w_instruments BOOLEAN DEFAULT | 2 | 2 | 100.0000 | 0 | 0.0000 | ad6024cfc2db562ae268b25e65ef27c0 |
| CREATE PROCEDURE currently_ena ... ents WHERE enabled = ? ; END | 2 | 1 | 50.0000 | 0 | 0.0000 | 4aac3ab9521a432ff03313a69cfcc58f |
| CREATE PROCEDURE currently_enabled ( BOOLEAN show_instruments | 1 | 1 | 100.0000 | 0 | 0.0000 | c6df6711da3d1a26bc136dc8b354f6eb |
| CREATE PROCEDURE disable_backg ... d = ? WHERE TYPE = ? ; END IF | 1 | 1 | 100.0000 | 0 | 0.0000 | 12e0392402780424c736c9555bcc9703 |
| DROP PROCEDURE IF EXISTS currently_enabled | 12 | 0 | 0.0000 | 6 | 50.0000 | 44cc7e655d08f430e0dd8f3110ed816c |
| DROP PROCEDURE IF EXISTS disable_background_threads | 3 | 0 | 0.0000 | 2 | 66.6667 | 0153b7158dae80672bda6181c73f172c |
| CREATE SCHEMA IF NOT EXISTS ps_helper | 2 | 0 | 0.0000 | 1 | 50.0000 | a12cabd32d1507c758c71478075f5290 |
+-------------------------------------------------------------------+------------+--------+-----------+----------+-------------+----------------------------------+
What statements have been generaFng errors?
Copyright © 2014 Oracle and/or its affiliates. All rights reserved. |
Solving real world problems
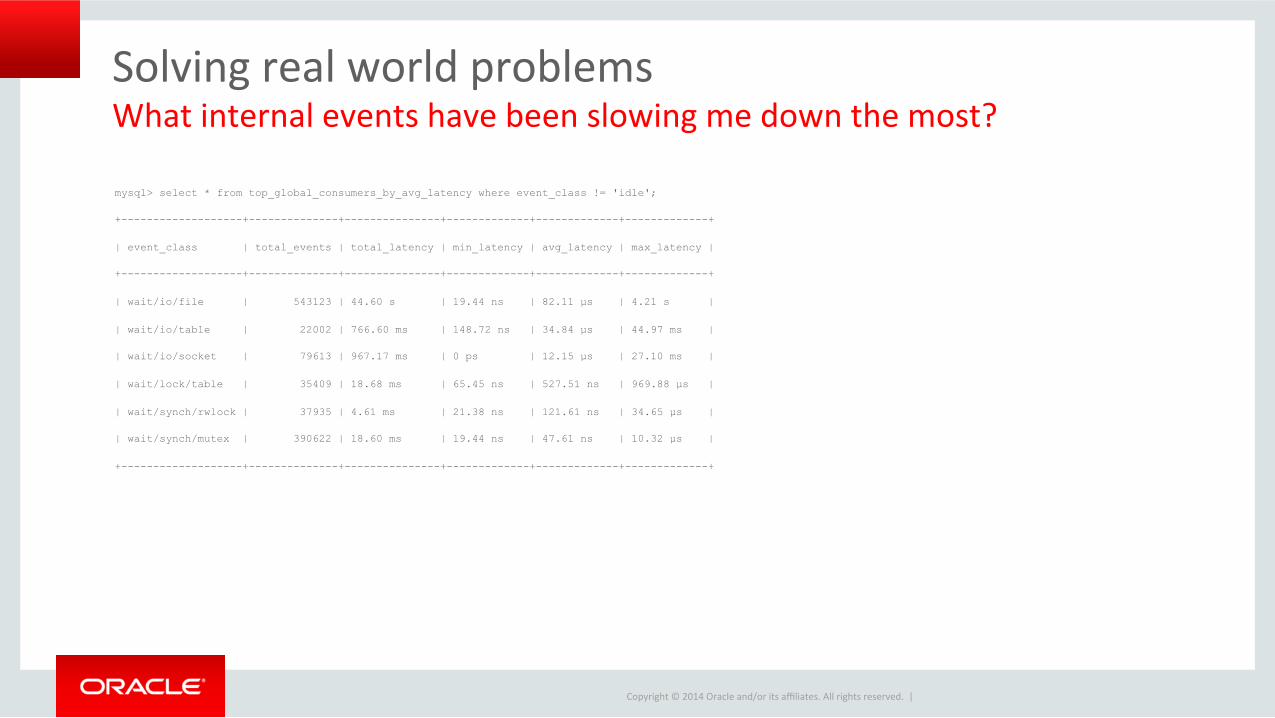
mysql> select * from top_global_consumers_by_avg_latency where event_class != 'idle';
+-------------------+--------------+---------------+-------------+-------------+-------------+
| event_class | total_events | total_latency | min_latency | avg_latency | max_latency |
+-------------------+--------------+---------------+-------------+-------------+-------------+
| wait/io/file | 543123 | 44.60 s | 19.44 ns | 82.11 µs | 4.21 s |
| wait/io/table | 22002 | 766.60 ms | 148.72 ns | 34.84 µs | 44.97 ms |
| wait/io/socket | 79613 | 967.17 ms | 0 ps | 12.15 µs | 27.10 ms |
| wait/lock/table | 35409 | 18.68 ms | 65.45 ns | 527.51 ns | 969.88 µs |
| wait/synch/rwlock | 37935 | 4.61 ms | 21.38 ns | 121.61 ns | 34.65 µs |
| wait/synch/mutex | 390622 | 18.60 ms | 19.44 ns | 47.61 ns | 10.32 µs |
+-------------------+--------------+---------------+-------------+-------------+-------------+
What internal events have been slowing me down the most?

Copyright © 2014 Oracle and/or its affiliates. All rights reserved. |
Solving real world problems
mysql> select * from top_io_by_file limit 10;
+-------------------------------------------------+------------+------------+-----------+-------------+---------------+-----------+------------+-----------+
| file | count_read | total_read | avg_read | count_write | total_written | avg_write | total | write_pct |
+-------------------------------------------------+------------+------------+-----------+-------------+---------------+-----------+------------+-----------+
| @@datadir/mysql/user.MYD | 44829 | 21.61 MiB | 505 bytes | 0 | 0 bytes | 0 bytes | 21.61 MiB | 0.00 |
| @@datadir/mem/#sql-82c_2e.frm | 1932 | 562.54 KiB | 298 bytes | 5547 | 591.51 KiB | 109 bytes | 1.13 MiB | 51.26 |
| @@datadir/mem/#sql-82c_42.frm | 952 | 488.38 KiB | 525 bytes | 1415 | 560.55 KiB | 406 bytes | 1.02 MiB | 53.44 |
| @@datadir/mysql/proc.MYD | 633 | 291.77 KiB | 472 bytes | 227 | 167.51 KiB | 756 bytes | 459.28 KiB | 36.47 |
| @@datadir/ddl_log.log | 20 | 80.00 KiB | 4.00 KiB | 76 | 304.00 KiB | 4.00 KiB | 384.00 KiB | 79.17 |
| @@datadir/mem/statement_explain_data.frm | 23 | 176.76 KiB | 7.69 KiB | 53 | 118.91 KiB | 2.24 KiB | 295.67 KiB | 40.22 |
| @@datadir/mem/inventory_instance_attributes.frm | 29 | 121.47 KiB | 4.19 KiB | 42 | 62.35 KiB | 1.48 KiB | 183.82 KiB | 33.92 |
| @@datadir/mem/rule_eval_result_vars.frm | 15 | 61.27 KiB | 4.08 KiB | 28 | 62.63 KiB | 2.24 KiB | 123.89 KiB | 50.55 |
| @@datadir/subjects.frm | 16 | 49.39 KiB | 3.09 KiB | 31 | 52.69 KiB | 1.70 KiB | 102.08 KiB | 51.61 |
| @@datadir/mem/statement_data.frm | 8 | 33.02 KiB | 4.13 KiB | 35 | 69.01 KiB | 1.97 KiB | 102.04 KiB | 67.64 |
+-------------------------------------------------+------------+------------+-----------+-------------+---------------+-----------+------------+-----------+
Where have I been doing most of my disk I/O?
Copyright © 2014 Oracle and/or its affiliates. All rights reserved. |
Solving real world problems
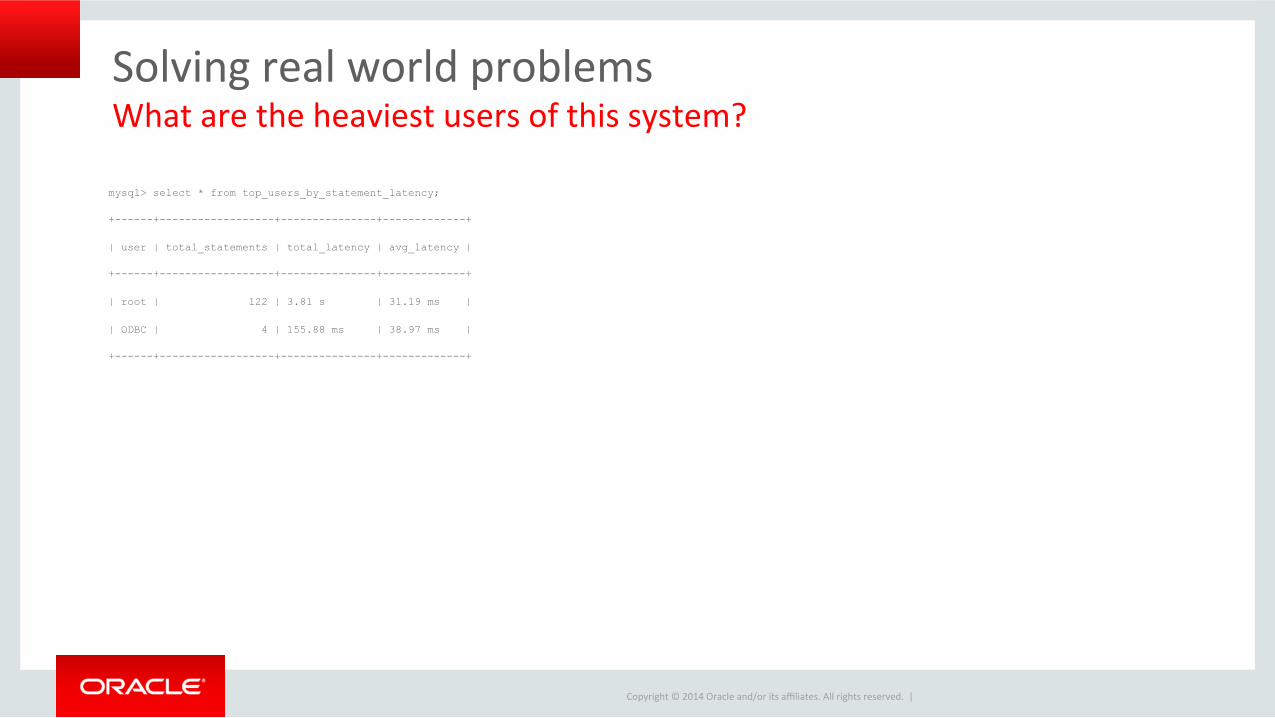
mysql> select * from top_users_by_statement_latency;
+------+------------------+---------------+-------------+
| user | total_statements | total_latency | avg_latency |
+------+------------------+---------------+-------------+
| root | 122 | 3.81 s | 31.19 ms |
| ODBC | 4 | 155.88 ms | 38.97 ms |
+------+------------------+---------------+-------------+
What are the heaviest users of this system?

Copyright © 2014 Oracle and/or its affiliates. All rights reserved. |
Solving real world problems
mysql> select * from top_tables_by_lock_wait_time;
+--------------+--------------+----------------------+
| table_schema | table_name | total_lock_wait_time |
+--------------+--------------+----------------------+
| test | foo | 32.71 us |
| sys | client_error | 2.36 us |
| test | vctest | 2.29 us |
+--------------+--------------+----------------------+
Which tables are experiencing the most lock contenFon?
Copyright © 2014 Oracle and/or its affiliates. All rights reserved. |
Solving real world problems
• These were merely a sample! • Delve into performance_schema, and find ways to solve your parFcular performance problems.

Copyright © 2014 Oracle and/or its affiliates. All rights reserved. |
Features & Benefits
28

Copyright © 2014 Oracle and/or its affiliates. All rights reserved. |
Performance Monitoring • Monitor MySQL performance • Monitor OS performance • Monitor query performance • Advice on index usage • Alerts on performance problems
29
Copyright © 2014 Oracle and/or its affiliates. All rights reserved. |
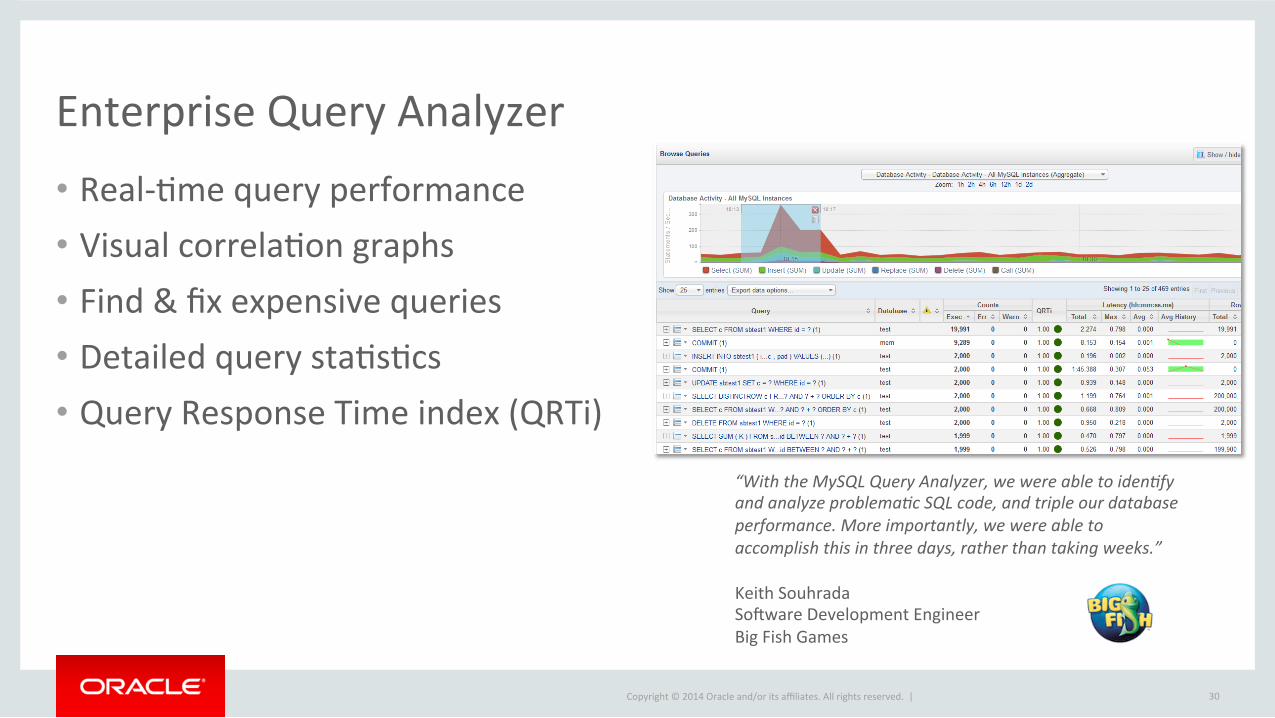
Enterprise Query Analyzer • Real-‐Fme query performance • Visual correlaFon graphs • Find & fix expensive queries • Detailed query staFsFcs • Query Response Time index (QRTi)
30
“With the MySQL Query Analyzer, we were able to iden9fy and analyze problema9c SQL code, and triple our database performance. More importantly, we were able to accomplish this in three days, rather than taking weeks.” Keith Souhrada Soyware Development Engineer Big Fish Games
Copyright © 2014 Oracle and/or its affiliates. All rights reserved. |
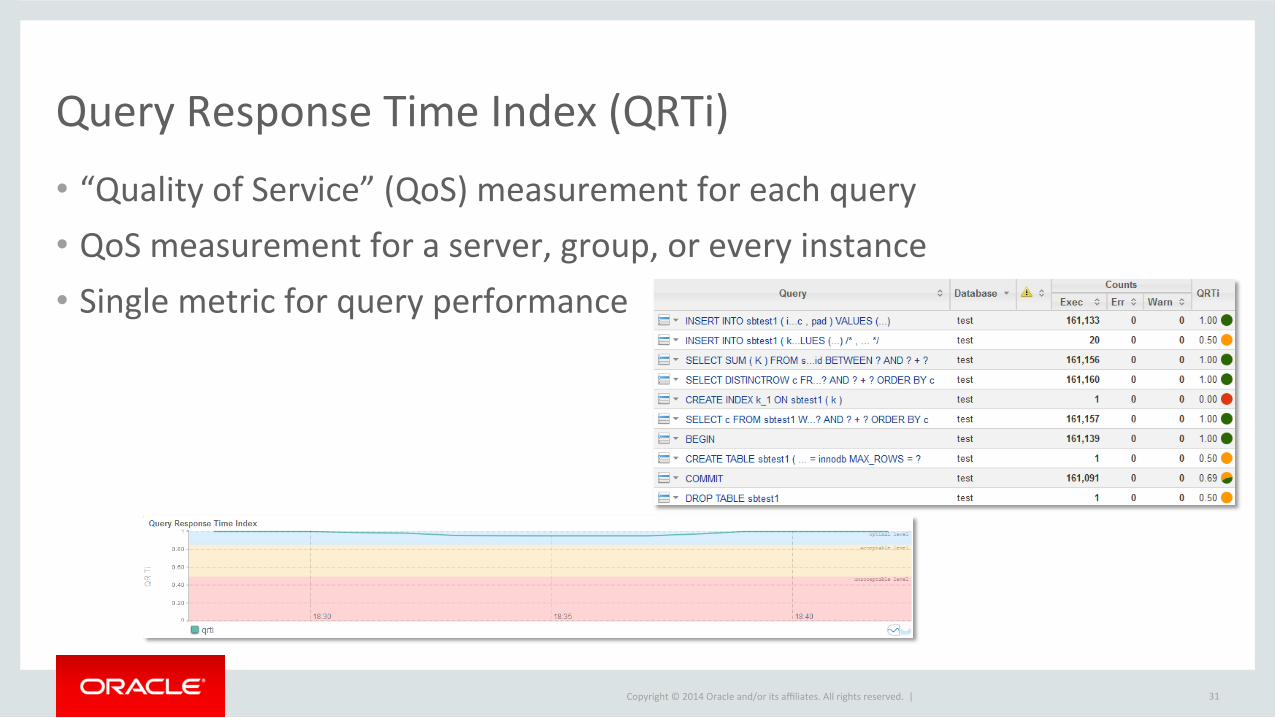
Query Response Time Index (QRTi) • “Quality of Service” (QoS) measurement for each query • QoS measurement for a server, group, or every instance • Single metric for query performance
31
Copyright © 2014 Oracle and/or its affiliates. All rights reserved. |
1 2 3 4
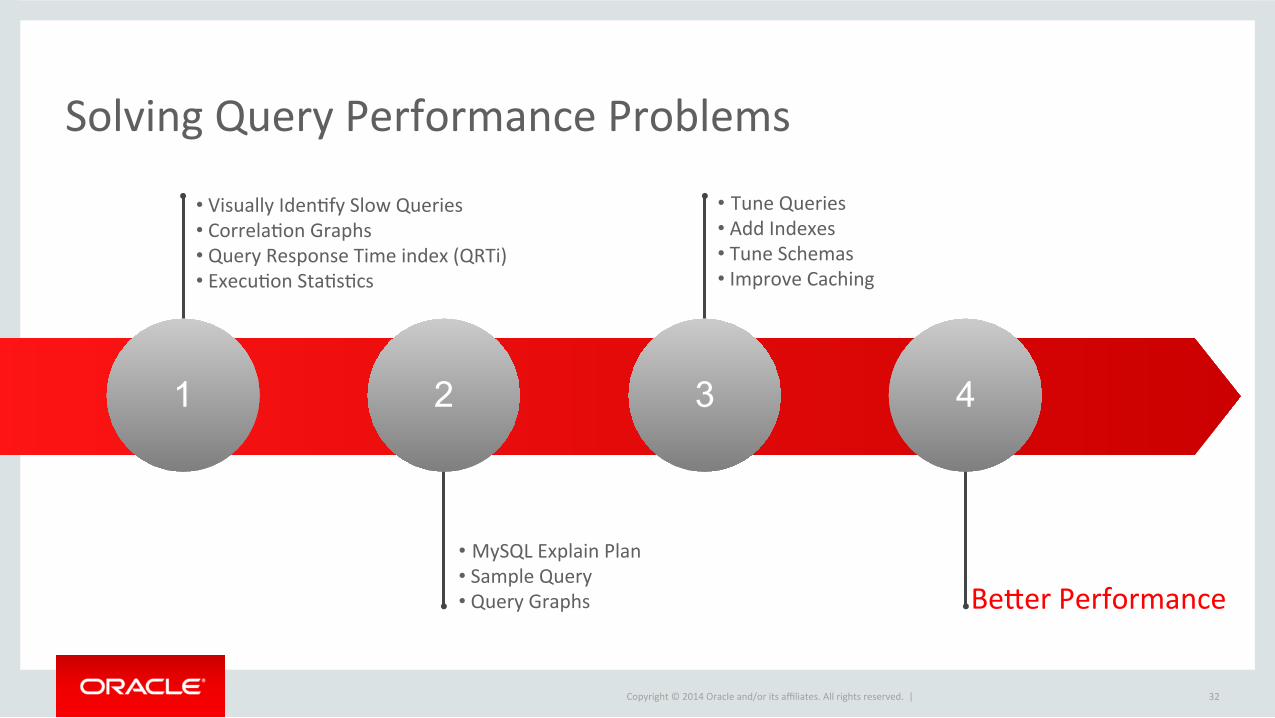
• Visually IdenFfy Slow Queries • CorrelaFon Graphs • Query Response Time index (QRTi) • ExecuFon StaFsFcs
• Tune Queries • Add Indexes • Tune Schemas • Improve Caching
• MySQL Explain Plan • Sample Query • Query Graphs Beqer Performance
Solving Query Performance Problems
32

Copyright © 2014 Oracle and/or its affiliates. All rights reserved. |
Advantages of the Query Analyzer over Slow Query Log
• See query execuFon staFsFcs • Trace the query originaFon back to the applicaFon source code • View the overall query performance over Fme • See when the query was first introduced • See the explain plan • Focus on queries specific to a parFcular host and Fme period • View query execuFons correlated with other performance graphs
33
Copyright © 2014 Oracle and/or its affiliates. All rights reserved. |
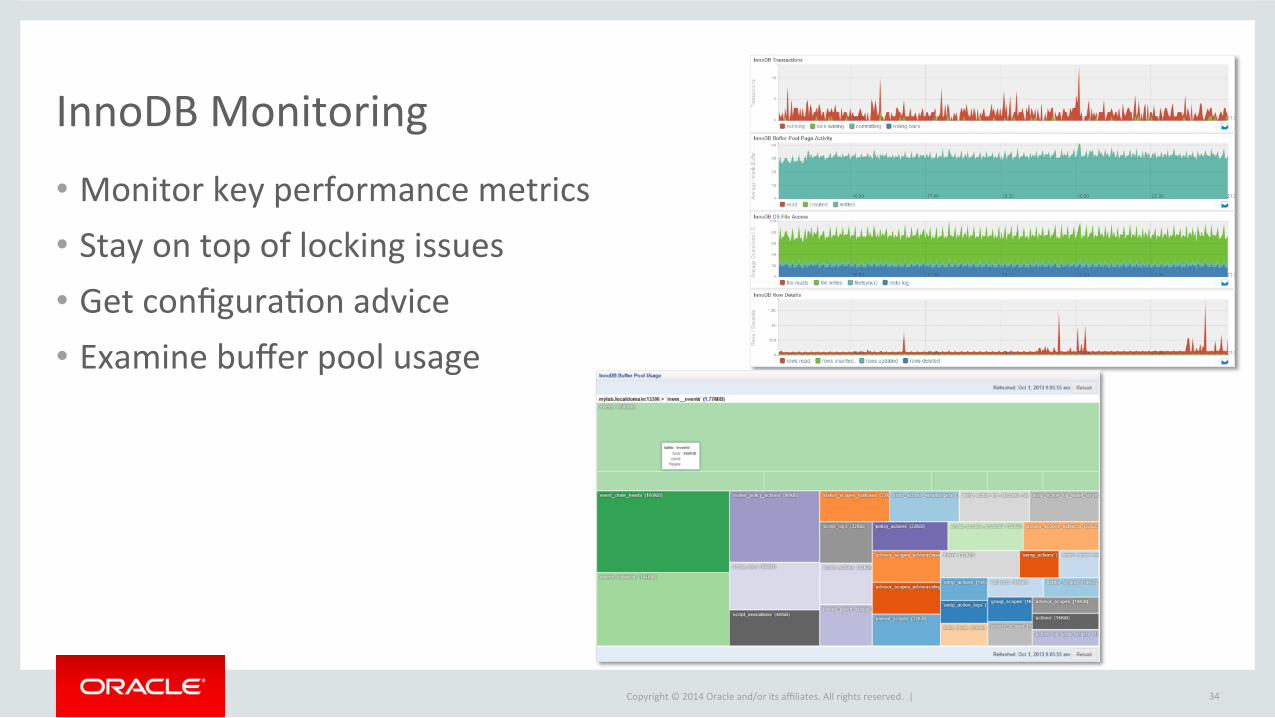
InnoDB Monitoring • Monitor key performance metrics • Stay on top of locking issues • Get configuraFon advice • Examine buffer pool usage
34

Copyright © 2014 Oracle and/or its affiliates. All rights reserved. |
Memory Usage Monitoring • Monitor OS memory usage • Monitor MySQL memory usage • Advice on configuraFon • Alerts on memory usage
35

Copyright © 2014 Oracle and/or its affiliates. All rights reserved. |
ReplicaFon Monitoring • Auto-‐discovers replicaFon topology • Master/Slave performance monitoring • ReplicaFon advisor • Best pracFce replicaFon advice
36
"I use the MySQL Enterprise Monitor every day to monitor and keep tabs on our MySQL databases. Quick one stop shopping for keeping tabs on them.” Wes Homer, Sr System and Network Administrator
Copyright © 2014 Oracle and/or its affiliates. All rights reserved. |
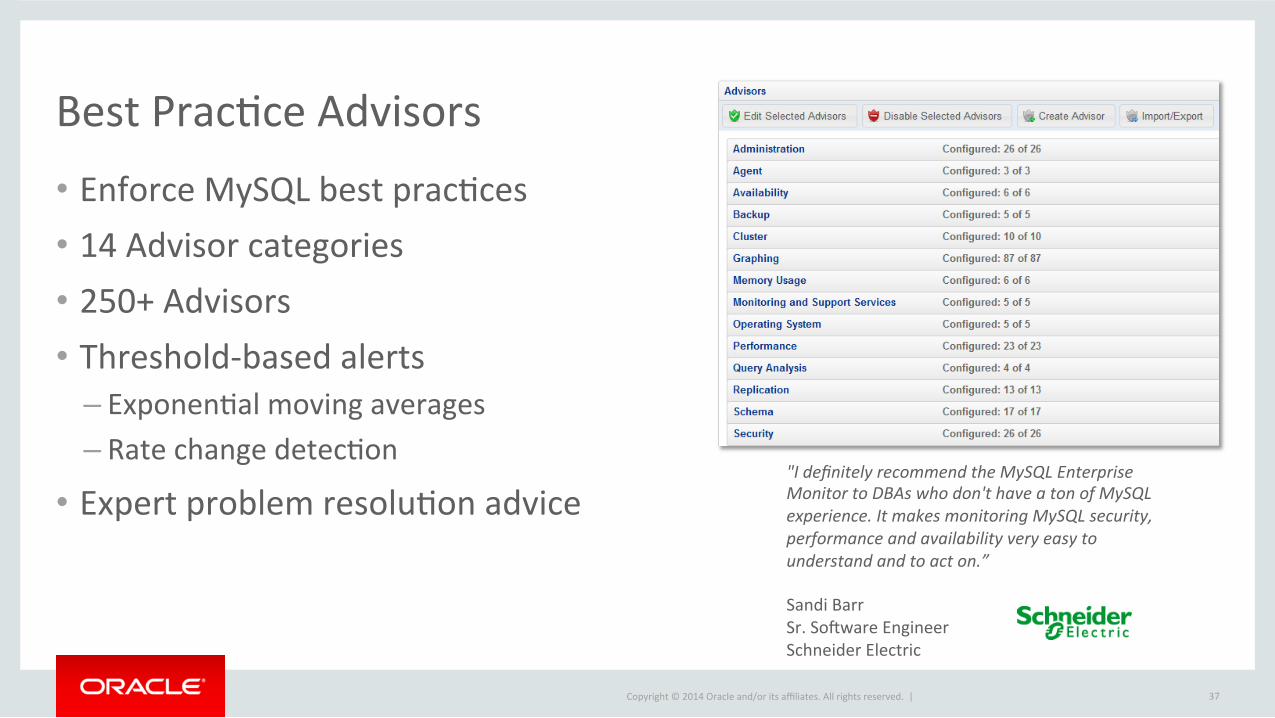
Best PracFce Advisors • Enforce MySQL best pracFces • 14 Advisor categories • 250+ Advisors • Threshold-‐based alerts
– ExponenFal moving averages – Rate change detecFon
• Expert problem resoluFon advice
37
"I definitely recommend the MySQL Enterprise Monitor to DBAs who don't have a ton of MySQL experience. It makes monitoring MySQL security, performance and availability very easy to understand and to act on.” Sandi Barr Sr. Soyware Engineer Schneider Electric
Copyright © 2014 Oracle and/or its affiliates. All rights reserved. |
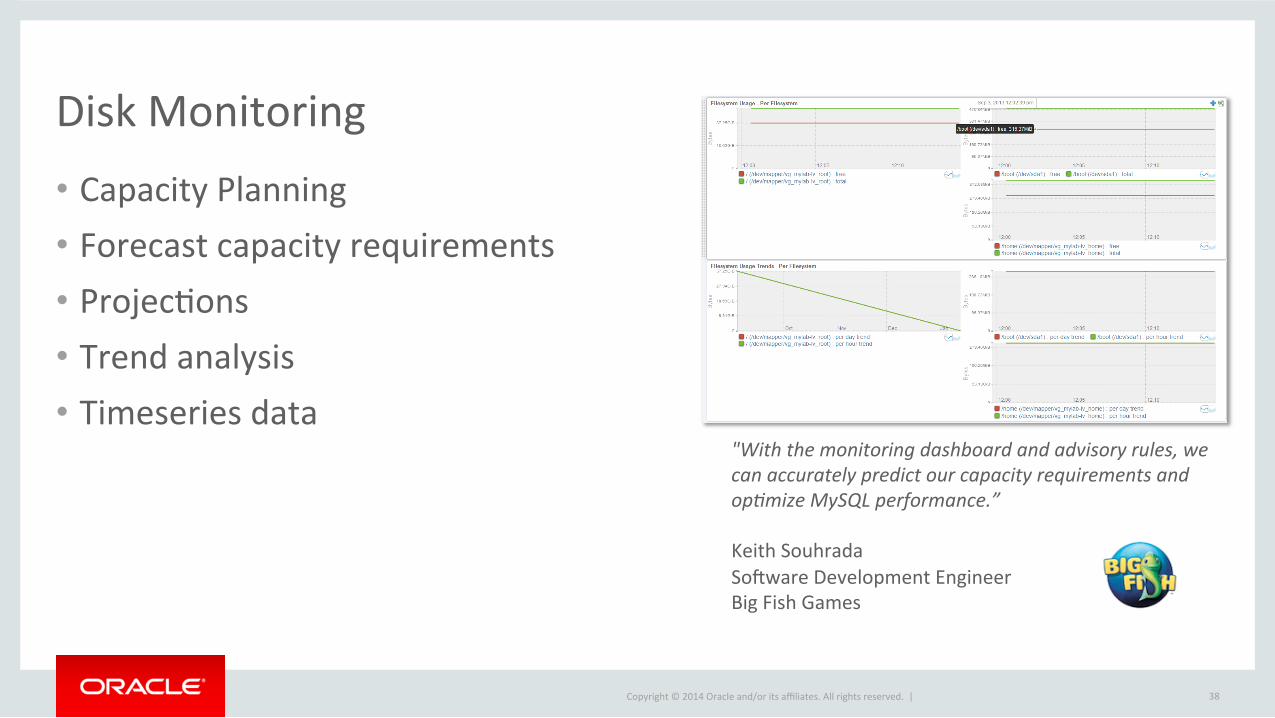
Disk Monitoring • Capacity Planning • Forecast capacity requirements • ProjecFons • Trend analysis • Timeseries data
38
"With the monitoring dashboard and advisory rules, we can accurately predict our capacity requirements and op9mize MySQL performance.” Keith Souhrada Soyware Development Engineer Big Fish Games

Copyright © 2014 Oracle and/or its affiliates. All rights reserved. |
Enterprise Backup Monitoring • Monitor backup results • Monitor backup performance • Ensure backups are up to date
39

Copyright © 2014 Oracle and/or its affiliates. All rights reserved. |
MySQL ConfiguraFon Management • Centralized management • Organized by topic • OpFons grouped by feature • See host details • See network details
40
Advisors will provide configuraFon tuning
advice!
Copyright © 2014 Oracle and/or its affiliates. All rights reserved. |
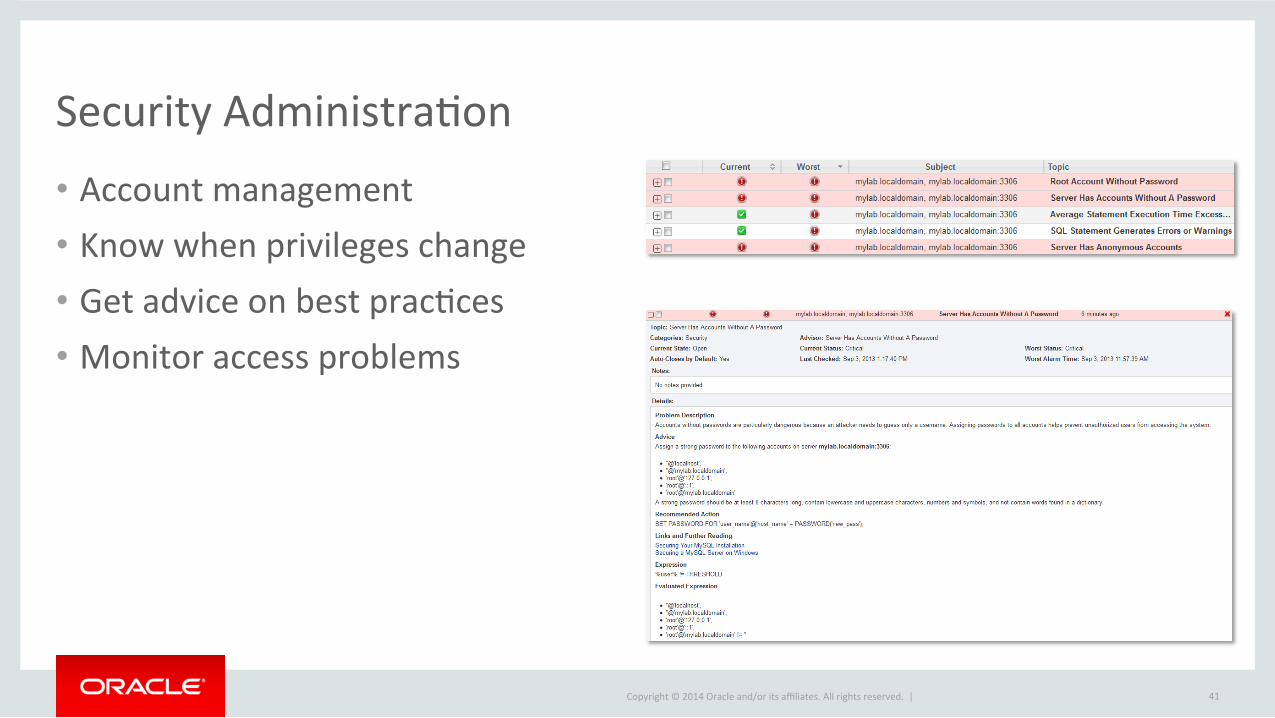
Security AdministraFon • Account management • Know when privileges change • Get advice on best pracFces • Monitor access problems
41
Copyright © 2014 Oracle and/or its affiliates. All rights reserved. |
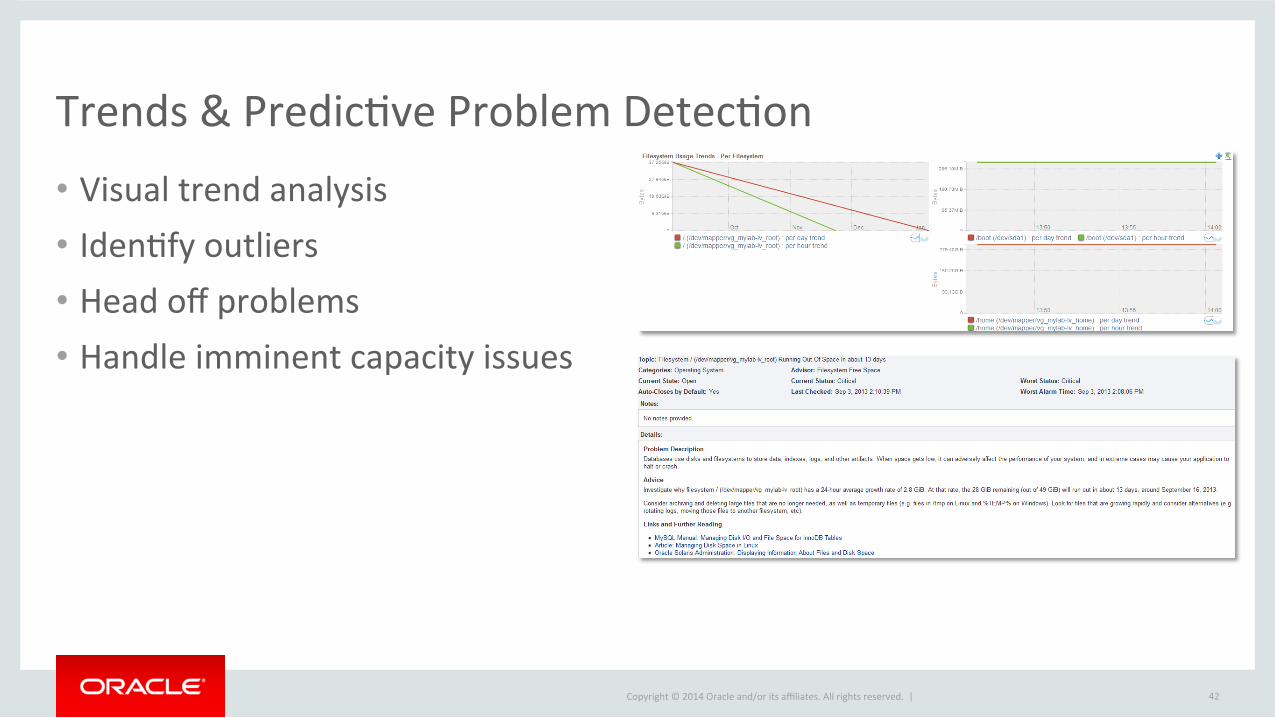
Trends & PredicFve Problem DetecFon • Visual trend analysis • IdenFfy outliers • Head off problems • Handle imminent capacity issues
42
Copyright © 2014 Oracle and/or its affiliates. All rights reserved. |
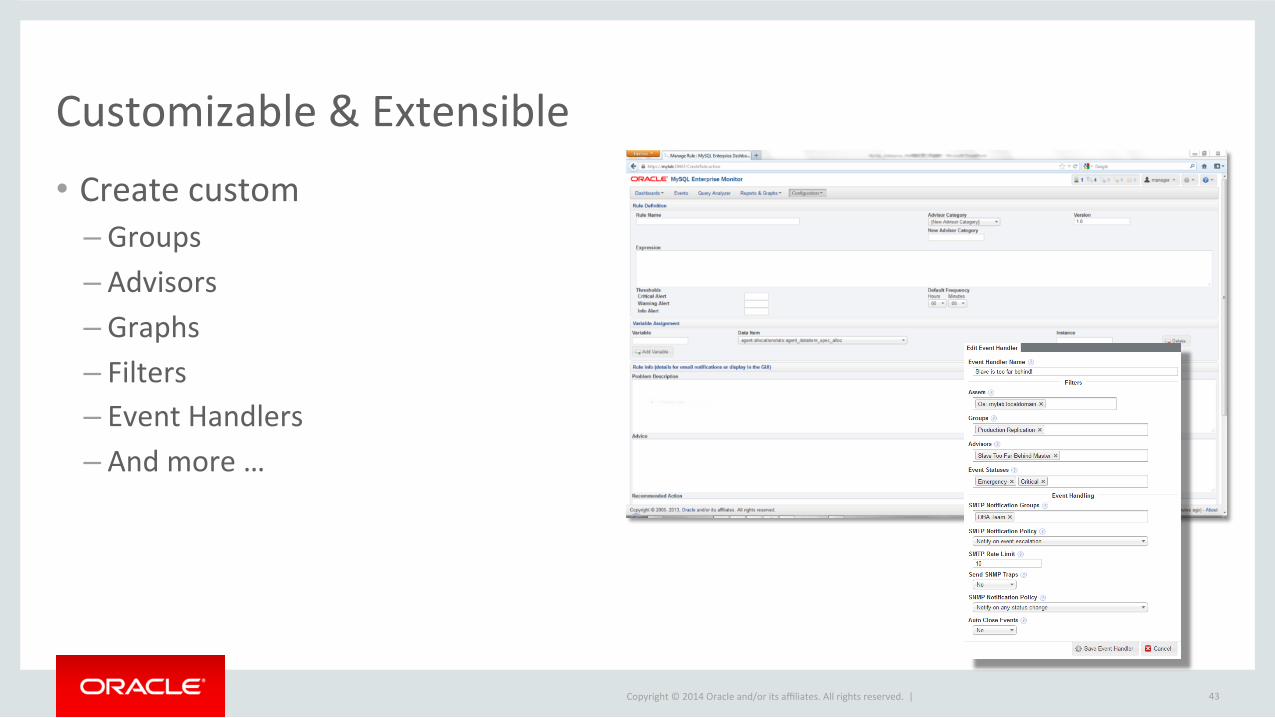
Customizable & Extensible • Create custom
– Groups – Advisors – Graphs – Filters – Event Handlers – And more …
43
Copyright © 2014 Oracle and/or its affiliates. All rights reserved. |
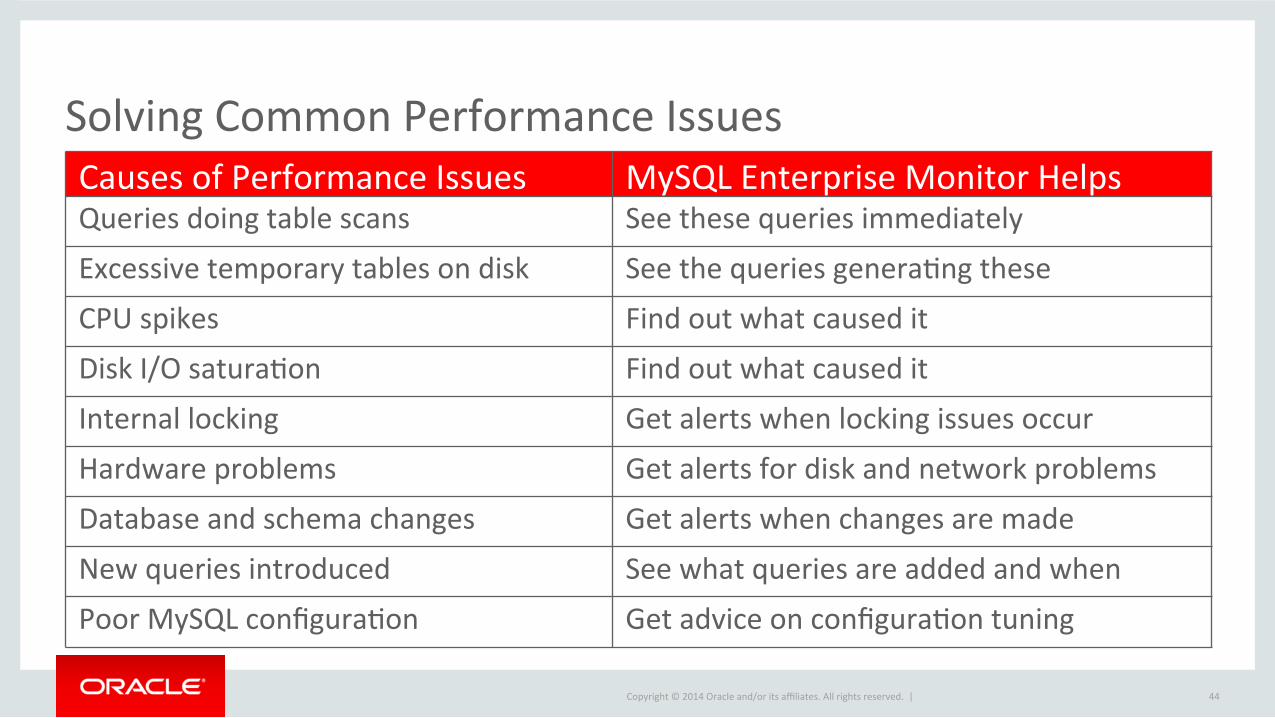
Causes of Performance Issues MySQL Enterprise Monitor Helps Queries doing table scans See these queries immediately Excessive temporary tables on disk See the queries generaFng these CPU spikes Find out what caused it Disk I/O saturaFon Find out what caused it Internal locking Get alerts when locking issues occur Hardware problems Get alerts for disk and network problems Database and schema changes Get alerts when changes are made New queries introduced See what queries are added and when Poor MySQL configuraFon Get advice on configuraFon tuning
Solving Common Performance Issues
44

Copyright © 2014 Oracle and/or its affiliates. All rights reserved. |
✔ IdenFfy the most expensive queries ✔ Full table scans (no indexes) ✔ Excessive temporary tables ✔ Large and/or frequent filesorts ✔ CPU usage overload ✔ Disk I/O saturaFon ✔ Hardware problems ✔ Database and schema changes ✔ New queries introduced ✔ Poor MySQL configuraFon ✔ Internal locking issues
Top 10 Performance Issues Solved
45

Copyright © 2014 Oracle and/or its affiliates. All rights reserved. |
The Boqom Line
Performance • Performance at scale • Monitoring and tuning
Peace of Mind • Insurance • Immediate help if/when needed
TCO • Reduced risk of downFme • Improved ProducFvity
Risks
• Security & regulatory compliance
• Contact with MySQL team
DevOps Agility • Automated scaling & management
• Flexible, real-‐Fme backups
Customer SaFsfacFon • ApplicaFon performance • ApplicaFon upFme
46

Copyright © 2014 Oracle and/or its affiliates. All rights reserved. |
AddiFonal Info & Case Studies
47
Copyright © 2014 Oracle and/or its affiliates. All rights reserved. |
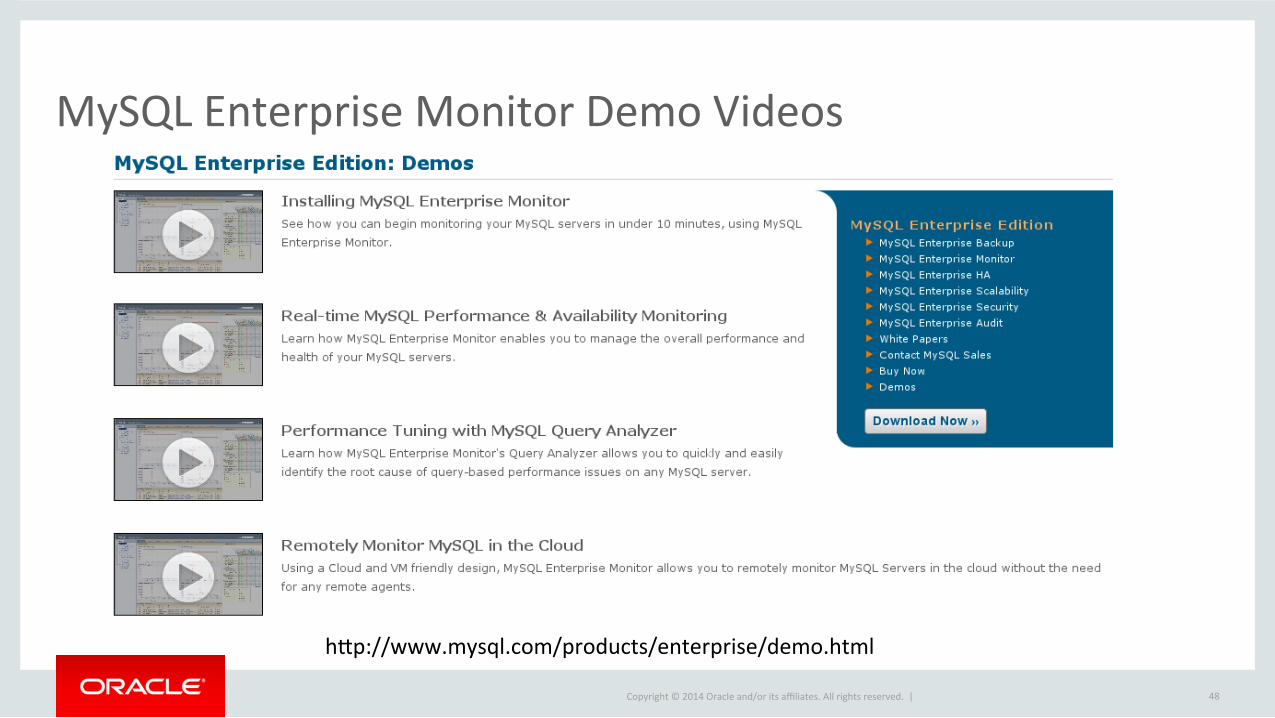
MySQL Enterprise Monitor Demo Videos
48
hqp://www.mysql.com/products/enterprise/demo.html

Copyright © 2014 Oracle and/or its affiliates. All rights reserved. |
Proxy and Aggregator
• hqp://dev.mysql.com/doc/mysql-‐monitor/3.0/en/mem-‐qanal-‐using-‐proxy.html
• hqp://dev.mysql.com/doc/mysql-‐monitor/3.0/en/mem-‐qanal-‐using-‐aggregator.html
49
Copyright © 2014 Oracle and/or its affiliates. All rights reserved. |
Connector Plugins
• hqp://dev.mysql.com/doc/mysql-‐monitor/3.0/en/mem-‐qanal-‐using-‐cj.html
• hqp://dev.mysql.com/doc/mysql-‐monitor/3.0/en/mem-‐qanal-‐using-‐cnet.html
• hqp://dev.mysql.com/doc/mysql-‐monitor/3.0/en/mem-‐qanal-‐using-‐cphp.html
50
Copyright © 2014 Oracle and/or its affiliates. All rights reserved. |
Get Started Today!
MySQL Enterprise EdiFon Trial Contact a MySQL Sales Rep
51
hqp://www.mysql.com/trials/ hqp://www.mysql.com/about/contact/

Copyright © 2014 Oracle and/or its affiliates. All rights reserved. |
Thank You!
52