1
Most promising flexible generators for the wind dominated market
I. Vorushylo1, P. Keatley, NJ Hewitt
Abstract: The intermittent nature of wind power and other forms of variable renewable energy
requires complementary dispatchable flexible generators in order to guarantee the efficient, reliable and
secure operation of electricity systems. The most popular solution to date has been peaking plant,
usually in the form of open-cycle-gas- turbines (OCGT). Energy storage technologies have so far been
considered too expensive, however technology development, as well as challenging renewable targets
could potentially make storage economically viable. Although new advanced flexible combined-cycle
gas turbines (CCGT) have been developed by some manufacturers, they have not yet been investigated
in electricity market models. This paper describes a techno-economic assessment of the most suitable
flexible technologies for the wind-dominated all Ireland electricity market (the Single Electricity
Market (SEM)). The analysis is conducted by considering the impact of a series of policy scenarios
which are compared in an electricity market model. The comparison is quantified using three primary
metrics: technical benefits to the system, economic advantages to the consumer and investment
viability. Modelling results suggest that advanced CCGT and energy storage solutions are the most
advantageous, however they need strong governmental support to attract potential investors and
guarantee deployment in the market.
Key words: energy storage, peaking generators, flexible advanced CCGT, Single Electricity
Market, flexible generators, wind dominated market.
1. Introduction
1 Centre for Sustainable Technologies, School of the Built Environment, Ulster University, United Kingdom BT37 0QB,
[email protected] tel.:+44(0)2890368568 fax: +44(0)2890368239
2
In order to diversify energy supply, reduce greenhouse gas (GHG) emissions and to promote a low-
carbon economy, many countries have implemented challenging targets for integrating variable
renewable energy (VRE) technologies such as wind and solar power into national systems. For
example, the European Union, along with the governments of the United Kingdom, Northern Ireland
and the Republic of Ireland have set ambitious targets both for the reduction of GHG emissions and the
proportion of energy demand to be served by renewable sources. Because it is mature and economically
competitive, and because of the exceptional resources available, onshore wind power is the foremost
VRE technology proposed to meet these targets. The governments of the Republic of Ireland and
Northern Ireland (hereafter Ireland) have committed to serve 40 % of demand with renewable energy in
the all-island Single Electricity Market (SEM) and aim to facilitate the instantaneous penetration of up
to 75% of load by non-synchronous power (NSP) by 2020 (DCNER, 2009), (DETINI, 2010). Given the
near absence of hydro and the relative isolation of the Irish power system, these high targets make it
perfect case study for the investigation of potential for flexible technologies in accommodating high
levels of wind energy.
Integrating such high levels of VRE into a system built predominantly around large baseload
generators has already resulted in significant levels of off-design operation for thermal plant and
curtailment of VRE generation (Market Monitoring Unit, 2010), (Keatley et al, 2013), (Troy, 2010).
The most common solution to the variability management problem to date has been the use of peaking
generators like OCGTs. These have been favoured by investors due to their relatively low capital cost,
flexibility and well-understood construction and operating processes. OCGTs are the only flexible
generation technology which is expected to join the market by 2023, according to the latest Generation
Capacity Statement report (Eirgrid, SONI, 2014). However, the high operating costs, low efficiency
and consequently high GHG emissions of OCGTs have prompted the consideration of alternative, more
efficient and less polluting forms of variability management for the future.
Recently, leading producers of thermal plant have announced the development of new advanced
CCGTs, which are expected to be fast, flexible and highly efficient in cyclic operation. These units,
3
designed to meet the need for flexible dispatchable generation in high VRE-penetration scenarios, will
be available for the commercial deployment from 2015 (Probert, 2011). However, no installations of
such generators have as yet been proposed or investigated for the SEM.
Grid-scale energy storage has also been proposed as a means to manage the increased variability of
net load when high levels of non-dispatchable VRE are integrated into power systems (Edmunds et al,
2014), (Heide et al, 2011). Until now the main barriers to more widespread deployment of energy
storage systems have been their high capital costs and, in the case of grid-scale systems such as pumped
hydro and compressed-air energy storage, specific geographical requirements.
Previous studies on the deployment of centralised energy storage systems in the SEM concluded that
there were potentially significant benefits in terms of reduced wind curtailments (Mullane, 2009),
carbon emissions and spot prices, and increased security of supply. Connolly (Connolly et al, 2010)
indicated highly favourable geographical sites for the building of pumped hydro systems, whilst the
Triassic bedded salt formations in the north east of Ireland are promising for construction of
compressed air energy storage (CAES) (Evans et al, 2006). Nyamdash et al. concluded that energy
storage systems become viable options only with a great uncertainty in the system, e.g. wind power
penetration of 50 % and higher (Nyamdash et al, 2010). High capital costs are expressed as the major
barrier for energy storage technologies installations in a number of studies (Connolly et al, 2012),
(Foley, Díaz Loberaa, 2013), (O’Donnell, 2009), (Foley et al, 2015), (Tuohy, 2011).
Demand side response is another option to manage wind variability, which includes a wide range of
possible solutions, owned and managed by final consumers. Demand side electric or thermal energy
storage, smart meters and electric vehicles are among the most popular solutions being discussed in the
scientific literature today. Implementation of demand response is not considered in this paper as it is a
discrete area of research, which requires separate analysis, including the impact of human behaviour on
the use and operation of demand-side technologies. This paper considers the requirement for optimal
flexibility from the market point of view, although the potential contribution of demand side response
replicates that oflarge scale energy storage as they have the same aim; to shift energy demand from
4
periods of low electricity prices or high wind availability to periods of high prices and low wind
availability.
It is evident that selecting the optimal solution to the variability management problem is not a
straightforward process. Different studies give different answers to the question of the most technically
and economically efficient options. The primary goal of this paper therefore is to make a comparative
analysis of the most appropriate technologies to be deployed in the SEM, in terms of technical
advantages for the system, financial viability for the investor and economic benefits for the consumer.
The research for this paper arose from the SPIRE (Storage Platform for Integration of Renewable
Energy) project, which aims to quantify the potential for energy storage in the SEM. Analysis of
historical electricity market operation shows that regulatory framework, market factors and operating
characteristics have a significant impact on the profitability and overall viability of any generating unit.
Analysis is therefore based on a model of the SEM developed with Plexos electricity market simulation
software, which evaluates which flexible units (OCGT, CCGT or storage) are most likely to be
scheduled to maintain system security and complement VRE, and to assess their potential profitability
and consequent investment viability.
The modelling is focused on two time horizons: 2020 (with a renewable energy target of 40 %
(DCNER, 2009), (DETINI, 2010)) and 2030. As government targets for VRE generation have not yet
been established for post-2020, 2030 is used as an indicative timeframe with two scenarios for
renewable energy penetration, reflecting high and low levels of progress with respectively 45 % and 52
% of electrical energy demand served by VRE as assumed by the SEM committee in its studies (SEM
Committee, 2014).
Future market scenarios are developed from an extensive review of policy literature regarding SEM
development, and possible alternative scenarios are suggested by the authors.
2. Modelling methodology
5
2.1 Market model
In order to analyse and compare the technical and economic characteristics of different flexible
generators it is necessary to create a market model which is able to replicate SEM trading arrangements
and is flexible enough to simulate a range of scenarios and market strategies. Plexos software was
chosen for the design and simulation of the SEM model. This is one of the leading simulation tools for
modelling aspects of electricity markets including investment planning, risk assessment, energy storage
optimisation, electricity price forecasting and others (Energy Exemplar, 2010), (Bianco et al, 2015).
The regulatory authorities of the SEM utilise Plexos for the market performance simulation and
assessment, and investigation of market operation strategies (CER, NIAUR, 2012).
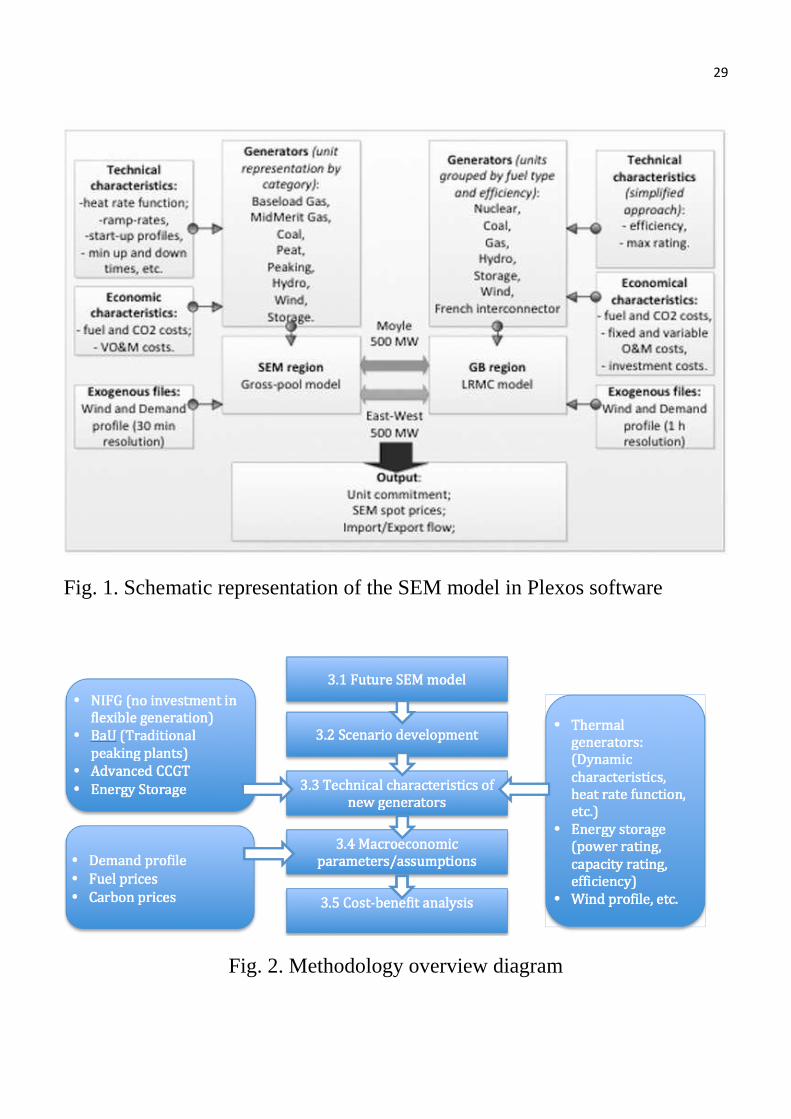
A schematic representation of the SEM model in Plexos is presented in Figure 1. The SEM is a
mandatory gross pool market with two interconnection links to the Great Britain market with a total
capacity of 1 GW. The Plexos model of the SEM therefore consists of the two regions: the SEM and
GB markets, connected by two links representing the Moyle and East-West interconnectors. The SEM
region is simulated with a detailed representation of all available generation units in the market in order
to replicate spot price settlement, while the GB region has a simplified structure in order to reflect only
import to and export from the SEM. Under current SEM market rules, all generators submit complex
bids into the market which reflect short-run marginal costs (fuel and carbon costs, variable operational
and maintenance costs) and exclude any fixed costs or profit components (CER, NIAUR, 2011). Spot
price is based on an unconstrained market and is defined by the costs of the marginal unit that meets
system demand for every half hour period. Spot price and unit commitment is defined by chronological
market optimisation using a mixed integer algorithm based on the economic and technical
characteristics of individual power plants. The objective function is total system costs minimisation.
The GB region is represented by a generation stack model, where all power generators are grouped
by fuel type and efficiency characteristics. The GB market price is optimised separately with
6
implementation of a long-run-marginal cost (LRMC) model where capital, fixed operational costs and
profit components are allocated during the year in proportion to the available capacity margin (higher
for the periods with a relatively tight capacity margin and lower for periods with excess capacity).
2.2 Model validation
The Plexos model was validated against historical data in order to ensure that it accurately reflects
the conceptual market operation and is able to fulfil research objectives.
Validation was performed by comparing the historical outcomes of the real market with the results
for the Plexos SEM model for the period January 2008 – October 2009. All model input parameters
(available generators, their technical characteristics, variable operational and maintenance costs
(VO&M), demand profile, wind power output, etc.) were drawn from historical data (CER, NIAUR,
2012). Spot fuel prices were the same as those used by the Regulatory Authorities (RAs) for market
monitoring (Platts, n.d.).
The objective function of the Plexos model is minimisation of the total system costs, which
represents all costs required to meet system demand. Comparison of this model output with historic
figures reflects how well market simulation was performed.
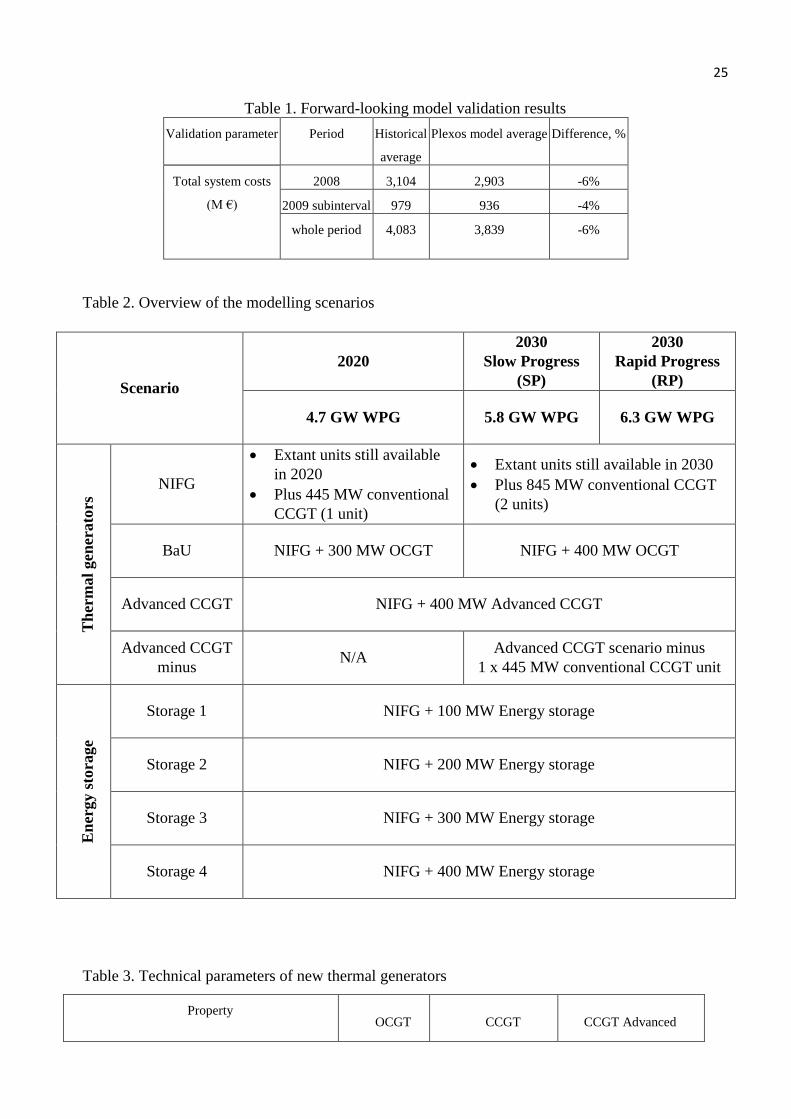
Plexos simulation outcomes (Table 1) fall within acceptable deviations from the historical data. The
total energy market value is underestimated for around 6 % for 2008 and 4 % for 2009. Validation tests
show that the Plexos model provides an accurate representation of SEM.
3. Future SEM market model
7
The construction and validation of the current SEM model was presented in the previous section.
The modelling methodology for the future SEM model follows the steps presented in Figure 2 and is
described in the section below.
3.1 Future SEM operation
At the moment, the SEM operates as a mandatory pool with central dispatch and ex-post final
settlement. However, in order to comply with European legislation, the SEM has to implement
substantial changes in market design in order to adhere with the European Target Model (SEM
Committee, 2014). These rules will require national markets to conform to certain criteria for a range of
time horizons (forward, day-ahead, intraday) in order to build a functioning internal European energy
market. In the case of the SEM, whose costs are settled on an ex-post basis, it will be necessary to
establish market trading in line with the new timeframes.
The final modifications to the SEM design have not yet been decided or implemented, however
changes must be in force by the end of 2017. In the interim, the SEM Committee has proposed a
Mandatory Centralised Market structure for Day-Ahead, Intra-day and Balancing Markets. It also
proposes to keep capacity remuneration mechanism (CRM) (SEM Committee, 2014). It is intended that
the proposed market design will retain the strength of the current SEM and more closely aligns it with
the EU Target model. However, given the major uncertainties surrounding the new market
arrangements, the modelling for this study will reflect the most efficient operation of the current unit-
based, gross-pool structure.
The real efficiency of the future SEM will depend on many factors including the bidding strategy of
market participants, level of competition and market liquidity. It should be recognised that objectively
estimating and modelling the influence of such factors is difficult in long-term modelling. In order to
reflect harmonization in trading with neighbouring markets, simulations incorporate unconstrained
interconnector operation. This means that the full capacity of interconnectors is available all the time,
8
and import/export flow is based on price arbitrage between neighbouring markets. In contrast, efficient
interconnector trading between the SEM and GB has historically been significantly restricted by
various market factors (Vorushylo Lytvyn, Hewitt, 2013). The authors’ modelling approach reflects
optimal SEM operation and the most efficient utilization of interconnection capacity.
3.2 Scenario development
The wind power scenario for the 2020 market reflects government targets to achieve 40 % of
electricity demand from renewable energy, which requires an estimated 4700 MW of wind capacity.
Renewable energy targets for the 2030 market are not established yet, therefore assumptions are made
to reflect rapid and slow progress in renewable energy deployment, in line with the projections of the
SEM committee which assumes 52% and 48% penetration of renewable energy by 2030 (SEM
Committee, 2014).
As previously mentioned, thermal generators are the current investment preference, and there are no
firm plans for investment in storage. Two future market modelling categories have been developed:
“Thermal Generators” and an alternative “Energy Storage” group of scenarios.
According to the latest transmission system operators’ (TSO) report, three new OCGT units (with a
total capacity of circa 300 MW) and two additional CCGTs (with a projected capacity of 450 MW and
431 MW each) have signed connection agreements (Eirgrid, SONI, 2014). However, the TSOs expect
that only part of this total capacity will be commissioned. Therefore only one 445 MW CCGT and one
98 MW OCGT are included in the generation fleet for 2023 (Eirgrid, SONI, 2014).
Four “Thermal Generators” scenarios were developed, incorporating new OCGTs and CCGTs
ranked by technology type and likelihood of realisation:
- The NIFG (no investments in flexible generation) model – consists of all current generation
units still available in 2020 and 2030 respectively, new renewable energy generators, plus
9
one new conventional CCGT unit by 2020 and one further conventional CCGT unit by 2030
in order to maintain capacity margins. This model does not consider any further investments
in any flexible type of generation.
- BaU (business as usual) model – includes the portfolio of the NIFG model plus new OCGT
units with a total installed capacity of 300 MW by 2020 and 400 MW by 2030. This
scenario reflects the TSOs’ current assumptions, suggesting that new OCGT units will be
deployed to address variability management.
- Advanced CCGT model – this model consists of the generation portfolio of the NIFG model
plus one additional CCGT unit, with operating characteristics which represent flexible
advanced CCGT technology.
- Advanced CCGT model reduced – this model is developed for the 2030 market only. It aims
to investigate whether the advanced CCGT generator is able to fulfil the requirements of
both the new conventional CCGT and new OCGT generators. This portfolio comprises only
one new conventional CCGT (instead of two) and one advanced CCGT unit.
Increasing levels of both consumer demand and VRE capacity, combined with the retirement of
older thermal plant, will necessitate the deployment of flexible generators in order to guarantee security
of supply. Because a substantial proportion of plant retirements by 2030 will comprise existing peaking
plants, the NIFG scenario is highly unlikely to be realized by 2030. It is therefore presented for
indicative purposes only. To make the 2030 scenarios more directly comparable with each other,
installed capacities for new generators are slightly modified: installed capacity for new OCGT units is
100 MW (instead of 98 MW); installed capacities for the second conventional CCGT unit and the
advanced CCGT unit are 400 MW each (instead of 440 MW and 500 MW respectively).
The “Energy Storage” group of scenarios considers the deployment of energy storage systems as an
alternative to conventional generation. Four scenarios assess the market performance of 100 MW to
400 MW of new energy storage technologies.
10
All scenarios are also split into two subcategories in 2030 representing rapid and slow progress in
renewable energy deployment beyond 2020. Generation portfolios for developed scenarios are
summarized in table 2.
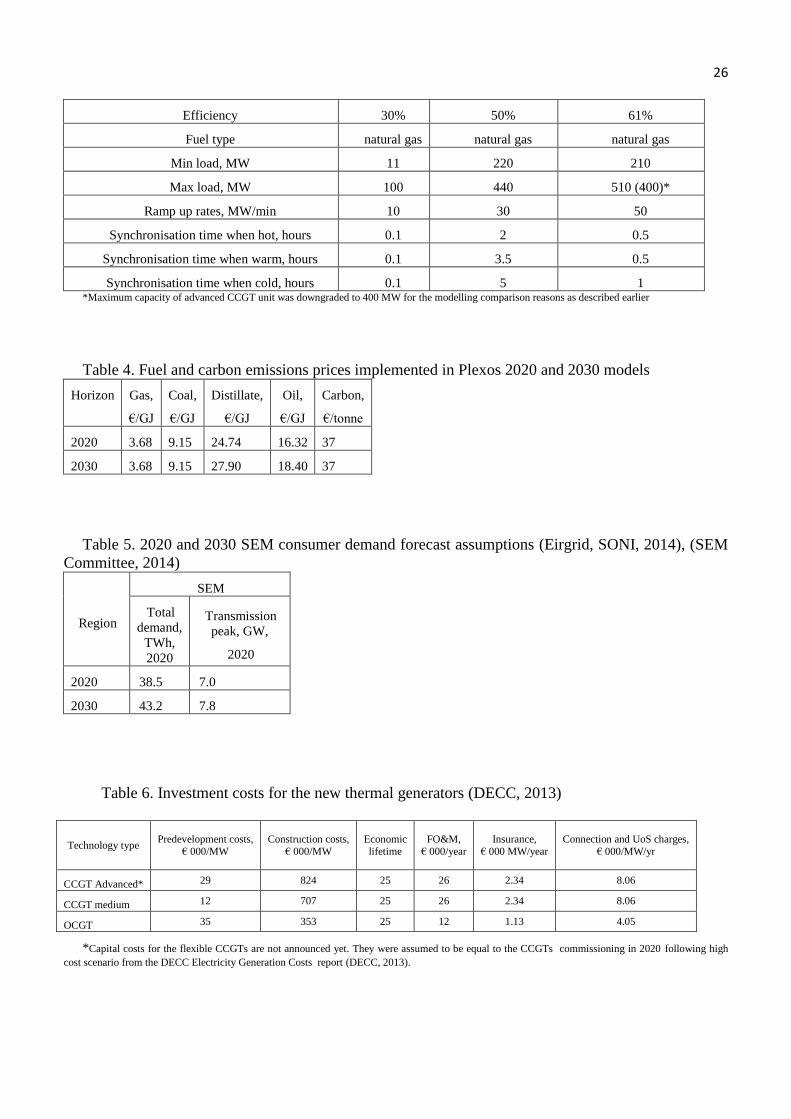
3.3 Technical characteristics of new generators
The technical characteristics of new thermal generators are presented in Table 3. Characteristics of
new CCGT and OCGT units are based on the operational parameters of typical modern generators and
recently installed units in the SEM (CER, NIAUR, 2012).
The Advanced CCGT plant characteristics are based on the General Electric Flexi50 CCGT model
(General Electric, 2011). The leading producers of power generation technologies have developed
flexible CCGT units with fuel efficiency exceeding 60 % and response times which complement wind
generation dynamics. For example, Alstom’s KA26 model claims to achieve 350 MW output within 15
minutes, while the FlexEfficiency50 model from General Electric can ramp its output rate at 50
MW/min (Hummel et al, 2013), (Probert, 2011).
Energy storage technologies are characterised by four main parameters: power rating, storage rating,
time response and efficiency. Power rating varies between 100 MW and 400 MW in increments of 100
MW. Assumed power ratings are equivalent to the installed capacities of other flexible technologies
implemented in the “Thermal Generators” scenarios. Energy rating is assumed to be 4 GWh in all
storage scenarios, which is enough to provide 10 h of operation for a 400 MW unit and 40 h for a 100
MW unit. Storage efficiency of 75% is based on an average value for large-scale application
characteristics. Typical time response ratings for most storage applications are of the order of several
minutes. Due to the 30 minutes resolution in the SEM, this characteristic does not influence unit
commitment decisions and is therefore omitted in the Plexos model.
11
Particular storage technologies are not selected at this stage. Technology neutrality for initial
modelling allows for the optimization of capacity. Technology selection is performed later via cost-
benefit analysis based on capital cost requirements and profitability assessment.
Wind energy is included through an externally produced profile. In order to capture the spatial and
temporal resolution of wind power, it has been produced by the linear extrapolation of the 2008
regional wind profile (CER, NIAUR, 2012), taking into account future wind energy targets (40 % for
2020, 48% for SP and 52 % for RP scenarios) and regional wind constraints (EirGrid, SONI, 2014),
(Gariggle et al, 2013). The wind power profile is presented at one hour time resolution.
Other renewable technologies (e.g. solar PV, private wind turbine, small-scale combined heat and
power and hydro power stations) are expected to deliver relatively insignificant contributions towards
future renewable targets in comparison with wind power. They are induced into the model as embedded
generation (negative demand) and produced by linear extrapolation of current profile into their future
projections (Eirgrid, SONI, 2015).
3.4 Macroeconomic parameters/assumptions
The following macroeconomic parameters have been utilised in the Plexos model for future market
operation;Fuel and carbon prices are based on a DECC central fuel price assumptions and are presented
in Table 4 (DECC, 2013).
SEM demand is based on quadratic extrapolation of historic system demand on system operators’
projections for 2020 and 2030 (EirGrid, SONI, 2014), (SEM Committee, 2014), and is presented in
table 5.
The GB market portfolio for 2020 and 2030 is based on the National Grid UK Future Energy
scenarios (National Grid, 2014). Also, the 2030 market, similar to the SEM model, develops Rapid and
12
Slow Progress scenarios based on “Gone Green” and “Slow Progression” scenarios of National Grid
respectively (National Grid, 2014). The key assumption regarding the GB future market generation
profile is that, as with the situation in the SEM, renewable energy targets will be achieved, with the
installation of circa 26.3 GW of wind energy by 2020. For the 2030 market Rapid Progress is assumed
to result in 28% of energy demand served by VRE and Slow Progress by a 23 % contribution from
renewables.
3.5 Cost-benefit analysis
The last stage of the proposed methodology is a cost-benefit analysis of future flexible generators in
the wind-dominated SEM. It is based on a comparison of the costs of building and operating flexible
generators, with the potential advantages of technology profitability and socio-economic benefits to
energy market consumers. Potential technology profitability and socio-economic benefits will be
derived from the simulation and represents profits frominfra-marginal rent (the difference between spot
and bid prices) on a yearly basis.
The annualised costs of building and operating flexible generators are defined by the following
formula:
Yearly charges =c×i(1+i)Y
(1+i)Y−1+ FO&𝑀, (1)
Where c = capital costs estimation; Y = economic life of the project; i = hurdle rates (assumed 7.8 %
in accordance with (DECC, 2013)), FO&𝑀 = fixed operational and maintenance costs.
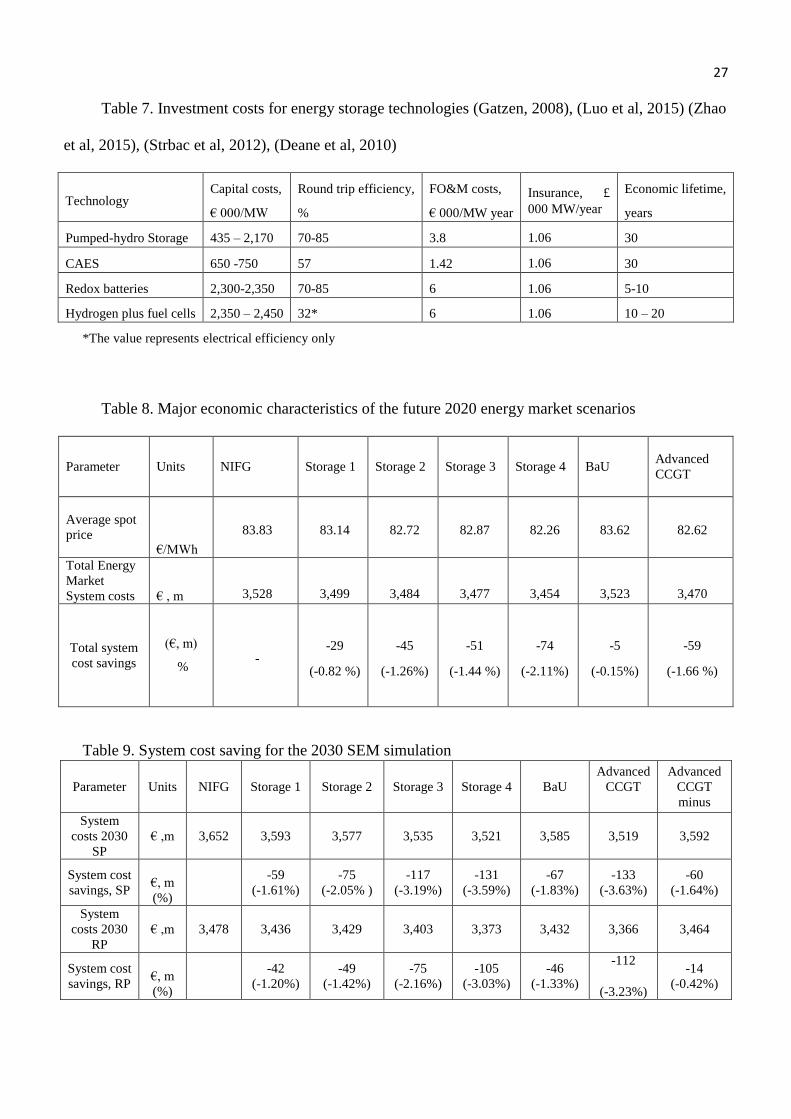
Assumptions of the total capital and recurring costs of new flexible generators are presented in
tables 6 and 7.
Investment costs for energy storage technologies vary considerably. Investment requirements used in
this study consider the most technically mature types of solutions (table 7) (Gatzen, 2008), (Xi. Luo et
al, 2015), (Zhao et al, 2015), (Strbac et al, 2012), (Deane et al 2010).
13
To summarize, the market model developed in this section aims to represent a future wind-
dominated SEM under the following conditions;
without any additional flexible generators (“NFIG” model),
with peaking generators (“BaU” model),
with the introduction of advanced flexible CCGT solutions (“Advanced CCGT” and
“Advanced CCGT minus” models)
Energy Storage models 1 – 4 (100, 200, 300 and 400 MW capacity)
Technical, economical and investment analysis of modelling results for these scenarios gives us a
picture of the optimal flexible solution for the wind dominated SEM.
4 Modelling results
The final modelling results have been divided into four main categories:
- Technical benefits for the operation of baseload units;
- Economic advantages for consumers;
- Cost-benefit analysis of new flexible generation;
- Sensitivity analysis.
4.1 Technical benefits for the operation of the future SEM
This section focuses on the potential future impact of wind power on baseload generation and how
new flexible technologies are capable of maintaining system stability.
The modelling results suggest that levels of energy generated by baseload and mid-merit generators
will be significantly reduced in comparison with current levels. Their generation is displaced by wind
14
power with the support of new and existing peaking generators. Moreover, despite a reduction in
energy generation by baseload and midmerit units, their operational response is considerably increased,
while the increasing installation of flexible generation capacity reduces this impact. Increasing numbers
of start-ups for base-load units are directly related to increased maintenance costs (Keatley et al 2013).
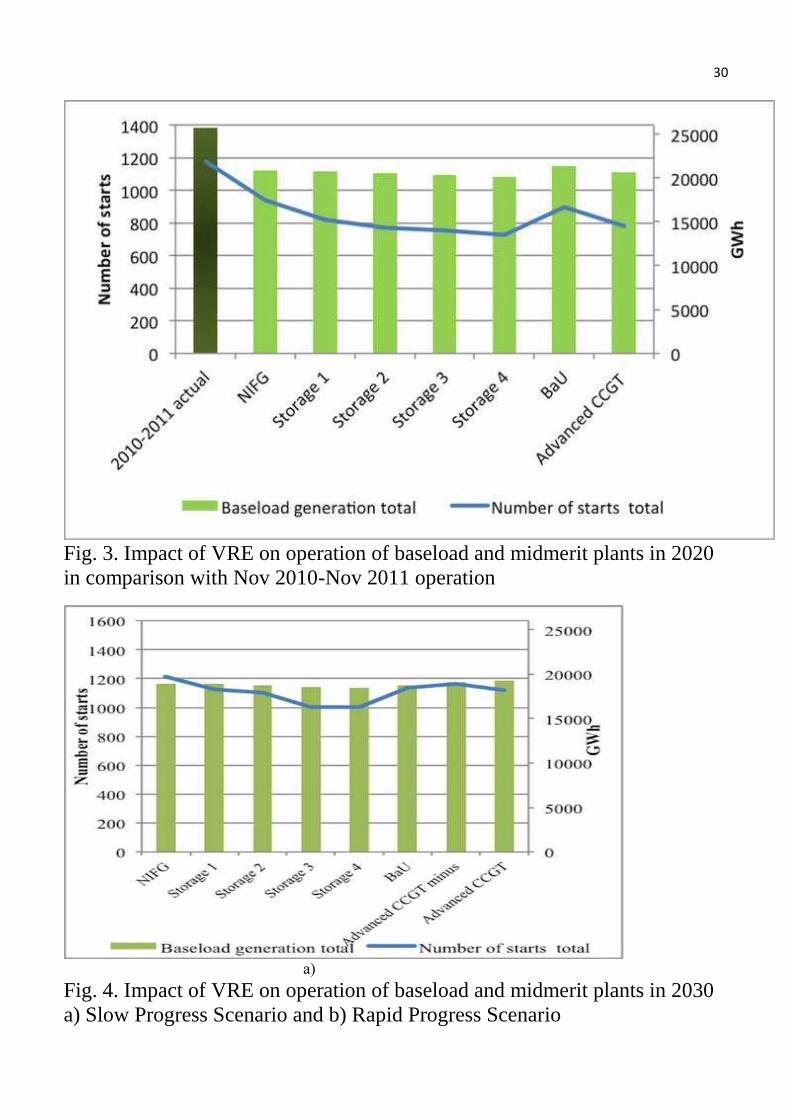
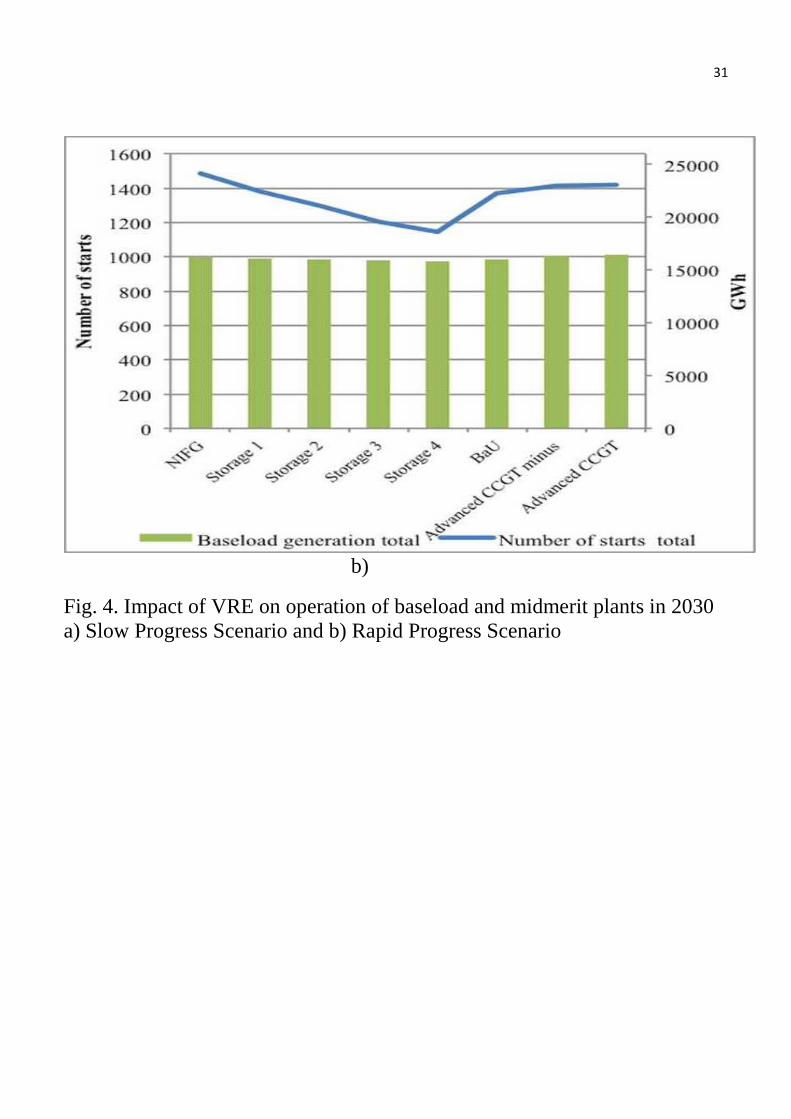
Fig. 3 compares energy generation and number of start-ups for existing baseload and midmerit gas and
coal generators in 2020 with figures from November 2010 – November 2011.
Fig. 3 shows that Energy Storage 4 model results in the lowest level of start-ups for large thermal
power plants. Identical results are obtained for the 2030 models with increased further contribution
from VRE (fig. 4): total energy generation by baseload and mid-merit generators is further reduced,
while their numbers of start-ups increase.
Deployment of 300MW - 400 MW of energy storage significantly diminishes the impact of VRE on
the cyclic operation of baseload generators, demonstrating considerably better results than other
flexible technologies. The Advanced CCGT unit is the least advantageous solution among flexible
generators from this point of view.
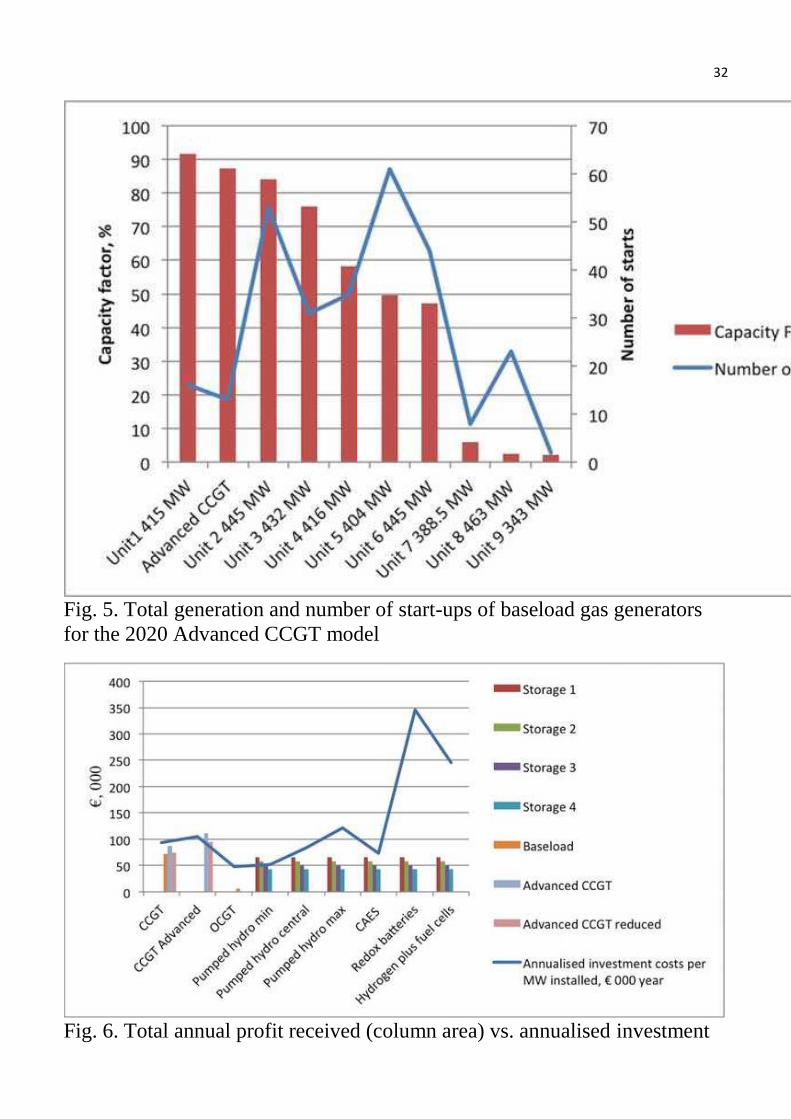
It is critical to note however, that because the market operation schedule is based, first of all, on
economic principles (merit order), the most efficient generators are scheduled for baseload generation,
regardless of their flexibility. Therefore, less flexible and efficient generators are utilised for the system
flexible response requirements. Fig. 5 shows that because of its high fuel efficiency, the Advanced
CCGT unit has one of the highest energy generation rates and among the lowest number of start-ups
compared to other generators.
It should also be noted that scheduling optimization is based on an unconstrained approach which
results in the most efficient market schedule notwithstanding transmission constraints and system
reserve requirements. Transmission constraints in real market operation can influence the decision to
run less efficient generators, sometimes even on a constant, baseload basis. This leads to a decrease in
15
overall system flexibility, sub-optimal cycling of other units, increased numbers of start-ups and
ramping duty of other generators, as well as wind power curtailments.
It can be concluded that an efficient 2020 market requires the support of flexible generators from a
technical point of view. The Energy Storage models examined potentially deliver the greatest
advantage in comparison with other flexible solutions by decreasing the level of cycling of baseload
and mid-merit generators. In order to minimise the negative impact of VRE on the operation of
baseload generators, appropriate market mechanisms should be investigated and developed in order to
encourage flexibility in the market.
4.2 Economic advantages to the electricity market consumers
The economic characteristics of future market operation under the proposed scenarios for one full
year of operation are presented in tables 8 and 9. As stated in the methodology, the model design
reflects perfect market operation. Therefore, the economic results presented in this section should not
be regarded as absolute or predictive, but considered as indicative, relative values to allow comparison
of different scenarios. Also, as the model validation section shows, modelling results incorporate some
level of uncertainty, however, as the main aim of this section is to compare scenarios for the same
market model with the same assumptions applied, these uncertainties are omitted from the analysis
presented below.
As can be seen from Table 8, all flexible solutions bring benefits to the operation of a future wind
dominated market, however the Energy Storage 4 model is the most economically advantageous with
circa 2.11 % or 74 € m of total system cost savings when compared with the NIFG Model. The BaU
Model is less advantageous, providing only 0.15 % or 5 € m savings, although it should be noted that
this scenario proposes only 300 MW of new OCGT capacity, 100 MW lower than for the Energy
Storage 4 or the Advanced CCGT scenarios. Additional runs of the BaU model with 400 MW OCGT
16
showed total system cost savings of only 1 € m confirming that the BaU model is economically the
least advantageous solution.
With an increased share of VRE (2030 models, Table 9) the BaU model with the OCGTs remains
the least beneficial scenario, while the Advanced CCGT model demonstrates the best results from an
economic perspective. The best of the energy storage scenarios was the Energy Storage 4 model,
which demonstrates total system costs savings which are 0.4 % and 0.20 % lower than the Advanced
CCGT model for the Slow and Rapid Progress scenarios respectively.
The economic benefits of the Advanced CCGT model (as shown in the technical analysis section),
are mostly achieved by displacing less fuel-efficient baseload generation, whilst its flexibility attributes
are not used extensively. Thus, the Advanced CCGT reduced model, which consists of only one new
standard CCGT unit, shows system costs saving which are significantly lower in comparison with the
Advanced CCGT model. These savings are also the lowest of all other modelling results for the Rapid
Progress scenario. This result suggests that the existing SEM generation portfolio is relatively
inefficient and requires new investment in efficient and technologically advanced generators. It may
also be an indication that increased level of VRE penetration will critically require flexible generators,
whilst retired or relatively old existing peaking plants will not be able to fully satisfy those
requirements.
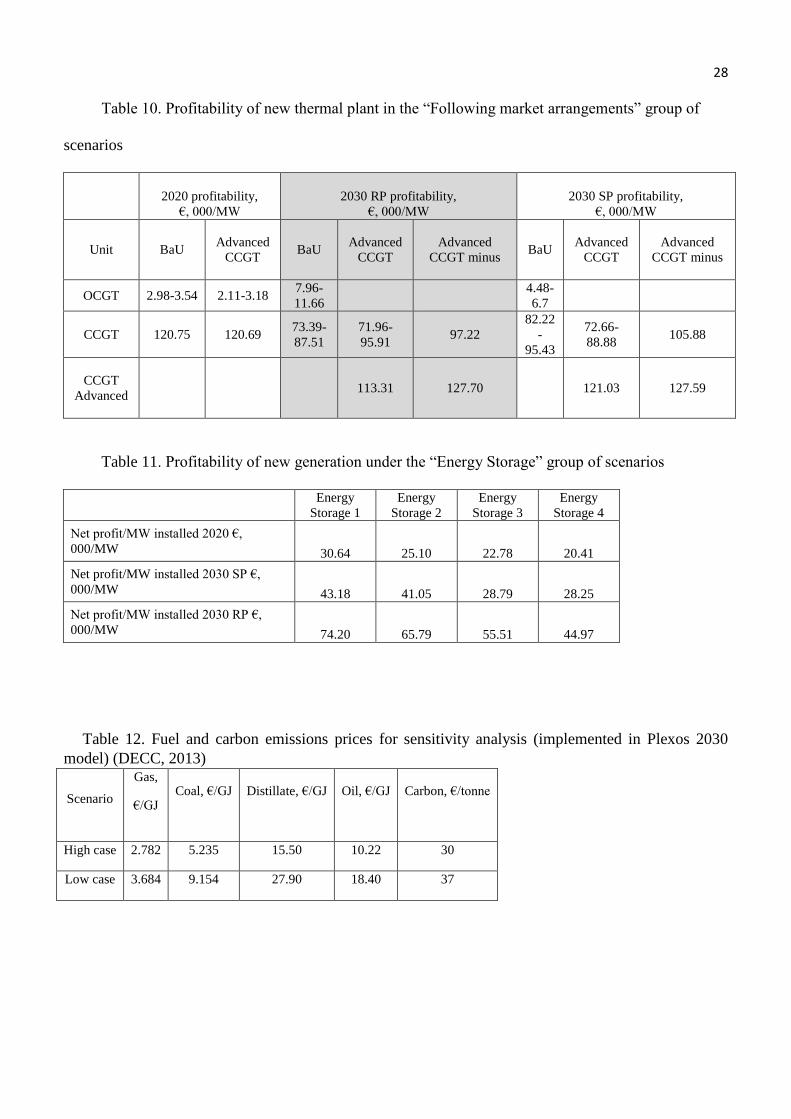
4.3 Cost-benefit analysis of new generation
A cost-benefit analysis of flexible generators was performed for 2020 and 2030 SEM operation.
Simulation results for the profitability of proposed flexible technologies achieved via infra-marginal
rent (the difference of spot and bidding prices) are presented in Tables 10 and 11.
17
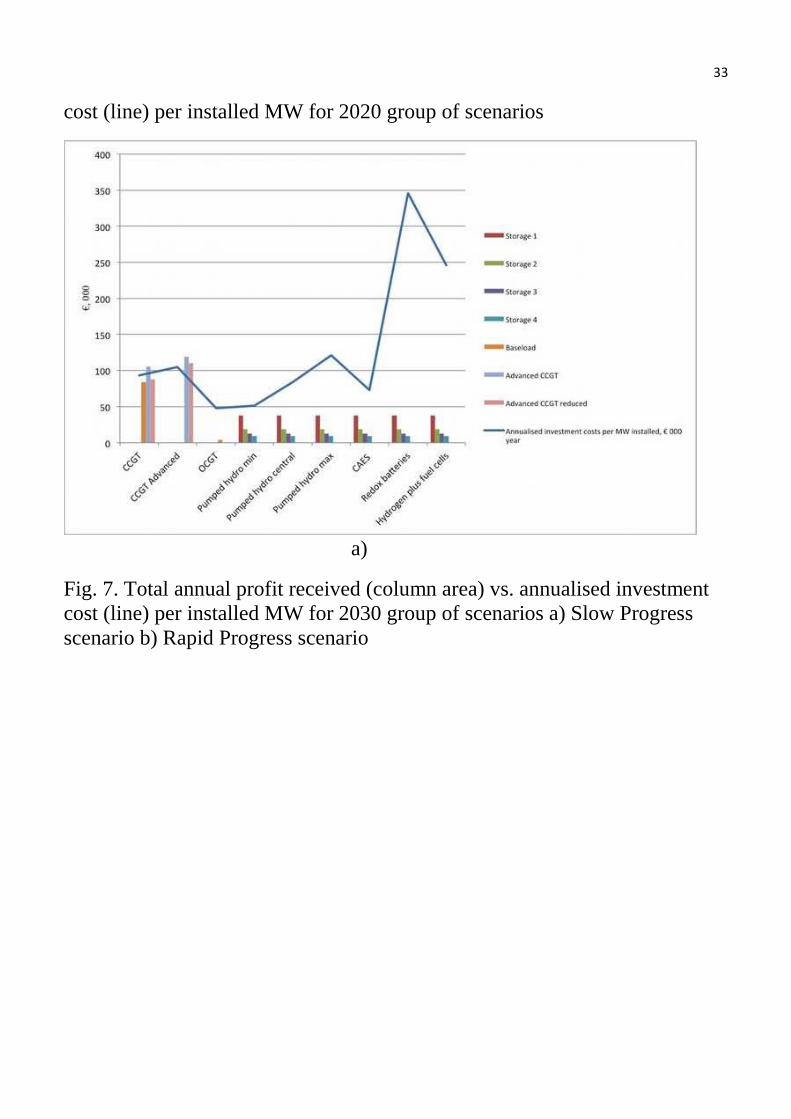
From Tables 10 and 11 it can be seen that advanced CCGT units receive the highest level of profit,
while OCGTs show limited profitability.
Cost-benefit analysis results for the suggested flexible solutions, based on annualised investment
costs and potential profitability, are presented in Fig. 6 (2020) and Fig. 7 (2030).
Fig. 6 shows that only CCGTs are able to recover their investment costs through profit realized
from infra-marginal rent. The relatively low capital costs of OCGT units are outweighed by their very
limited profitability.
Among energy storage technologies, pumped hydro and CAES are the most viable, whilst redox
batteries and hydrogen remain expensive solutions. Moreover, lifecycle greenhouse gas emissions for
CAES and pumped-hydro energy storage are much lower than for advanced batteries or any fossil fuel
generators when operated with high renewable penetration (Bouman et al, 2016), (Denholm, Kulcinski,
2004).
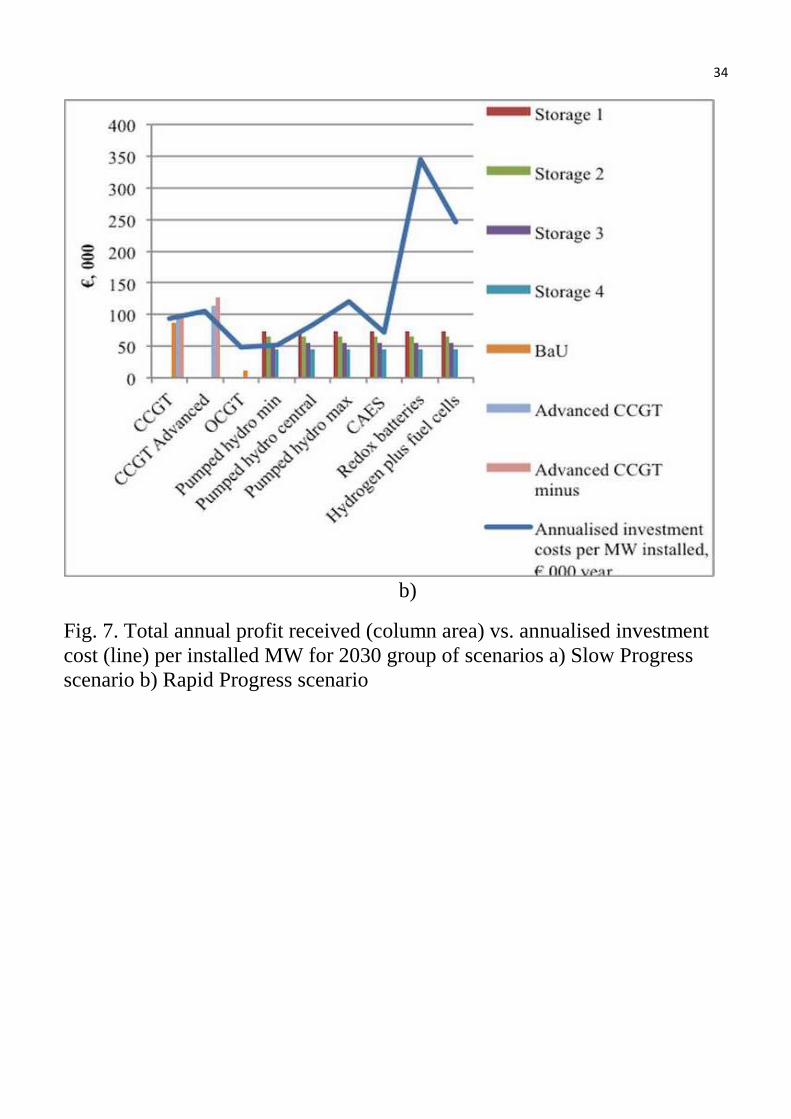
With increased renewables penetration (Rapid Progress scenario, Fig. 7 b) there is the potential for
the most viable energy storage solutions to cover their annualised investment costs if provided capital
costs do not reach their maximum level.
The capital costs of the most efficient pumped hydro or CAES solutions are primarily dictated by
specific topographical and geographical site requirements. Ref (Connolly et al, 2010) concluded that
the island of Ireland has exceptionally good geographical locations for siting pumped hydro
installations. This study identified five potential technically suitable sites in Ireland with a combined
capacity of 700 MW and energy storage of 9 GWh. Salt deposits in the Larne area of Northern Ireland
could potentially offer suitable locations for the installation of a CAES system (Evans et al, 2006).
Therefore it is reasonable to assume that pumped hydro or CAES projects with low-to middle capital
cost range could be realized.
18
Despite the fact that the flexible solutions presented in Figs. 6 and 7 show a profit deficit in
recovering their investment costs, two additional factors play an important role in their investment
viability: capacity payments and ancillary services.
The priority dispatch of renewables and resulting decreased number of operating hours for thermal
generators have already initiated the development of capacity payment mechanisms in many countries
across Europe (Mastropietroa et al, 2015) in order to support generators and guarantee security of
supply. Moreover, the SEM Committee has already established that there is a need to include CRM in
the future SEM design (SEM Committee, 2014). Estimating the future value of capacity payments is
not straightforward due to the changing market design priorities and the specific attributes of different
capacity payments mechanisms. Nonetheless, this is potentially a major supportive instrument in the
deployment of emerging flexible technologies (Cutter et al, 2014), (Hach, Spinlerr, 2014).
The second factor represents payments through ancillary services. At the moment such payments
deliver a relatively small contribution to the profitability of power plants (SEM Committee, 2014).
However, the increasing penetration of VRE has stimulated a reconsideration of ancillary services in
the SEM (SEM Committee, 2014). In combination with capacity payments, ancillary payments could
potentially eliminate any deficit in profitability for new storage generators.
Finally, it is crucial to indicate the overall socio-economic benefits which flexible generators could
bring to the market, which are presented here as total system cost savings. The final cost-benefit
analysis, including total system cost savings, is presented in Figs. 8, 9 and 10.
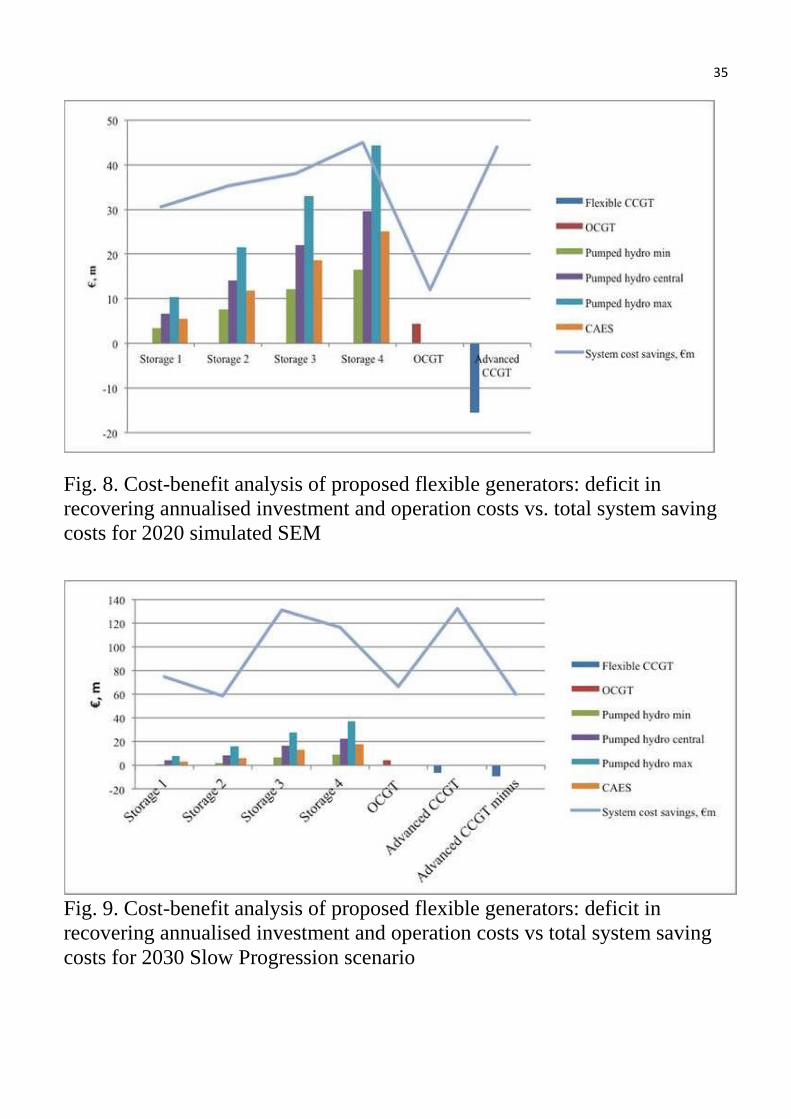
The final cost-benefit analysis shows that any deficit in recovering the investment costs of new
flexible generators is overwhelmed by total system costs savings. The advanced CCGT units bring the
highest socio-economic benefits to the market with the increased penetration of renewables (in the
Rapid Progress scenario) and would probably be able to cover their investment costs through infra-
marginal rents. Energy storage systems were shown to be more beneficial than OCGTs, with the
optimum capacity being 300 MW – 400 MW.
19
Indicative system cost savings suggest that the overall contribution of flexible generators to the
system is significant, and considerably exceeds investment cost requirements. Therefore these savings
could be directed to supporting emerging flexible generation in order to deliver efficient market
operation.
4.4 Sensitivity analysis
A sensitivity analysis was carried out to investigate changes in future market performance under a
range of fuel price scenarios. Fuel price uncertainty makes profitability forecasts and investment
decisions regarding choice of power generation technology difficult. In order to perform the sensitivity
analysis assumptions for future commodity prices based on High and Low price scenarios from DECC
projections were implemented into the 2030 SEM market models (table 12) (DECC, 2013).
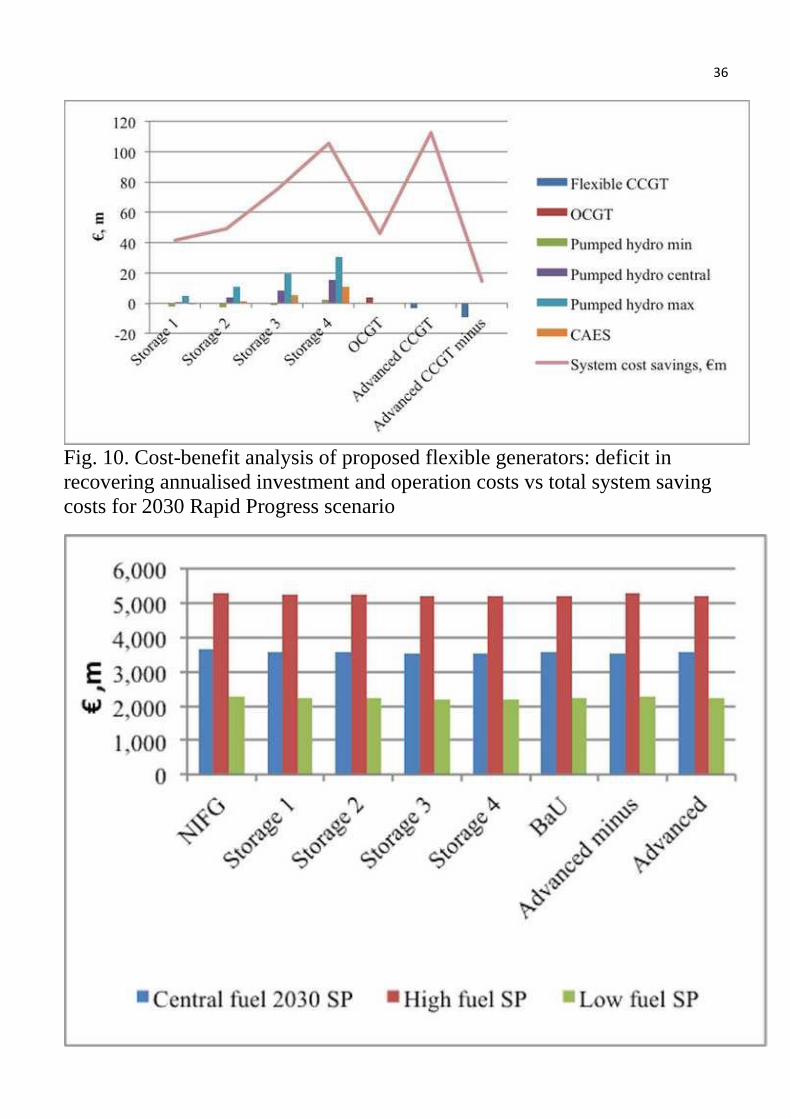
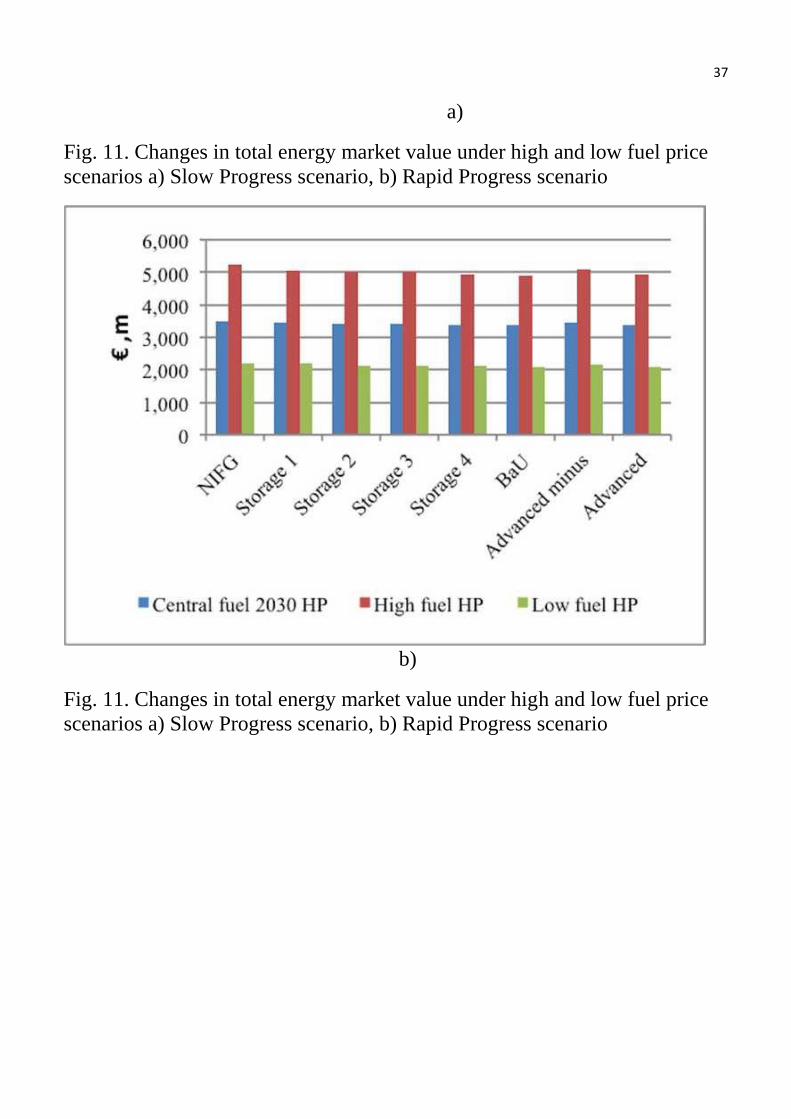
Predictably, the sensitivity analysis indicates an increase in spot electricity prices for the high fuel
price scenario and a decrease for the low fuel price scenario (Fig. 11).
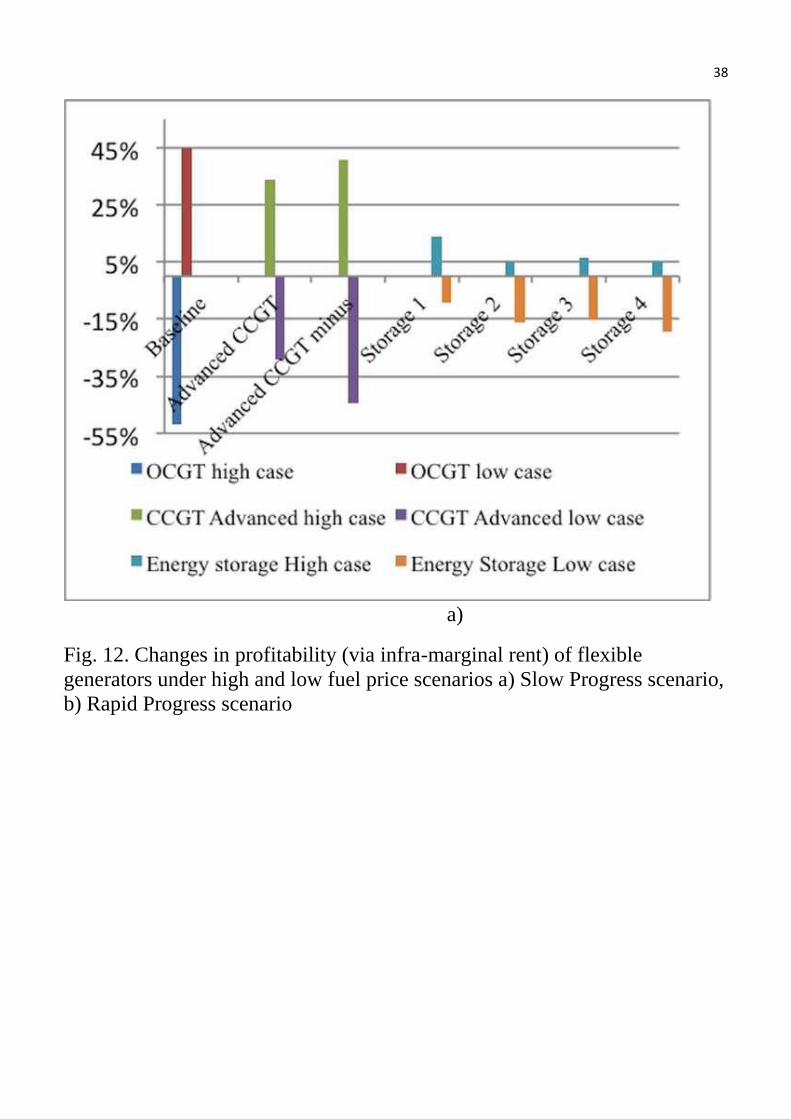
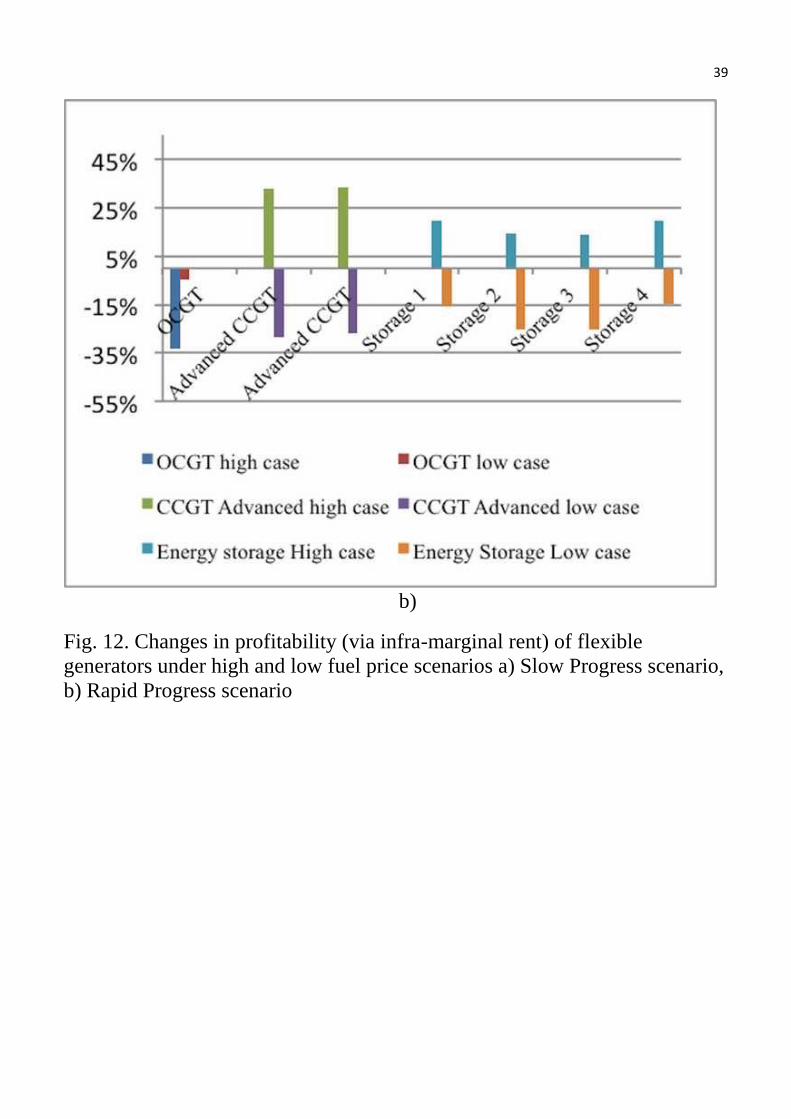
Different levels of dependence on fossil fuels, as well as differences in overall portfolio structure
between the GB and the SEM, leads to non-parallel changes in the generation profiles and profitability
of flexible solutions (Fig. 12).
Fig. 12 indicates that energy storage technologies show the least sensitivity to changes in fuel prices,
while peaking generators demonstrate the highest level of sensitivity. The Energy Storage 2 – 4
portfolios demonstrate an increase in profitability in the Rapid Progress scenarios under both low and
high fuel prices.
20
In terms of providing certainty to consumers and system operators, energy storage technologies are
the most stable and least risky solution under commodity price deviations, while peaking generators
bring increased uncertainty to investors.
5 Conclusions and Policy Implementations
This paper investigates the potential for flexible generators in the future SEM wind dominated
market, including: peaking plants (OCGT), new flexible CCGT generators, and energy storage systems.
The simulation of the future SEM market model highlights the need for flexible generators to support
system efficiency and stability. The model simulation without new investments in flexible generators
demonstrated significant negative impact on the operation of baseload generators, as well as increases
in electricity prices and total energy market values.
Energy storage systems can potentially be the most technically advantageous flexible generators,
significantly mitigating the impact of wind power on the operation of baseload plants. They
demonstrate the most stable profitability and consequently investment viability under commodity price
deviations. From a simple economic point of view the advanced flexible CCGT is the most beneficial
solution in stable commodity price scenarios. Advanced CCGTs have not yet been investigated for the
SEM and demonstrate very promising potential for the future system operation, suggesting up to 3.2 %
reduction in total market value costs.
Despite the relatively high capital costs of energy storage systems they can recover their investment
costs, and be economically efficient in high variability commodity price scenarios. In contrast peaking
generators potentially would not cover their investment costs requirements.
The modelling results also indicate that the optimal parameters for energy storage solutions for the
2020 wind dominated SEM are 300 MW – 400 MW of installed capacity with 4 GWh of energy
storage. The most likely technologies are pumped hydro or CAES. The existence of favourable
21
geographical sites for both these technologies in Ireland suggests their potential viability with relatively
low capital costs.
It is important to emphasise the key role of government in promoting the integration of flexible
technologies. Potential investors in flexible generators will only be attracted to the market if capacity
payment mechanisms and ancillary services payments send appropriate signals for new investment.
Furthermore, in order to maximise the benefits of flexible technologies it will be necessary to expand
mechanisms rewarding flexibility in the system. Under the current market optimisation regime,
efficient generators are scheduled for baseload operation, whilst less efficient and flexible generators
perform cycling operation in order to manage wind power and demand fluctuations. Potential system
cost savings realized through flexible technologies could be directed to supporting mechanism for
flexible generators while increasing electricity market efficiency compared to the business as usual
case.
Investigation of the optimal secure operation of VRE-dominated markets is of prime importance for
most European systems. The characteristics of the Single Electricity Market (limited interconnection,
the near absence of hydro resources, and highly ambitious renewable energy targets), provide an
exemplar for the management of challenges that other European markets will eventually face in order to
successfully integrate very high levels of VRE. The methodology presented in this paper is therefore
applicable to other electricity markets, which need to conduct a comprehensive analysis of the potential
of flexible generators.
6 Acknowledgment
The authors gratefully acknowledge the support of the European Union INTERREG IVA
programme through the Special EU Projects Body (SEUPB). We also express our gratitude to Energy
Exemplar for the free academic Plexos license and its team for support with modelling issues, and to
FICO for providing its Xpress solver for mixed integer programming.
22
7 References
1. A. Foley, I. Díaz Loberaa. (2013). Impacts of compressed air energy storage plant on an electricity
market with a large renewable energy portfolio. Energy (57), 85-94.
2. A. Tuohy, M. O. (2011). Pumped storage in systems with very high wind penetration. Energy Policy , 39
(4), 1965-1974.
3. A.M. Foley, P.G. Leahy, K. Li, E.J. McKeogh, A.P. Morrison. (2015). A long-term analysis of pumped
hydro storage to firm wind power. Applied Energy (137), 638-648.
4. Bouman E., Oberg M., Hetwich E.G. (2016), Environmental impacts of balancing offshore wind power
with compressed air energy storage (CAES). Energy (95), 91-98
5. Denholm P., Kulcinski G.L., (2004)Life cycle energy requirements and greenhouse gas emissions from
large scale energy storage systems, Energy Conversion and Management (45), 2153–2172
6. CER, NIAUR. (2011). Principles of Dispatch and the Design of the Market Schedule. Retrieved 2015 йил
09-January from
http://www.allislandproject.org/en/renewable_decision_documents.aspx?article=b94b7748-1faf-
41e3-975a-a0323d074eca
7. CER, NIAUR. (2012). Validation of Market Simulation Software in SEM to end 2013. Retrieved 2015 йил
09-January from
http://www.semcommittee.eu/en/market_decision_documents.aspx?page=5&article=1c2cbca7-b9fd-
4be2-bc5a-4449d017d544
8. D. Connolly, H. Lund, B.V. Mathiesen, E. Pican, M. Leahy. (2012). The technical and economic
implications of integrating fluctuating renewable energy using energy storage. Renewable energy (43),
47-60.
9. D. Connolly, S. MacLaughlin, M. Leahy. (2010). Development of a computer program to locate potential
sites for pumped hydroelectric energy storage. Energy , 35 (1), 375-381.
10. D. Heide, M. Greiner, L. Bremend, C. Hoffmanne. (2011). Reduced storage and balancing needs in a fully
renewable European power system with excess wind and solar power generation. Renwable Energy ,
36 (9), 2515-2523.
11. D.l Hach, S. Spinlerr. (2014). Capacity payment impact on gas-fired generation investments under rising
renewable feed-in — A real options analysis. Energy Economics .
12. DCNER. (2009). National Renewable Energy Action Plan. Ireland. Retrieved 2015 йил 09-January from
http://www.dcenr.gov.ie/
13. Deane J.P, Ó Gallachóir B. P, McKeogh E.J. (2010). Techno‐Economic Review of Existing and New
Pumped Hydro Energy Storage Plant. Dublin.
14. DECC. (2013). DECC Fossil fuel price projections. London: Crown Copyright.
15. DECC. (2013). Electricity Generation Costs. Retrieved January 9, 2016 from www.gov.uk/decc
23
16. DETINI. (2010). Northern Ireland Strategic Energy Framework. Retrieved January 09, 2015 from
https://www.detini.gov.uk/articles/strategic-energy-framework-2010
17. E. Cutter, B. Haley, J. Hargreaves, Ji. Williams. (2014). Utility scale energy storage and the need for
flexible capacity metrics. Applied Energy , 124, 274–282.
18. Eirgrid, SONI. (2014). All Island Generation Capacity Statement 2014-2023. Retrieved 2015 09-January
from http://www.eirgridgroup.com/site-
files/library/EirGrid/Generation%20Capacity%20Statement%202014.pdf
19. Energy Exemplar. (2010). Leading the field in Electric Power Market Modelling. Retrieved 2015 йил 09-
January from http://www.energyexemplar.com
20. Evans D.J., Reay D.M., Relay N.J., Mitchell W.I., Busby J. (2006). Apprisal of undeground energy storage
potential in Northern Ireland. Keyworth: Nottingham British Geological Survey.
21. E.V. Gariggle, J.P. Deane, P.G. Leahy. (2013). How much wind will be curtailed on the 2020 Irish power system. Renewable Energy , 544-553.
22. G.Strbac, M. Aunedi, D. Pudjianto, P. Djapic, F. Teng. (2012). Strategic Assessment of the Role and Value
of Energy Storage Systems in the Uk Low Carbon Energy Future. London: Energy Future la, Imperial
College London.
23. Gatzen, C. (2008). The economics of power storage. Munich: Oldenbourg Industrieverlag.
24. General Electric. (2011). GE FlexEfficiency* 50 Combined Cycle Fact Sheet. Retrieved January 09, 2015
from
http://www.ge.com/cn/energy/solutions/s5/FlexEfficiency50%20Combined%20Cycle%20Power%20Pla
nt.pdf
25. H. Zhao, Q.i Wua, S. Huc, H.a Xu, C.s N. Rasmussen. (2015). Review of energy storage system for wind
power integration support. Applied Energy , 137 (2015), 545-554.
26. Hummel F., Jakoby R., Stevens M. (2013). Combined Cycle Power Plants as ideal solution to balance grid
fluctuations. PowerGen Europe. Viena.
27. I Vorushylo Lytvyn, N. J. Hewitt. (2013). Barriers to increased electricity interconnection between
neighboring markets. 10th International Conference on the European Energy Market. Stockholm.
28. Market Monitoring Unit. (2010). Power Plant Cycling. Retrieved 2016 йил 09-January from
http://www.allislandproject.org/
29. Mullane, A. (2009). IEA Wind Task 25 Storage Research. Energy Storage Seminar. Dublin: Energy
Storage Seminar.
30. National Grid. (2014). UK Future Energy Scenarios. Retrieved 2015 йил 09-January from
http://www.nationalgrid.com
31. Nyamdash B.,Denny E.,O'Malley M. (2010). The viability of balancing wind generation with large scale
energy storage. Energy Policy , 7200-7208.
24
32. O’Donnell, P. (2009). Investigation of large pumped storage on the All-island system. Energy Storage
Seminar. Dublin: Electricity Storage Seminar.
33. P. Keatley, A. Shibli, N.J. Hewitt. (2013). Estimating power plant start costs in cyclic operation. Applied
Energy , 111, 550-557.
34. P. Mastropietroa, , P. Rodillaa, , C. Batllea. (2015). National capacity mechanisms in the European
internal energy market: Opening the doors to neighbours. Energy Policy , 82, 38–47.
35. Platts. (n.d.). Platts Energy Company. Retrieved January 09, 2015 from http://www.platts.com/
36. Probert, T. (2011). Fast starts and flexibility: Let the gas turbine battle commence. Power Engineering
International .
37. R.K. Edmunds, Cockerill, T.J. Foxon, D.B. Ingham, M. Pourkashanian. (2014). Technical benefits of
energy storage and electricity interconnections in future British power systems. Energy , 70, 577-587.
38. SEM Committee. (2014, December 19). DS3 System Services Procurement Design and Emerging
Thinking. Decision paper. From http://www.allislandproject.org
39. SEM Committee. (2014). SEM Commitee decision on High Level Design. Retrieved January 09, 2015
from http://www.allislandproject.org/en/wholesale_overview.aspx?article=d3cf03a9-b4ab-44af-8cc0-
ee1b4e251d0f
40. SEM Committee. (2014). SEM Committee Decision on High Level Design. Impact Assessment. Retrieved
January 09, 2015 from http://www.allislandproject.org/en/wholesale_overview.aspx?article=d3cf03a9-
b4ab-44af-8cc0-ee1b4e251d0f
41. Troy, N. (2010). Multi-mode Operation of Combined Cycle Gas Turbines with Increasing Wind
Penetration. IEEE Transactions on Power Systems .
42. V. Bianco, F. Scarpa, L.A. Tagliafico. (2015). Long term outlook of primary energy consumption of the
Italian thermoelectric sector: Impact of fuel and carbon prices. Energy, 87, 153-164
43. Xi. Luo, J. Wang, M.k Dooner, J. Clarke. (2015). Overview of current development in electrical energy
storage technologies and the application potential in power system operation. Applied Energy , 5011-
536.
25
Table 1. Forward-looking model validation results
Validation parameter Period Historical
average
Plexos model average Difference, %
Total system costs
(M €)
2008 3,104 2,903 -6%
2009 subinterval 979 936 -4%
whole period 4,083 3,839 -6%
Table 2. Overview of the modelling scenarios
Scenario
2020
2030
Slow Progress
(SP)
2030
Rapid Progress
(RP)
4.7 GW WPG 5.8 GW WPG 6.3 GW WPG
Th
erm
al
gen
erato
rs
NIFG
Extant units still available
in 2020
Plus 445 MW conventional
CCGT (1 unit)
Extant units still available in 2030
Plus 845 MW conventional CCGT
(2 units)
BaU NIFG + 300 MW OCGT NIFG + 400 MW OCGT
Advanced CCGT NIFG + 400 MW Advanced CCGT
Advanced CCGT
minus N/A
Advanced CCGT scenario minus
1 x 445 MW conventional CCGT unit
En
ergy s
tora
ge
Storage 1 NIFG + 100 MW Energy storage
Storage 2 NIFG + 200 MW Energy storage
Storage 3 NIFG + 300 MW Energy storage
Storage 4 NIFG + 400 MW Energy storage
Table 3. Technical parameters of new thermal generators
Property
OCGT CCGT CCGT Advanced
26
Efficiency 30% 50% 61%
Fuel type natural gas natural gas natural gas
Min load, MW 11 220 210
Max load, MW 100 440 510 (400)*
Ramp up rates, MW/min 10 30 50
Synchronisation time when hot, hours 0.1 2 0.5
Synchronisation time when warm, hours 0.1 3.5 0.5
Synchronisation time when cold, hours 0.1 5 1 *Maximum capacity of advanced CCGT unit was downgraded to 400 MW for the modelling comparison reasons as described earlier
Table 4. Fuel and carbon emissions prices implemented in Plexos 2020 and 2030 models
Horizon Gas,
€/GJ
Coal,
€/GJ
Distillate,
€/GJ
Oil,
€/GJ
Carbon,
€/tonne
2020 3.68 9.15 24.74 16.32 37
2030 3.68 9.15 27.90 18.40 37
Table 5. 2020 and 2030 SEM consumer demand forecast assumptions (Eirgrid, SONI, 2014), (SEM
Committee, 2014)
Region
SEM
Total
demand,
TWh,
2020
Transmission
peak, GW,
2020
2020 38.5 7.0
2030 43.2 7.8
Table 6. Investment costs for the new thermal generators (DECC, 2013)
Technology type Predevelopment costs,
€ 000/MW
Construction costs,
€ 000/MW
Economic
lifetime
FO&M,
€ 000/year
Insurance,
€ 000 MW/year
Connection and UoS charges,
€ 000/MW/yr
CCGT Advanced* 29 824 25 26 2.34 8.06
CCGT medium 12 707 25 26 2.34 8.06
OCGT 35 353 25 12 1.13 4.05
*Capital costs for the flexible CCGTs are not announced yet. They were assumed to be equal to the CCGTs commissioning in 2020 following high
cost scenario from the DECC Electricity Generation Costs report (DECC, 2013).
27
Table 7. Investment costs for energy storage technologies (Gatzen, 2008), (Luo et al, 2015) (Zhao
et al, 2015), (Strbac et al, 2012), (Deane et al, 2010)
Technology Capital costs,
€ 000/MW
Round trip efficiency,
%
FO&M costs,
€ 000/MW year
Insurance, £
000 MW/year
Economic lifetime,
years
Pumped-hydro Storage 435 – 2,170 70-85 3.8 1.06 30
CAES 650 -750 57 1.42 1.06 30
Redox batteries 2,300-2,350 70-85 6 1.06 5-10
Hydrogen plus fuel cells 2,350 – 2,450 32* 6 1.06 10 – 20
*The value represents electrical efficiency only
Table 8. Major economic characteristics of the future 2020 energy market scenarios
Parameter Units NIFG Storage 1 Storage 2 Storage 3 Storage 4 BaU Advanced
CCGT
Average spot
price €/MWh
83.83 83.14 82.72 82.87 82.26 83.62 82.62
Total Energy
Market
System costs € , m 3,528 3,499 3,484 3,477 3,454 3,523 3,470
Total system
cost savings
(€, m)
% -
-29
(-0.82 %)
-45
(-1.26%)
-51
(-1.44 %)
-74
(-2.11%)
-5
(-0.15%)
-59
(-1.66 %)
Table 9. System cost saving for the 2030 SEM simulation
Parameter Units NIFG Storage 1 Storage 2 Storage 3 Storage 4 BaU
Advanced
CCGT
Advanced
CCGT
minus
System
costs 2030
SP
€ ,m 3,652 3,593 3,577 3,535 3,521 3,585 3,519 3,592
System cost
savings, SP
€, m
(%)
-59
(-1.61%)
-75
(-2.05% )
-117
(-3.19%)
-131
(-3.59%)
-67
(-1.83%)
-133
(-3.63%)
-60
(-1.64%)
System
costs 2030
RP
€ ,m 3,478 3,436 3,429 3,403 3,373 3,432 3,366 3,464
System cost
savings, RP
€, m
(%)
-42
(-1.20%)
-49
(-1.42%)
-75
(-2.16%)
-105
(-3.03%)
-46
(-1.33%)
-112
(-3.23%)
-14
(-0.42%)
28
Table 10. Profitability of new thermal plant in the “Following market arrangements” group of
scenarios
2020 profitability,
€, 000/MW
2030 RP profitability,
€, 000/MW
2030 SP profitability,
€, 000/MW
Unit BaU Advanced
CCGT BaU
Advanced
CCGT
Advanced
CCGT minus BaU
Advanced
CCGT
Advanced
CCGT minus
OCGT 2.98-3.54 2.11-3.18 7.96-
11.66
4.48-
6.7
CCGT 120.75 120.69 73.39-
87.51
71.96-
95.91 97.22
82.22
-
95.43
72.66-
88.88 105.88
CCGT
Advanced 113.31 127.70
121.03 127.59
Table 11. Profitability of new generation under the “Energy Storage” group of scenarios
Energy
Storage 1
Energy
Storage 2
Energy
Storage 3
Energy
Storage 4
Net profit/MW installed 2020 €,
000/MW 30.64 25.10 22.78 20.41
Net profit/MW installed 2030 SP €,
000/MW 43.18 41.05 28.79 28.25
Net profit/MW installed 2030 RP €,
000/MW 74.20 65.79 55.51 44.97
Table 12. Fuel and carbon emissions prices for sensitivity analysis (implemented in Plexos 2030
model) (DECC, 2013)
Scenario
Gas,
€/GJ
Coal, €/GJ
Distillate, €/GJ
Oil, €/GJ
Carbon, €/tonne
High case 2.782 5.235 15.50 10.22 30
Low case 3.684 9.154 27.90 18.40 37
29
Fig. 1. Schematic representation of the SEM model in Plexos software
Fig. 2. Methodology overview diagram
30
Fig. 3. Impact of VRE on operation of baseload and midmerit plants in 2020
in comparison with Nov 2010-Nov 2011 operation
a)
Fig. 4. Impact of VRE on operation of baseload and midmerit plants in 2030
a) Slow Progress Scenario and b) Rapid Progress Scenario
31
b)
Fig. 4. Impact of VRE on operation of baseload and midmerit plants in 2030
a) Slow Progress Scenario and b) Rapid Progress Scenario
32
Fig. 5. Total generation and number of start-ups of baseload gas generators
for the 2020 Advanced CCGT model
Fig. 6. Total annual profit received (column area) vs. annualised investment
33
cost (line) per installed MW for 2020 group of scenarios
a)
Fig. 7. Total annual profit received (column area) vs. annualised investment
cost (line) per installed MW for 2030 group of scenarios a) Slow Progress
scenario b) Rapid Progress scenario
34
b)
Fig. 7. Total annual profit received (column area) vs. annualised investment
cost (line) per installed MW for 2030 group of scenarios a) Slow Progress
scenario b) Rapid Progress scenario
35
Fig. 8. Cost-benefit analysis of proposed flexible generators: deficit in
recovering annualised investment and operation costs vs. total system saving
costs for 2020 simulated SEM
Fig. 9. Cost-benefit analysis of proposed flexible generators: deficit in
recovering annualised investment and operation costs vs total system saving
costs for 2030 Slow Progression scenario
36
Fig. 10. Cost-benefit analysis of proposed flexible generators: deficit in
recovering annualised investment and operation costs vs total system saving
costs for 2030 Rapid Progress scenario
37
a)
Fig. 11. Changes in total energy market value under high and low fuel price
scenarios a) Slow Progress scenario, b) Rapid Progress scenario
b)
Fig. 11. Changes in total energy market value under high and low fuel price
scenarios a) Slow Progress scenario, b) Rapid Progress scenario
38
a)
Fig. 12. Changes in profitability (via infra-marginal rent) of flexible
generators under high and low fuel price scenarios a) Slow Progress scenario,
b) Rapid Progress scenario
39
b)
Fig. 12. Changes in profitability (via infra-marginal rent) of flexible
generators under high and low fuel price scenarios a) Slow Progress scenario,
b) Rapid Progress scenario


