Presentation toMorgan Stanley Small Cap Executive Conference
June 13, 2007 – New York
Cheryl K. BeebeVice President and CFO
David A. PrichardDirector, Investor Relations

2
Forward-Looking Statement
This presentation contains or may contain forward-looking statements within the meaning of Section 27A of the Securities Exchange Act of 1933 and Section 21E of the Securities Exchange Act of 1934. The Company intends these forward looking statements to be covered by the safe harbor provisions for such statements. These statements include, among other things, any predictions regarding the Company’s future financial condition, earnings, revenues, expenses or other financial items, any statements concerning the Company’s prospects or future operation, including management’s plans or strategies and objectives therefor and any assumptions underlying the foregoing. These statements can sometimes be identified by the use of forward looking words such as “may,” “should,” “will,” “anticipate,” “believe,” “plan,” “project,” “estimate,”“expect,” “intend,” “continue,” “pro forma,” “forecast” or other similar expressions or the negative thereof. All statements other than statements of historical facts in this report or referred to or incorporated by reference into this report are “forward-looking statements.” These statements are subject to certain inherent risks and uncertainties. Although we believe our expectations reflected in these forward-looking statements are based on reasonable assumptions, stockholders are cautioned that no assurance can be given that our expectations will prove correct. Actual results and developments may differ materially from the expectations conveyed in these statements, based on various factors, including fluctuations in worldwide markets for corn and other commodities, and the associated risks of hedging against such fluctuations; fluctuations in aggregate industry supply and market demand; general political, economic, business, market and weather conditions in the various geographic regions and countries in which we manufacture and/or sell our products; fluctuations in the value of local currencies, energy costs and availability, freight and shipping costs, and changes in regulatory controls regarding quotas, tariffs, duties, taxes and income tax rates; operating difficulties; boiler reliability; our ability to effectively integrate acquired businesses; labor disputes; genetic and biotechnology issues; changing consumption preferences and trends; increased competitive and/or customer pressure in the corn-refining industry; the outbreak or continuation of hostilities including acts of terrorism; stock market fluctuation and volatility; and our ability to maintain sales levels of HFCS in Mexico. Our forward-looking statements speak only as of the date on which they are made and we do not undertake any obligation to update any forward-looking statement to reflect events or circumstances after the date of the statement. If we do update or correct one or more of these statements, investors and others should not conclude that we will make additional updates or corrections. For a further description of these risks factors, see the Company’s most recently filed Annual Report on Form 10-K for the year ended December 31, 2006 and subsequent reports on Forms 10-Q or 8-K.

3
Pure-Play Starch Refiner/Ingredients Company
• Leading global provider of refined, agriculturally based
products and ingredients
– Primary raw materials: corn/other starch-based materials
– No. 1 worldwide dextrose producer
– Regional leader in starch, high fructose corn syrup and glucose
• Major in-country capacity shares typical – ex-US
• Solid balance sheet and strong cash flow generation

4
Pure-Play Starch Refiner/Ingredients Company
SweetenersDextroseGlucoseMaltoseHigh fructose corn syrupFermentation products
StarchesIndustrial starchesProcess food starchesFermentation products
Co-productsCorn gluten feed Corn gluten mealCorn oil
corn syrups
5
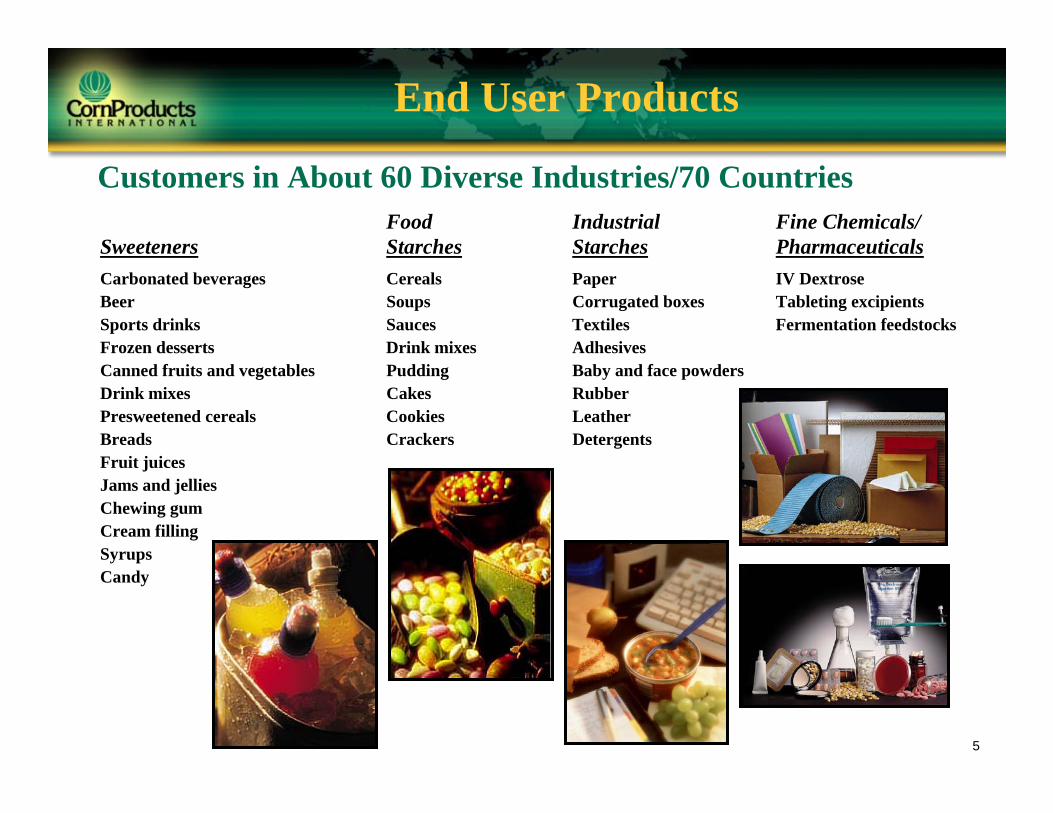
End User Products
Customers in About 60 Diverse Industries/70 CountriesFood Industrial Fine Chemicals/
Sweeteners Starches Starches PharmaceuticalsCarbonated beverages Cereals Paper IV DextroseBeer Soups Corrugated boxes Tableting excipientsSports drinks Sauces Textiles Fermentation feedstocksFrozen desserts Drink mixes AdhesivesCanned fruits and vegetables Pudding Baby and face powdersDrink mixes Cakes RubberPresweetened cereals Cookies LeatherBreads Crackers DetergentsFruit juicesJams and jelliesChewing gumCream fillingSyrupsCandy

6
Sales by Product Category & Markets Served
55%
20%
25%
54%
21%
25%
52%
22%
26%
53%
23%
24%
55%
22%
23%
0%
10%
20%
30%
40%
50%
60%
2002 2003 2004 2005 2006
Sweeteners
Starches
Co-Products &Other
Other, 42%
Animal Feed, 10%Brewing Industry, 11%
Soft Drink Industry, 18%
Processed Food Industry, 19%
7
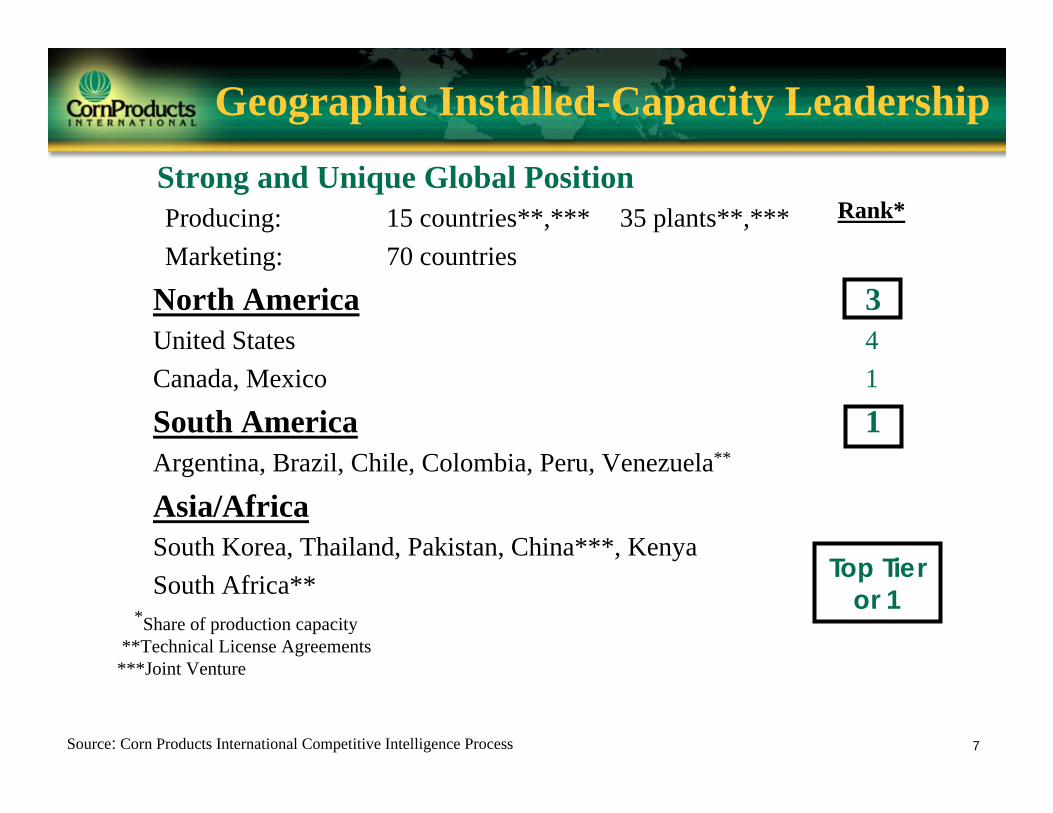
Strong and Unique Global PositionProducing: 15 countries**,*** 35 plants**,***Marketing: 70 countries
North America 3United States 4Canada, Mexico 1
South America 1Argentina, Brazil, Chile, Colombia, Peru, Venezuela**
Asia/AfricaSouth Korea, Thailand, Pakistan, China***, KenyaSouth Africa**
*Share of production capacity**Technical License Agreements***Joint Venture
Geographic Installed-Capacity Leadership
Top Tier or 1
Rank*
Source: Corn Products International Competitive Intelligence Process
8
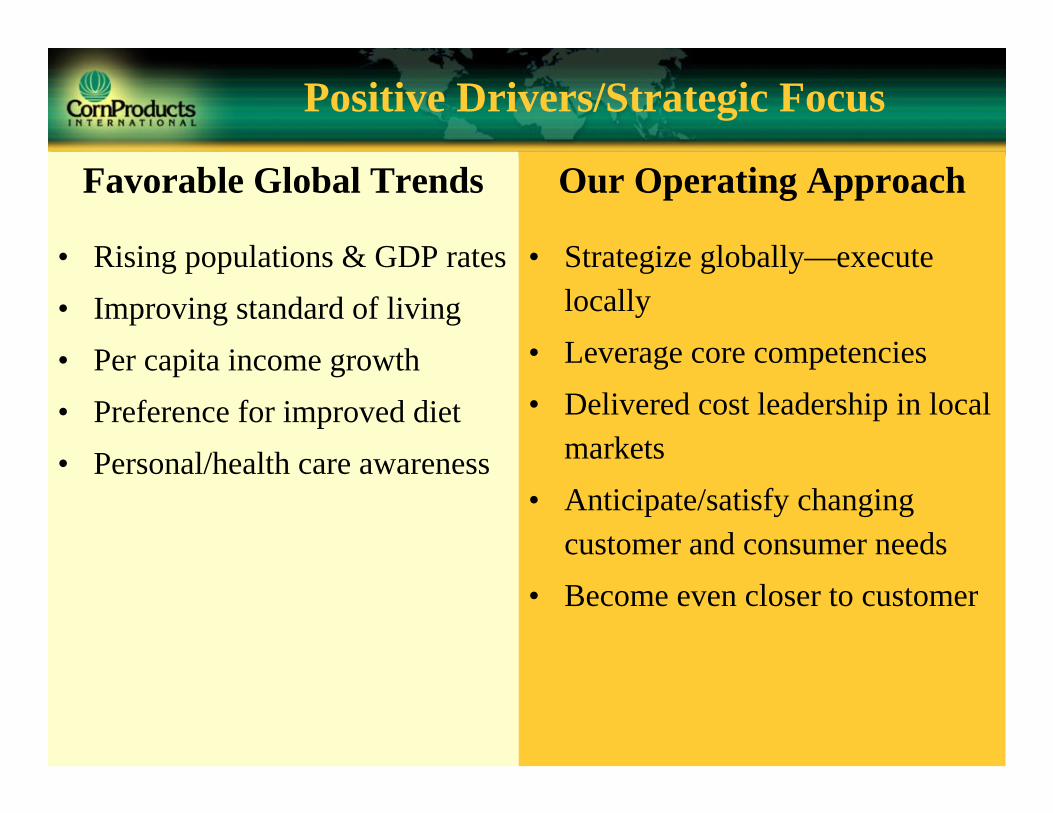
Positive Drivers/Strategic Focus
Favorable Global Trends
• Rising populations & GDP rates• Improving standard of living• Per capita income growth• Preference for improved diet• Personal/health care awareness
Our Operating Approach
• Strategize globally—execute locally
• Leverage core competencies• Delivered cost leadership in local
markets• Anticipate/satisfy changing
customer and consumer needs• Become even closer to customer

9
• 75+ years – >70% share of capacity• Full territory coverage• Historically outperformed each nation’s underlying GDP• Successfully dealt with currencies, economies• Most advanced ingredient region in CPO• HFCS only in Argentina
Andean RegionColombia 1 corn refining plant
1 tapioca plant2 tolling facilities
Venezuela 1 plant (TLA)Peru 1 plant
Southern ConeArgentina 2 plantsChile 1 plantUruguay Distribution warehouseParaguay/Bolivia Sales agents
Brazil 3 corn refining plants1 tapioca plant1 adhesive & caramel color plant1 polyol plant Ingredient Technology Center
South America Region – Historic Strength
Brazil
Colombia
Chile
Argentina
Venezuela
Peru
Ecuador
Uruguay
10
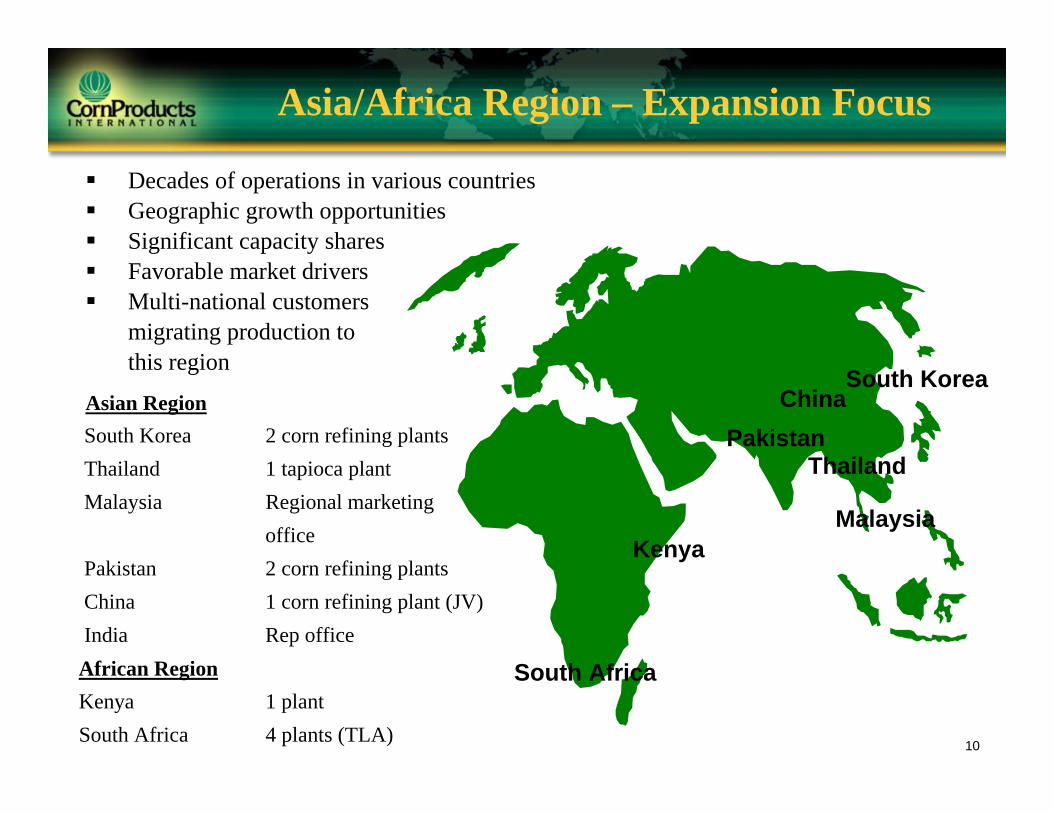
Decades of operations in various countriesGeographic growth opportunitiesSignificant capacity sharesFavorable market driversMulti-national customersmigrating production to this region
Asian RegionSouth Korea 2 corn refining plantsThailand 1 tapioca plantMalaysia Regional marketing
officePakistan 2 corn refining plantsChina 1 corn refining plant (JV)India Rep office
African RegionKenya 1 plantSouth Africa 4 plants (TLA)
Asia/Africa Region – Expansion Focus
Kenya
Pakistan
Malaysia
Thailand
South Africa
South KoreaChina

11
North America Region – Margin Growth
• 100 years old in the US
• Improving industry fundamentals– High capacity utilization rates
– Industry rationalization/plant closures
– Ethanol demand growing
– Higher US, Canadian contract pricing
• Mexico leadership– Resumption of HFCS sales and TRQs
– HFCS beverage usage tax eliminated
• Only North American corn refiner with full-scale sweetener and starch facilities in all 3 NAFTA countries – unique position
Canada 3 plantsMexico 3 plants
United States 5 plants
Canada
Mexico
United States

12
■ Strong Americas position
■ Managing geographic breadth
• Cultural understanding
• Performance in “difficult” environments
■ Reputation/assets/infrastructure
■ Managing alliance relationships
Core Capabilities – A Building Platform

13
Mission and Pathways
2003 2008
1. Excel at the Base Business
5. Be anIngredients Supplier
4. Grow Defensible Businesses in New High-Growth Regions3. Expand Value-
Added Product Portfolio Through Multi-Geographic Alliances and Acquisitions
2. Selectively Drive Organic Growth in the Base Business
To be the Premier Regional Provider of Refined, Agriculturally Based Products and Ingredients Worldwide
14
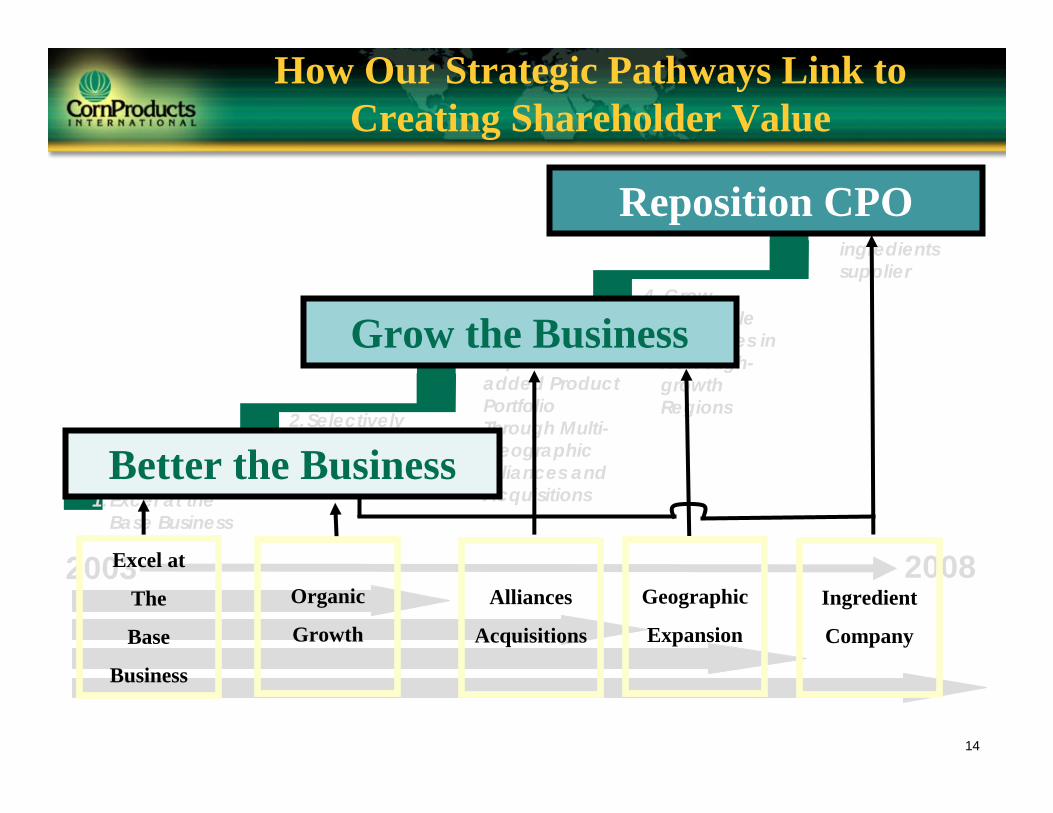
How Our Strategic Pathways Link to Creating Shareholder Value
1.Excel at the Base Business
2.Selectively Drive Organic Growth in the Base Business
2003 2008
5. Be an ingredients supplier
4. Grow Defensible Businesses in New High-growth Regions
3. Expand Value-added Product Portfolio Through Multi-Geographic Alliances and Acquisitions
Better the Business
Grow the Business
Reposition CPO
Excel at
The
Base
Business
Organic
Growth
Alliances
Acquisitions
Geographic
Expansion
Ingredient
Company

15
Pathway Strategy Examples
• Acquisition in February 2007 of SPI Polyols specialty food ingredients business in the US and remaining 50% of Getec, a Brazilian polyols JV
– Combined sales about $100 million annually– Transaction expected to be accretive in first year and meet stated ROCE target– Broadens our sweeteners platform in the Americas
• Acquisition of DEMSA, Peru’s only corn refiner, in December 2006 • New product introductions and development
– Three new modified starch channels started up in Brazil for food and industrial markets– Start-up of Canada FOS production channel – Expansion of Getec sorbitol capabilities – Near doubling of grind capacity at Balsa Nova specialties plant by year-end 2007– Expandex™ modified tapioca starch for gluten intolerance market
• Select, high-return product channel expansions in 2007 capital program– Countries include Argentina, Mexico, Colombia, Pakistan and Thailand

16
Key Financial Targets: 2003-2008
5-Year EPS Growth Target Low Double-Digit
Return on Capital Employed (ROCE) 8.5% to 10+%
Total Debt/EBITDA < 2.25x
Debt/Capitalization 32% to 35%
Operating Working Capital 8% to 10% of Net Sales
See Appendix slides for GAAP reconciliation for the non-GAAP Targets

17
Management/Shareholder Alignment
• Enhancing shareholder value– Officers average nearly 20 years of experience
• Executive compensation aligned with shareholders
• Management variable compensation
• Direct stock ownership targets for officers• Significant inside ownership
Short-term– EPS/Operating Income 80%– Operating Cash Flow 20%
Long-term– Shareholder return 50%– Return on capital employed (ROCE) 50%
Annual Incentive Plan– EPS/Operating Income 60%– Individual 20%– Working Capital/ROCE 20%

18
Financial Review
19
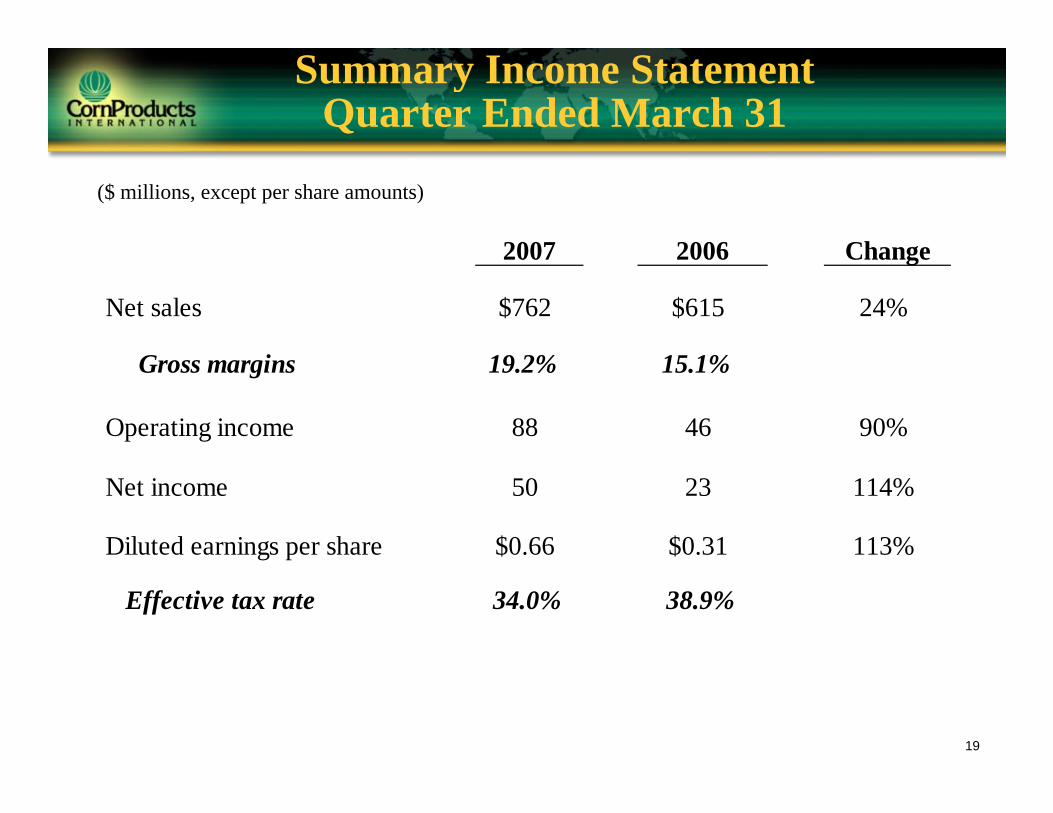
Summary Income StatementQuarter Ended March 31
2007 2006 Change
Net sales $762 $615 24%
Gross margins 19.2% 15.1%
Operating income 88 46 90%
Net income 50 23 114%
Diluted earnings per share $0.66 $0.31 113%
Effective tax rate 34.0% 38.9%
($ millions, except per share amounts)

20
2007 First Quarter
• Strongest quarter in our history follows record 2006 year– New quarterly net sales, earnings and margin records– Excellent performance virtually across the board, especially North
America region
• Factors in margin expansion– Price increases in our North American businesses– Faster pass-through of higher corn costs in our international markets– Stronger co-product values

21
2007 2006
Debt to total capital 26.3% 27.4%
Debt to EBITDA (TTM) 1.5 1.8
Operating working capital $308 $243(excluding short-term debt, cash and deferred tax)
% of 12-month sales 11.1% 10.1%
Net debt (debt less cash) $471 $448
Key MetricsQuarter Ended March 31
($ millions)
22
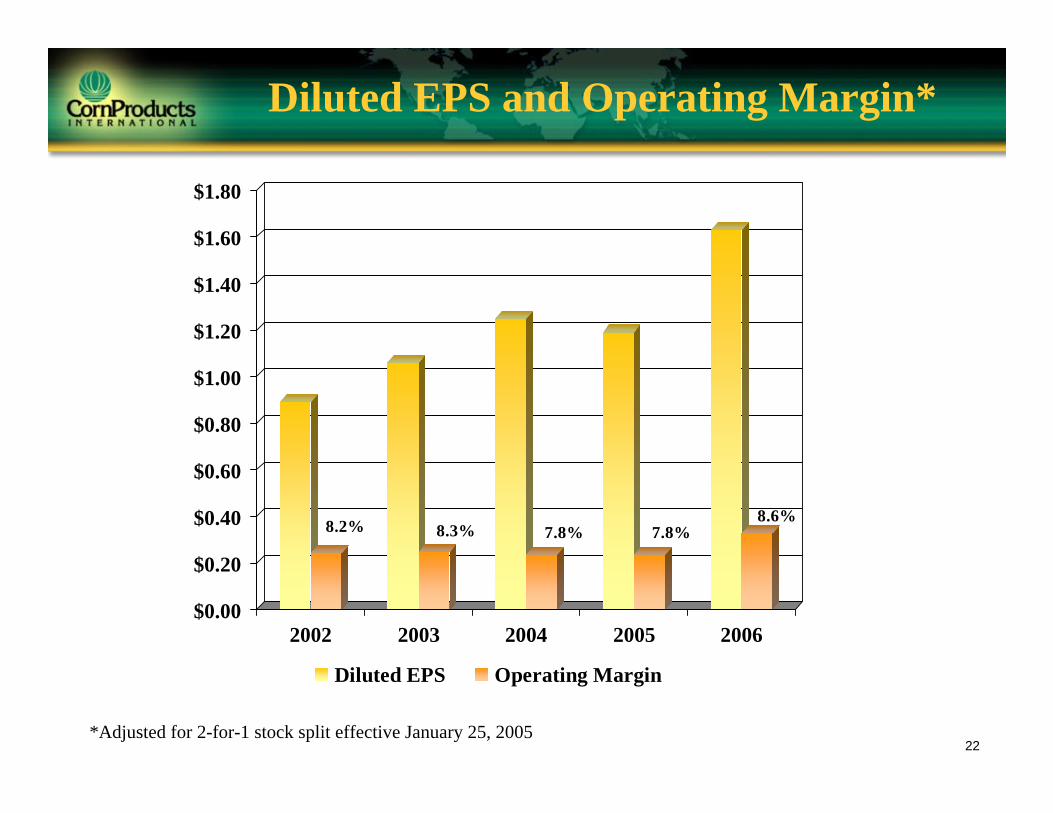
Diluted EPS and Operating Margin*
8.2% 8.3% 7.8% 7.8%8.6%
$0.00
$0.20
$0.40
$0.60
$0.80
$1.00
$1.20
$1.40
$1.60
$1.80
2002 2003 2004 2005 2006
Diluted EPS Operating Margin
*Adjusted for 2-for-1 stock split effective January 25, 2005

23
$0
$20
$40
$60
$80
$100
$120
$140
$160
$180
2001 2002 2003 2004 2005 2006
Cap-XD&A
Cap-X and D&A
($ millions)

24
Cash Flow and Total Debt
Cash Flow from Operations
$0
$50
$100
$150
$200
$250
$300
2001 2002 2003 2004 2005 2006
Cash Flow Net Income
Leverage
$0
$100
$200
$300
$400
$500
$600
$700
$800
2001 2002 2003 2004 2005 20060.0%
5.0%
10.0%
15.0%
20.0%
25.0%
30.0%
35.0%
40.0%
45.0%
Total Debt Debt to Total Capital
($ millions)

25
Dividend History*
*Adjusted for 2-for-1 stock split effective January 25, 2005
$0.00
$0.20
$0.40
$0.60
$0.80
$1.00
$1.20
$1.40
$1.60
$1.80
1999 2000 2001 2002 2003 2004 2005 2006
Annual Cash Dividend Paid Per Common Share Annual Diluted EPS

26
Shareholder Value Proposition
Strategic StrengthsSingle focus – starch refining
Clear long-term strategySpecific growth pathways
Mgmt/shareholder alignment
ATTRACTIVEGROWTH PROFILE
Low CostModern plants
Favorable locationsWorldwide network
Global cost optimization
Organizational DepthExperienced management
Focused workforceTechnical & market expertise
Financial FlexibilityStrong balance sheetSolid cash generation
Low maintenance cap-xInvestment grade ratings
Leading PositionsDiverse geographies
Product/customer breadthValuable alliances
High barriers to entry

27
28
Appendix

29
Management ProfilesSamuel C. Scott IIIChairman, President and Chief Executive Officer
Samuel Scott, 63, has served as chairman and chief executive officer since 2001. Previously, Scott was the president and chief operating officer of the Company. He held various positions with CPC International Inc. since 1973, including vice president of sales for Corn Products, executive vice president, and president of CPC’s worldwide corn-refining business. He also held positions with Citibank and United Technologies’ Norden Division. Scott serves on the board of Motorola, Inc., where he is lead director and chairman of the compensation committee. He also serves on the board of directors of Abbott Laboratories and The Bank of New York. In addition, he sits on the boards of ACCION International, INROADS Chicago and The Chicago Council on Foreign Relations. He is a trustee of The Conference Board. Scott received a bachelor’s degree in engineering and a master’s degree in business administration from Fairleigh Dickinson University in New Jersey.
Cheryl K. BeebeVice President and Chief Financial Officer
Cheryl Beebe, 51, was appointed vice president and chief financial officer in 2004. Prior to this position, she served as the vice president of finance and corporate treasurerof the Company. Beebe has held various positions of increasing responsibility in marketing, market services, audit, finance and treasury functions, since joining CPC International Inc. in 1980. She has a bachelor’s degree in accounting from Rutgers University in New Jersey, and a master’s degree of business administrationin corporate finance from Fairleigh Dickinson University in New Jersey.

30
Corn Wet Milling Process
31
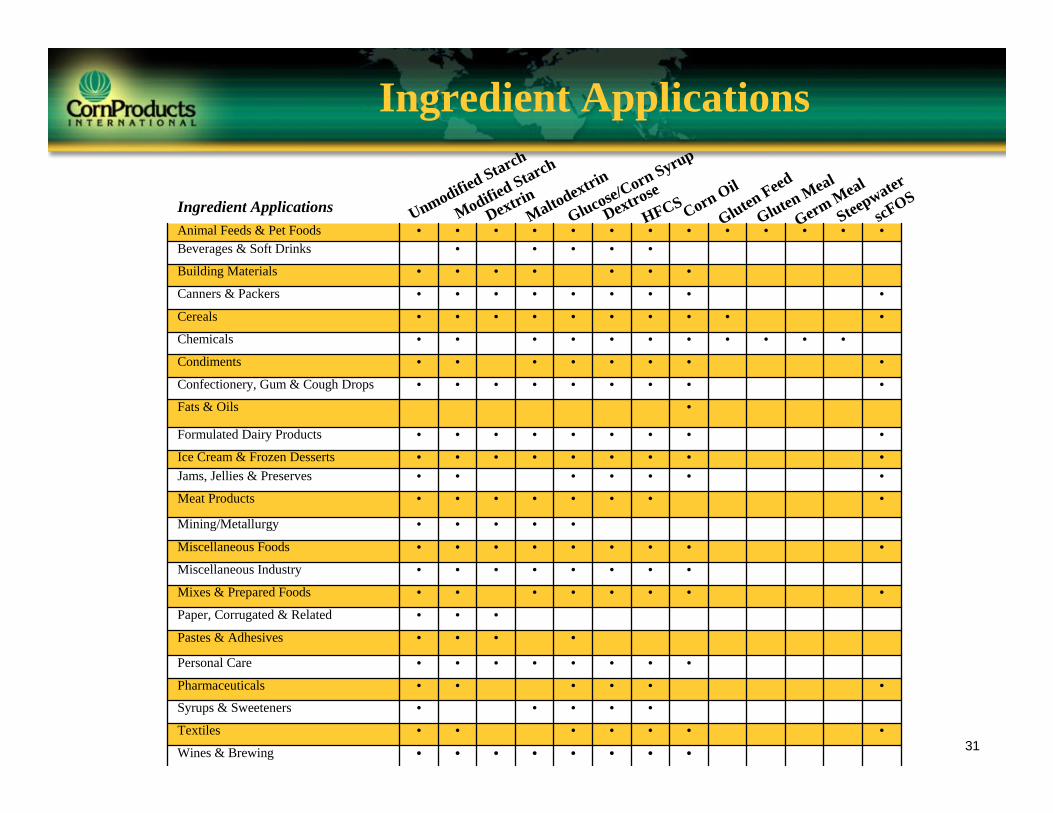
Ingredient Applications
••••••••Wines & Brewing
•••••••Textiles
•••••Syrups & Sweeteners••••••Pharmaceuticals
••••••••Personal Care
••••Pastes & Adhesives
•••Paper, Corrugated & Related
••••••••Mixes & Prepared Foods
••••••••Miscellaneous Industry
•••••••••Miscellaneous Foods
•••••Mining/Metallurgy
••••••••Meat Products•••••••Jams, Jellies & Preserves•••••••••Ice Cream & Frozen Desserts
•••••••••Formulated Dairy Products
•Fats & Oils•••••••••Confectionery, Gum & Cough Drops
••••••••Condiments
•••••••••••Chemicals
••••••••••Cereals
•••••••••Canners & Packers
•••••••Building Materials•••••Beverages & Soft Drinks
•••••••••••••Animal Feeds & Pet Foods
Ingredient Applications Modified Starch
Unmodified Starch
DextrinMaltodextrin
Glucose/Corn Syrup
Dextrose
HFCS Corn Oil
Gluten Feed
Gluten Meal
Germ Meal
Steepwater
scFOS

32
Key Target – GAAP ReconciliationReturn on Capital Employed at December 31
($ millions)Return on Capital Employed 2006 2005Total stockholders’ equity* $1,210 $1,081
Add:
Cumulative translation adjustment* 257 292
Minority interest in subsidiaries* 17 18
Redeemable common stock* 29 33
Total debt* 528 568
Less:
Cash and cash equivalents* (116) (101)Capital employed* (a) $2,041 $1,992
Operating income $224 $183
Adjusted for:
Income taxes (at effective tax rates of 35.25% in 2006 and
37.5% in 2005) (79) (69)
Adjusted operating income, net of tax (b) $145 $114
Return on Capital Employed (b ÷ a) 7.5% 6.0%
* Balance sheet items used in computing capital employed represent beginning of period balances
33
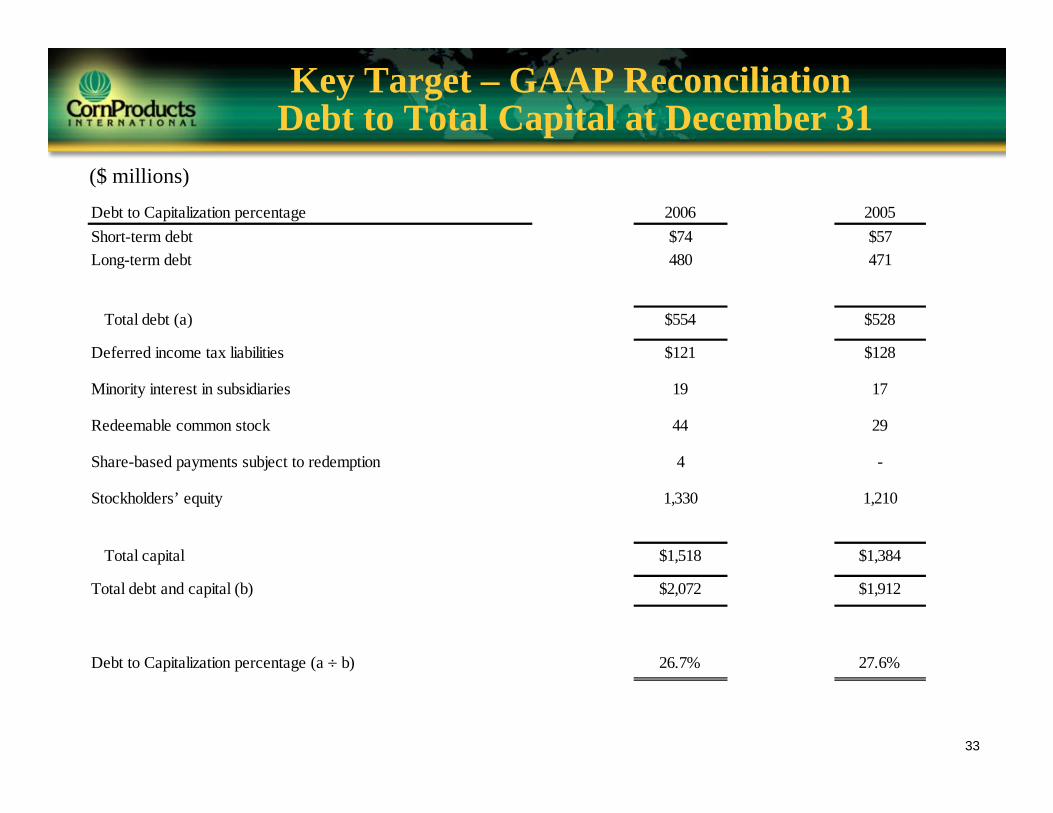
Key Target – GAAP ReconciliationDebt to Total Capital at December 31
($ millions)Debt to Capitalization percentage 2006 2005Short-term debt $74 $57 Long-term debt 480 471
Total debt (a) $554 $528
Deferred income tax liabilities $121 $128
Minority interest in subsidiaries 19 17
Redeemable common stock 44 29
Share-based payments subject to redemption 4 -
Stockholders’ equity 1,330 1,210
Total capital $1,518 $1,384
Total debt and capital (b) $2,072 $1,912
Debt to Capitalization percentage (a ÷ b) 26.7% 27.6%
34
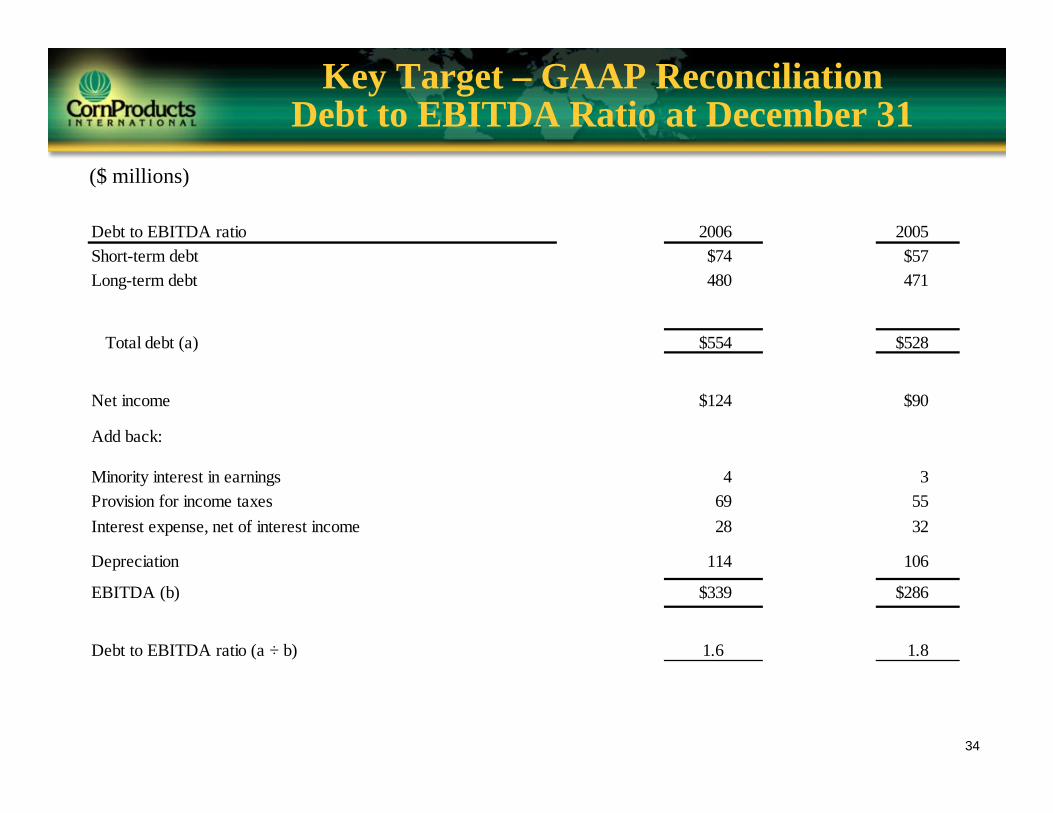
Key Target – GAAP ReconciliationDebt to EBITDA Ratio at December 31
($ millions)
Debt to EBITDA ratio 2006 2005Short-term debt $74 $57 Long-term debt 480 471
Total debt (a) $554 $528
Net income $124 $90
Add back:
Minority interest in earnings 4 3Provision for income taxes 69 55Interest expense, net of interest income 28 32
Depreciation 114 106
EBITDA (b) $339 $286
Debt to EBITDA ratio (a ÷ b) 1.6 1.8

35
Key Target – GAAP ReconciliationOperating Working Capital as % of Net Sales
($ millions)
Operating Working Capital as a percentage of Net Sales 2006 2005Current assets $837 $685
Less: Cash and cash equivalents (131) (116)Less: Deferred income tax assets (16) (13)Adjusted current assets $690 $556
Current liabilities $517 $424
Less: Short-term debt (74) (57)
Less: Deferred income tax liabilities (14) (1)
Adjusted current liabilities $429 $366
Operating working capital (a) $261 $190
Net sales (b) $2,621 $2,360 Operating Working Capital as a percentage of Net Sales (a ÷ b) 8.1%10.0%

36
Geographic Segments – Annual Net Sales/Operating Income 2001 through 2006
2006 2005 2004 2003 2002 2001Net sales
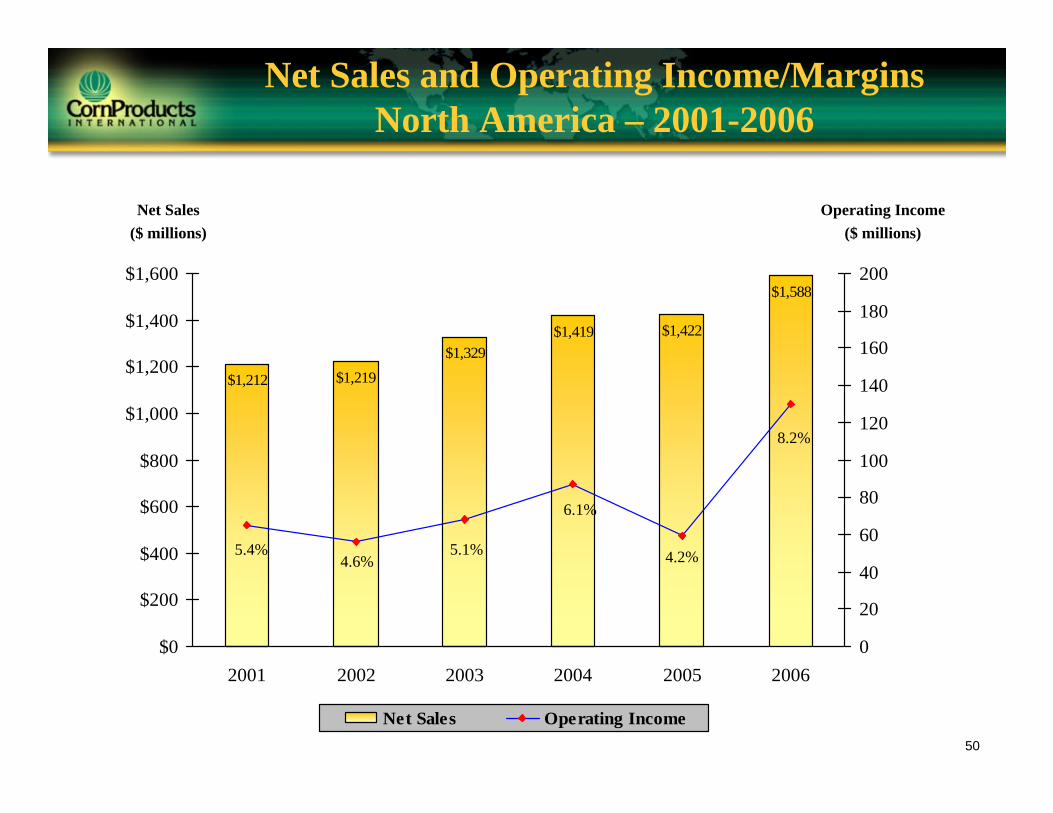
North America 1,588 1,422 1,419 1,329 1,219 1,212
South America 670 603 556 495 401 440
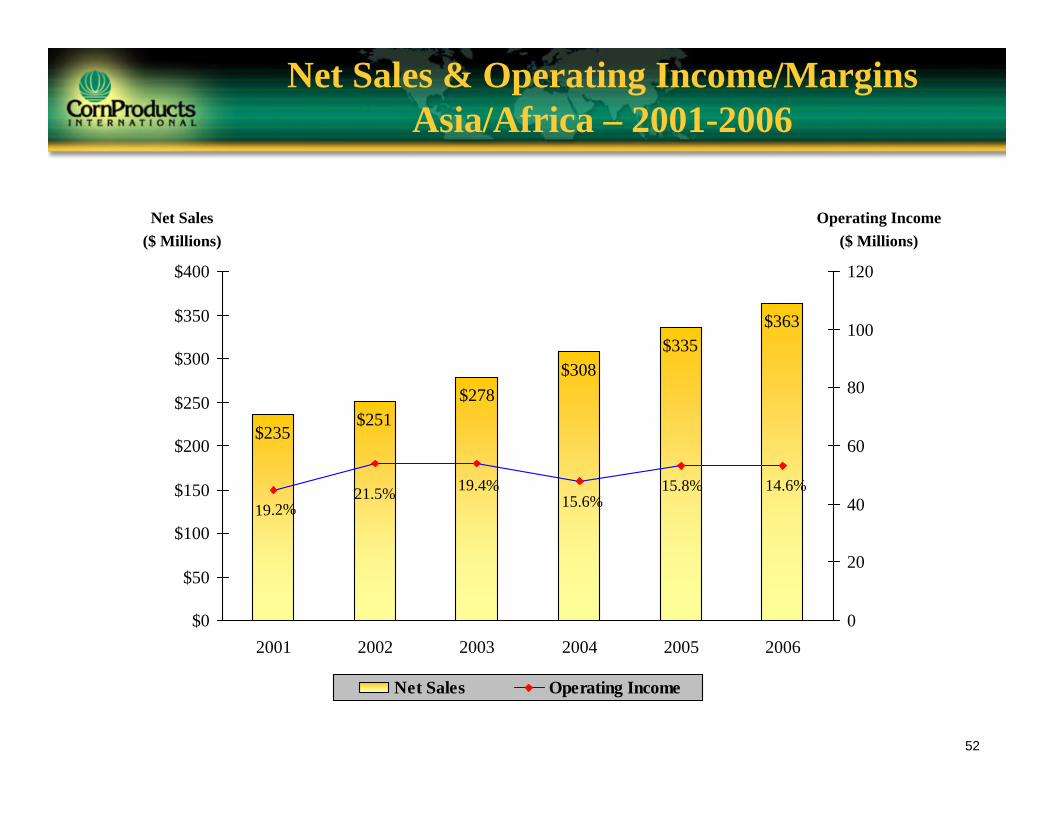
Asia/Africa 363 335 308 278 251 235
Total 2,621 2,360 2,283 2,102 1,871 1,887
Segment operating income*
North America 130 59 87 68 56 65
South America 84 101 98 83 58 68
Asia/Africa 53 53 48 54 54 45
Total operating income 224 183 179 174 153 166*Geographic segments only
($ millions)
37
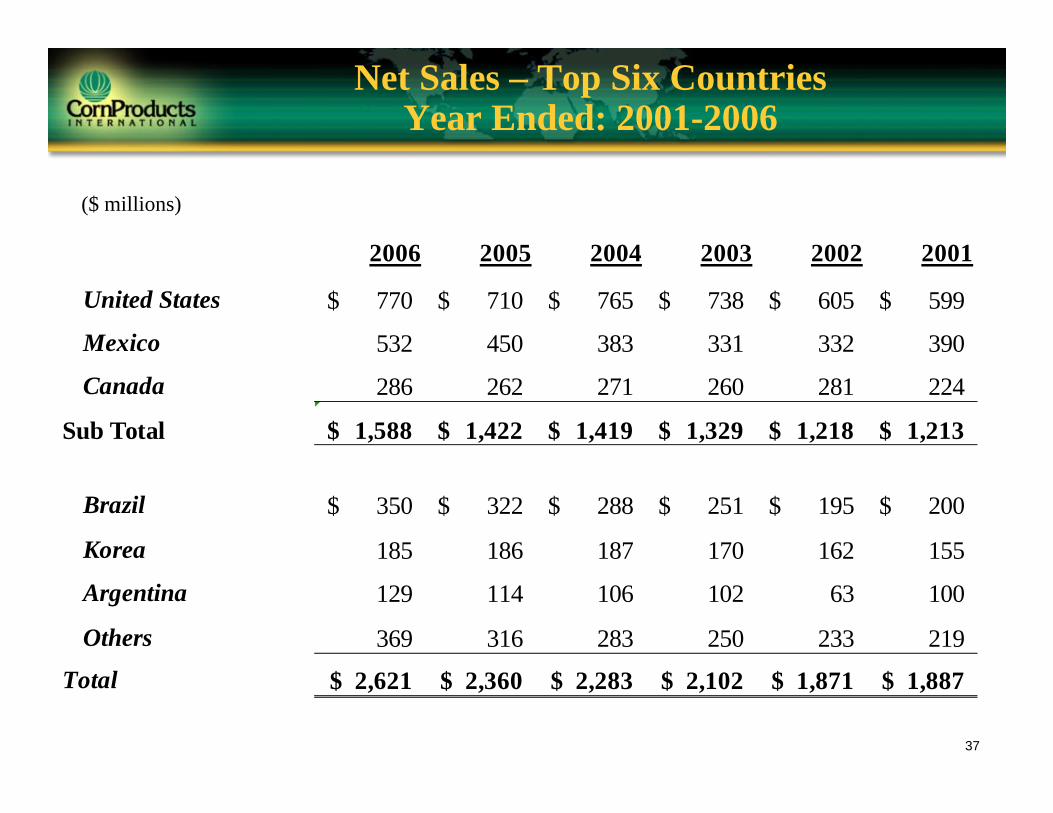
Net Sales – Top Six CountriesYear Ended: 2001-2006
2006 2005 2004 2003 2002 2001
United States 770$ 710$ 765$ 738$ 605$ 599$
Mexico 532 450 383 331 332 390
Canada 286 262 271 260 281 224
Sub Total 1,588$ 1,422$ 1,419$ 1,329$ 1,218$ 1,213$
Brazil 350$ 322$ 288$ 251$ 195$ 200$
Korea 185 186 187 170 162 155
Argentina 129 114 106 102 63 100
Others 369 316 283 250 233 219
Total 2,621$ 2,360$ 2,283$ 2,102$ 1,871$ 1,887$
($ millions)

38
Long-Lived Assets – Top Six Countriesas of December 31: 2001-2006
2006 2005 2004 2003 2002 2001
United States 465$ 428$ 407$ 406$ 433$ 434$
Mexico 365 382 401 426 433 457
Canada 171 176 173 165 147 151
Sub Total 1,001$ 986$ 981$ 997$ 1,013$ 1,042$
Brazil 219$ 160$ 125$ 112$ 88$ 131$
Korea 280 252 243 212 210 186
Argentina 125 120 117 116 67 135
Others 199 183 175 171 146 158
Total 1,824$ 1,701$ 1,641$ 1,608$ 1,524$ 1,652$
($ millions)

39
Percent of Net Sales
2006 2005 2004 2003 2002 2001
Starch 22% 23% 22% 21% 20% 20%
Sweeteners 55% 53% 52% 54% 55% 57%
Co-products & other 23% 24% 26% 25% 25% 23%
Major Industries
Processed foods 19% 19% 22% 21% 21% 22%
Soft drink 18% 18% 17% 17% 17% 20%
Brewing 11%
Animal feed 10% 11% 19% 19% 16% 15%

40
Summary Balance Sheet2006, 2005 and 2004
2006 2005 2004
Current assets 842$ 685$ 684$ Net fixed assets 1,356 1,274 1,211 Other assets 470 430 472 Total assets 2,668$ 2,389$ 2,367$
Current liabilities* 429$ 367$ 374$ Total debt 554 528 568 Other liabilities 307 255 311 Redeemable equity 44 29 33 Stockholders' equity 1,330 1,210 1,081 Total liabilities and equity 2,668$ 2,389$ 2,367$ *Excludes short-term debt
($ millions)

41
Summary Cash Flow2006, 2005 and 2004
2006 2005 2004
Cash flow from operations 230$ 245$ 166$ Net income 124 90 94 Depreciation 114 106 102 Working capital (increase)/decrease (27) 60 (37) Other 19 (11) 7
Cash flow from investing (210)$ (141)$ (149)$ Fixed assets, net (168) (136) (103) Acquisition (42) (5) (68) Sale of investment - - 21 Other - - 1
Cash flow from financing (6)$ (91)$ 13$ Net increase (decrease) in debt 16 (44) 6 Dividends paid to CPO common (26) (21) (17) Issuance (Repurchase) of common, net (2) (25) 30 Dividends paid to minority shareholders - (1) (6)
($ millions)
42
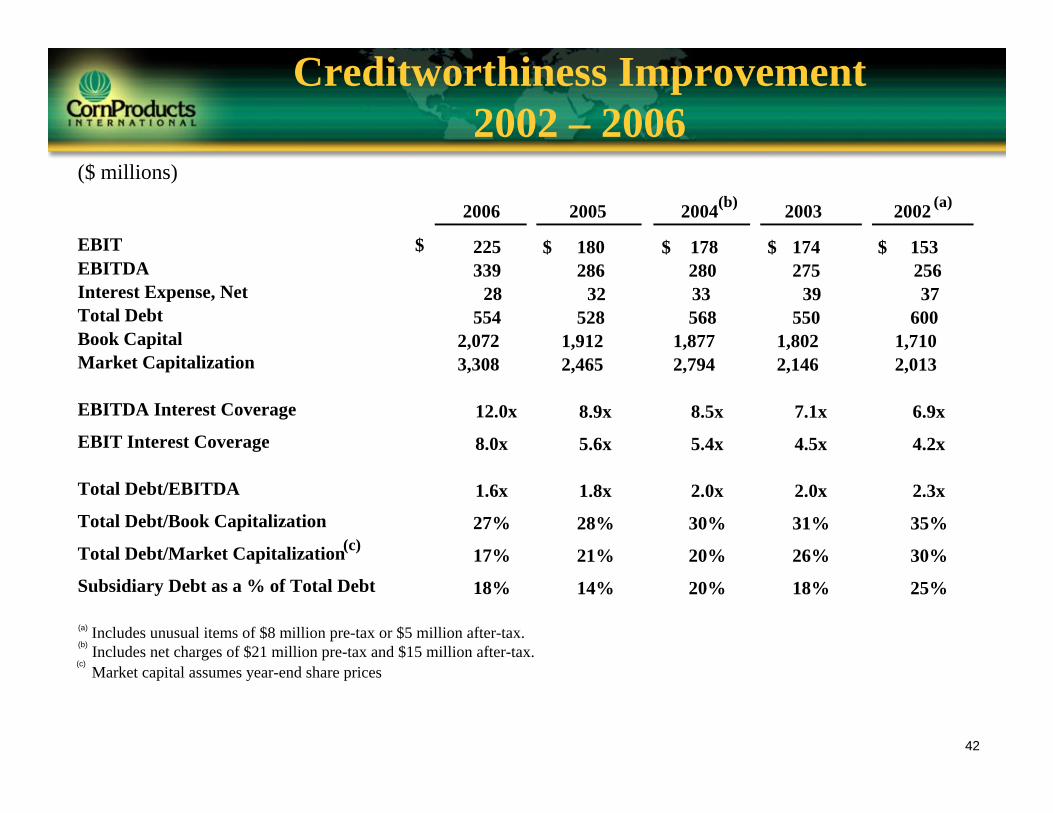
Creditworthiness Improvement2002 – 2006
($ millions)
EBITEBITDAInterest Expense, NetTotal DebtBook CapitalMarket Capitalization
EBITDA Interest Coverage
EBIT Interest Coverage
Total Debt/EBITDA
Total Debt/Book Capitalization
Total Debt/Market Capitalization
Subsidiary Debt as a % of Total Debt
2005 2004(b) 2003 2002 (a)
180$ 178$ 174$ 153$ 286 280 275 256
32 33 39 37528 568 550 600
1,912 1,877 1,802 1,7102,465 2,794 2,146 2,013
8.9x 8.5x 7.1x 6.9x
5.6x 5.4x 4.5x 4.2x
1.8x 2.0x 2.0x 2.3x
28% 30% 31% 35%
21% 20% 26% 30%
14% 20% 18% 25%
2006
(c)
225339
28554
2,0723,308
12.0x
8.0x
1.6x
27%
17%
18%
(a) Includes unusual items of $8 million pre-tax or $5 million after-tax.(b) Includes net charges of $21 million pre-tax and $15 million after-tax.(c)
Market capital assumes year-end share prices
$
43
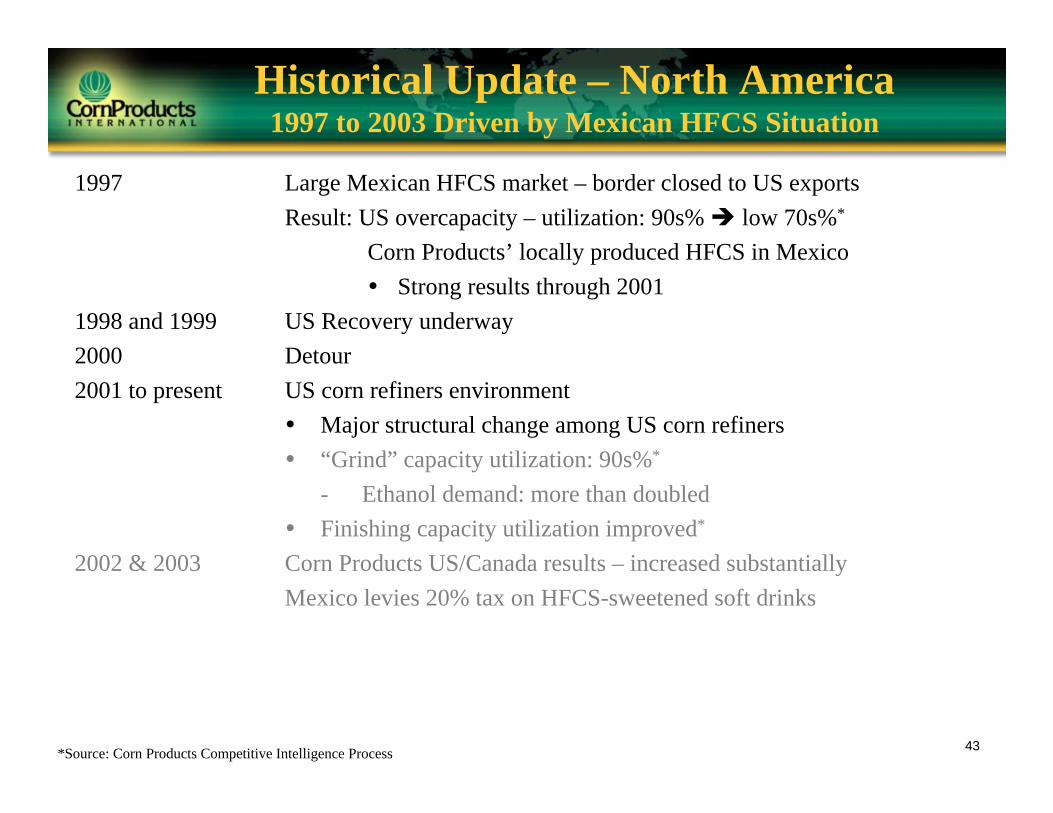
Historical Update – North America1997 to 2003 Driven by Mexican HFCS Situation
*Source: Corn Products Competitive Intelligence Process
1997 Large Mexican HFCS market – border closed to US exportsResult: US overcapacity – utilization: 90s% low 70s%*
Corn Products’ locally produced HFCS in MexicoStrong results through 2001
1998 and 1999 US Recovery underway2000 Detour2001 to present US corn refiners environment
Major structural change among US corn refiners“Grind” capacity utilization: 90s%*
- Ethanol demand: more than doubledFinishing capacity utilization improved*
2002 & 2003 Corn Products US/Canada results – increased substantiallyMexico levies 20% tax on HFCS-sweetened soft drinks

44*Source: Corn Products International Competitive Intelligence Process**Source: Associated Press, August 17, 2004 ; ***Source: Decatur Daily, October 4, 2005
Competitive arena*: US HFCS processor company changes
November 2000: 7 HFCS producers – 3 with 17% of capacity
March 2002 thru present: 4 HFCS producers with 97% of capacity
Historical Update – North America
ProGold MCP Cerestar
Cargill
Cargill ADM 30%
CPMCP
ADM
Coors
Gone1997
2000
2002
2004
2005
2006
Cargill
Shuts ½ Dayton
Idles Dimmitt, TX**
Idles Decatur, AL***
Restarts Decatur, AL

45*Source: Corn Products Competitive Intelligence Process
1997 Large Mexican HFCS market – border closed to US exportsResult: US overcapacity – utilization: 90s% low 70s%*
CPO’s locally produced HFCS in MexicoStrong results through 2001
1998 and 1999 US Recovery underway2000 Detour2001 to present US corn refiners environment
Major structural change among U.S. corn refiners“Grind” capacity utilization: 90s%*
- Ethanol demand: more than doubledFinishing capacity utilization improved*
2002 & 2003 CPO US/Canada Operating Income – increased substantiallyMexico – 20% tax on HFCS-sweetened soft drinks
Except for ethanolNo expansions since 1997*
Historical Update – North America1997 to 2003 Driven by Mexican HFCS Situation

46
High Value Ingredients• Product differentiation• Internal source
– Line extensions– New ingredient commercialization
• External source– Acquisitions– Alliances
Basic Ingredients• No product differentiation• Commodity-oriented pricing• Advances
– Quality, timeliness, reliability– Ingredient supplier approach
• Geographic growth
High Value Specialty Ingredients
• IP-based differentiation• Alliances • Acquisitions• New ingredient commercialization
Specialty Ingredients
• Product/service differentiation• Line extensions • Success as ingredient supplier
Value
Spec
ializ
atio
nOur Approach …
Ingredient Positioning
47
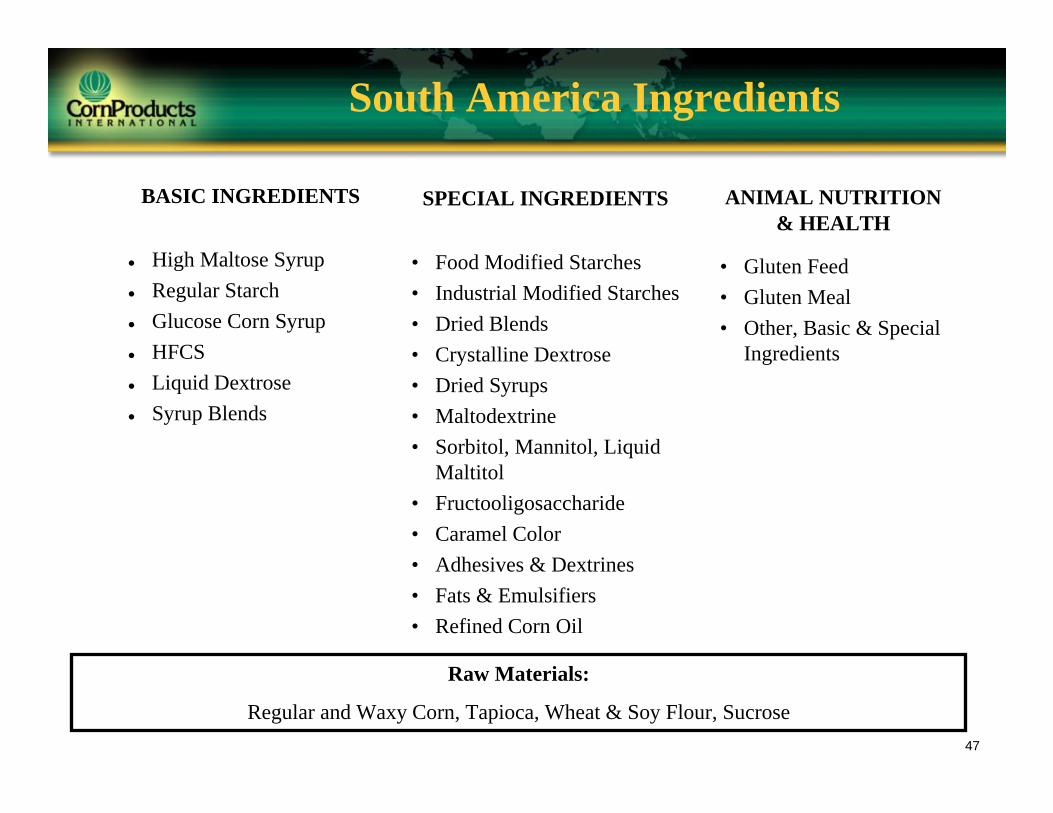
South America Ingredients
BASIC INGREDIENTS
High Maltose Syrup Regular StarchGlucose Corn SyrupHFCSLiquid DextroseSyrup Blends
SPECIAL INGREDIENTS
• Food Modified Starches• Industrial Modified Starches• Dried Blends• Crystalline Dextrose• Dried Syrups• Maltodextrine• Sorbitol, Mannitol, Liquid
Maltitol• Fructooligosaccharide• Caramel Color• Adhesives & Dextrines• Fats & Emulsifiers• Refined Corn Oil
ANIMAL NUTRITION & HEALTH
• Gluten Feed• Gluten Meal• Other, Basic & Special
Ingredients
Raw Materials:
Regular and Waxy Corn, Tapioca, Wheat & Soy Flour, Sucrose

48
Net Sales & Operating Income/MarginsSouth America – 2001-2006
$440$401
$495$556
$603
$670
$0
$200
$400
$600
$800
2001 2002 2003 2004 2005 20060
20
40
60
80
100
120
140
160
180
200
Net Sales Operating Income
Net Sales($ Millions)
Operating Income($ Millions)
16.8%
17.6% 16.8%12.5%
14.5%15.5%

49
North America Ingredients
BASIC INGREDIENTS
HFCSCorn StarchCorn SyrupLiquid DextroseBlends
SPECIAL INGREDIENTS
• Refined Corn Oil• Crystalline Dextrose• Modified Starches• Maltodextrine• Sorbitol• Fructooligosaccharide• Caramel Color
ANIMAL NUTRITION & HEALTH
• Gluten Feed• Gluten Meal• Other
50
Net Sales and Operating Income/MarginsNorth America – 2001-2006
$1,588
$1,422$1,419
$1,219$1,212
$1,329
$0
$200
$400
$600
$800
$1,000
$1,200
$1,400
$1,600
2001 2002 2003 2004 2005 20060
20
40
60
80
100
120
140
160
180
200
Net Sales Operating Income
Net Sales($ millions)
Operating Income($ millions)
5.1%
6.1%
4.2%
8.2%
4.6%5.4%

51
Asia/Africa Ingredients
BASIC INGREDIENTS
Corn StarchCorn SyrupHFCSTapioca StarchTapioca SyrupDextrose
SPECIAL INGREDIENTS
• Refined Corn Oil• Modified Textile starch• Modified Paper Starch• High Maltose Syrup• Dextrines• Tapioca Oxidized Starch• Tapioca Maltodextrine• Oligosaccharides
ANIMAL NUTRITION & HEALTH
• Gluten Feed• Gluten Meal• Other
52
Net Sales & Operating Income/MarginsAsia/Africa – 2001-2006
$235$251
$278$308
$335$363
$0
$50
$100
$150
$200
$250
$300
$350
$400
2001 2002 2003 2004 2005 20060
20
40
60
80
100
120
Net Sales Operating Income
Net Sales($ Millions)
Operating Income($ Millions)
19.4%15.6%
15.8% 14.6%21.5%19.2%

53
Specialty Ingredients Examples of Progress
• Food starches - specialties– Variety of raw materials: corn – dent and waxy; tapioca; blends
• Applications: sauces, mayonnaise, dressings, frozen desserts, yogurt, beverages, flavors
• Types: cross-bonded and pregelatinized, OSA, HPS and CSW starches• ExpandexTM modified tapioca starch for gluten intolerance market• Industrial starches
– Ecopolymers for plastic replacement– Casein-based adhesive for labeling– Pregelatinized starch for mining and tissue– Acetylated thin-boiling waxy starch for paper coating
• Health and personal care– OSA aluminum and calcium for creams– Cationic starch for softener– Sorbitol for tooth paste and tableting

54
CornBasic Structure and Approximate Yield*
Kernel Structure• Hull – Fiber• Starch• Protein• Germ
Approximate Yield• Starch 68%• Gluten Feed 19%• Gluten Meal 5%• Germ
– Corn oil 4%– Germ meal 3%
*Note: These are only approximations due to our use of varieties of hybrids throughout our world


