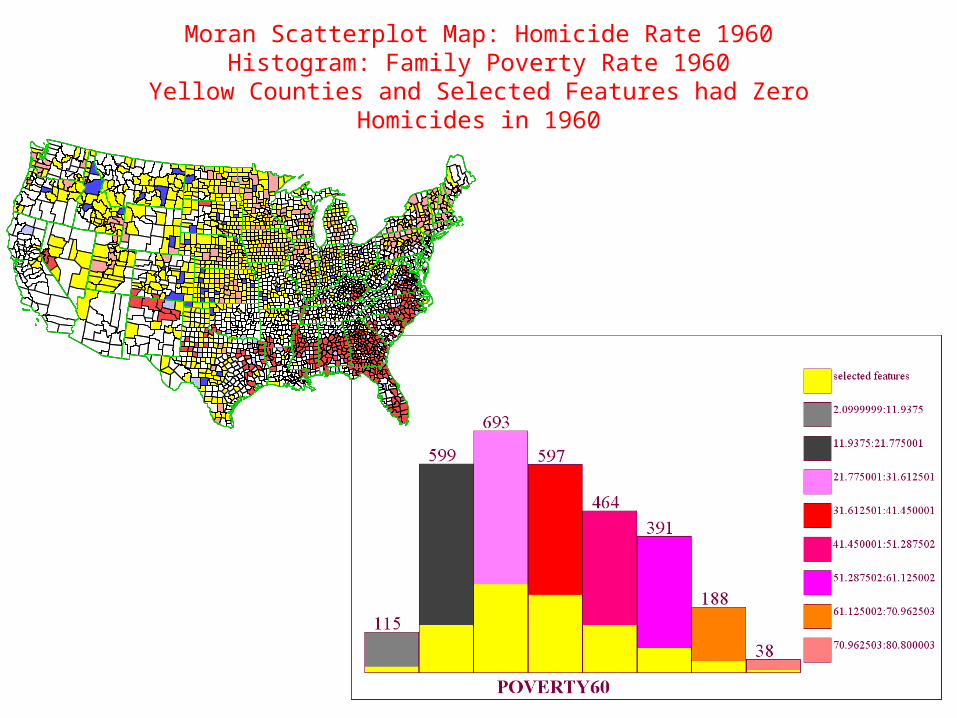
Moran Scatterplot Map: Homicide Rate 1960Histogram: Family Poverty Rate 1960
Yellow Counties and Selected Features had Zero Homicides in 1960
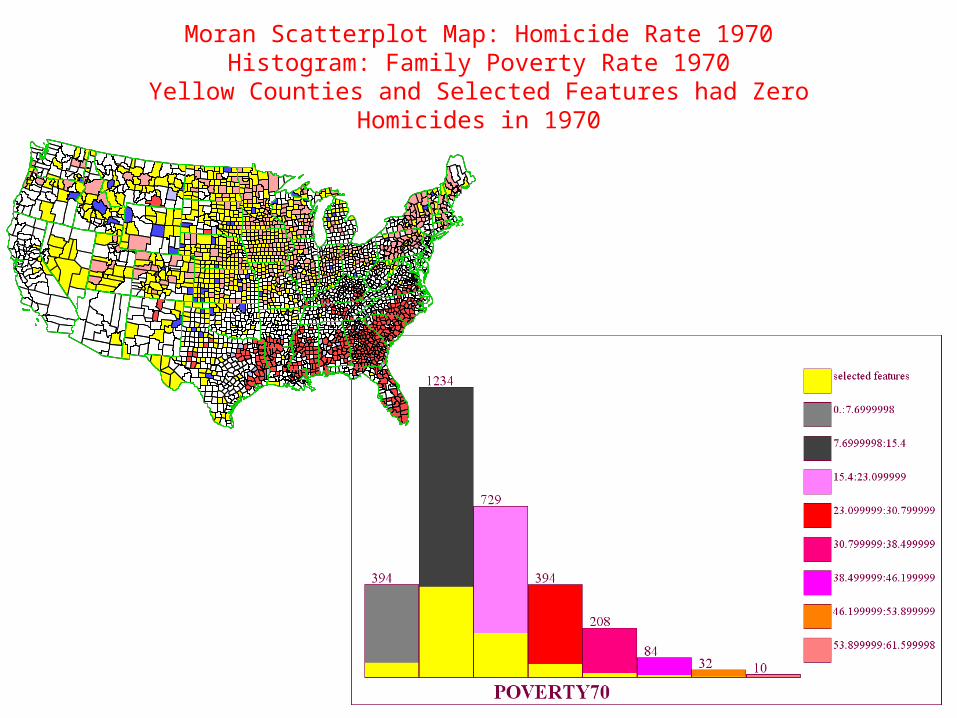
Moran Scatterplot Map: Homicide Rate 1970Histogram: Family Poverty Rate 1970
Yellow Counties and Selected Features had Zero Homicides in 1970

Moran Scatterplot Map: Homicide Rate 1980Histogram: Family Poverty Rate 1980
Yellow Counties and Selected Features had Zero Homicides in 1980
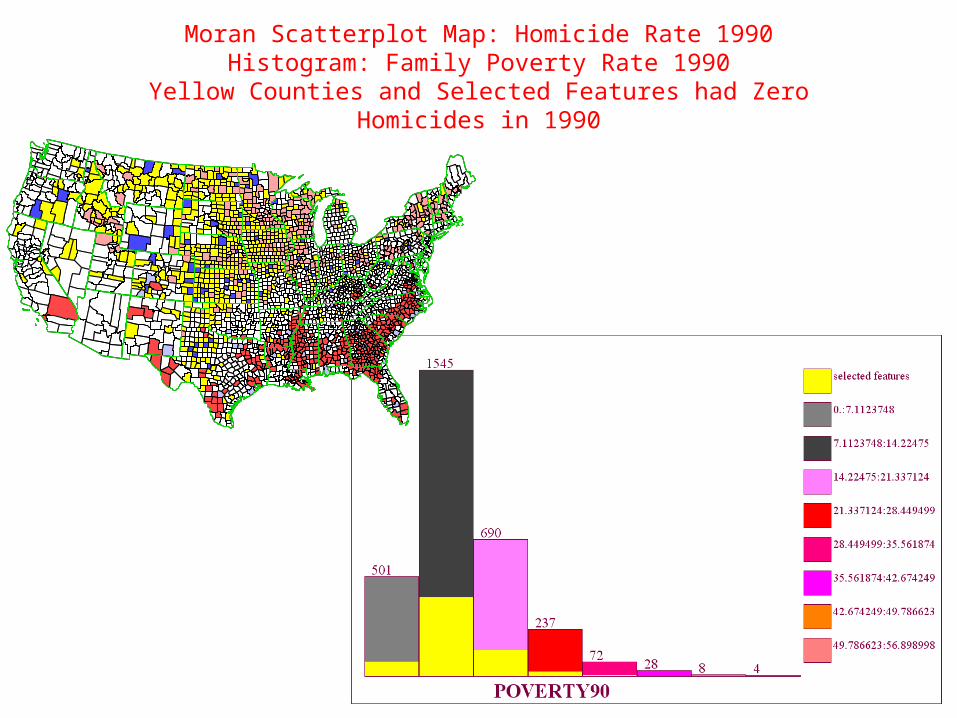
Moran Scatterplot Map: Homicide Rate 1990Histogram: Family Poverty Rate 1990
Yellow Counties and Selected Features had Zero Homicides in 1990

Moran Scatterplot Map: Homicide Rate 1960Histogram: Logged Population Density 1960
Yellow Counties and Selected Features had Zero Homicides in 1960

Moran Scatterplot Map: Homicide Rate 1970Histogram: Logged Population Density 1970
Yellow Counties and Selected Features had Zero Homicides in 1970
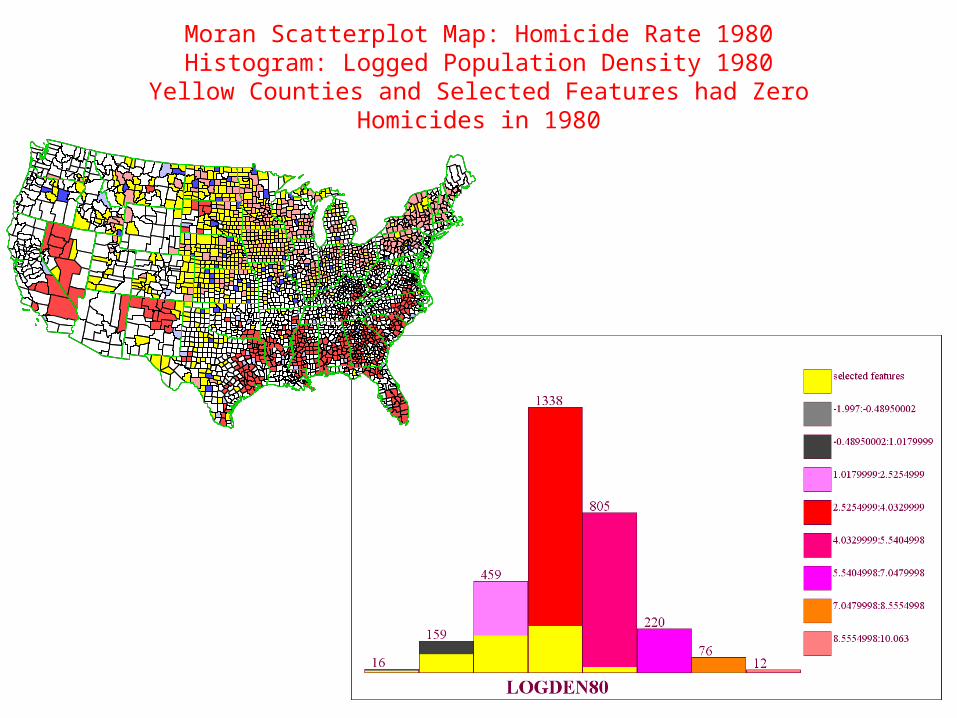
Moran Scatterplot Map: Homicide Rate 1980Histogram: Logged Population Density 1980
Yellow Counties and Selected Features had Zero Homicides in 1980
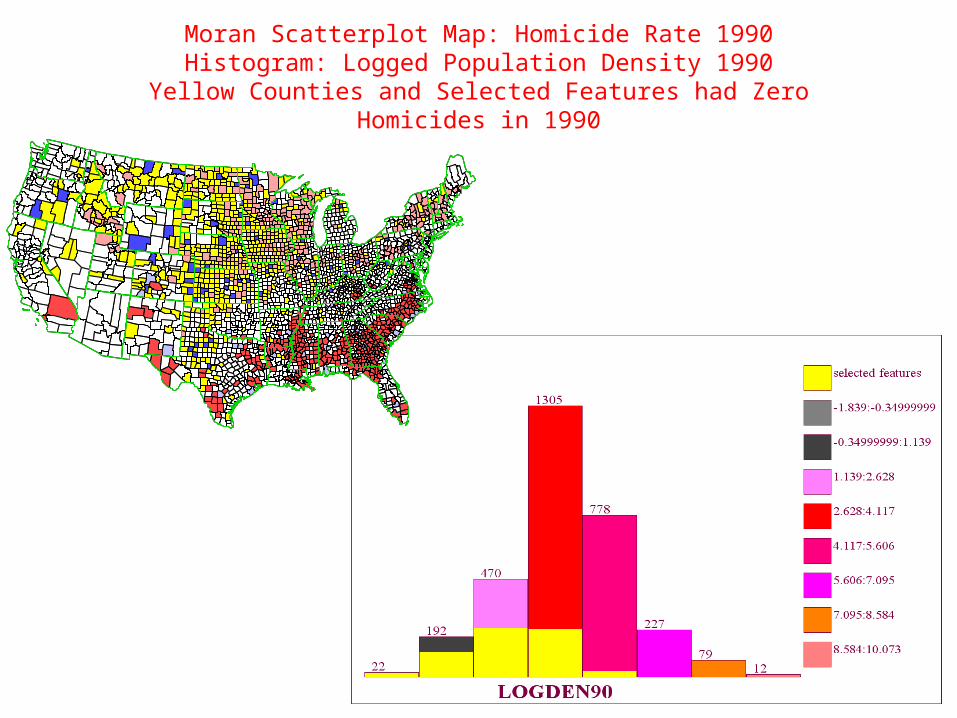
Moran Scatterplot Map: Homicide Rate 1990Histogram: Logged Population Density 1990
Yellow Counties and Selected Features had Zero Homicides in 1990

Moran Scatterplot Map: Homicide Rate 1960Histogram: Divorce Rate 1960
Yellow Counties and Selected Features had Zero Homicides in 1960
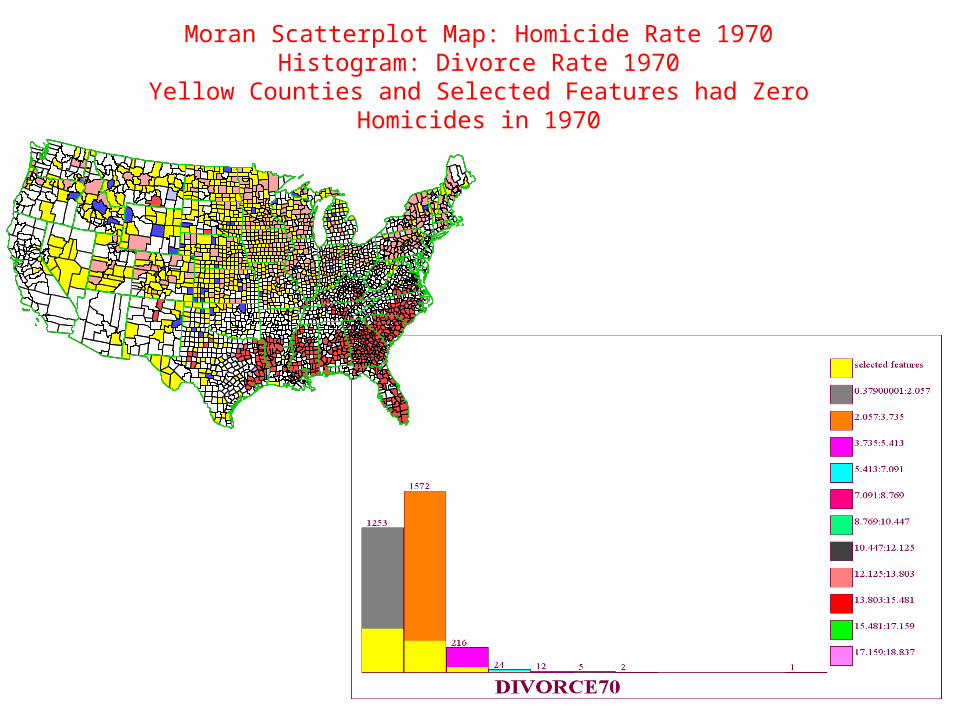
Moran Scatterplot Map: Homicide Rate 1970Histogram: Divorce Rate 1970
Yellow Counties and Selected Features had Zero Homicides in 1970
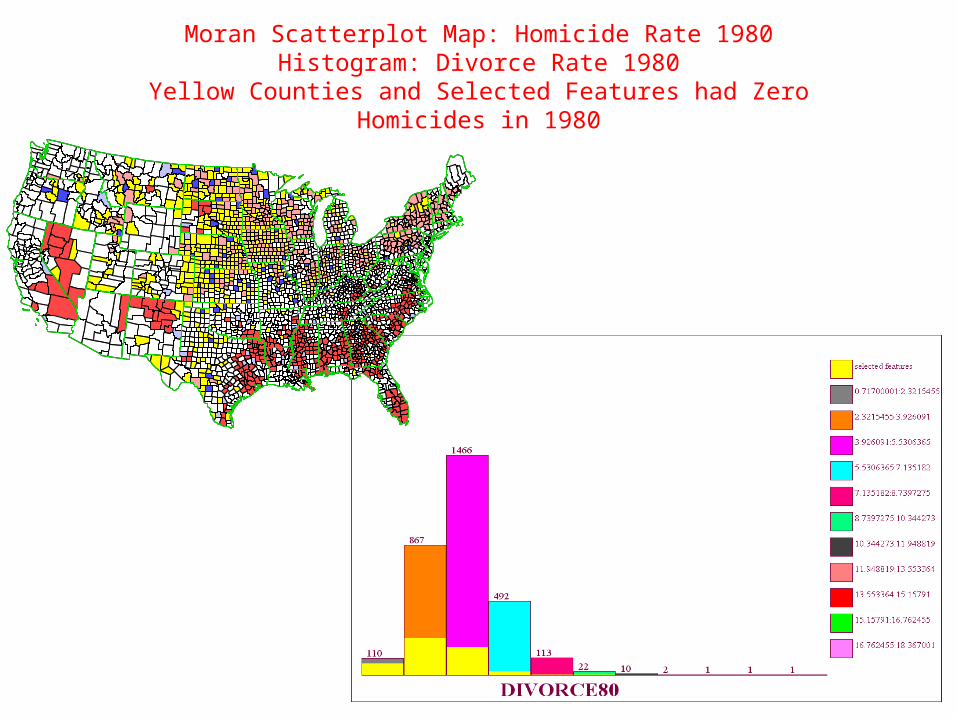
Moran Scatterplot Map: Homicide Rate 1980Histogram: Divorce Rate 1980
Yellow Counties and Selected Features had Zero Homicides in 1980

Moran Scatterplot Map: Homicide Rate 1990Histogram: Divorce Rate 1990
Yellow Counties and Selected Features had Zero Homicides in 1990


