

Introduction
• Both external and internal economies of scale are important causes of international trade.
• In this lecture we’ll see how internal economies of scale lead to monopolistic competition and trade
Introduction
• Ricardo and Hecksher-Ohlin predict countries that are most different should trade more, and should trade different goods
• Yet a lot of world trade is between similar countries, in similar goods– This is known as intra-industry trade
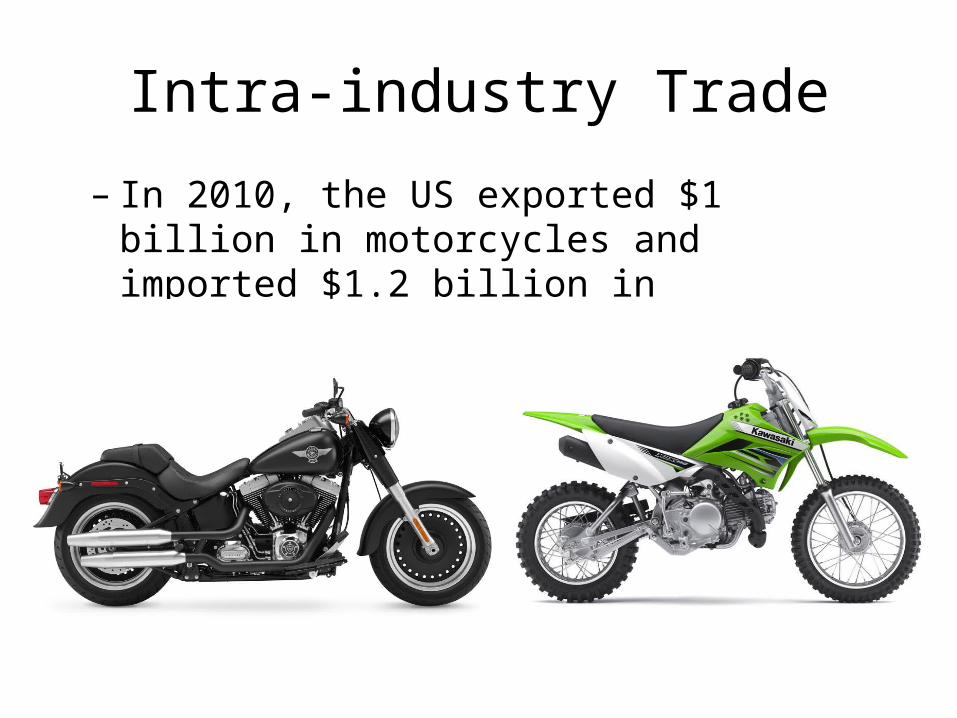
– In 2010, the US exported $1 billion in motorcycles and imported $1.2 billion in motorcycles!
Intra-industry Trade

Intra-industry Trade
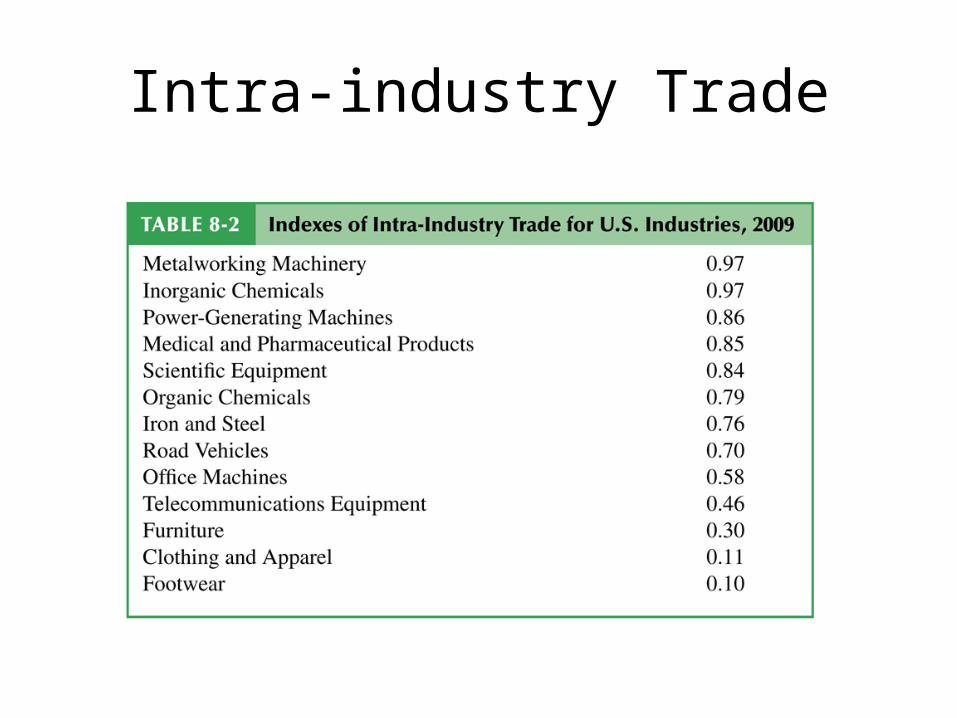
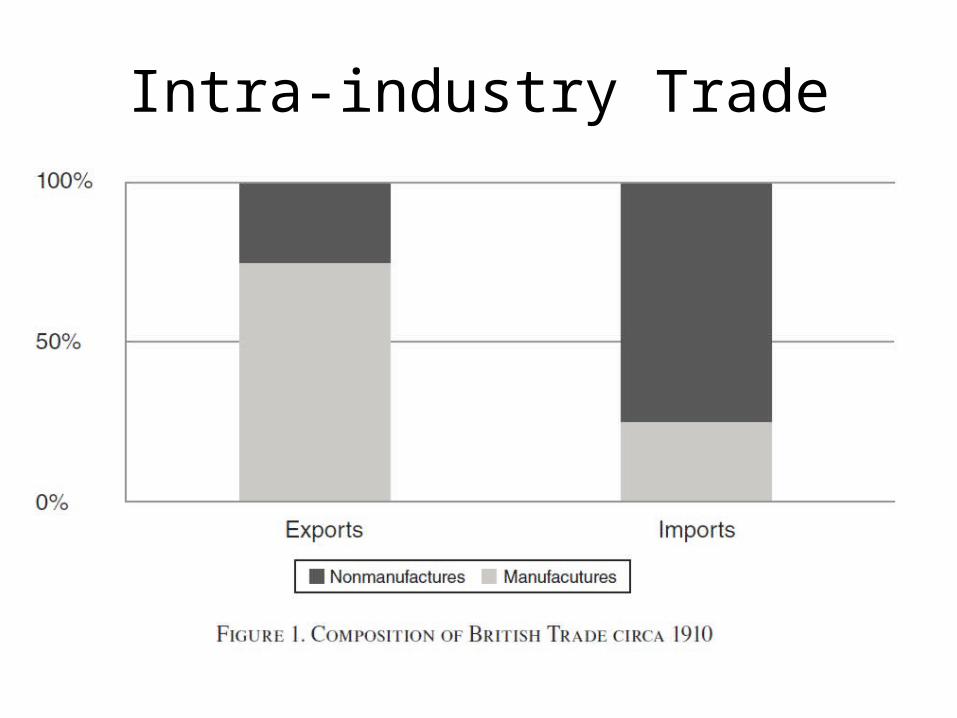
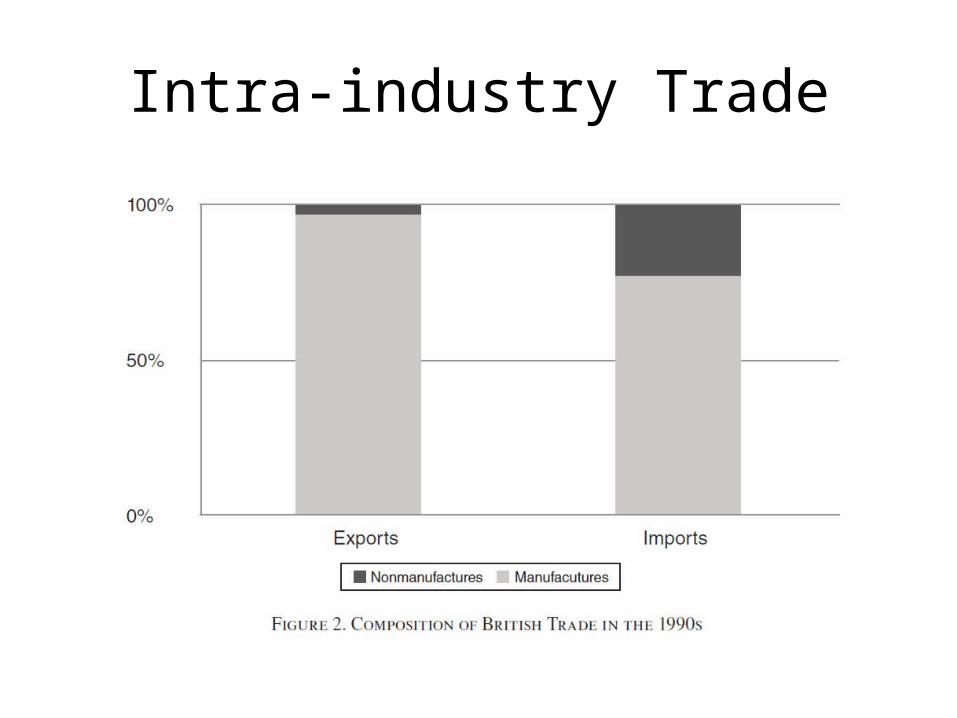
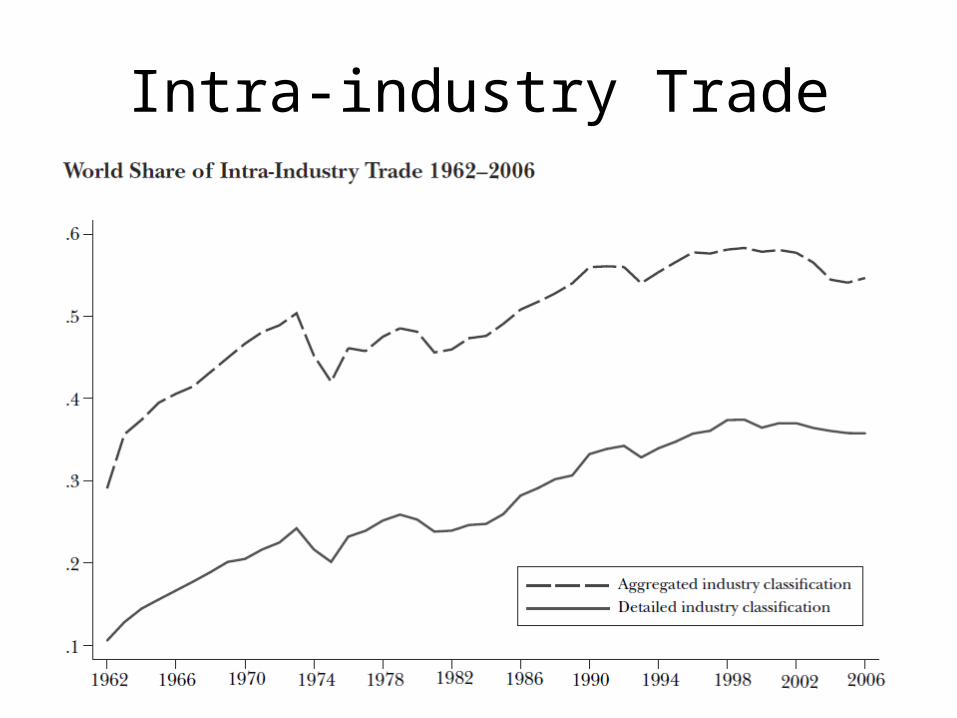
• Intra-industry trade refers to two-way exchanges of similar goods.
• About 25–50% of world trade is intra-industry.
• Trade of manufactured goods among advanced industrial nations accounts for the majority of world trade
Intra-industry Trade
Intra-industry Trade
Intra-industry Trade
Intra-industry Trade
Intra-industry Trade
Intra-industry Trade
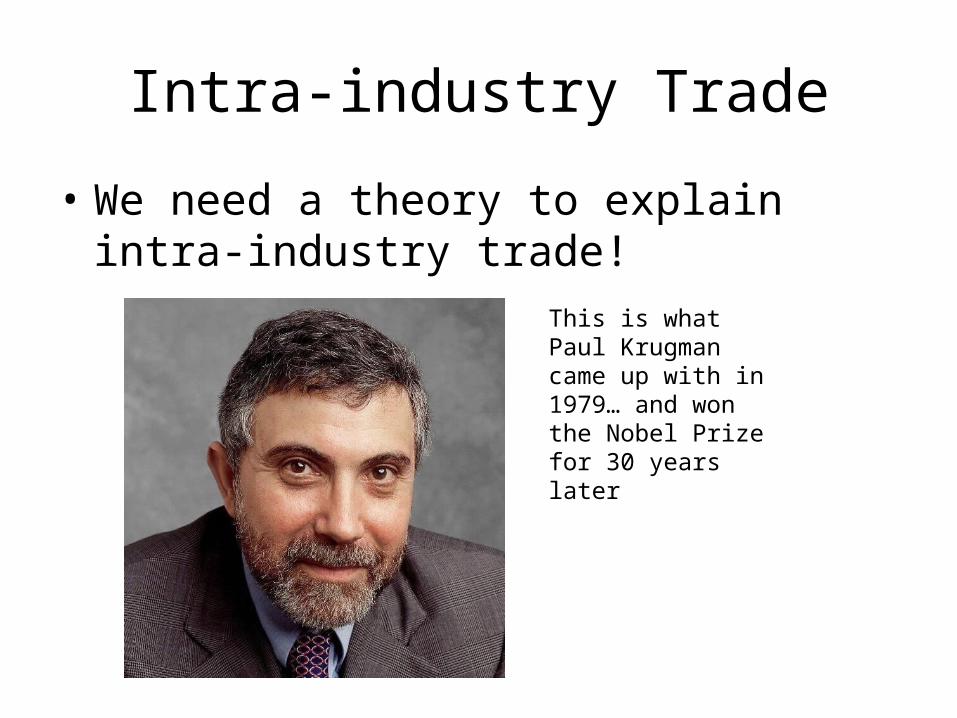
• We need a theory to explain intra-industry trade!
This is what Paul Krugman came up with in 1979… and won the Nobel Prize for 30 years later
Intra-industry Trade
• We need a theory to explain intra-industry trade!
Krugman, Paul R., 1979. "Increasing returns, monopolistic competition, and international trade," Journal of International Economics, vol. 9(4), pages 469-479, November.
Paul Krugman, 2009. "The Increasing Returns Revolution in Trade and Geography," American Economic Review, American Economic Association, vol. 99(3), pages 561-71, June.
Monopolistic competition
• Internal economies of scale imply that a firm’s average cost of production decreases the more output it produces.
• Large firms have a cost advantage over small firms
• This causes the industry to become uncompetitive and consist of a monopoly or of a few large firms as small firms become uncompetitive
• In monopolistic (or imperfect) competition, firms can influence the prices of their products and sell more by reducing their price
• This situation occurs when there are only a few major producers of a particular good or when each firm produces a good that is differentiated from that of rival firms.
• Each firm views itself as a price setter, choosing the price of its product. Firms have market power.
Monopolistic competition

Monopolistic competition
• In competitive markets, such as the wheat market, farmers don’t worry about selling more wheat as it won’t affect prices
Monopolistic competition
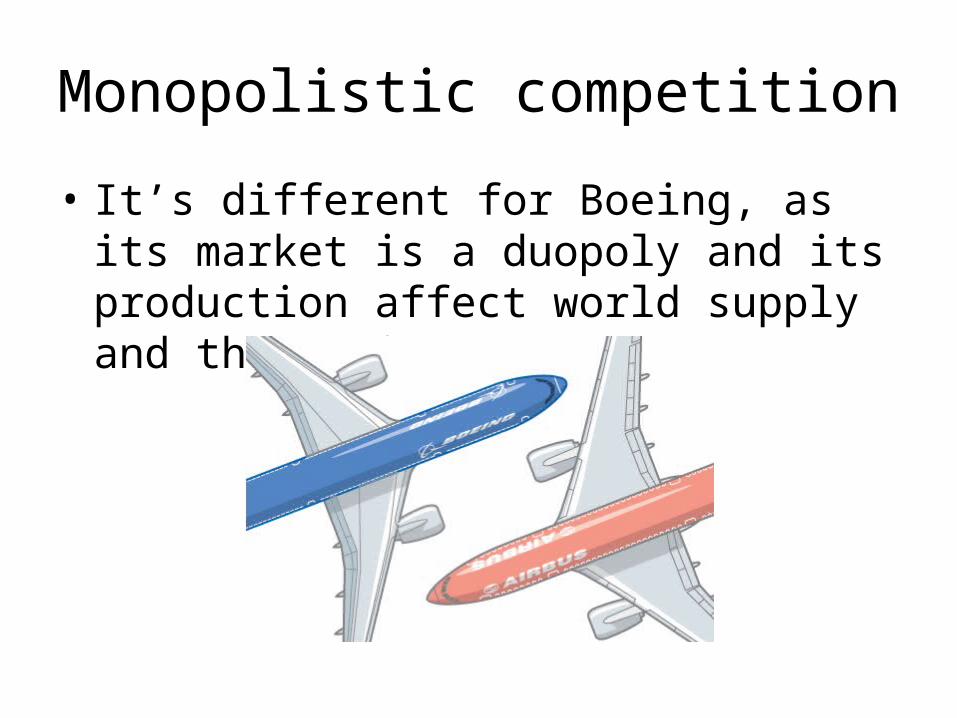
• It’s different for Boeing, as its market is a duopoly and its production affect world supply and thus prices
Monopolistic competition
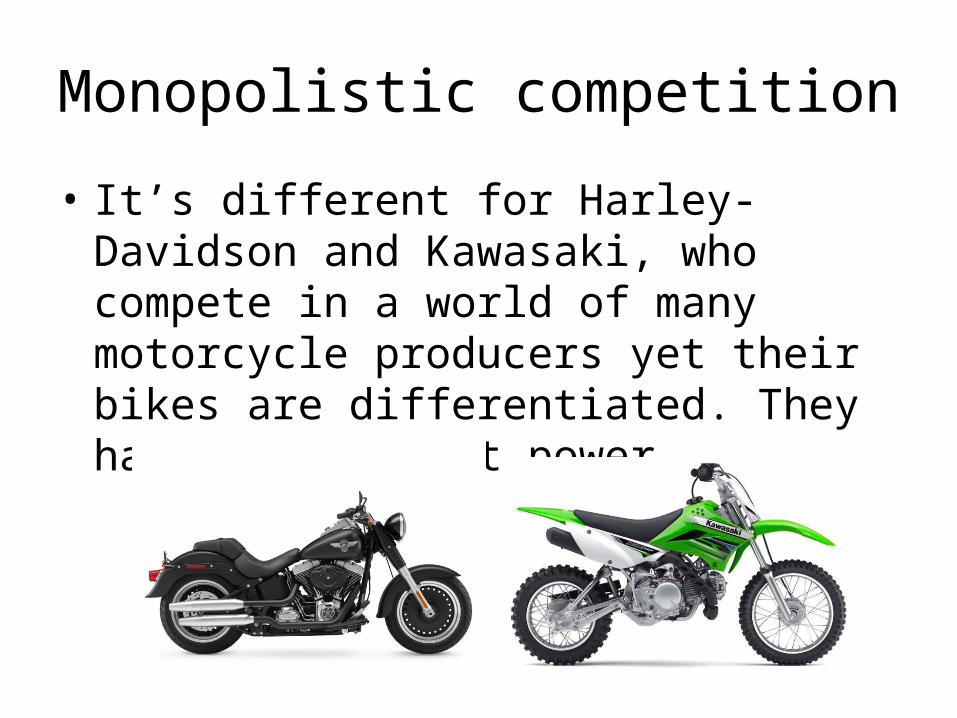
• It’s different for Harley-Davidson and Kawasaki, who compete in a world of many motorcycle producers yet their bikes are differentiated. They have some market power.

Monopolistic competition
• Before we dig into monopolistic competition, let’s do a refresher on monopoly theory
• A monopoly is an industry with only one firm
Monopoly: A Brief Review
• Suppose that the firm’s total costs are C = F + c × Q– F is fixed costs, those independent of the level of output – c is the constant marginal cost.
• Marginal cost is the cost of producing an additional unit of output.
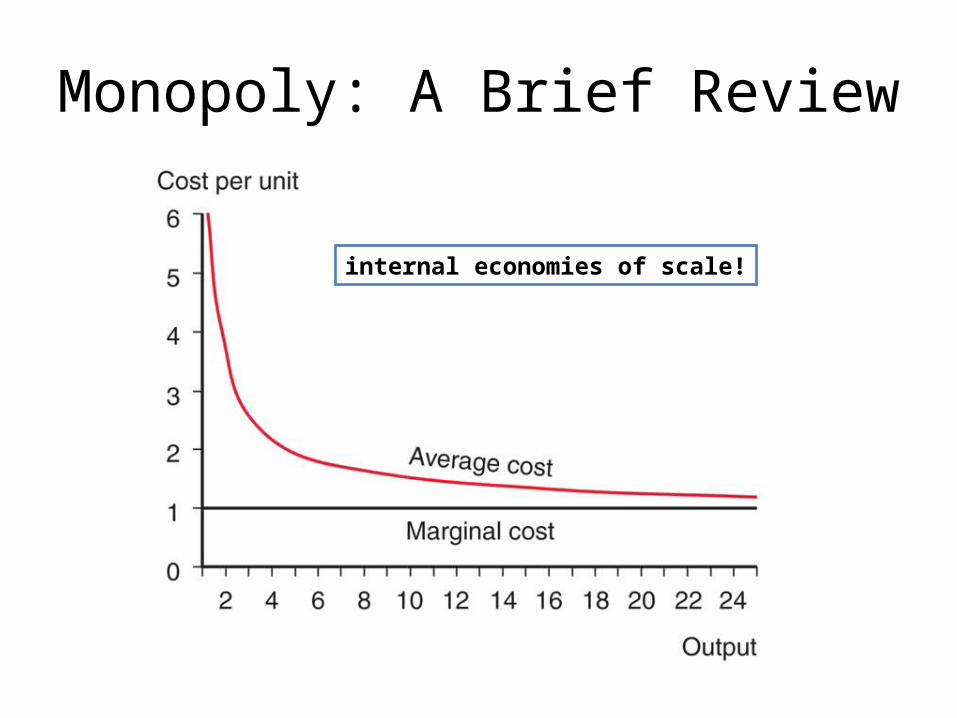
• Average cost is the cost of production (C) divided by the total quantity of production (Q).
AC = C/Q = F/Q + c
• A larger firm is more efficient because average cost decreases as output Q increases: internal economies of scale!
Monopoly: A Brief Review
internal economies of scale!
Monopoly: A Brief Review
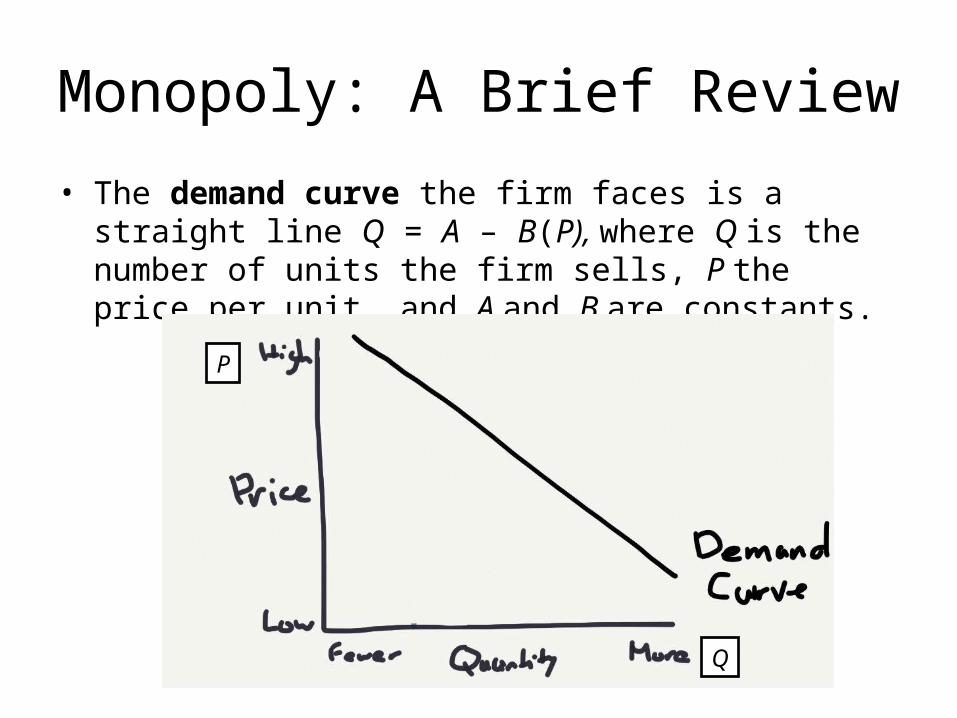
• The demand curve the firm faces is a straight line Q = A – B(P), where Q is the number of units the firm sells, P the price per unit, and A and B are constants.
Q
P
Monopoly: A Brief Review
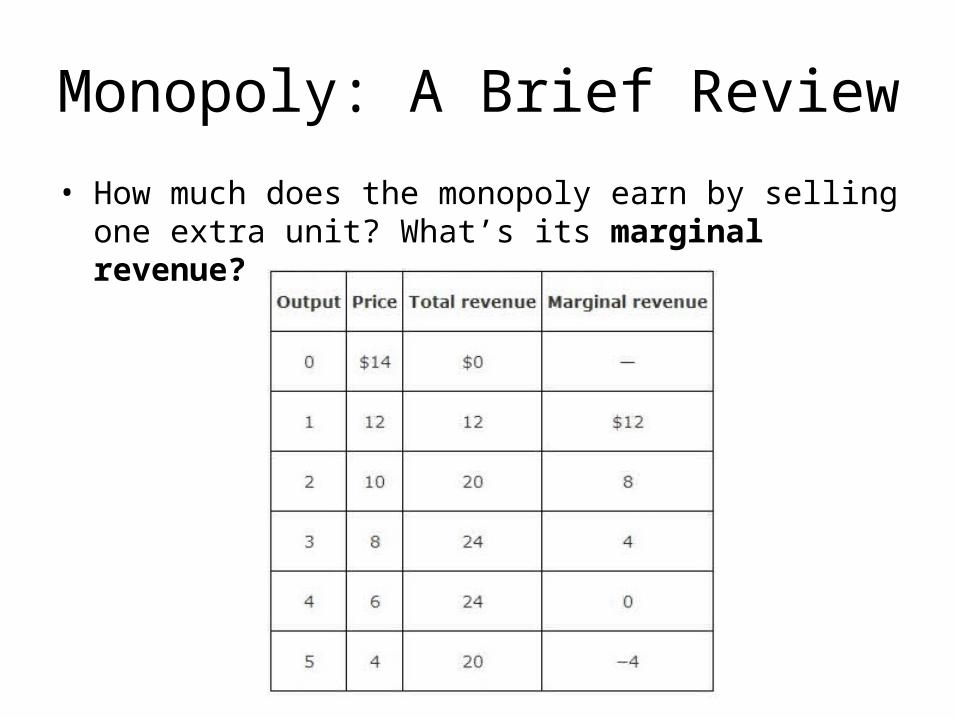
• How much does the monopoly earn by selling one extra unit? What’s its marginal revenue?

Monopoly: A Brief Review
• How much does the monopoly earn by selling one extra unit? What’s its marginal revenue?
That’s the demand curve
Monopoly: A Brief Review
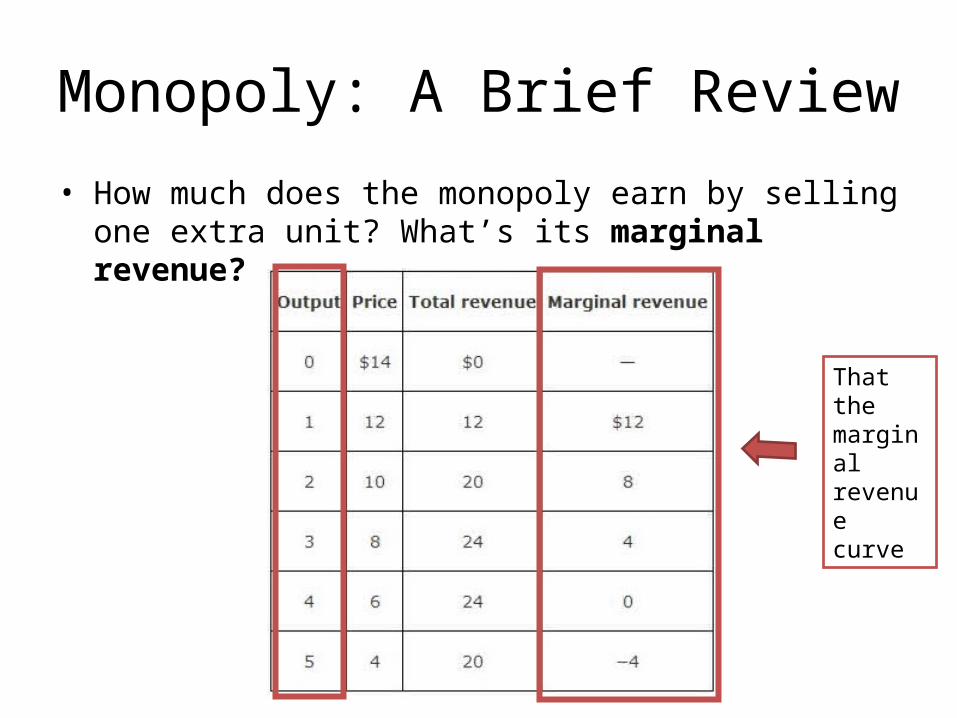
• How much does the monopoly earn by selling one extra unit? What’s its marginal revenue?
That the marginal revenue curve
Monopoly: A Brief Review
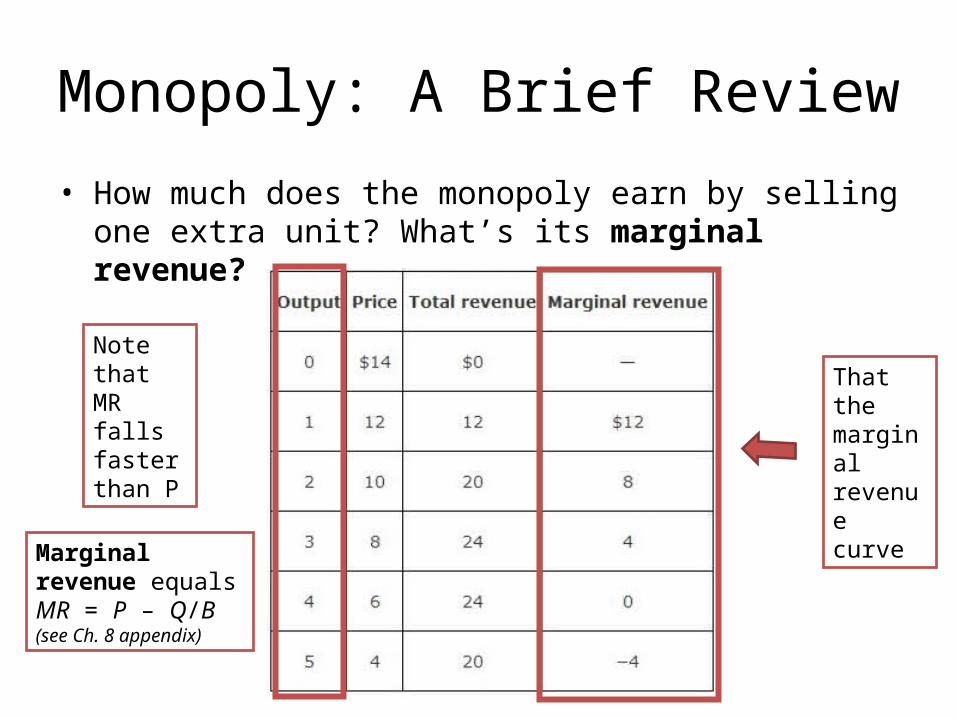
• How much does the monopoly earn by selling one extra unit? What’s its marginal revenue?
That the marginal revenue curve
Note that MR falls faster than P
Marginal revenue equals MR = P – Q/B(see Ch. 8 appendix)

Monopoly: A Brief Review
• The profit-maximizing output occurs where marginal revenue equals marginal cost.– At the intersection of the MC and MR curves, the
revenue gained from selling an extra unit equals the cost of producing that unit.
• The monopolist earns some monopoly profits, as indicated by the shaded box, when P > AC.
Monopoly: A Brief Review
Monopolistic Competition
• Monopolistic competition is a model of an imperfectly competitive industry where each firm
1. can differentiate its product (that gives it some monopoly power), and
2. takes the prices charged by its rivals as given (it ignores the impact of its own price on the prices of other firms)
Monopolistic Competition
– Product differentiation describes quite well the manufacturing products traded around the world• Buyers of iPhones do not think of Samsung Galaxies as
perfect substitutes
• But the market demand for iPhones does depend on the number of imperfect substitutes and their price
Monopolistic Competition (cont.)
• A firm in a monopolistic competition industry is expected to sell– more the larger the industry demand and the
higher the prices charged by rivals
– less the larger the number of competing firms in the industry and the higher the firm’s price
• These concepts are represented by the function:
Monopolistic Competition (cont.)
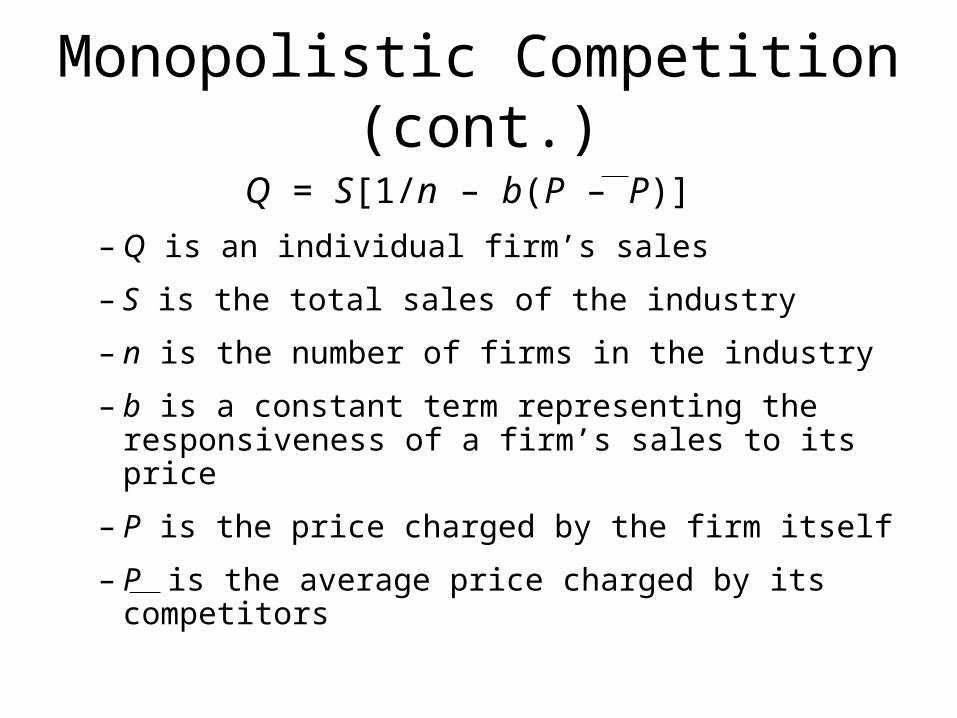
Q = S[1/n – b(P – P)] – Q is an individual firm’s sales
– S is the total sales of the industry
– n is the number of firms in the industry
– b is a constant term representing the responsiveness of a firm’s sales to its price
– P is the price charged by the firm itself
– P is the average price charged by its competitors
Monopolistic Competition (cont.)
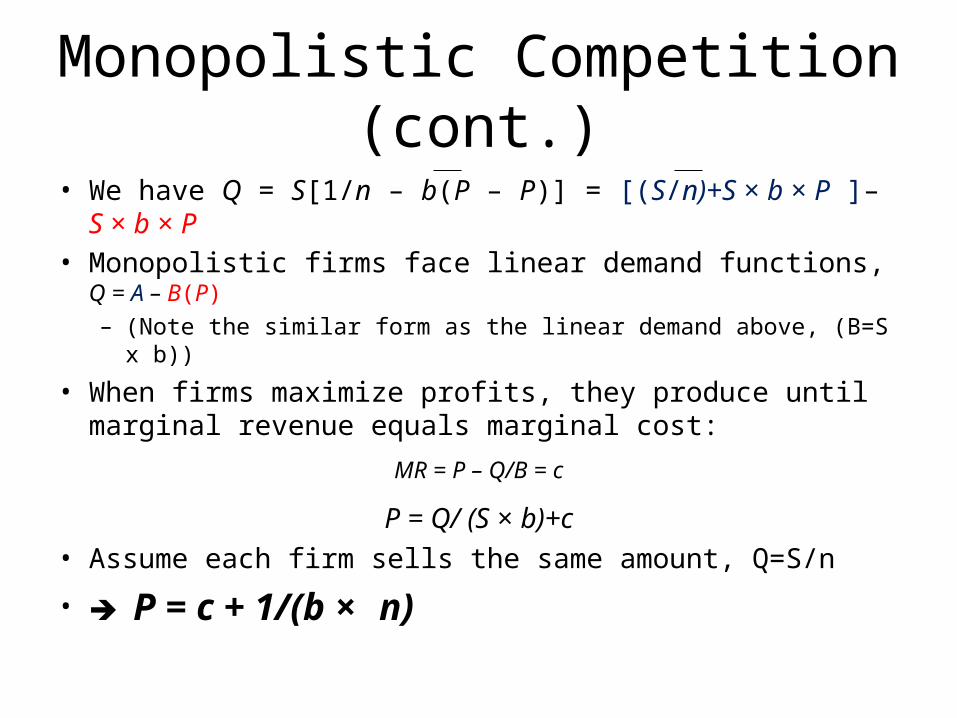
• We have Q = S[1/n – b(P – P)] = [(S/n)+S × b × P ]– S × b × P • Monopolistic firms face linear demand functions, Q = A – B(P)
– (Note the similar form as the linear demand above, (B=S x b))
• When firms maximize profits, they produce until marginal revenue equals marginal cost:
MR = P – Q/B = c
P = Q/ (S × b)+c• Assume each firm sells the same amount, Q=S/n
• P = c + 1/(b × n)
Equilibrium in a Monopolistically Competitive Market
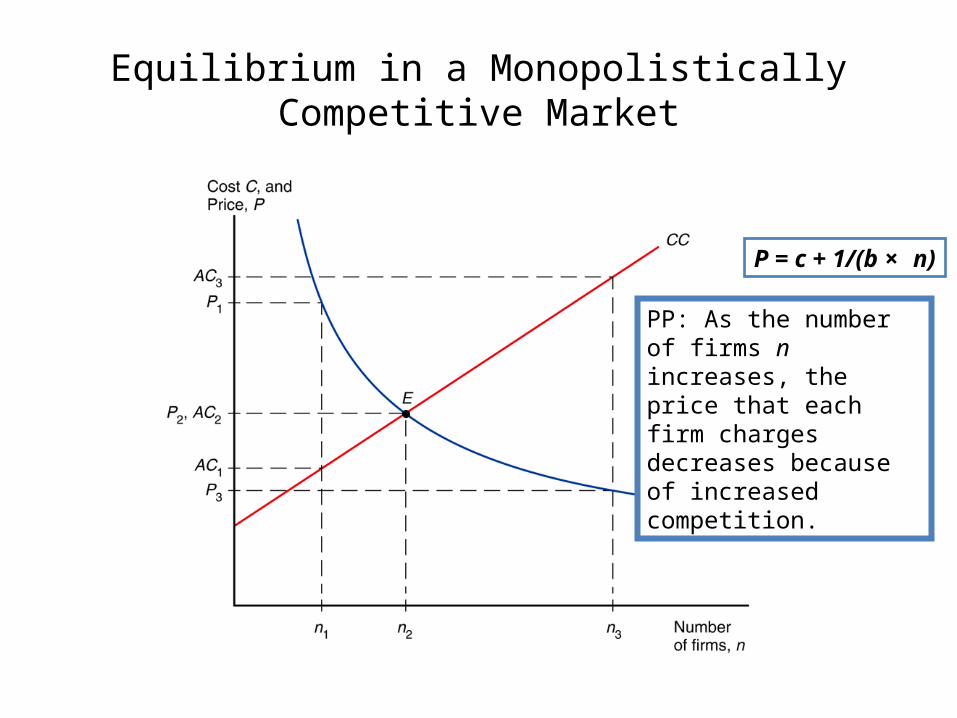
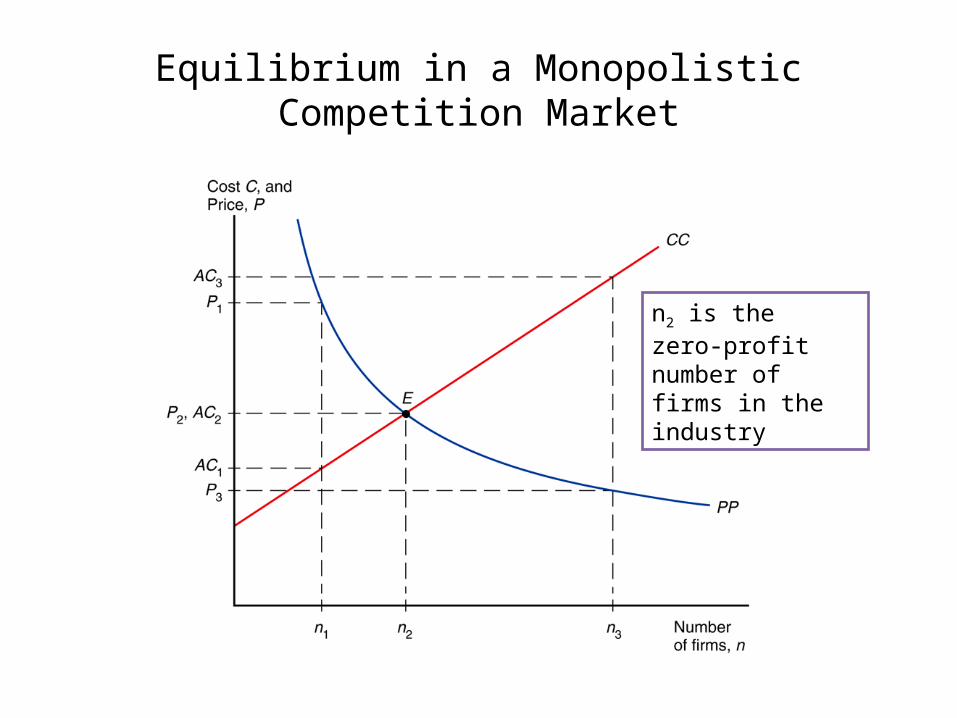
PP: As the number of firms n increases, the price that each firm charges decreases because of increased competition.
P = c + 1/(b × n)
Monopolistic Competition (cont.)
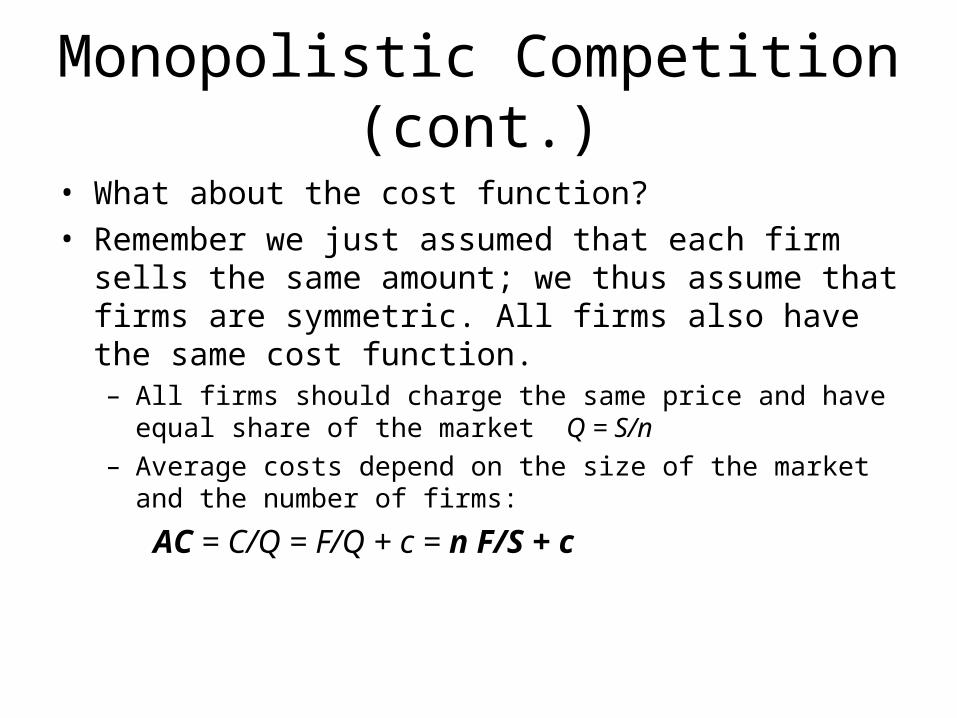
• What about the cost function?• Remember we just assumed that each firm sells the same
amount; we thus assume that firms are symmetric. All firms also have the same cost function.– All firms should charge the same price and have equal share of the
market Q = S/n– Average costs depend on the size of the market and the number of
firms:
AC = C/Q = F/Q + c = n F/S + c
Equilibrium in a Monopolistically Competitive Market
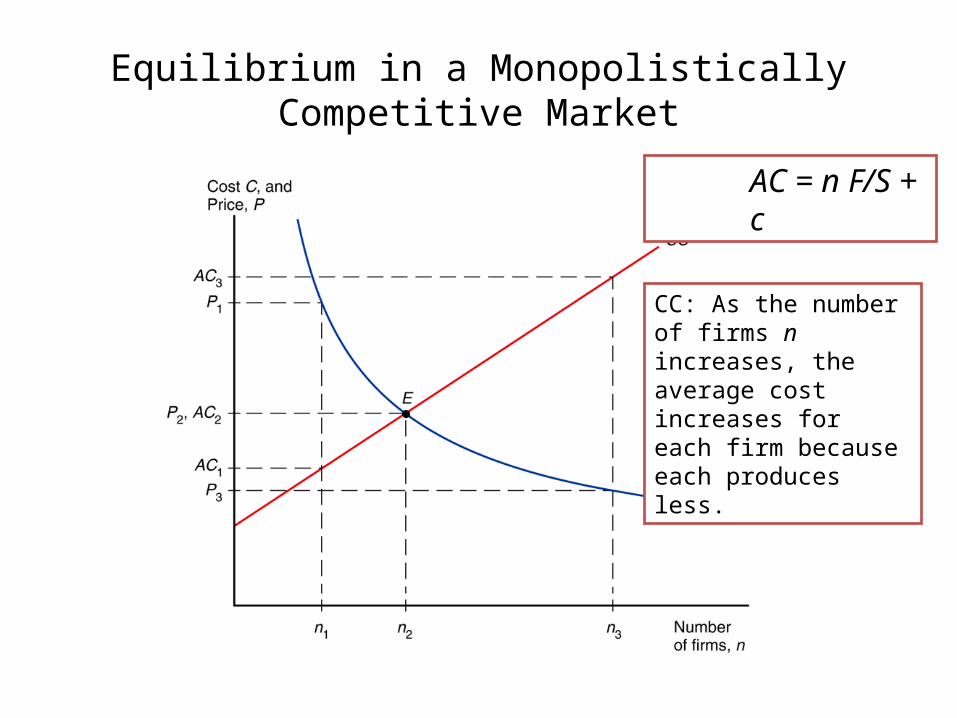
CC: As the number of firms n increases, the average cost increases for each firm because each produces less.
AC = n F/S + c
Monopolistic Competition (cont.)
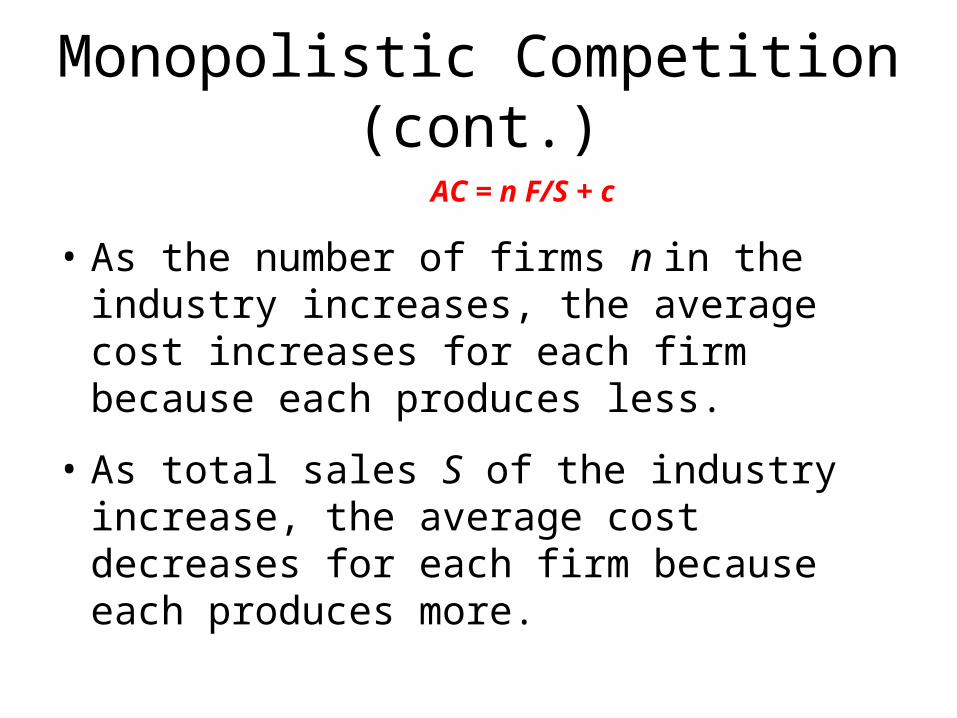
AC = n F/S + c
• As the number of firms n in the industry increases, the average cost increases for each firm because each produces less.
• As total sales S of the industry increase, the average cost decreases for each firm because each produces more.
Monopolistic Competition (cont.)
• At some number of firms, the price that firms charge (which decreases in n) matches the average cost that firms pay (which increases in n).
• At this long-run equilibrium number of firms, firms have no incentive to enter or exit the industry.
Equilibrium in a Monopolistic Competition Market
n2 is the zero-profit number of firms in the industry
Monopolistic Competition (cont.)• If the number of firms is greater than the
equilibrium number, then firms have an incentive to exit the industry.– Firms have an incentive to exit the industry when
price < average cost.
• If the number of firms is less than the equilibrium number, then firms have an incentive to enter the industry.– Firms have an incentive to enter the industry when
price > average cost.
Monopolistic Competition and Trade
• Trade increases market size (S)– Industry sales increase leading to decreased
average costs: AC = n(F/S) + c
– (Trade decreases average cost as each firm produces more)
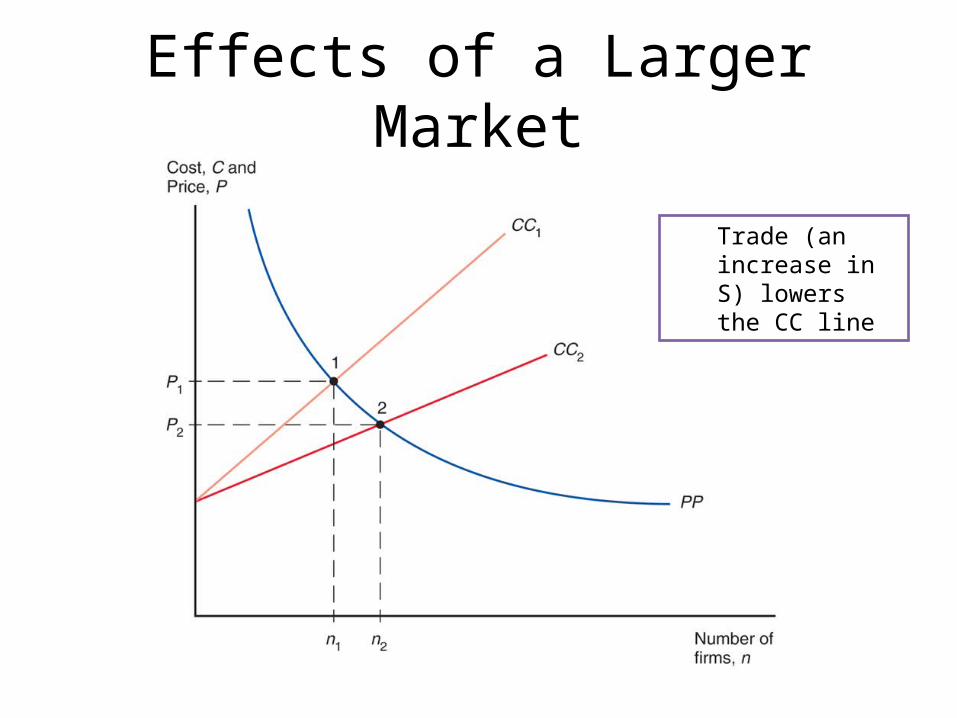
Effects of a Larger Market
Trade (an increase in S) lowers the CC line
Monopolistic Competition and Trade (cont.)
• Because average costs decrease, consumers can benefit from a lower price.
• And because trade increases the variety of goods that consumers can buy, it increases their welfare
The result reads like an advertisement for free trade: lower prices, more varieties!

Trade and gains from variety
• The number of available products in US imports tripled from 1972 to 2001
• According to Broda and Weinstein, that’s a welfare gain equal to 2.6% of US GDP.
Christian Broda & David E. Weinstein, 2006. "Globalization and the Gains from Variety," The Quarterly Journal of Economics, MIT Press, vol. 121(2), pages 541-585, May (or this one).
Trade and gains from variety
A non-technical summary: Variety, the spice of life, has measurable value. But it's not easy to determine. THE NEW YORK TIMES, "ECONOMIC SCENE", JUNE 16, 2004

Trade and gains from variety
• Economists “assume” people have love of variety• Discuss in small groups:– Do you think variety is the spice of life?– Let’s say you prefer the iPhone to the Galaxy, by how
much would the price of the Galaxy need to fall for you to switch to it?
– Do you think the two phones are close substitutes?– What type of goods are more likely to be substitutes?
Cars? Restaurants? Clothing? Beers?
Trade and gains from variety• Broda and Weinstein start from the fact that people love
variety:– Spending £20 can get you happier than before as your goods
basket is now more varied!– With variety, you get more bang for your buck (more utility per
pound)• To translate this love of variety gain into a price effect, they
argue that:– The CPI measures the current cost of a fixed basket of goods
and services– A cost-of-living index measures the cost of maintaining a certain
“standard of living,” without restrictions on what is in the basket
– A varied basket will maintain your standard of living at a lower price

Trade and gains from variety
Trade and gains from variety
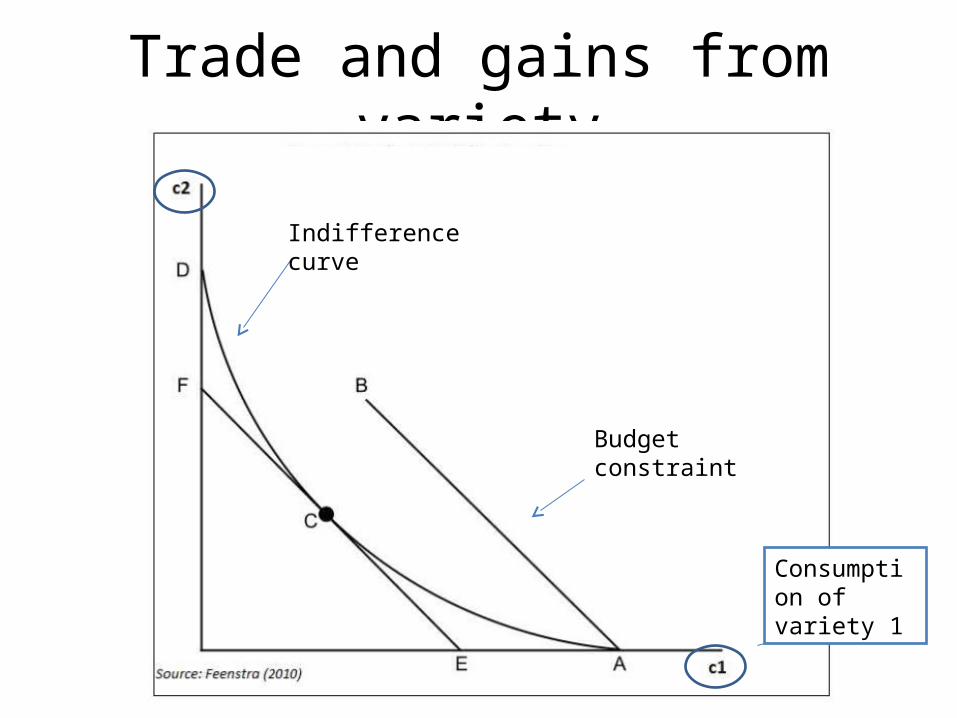
Indifference curve
Budget constraint
Consumption of variety 1
Trade and gains from variety
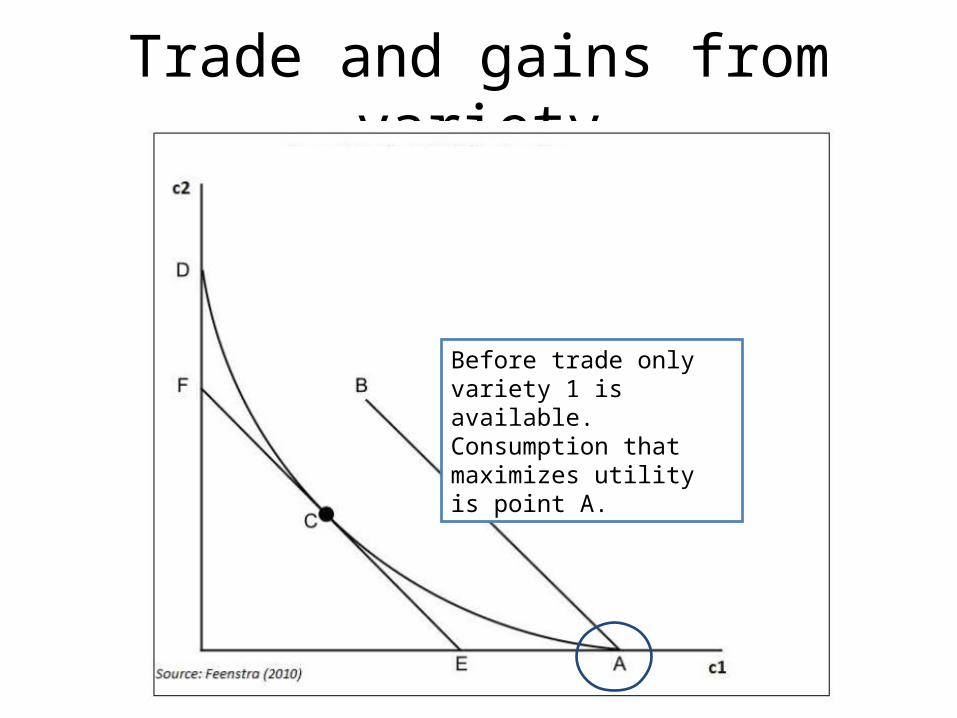
Before trade only variety 1 is available. Consumption that maximizes utility is point A.
Trade and gains from variety
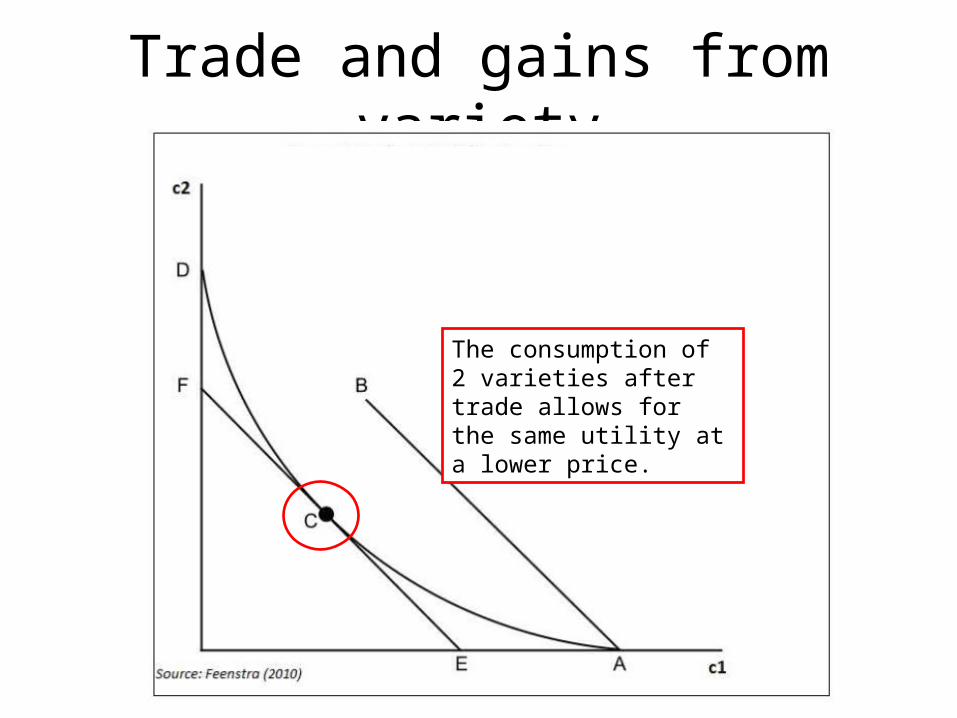
The consumption of 2 varieties after trade allows for the same utility at a lower price.
Trade and gains from variety
• For there to be gains from trade, you need an increase in varieties, and these need to be different, not close substitutes– Petrol from BP or Shell is pretty much the same
thing for most drivers– iPhones and Galaxies are differentiated
• Differentiated goods have a low elasticity of substitution You don’t switch much to the alternatives when the price goes up

Trade and gains from variety
• So how do we know if humans love variety?• Behavioural economists run some
experiments– People eat 43% more M&Ms when there are ten
colours in the bowl instead of seven.

Trade and gains from variety
• And so do capuchin monkeys…

Trade and gains from variety
• This research is by Dan Ariely and a team in Rome
• It argues monkeys choose variety for variety’s sake and suggests that variety-seeking “contributed to the rise of bartering and then abstract money in human society.”
Trade and gains from variety
• Gains from variety is also about input variety• Firms benefit from international trade through
their increased access to previously unavailable inputs (specific parts and components)
• These make them more productive and thus adds to the gains from trade
Trade and gains from variety
• What to keep in mind?– Consumers and firms have love of variety– More imported varieties with low elasticities of
substitution lead to gains from trade
• International trade creates a larger market• Let’s consider a numerical example to look at
its effects on prices, scale, and product variety
The car industry

The car industry
b=1/30,000
P=c+1/(b × n)
P=5,000+30,000/n
F = $750,000,000
c=$5000
C=750,000,000 + (5,000 × Q)
AC= 750,000,000/Q + 5,000
AC= n(750,000,000/S) + 5,000
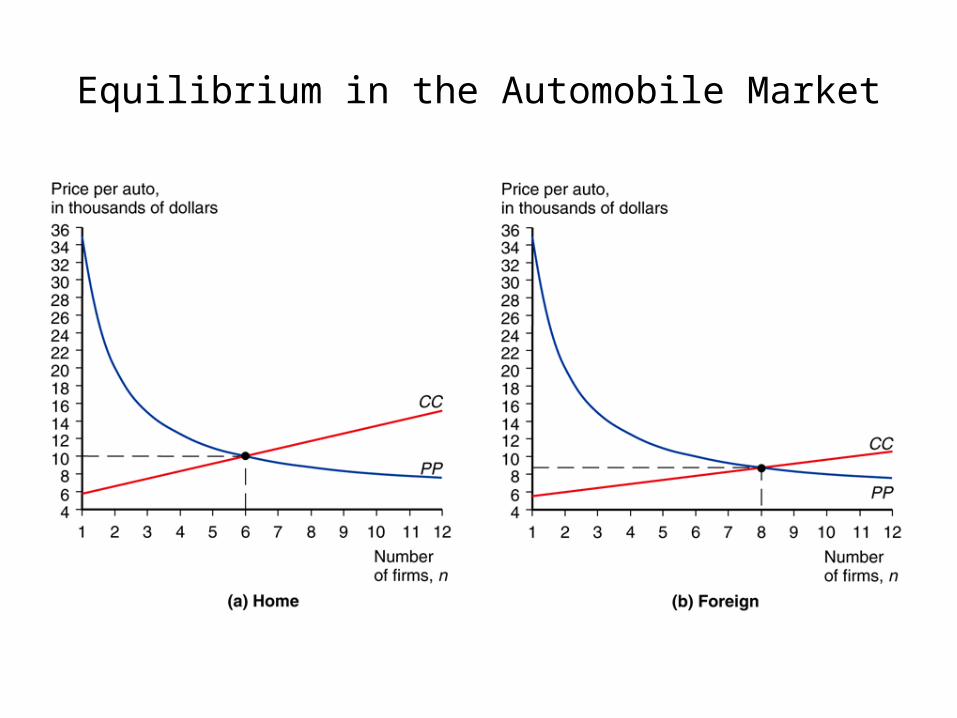
Equilibrium in the Automobile Market
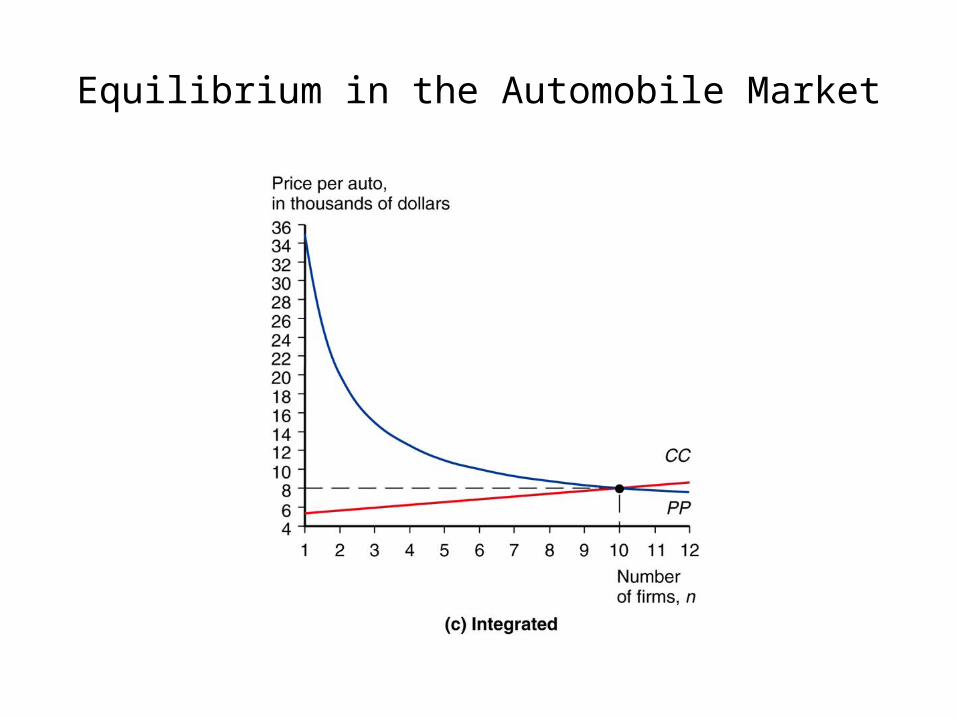
Equilibrium in the Automobile Market
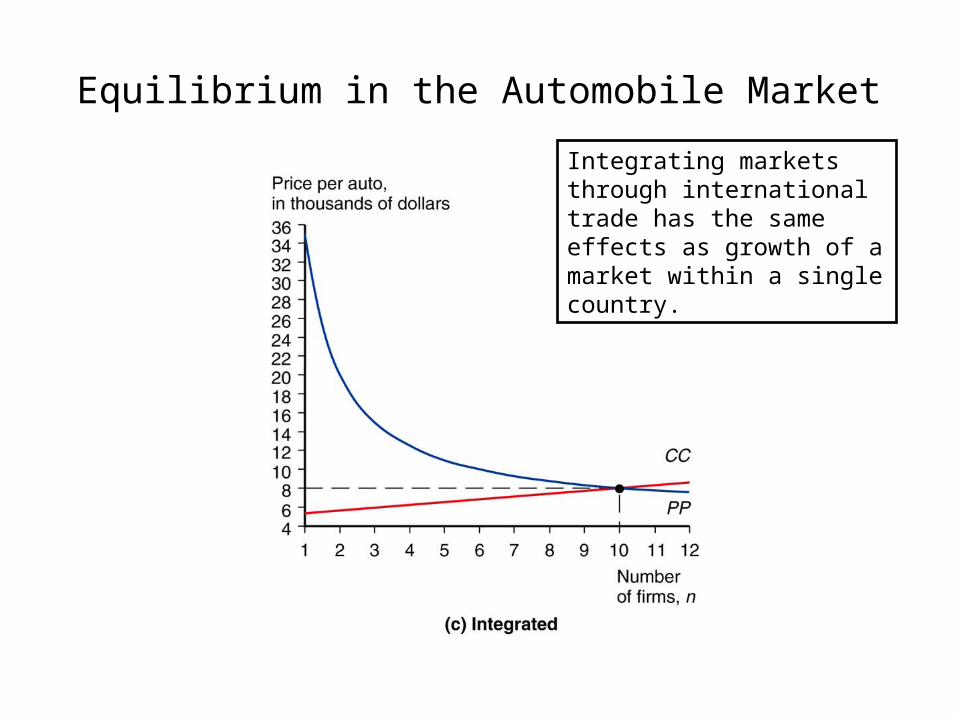
Equilibrium in the Automobile Market
Integrating markets through international trade has the same effects as growth of a market within a single country.
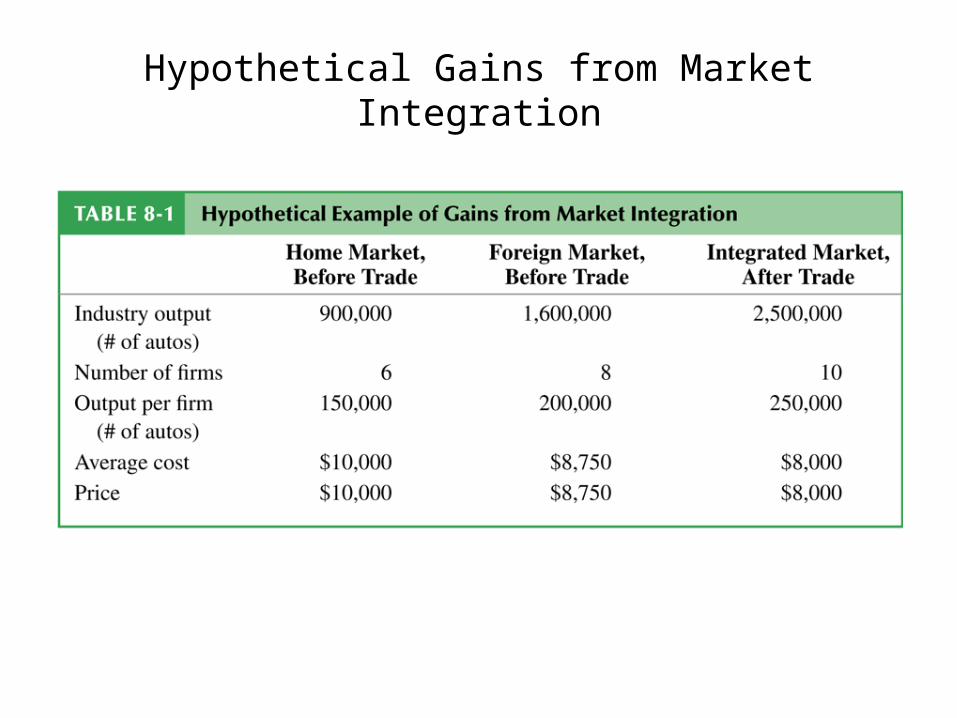
Hypothetical Gains from Market Integration
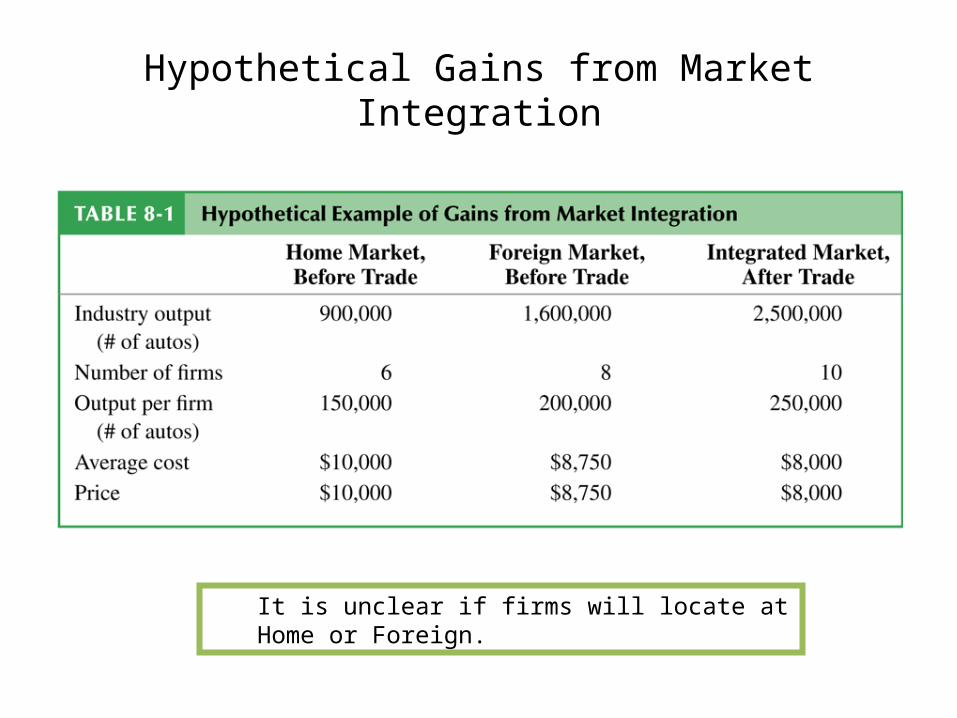
Hypothetical Gains from Market Integration
It is unclear if firms will locate at Home or Foreign.
Gains from Market Integration
• One of the most striking real-world economic integration between similar countries occurred between the US and Canada
• Started with the signing of the North American Auto Pact in 1964
• Before then, most car models were produced in the US for US consumers and in Canada for Canadian consumers
• High tariffs on auto trade made it uneconomical to export most car models across the border
Gains from Market Integration
• Because the Canadian auto market was roughly 1/10th the size of the US’, this implied substantial scale disadvantages: labour productivity there was about 30% lower
• The 1964 Pact established free trade for autos• It allowed manufacturers to consolidate the
production of car models in one country and export that model to foreign consumers
Gains from Market Integration• General Motors cut in half the number of models
assembled in Canada. • However, Canadian automotive exports to the US
increased from $16 million in 1962 to $2.4 billion in 1968.
• That same year, US automotive exports to Canada were valued at $2.9 billion intra-industry trade in action.
• By the early 1970s, the Canadian auto industry’s 30% labour productivity shortfall relative to its US counterpart had disappeared
Gains from Market Integration
• Later, this transformation of the automotive industry was extended to include Mexico.
• In 1989, Volkswagen consolidated its North American operations in Mexico
• In 1994, Volkswagen started producing the new Beetle for the entire North American market in that same Mexican plant.
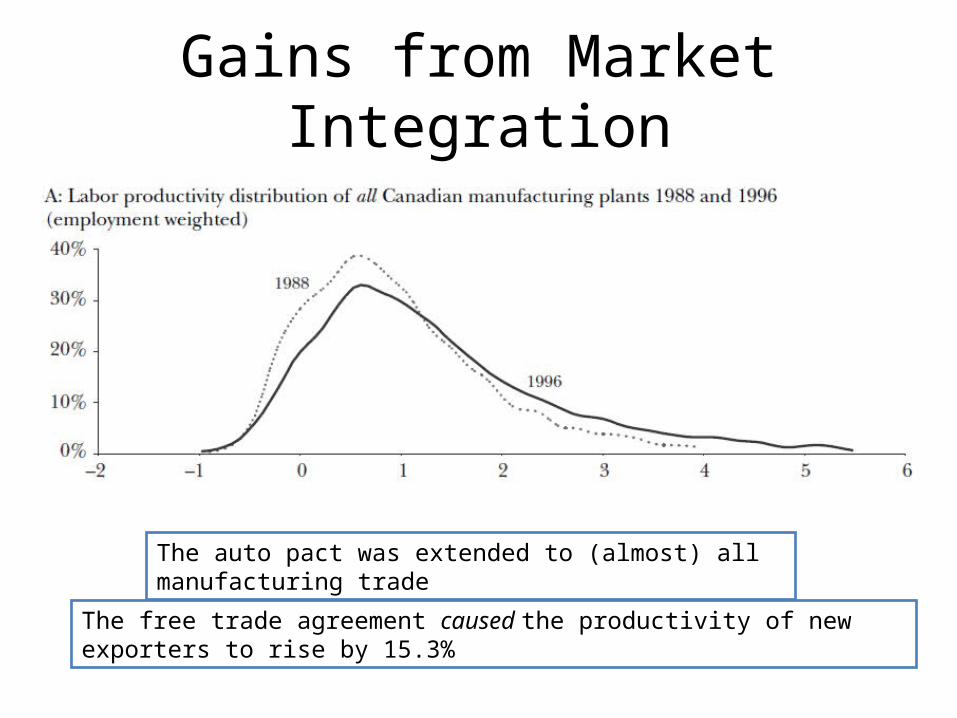
Gains from Market Integration
The free trade agreement caused the productivity of new exporters to rise by 15.3%
The auto pact was extended to (almost) all manufacturing trade
Gains from Market Integration
• Read more:• Marc J. Melitz & Daniel Trefler, 2012. "Gains
from Trade When Firms Matter," Journal of Economic Perspectives, American Economic Association, vol. 26(2), pages 91-118, Spring.
Gains from Market Integration
• Another prominent example of economic integration began in 1957… the EU!
• Many politicians predicted that German manufacturers would eradicate their European competitors.
• The facts did not treat such predictions kindly: intra-industry trade as a share of EU trade more than doubled from 1960 to 1990

Recap1. Internal economies of scale imply that more production at
the firm level causes average costs to fall.
2. With monopolistic competition, each firm can raise prices somewhat above those on competing products due to product differentiation but must compete with other firms
3. Monopolistic competition allows for gains from trade through lower costs and prices, as well as through wider consumer choice.
4. Location of firms under monopolistic competition is unpredictable, but countries with similar relative factors are predicted to engage in intra-industry trade.
Outro• Trade was once dominated by the movement of goods that could
only be produced, harvested, or mined regionally. The international trade landscape is now dominated by two striking facts:
Outro
• The first is the rise of intra-industry trade— that is, two-way trade in similar products. – UK exports Minis and UK consumers can now buy a car
from Toyota (Japan), Kia (Korea), VW (Germany), General Motors (US), etc...
– UK exports Topshop and UK consumers get H&M, Gap, and Zara• Each country gains access to more varieties, even though the
number of varieties worldwide may fall
Outro
• The second striking fact is that world trade is dominated by big productive firms. – For example, Intel is so large that it is the largest industrial
employer in both Oregon and New Mexico and accounts for 20% of Costa Rica’s exports.
– Taiwan’s Foxconn infamously employs 450,000 workers in a single one of its many export-oriented electronics factories in China. These are big companies…


