
1
Modelling the situation of COVID-19 and effects of different containment
strategies in China with dynamic differential equations and parameters
estimation
Xiuli Liu1,2,3* Geoffrey Hewings4* Shouyang Wang1,2,3* Minghui Qin1,2 Xin Xiang1,2 Shan
Zheng1,2 Xuefeng Li1,2
1 Academy of Mathematics and Systems Science, Chinese Academy of Sciences, Zhongguancun
East Road No. 55, Beijing 100190, People’s Republic of China
2 University of Chinese Academy of Sciences, Beijing, 19 A Yuquan Road, Shijingshan District,
Beijing 100049, People’s Republic of China
3 Center for Forecasting Science, Chinese Academy of Sciences, Zhongguancun East Road No.
55, Beijing 100190, People’s Republic of China
4 Regional Economics Applications Laboratory, University of Illinois, 1301 W Gregory #236,
Urbana, IL 61801, USA
Abstract: This paper proposed a quarantine-susceptible-exposed-infectious-resistant (QSEIR)
model which considers the unprecedented strict quarantine measures in almost the whole of China
to resist the epidemic. We estimated model parameters from published information with the
statistical method and stochastic simulation, we found the parameters that achieved the best
simulation test result. The next stage involved quantitative predictions of future epidemic
developments based on different containment strategies with the QSEIR model, focused on the
sensitivity of the outcomes to different parameter choices in mainland China. The main results are
as follows. If the strict quarantine measures are being retained, the peak value of confirmed cases
would be in the range of [52438, 64090] and the peak date would be expected in the range February
7 to February 19, 2020. During March18-30, 2020, the epidemic would be controlled. The end
date would be in the period from August 20 to September 1, 2020. With 80% probability, our
prediction on the peak date was 4 days ahead of the real date, the prediction error of the peak value
is 0.43%, both estimates are much closer to the observed values compared with published studies.
The sensitive analysis indicated that the quarantine measures (or with vaccination) are the most
All rights reserved. No reuse allowed without permission. (which was not certified by peer review) is the author/funder, who has granted medRxiv a license to display the preprint in perpetuity.
The copyright holder for this preprintthis version posted March 13, 2020. .https://doi.org/10.1101/2020.03.09.20033498doi: medRxiv preprint

2
effective containment strategy to control the epidemic, followed by measures to increase the cured
rate (like finding special medicine). The long-term simulation result and sensitive analysis in
mainland China showed that the QSEIR model is stable and can be empirically validated. It is
suggested that the QSEIR model can be applied to predict the development trend of the epidemic
in other regions or countries in the world. In mainland China, the quarantine measures can’t be
relaxed before the end of March 2020. China can fully resume production with appropriate anti-
epidemic measures beginning in early April 2020. The results of this study also implied that other
countries now facing the epidemic outbreaks should act more decisively and take in time
quarantine measures though it may have negative short-term public and economic consequences.
Keywords: dynamically modeling; parameters estimation; sensitive analysis; effects of different
containment strategies; novel coronavirus (COVID-19)
Introduction
In late December, 2019, an atypical pneumonia case, caused by a virus called COVID-19, was first
reported and confirmed in Wuhan, China. Although the initial cases were considered to be
associated with the Huanan Seafood Market, the source of the COVID-19 is still unknown. The
confirmed cases increased with exponential speed, from 41 on January 10, 2020 to 5,974 on
January 28, 2020 in mainland China, far exceeding those of the SARS epidemic in 2003 (see figure
1). By February 22(24:00 GMT), 2020, there have been 76,936 cumulative confirmed cases of
COVID-19 infections in mainland China, including 2,442 cumulative deaths and 22,888
cumulative cured cases. 64,084 cumulative confirmed cases were in Wuhan, accounting for 83.3%
of the cumulative confirmed cases in mainland China. Equally of concern, a WHO news release
noted that 1,400 cases were reported in 26 countries outside China, with the Republic of Korea
All rights reserved. No reuse allowed without permission. (which was not certified by peer review) is the author/funder, who has granted medRxiv a license to display the preprint in perpetuity.
The copyright holder for this preprintthis version posted March 13, 2020. .https://doi.org/10.1101/2020.03.09.20033498doi: medRxiv preprint

3
(346), Japan (105) and Singapore (86) ranked as the top 3 (figure 2), while 35 cases were reported
in United States of America1.
The transmissibility of COVID-19 — or at least its geographical distribution (figure 2) — seems
to be higher and broader than initially expected (Horton, 2020). Compared to SARS-CoV (9.56%
mortality) and MERS-CoV (34.4% mortality), the COVID-19 appears to be less virulent at this
point except for the elderly and those with underlying health conditions (table 1). COVID-19 was
confirmed as subject to human-to-human transmission and it is very contagious. The basic
reproduction number R0 for COVID-19 was estimated by WHO and some research institutes in
the range of 1.4-6.6 (table 2). This value is slightly higher than that of the 2003 SARS epidemic,
and much higher than that of influenza and Ebola. The incubation days of COVID-19 in Wuhan
city is 5-10 days with a mean of 7 days (Fan et al., 2020). On average, the duration from confirmed
stage to cure or death is 10 days in nation-wide reporting according to Guan et al. (2020). A long
incubation period and an associated large number of patients with mild symptoms increase the
difficulty of prevention and control of the epidemic. The likelihood of travel-related risks of the
disease spreading has been noted by Bogoch et al. (2020) and Cao et al. (2020a) wherein they
indicated the potentials for further regional and global spread (Leung et al., 2020).
As the epidemic broke out on the eve of the Spring Festival, large-scale population movements
and gatherings of people aggravated the epidemic. After the outbreak, local governments have
adopted a series of unprecedented mitigation policies in place to contain the spread of the epidemic.
The major local public emergency started with a category Class I response to health incidents, with
positively diagnosed cases either quarantine or put under a form of self-quarantine at home (Gan
1 https://www.who.int/emergencies/diseases/novel-coronavirus-2019/situation-reports/
All rights reserved. No reuse allowed without permission. (which was not certified by peer review) is the author/funder, who has granted medRxiv a license to display the preprint in perpetuity.
The copyright holder for this preprintthis version posted March 13, 2020. .https://doi.org/10.1101/2020.03.09.20033498doi: medRxiv preprint

4
et al., 2020). Suspicious cases were confined in monitored house arrest. Most exits and entries into
cities were shut down. Certain categories of contact were banned; for instance, universities and
schools remained closed, and many businesses remained closed. People were asked to remain in
their homes for as much time as possible (Fahrion et al., 2020). These interventions have reduced
the population's contacts to a certain extent, helped to cut off pathways for the spread of the virus
and reduce the rate of disease transmission.
However, the long-term management and control has brought considerable inconvenience to the
daily lives of people. The failure of factories to start on time and run normally after the Spring
Festival also had severe effects on Chinese national and global economies. Ayittey et al. (2020)
and CNN Business (2020) estimated it would result in China’s GDP declining 4.5% year-on-year
in Q1 in 2020; the loss in China would be up to $62 billion in the same quarter. Zhang (2020),
Huang (2020), Li and Zhang (2020) and IMF News (2020) considered the growth of China’s GDP
would be 5.0%-5.6% in 2020, decrease 0.5-1.1 percentage points from 2019. IHS Markit (2020)
estimated a reduction of global real GDP of 0.8% in Q1 and 0.5% in Q2 in 2020, and the global
real GDP would be reduced by 0.4% in 2020. The longer the duration of the epidemic, the more
negative the impacts on China and the rest of the world, with the latter effects largely centered on
disruptions in increasingly complicated supply chains. Therefore, it is important to estimate the
dynamic evolution mechanism of the epidemic in mainland China, to find when the epidemic will
end and how this result depends on different containment strategies. These are issues of great
significance with important clinical and policy implications (Joseph et al., 2020).
QSEIR Model
The traditional infectious disease dynamics susceptible–exposed–infectious–resistant (SEIR)
model has been very popular in analyzing and predicting the development of an epidemic (see
All rights reserved. No reuse allowed without permission. (which was not certified by peer review) is the author/funder, who has granted medRxiv a license to display the preprint in perpetuity.
The copyright holder for this preprintthis version posted March 13, 2020. .https://doi.org/10.1101/2020.03.09.20033498doi: medRxiv preprint

5
Lipsitch et al., 2003; Pastor-Satorras, 2015). SEIR models the flows of people between four states:
susceptible (S), exposed (E), infected (I), and resistant (R). Each of those variables represents the
number of people in those groups. Assume that the average number of exposed cases that are
generated by one infected person of COVID-19 is β. The parameter β is similar to the basic
reproduction number which can be thought of as the expected number of cases directly generated
by one case in a population where all individuals are susceptible to infection. Considering the
protective measures were taken, β should be smaller than the basic reproduction number in table
2. An individual in the exposed state (type E) will have the probability δ changes to individuals in
the infected state (type I), and an individual in the infected state (type I) will change to the cure
state (type R) with a probability of γ or to death state (type F) with a probability of η per unit time.
In contrast to the traditional SEIR model, we propose a quarantine-susceptible-exposed-infectious-
resistant (QSEIR) model that considers the unprecedented strict quarantine measures in mainland
China to resist the epidemic. The parameter, α(t), was designed to represent the ratio of people
who was not restricted to a specific area and had chances to contact with COVID-19 virus during
special period. The α(t) and β(t) vary according to the strength of the prevention and control
measures for the epidemic. To make the model accord with reality, contrast with the standard SEIR
model, we added two parameters Δ(t) and θ(t). The Δ(t) is the ratio of people with vaccination at
time t. θ(t) is the natural mortality of the population in a region at time t (figure 3). The value of
δ(t) is closely related with the virus incubation and infectious periods and γ(t) is dependent on the
treatment level and patients’ health status. It is assumed that the virus incubation period is 7 days
and the duration from confirmed stage to cure or death is 10 days based on nation-wide information
(Guan et al., 2020; Fan et al., 2020). The model is an ordinary differential equation model,
described by the following equation.
All rights reserved. No reuse allowed without permission. (which was not certified by peer review) is the author/funder, who has granted medRxiv a license to display the preprint in perpetuity.
The copyright holder for this preprintthis version posted March 13, 2020. .https://doi.org/10.1101/2020.03.09.20033498doi: medRxiv preprint

6
dS(t)/dt=-β(t)*I(t)*S(t) /N (1)
dE(t)/dt=β(t)*S(t)*I(t)/N-δ(t)*E(t-7) (2)
dI(t)/dt=δ(t)*E(t-7)- γ(t)*I(t-10)- η(t)*I(t-10) (3)
dR(t)/dt=γ(t)*I(t-10) (4)
dF(t)/dt=η(t)*I(t-10) (5)
N=α(t) *(1-Δ(t)- θ(t)) *P (6)
S(t)+E(t)+I(t)+R(t)+F(t) =N (7)
Equation (6) is specially designed to fit for China's actual epidemic prevention measures. In actual
calculations, Δ(t) was assumed to be 0, because no vaccination has yet been developed. θ(t) can
also be assumed to be 0 if we are only concerned with the fatality of CONVID-19. The other four
parameters β(t), γ(t), δ(t) and η(t) are not easy to determine, since the virus incubation period,
infectious period, and case statistics that have close relationships with these parameters have
varying (unknown) degrees of accuracy. The choice of estimation techniques for the key
epidemiological parameters in the QSEIR model of COVID-19 has become a research priority
(Cao et al., 2020b).
Data Source
We obtained the number of COVID-19 cases time series data from January 10 to February 22,
2020 for mainland China released by the National Health Commission of China and health
commissions at the provincial level in China2. Due to limited testing and treatment resources while
facing a major outbreak with a sudden onset, there was under-screening and under-reporting in the
early stages of the epidemic in its epicenter, Wuhan, and this generated biases in the data during
the early stages (Cao et al., 2020b). Note that this challenge also existed in SARS and other
2 http://www.nhc.gov.cn/xcs/yqtb/list_gzbd.shtml
All rights reserved. No reuse allowed without permission. (which was not certified by peer review) is the author/funder, who has granted medRxiv a license to display the preprint in perpetuity.
The copyright holder for this preprintthis version posted March 13, 2020. .https://doi.org/10.1101/2020.03.09.20033498doi: medRxiv preprint

7
coronavirus outbreaks (Hartley and Smith, 2003; Razum and Becher, 2003). After the isolation of
Wuhan on January 23, 2020 with the stricter requirements of data statistics and the provision of
detection levels, the data are more and more reliable.
Parameters Estimation
We estimated model parameters reversely with QSEIR model by equations (8)-(12). β(t), γ(t), η(t)
and δ(t) can be calculated (see table 4).
From equations (1)-(6), we obtain:
S(t+1)-S(t)= -β(t)*I(t)*S(t)/N (8)
R(t+1)-R(t)= γ(t)*I(t-10) (9)
F(t+1)-F(t)= η(t)*I(t-10) (10)
I(t+1)-I(t) =δ(t)*E(t-7)-γ(t)*I(t-10)- η(t)*I(t-10) (11)
E(t+1)-E(t)= β(t)*S(t)*I(t)/N-δ(t)*E(t-7) (12)
Note that we found some δ(t) in table 4 was>1, which is obviously incorrect, the reason was
mainly because biases in the data during the early stages (Cao et al., 2020b). We deleted these data
and calculated the average, median and variance of the rest value of the four parameters in first
step. In step 2, we deleted values>1.5 times of the column average. In step 3, we calculated the
average, median and variance of the rest value of the four parameters (see table 5). With table 5,
we set the four parameters belong to the range of their average/median±variance. The parameter
α(t) was roughly estimated as 1.2-2.0 times of cumulative confirmed cases on February 22, 2020
divided by population in mainland China.
Then, we set the values of these parameters in their ranges randomly, and input them to QSEIR
model, we got E(i), I(i), R(i), F(i) at each day i, we used the real data I0, E0, R0 and F0 from
All rights reserved. No reuse allowed without permission. (which was not certified by peer review) is the author/funder, who has granted medRxiv a license to display the preprint in perpetuity.
The copyright holder for this preprintthis version posted March 13, 2020. .https://doi.org/10.1101/2020.03.09.20033498doi: medRxiv preprint
8
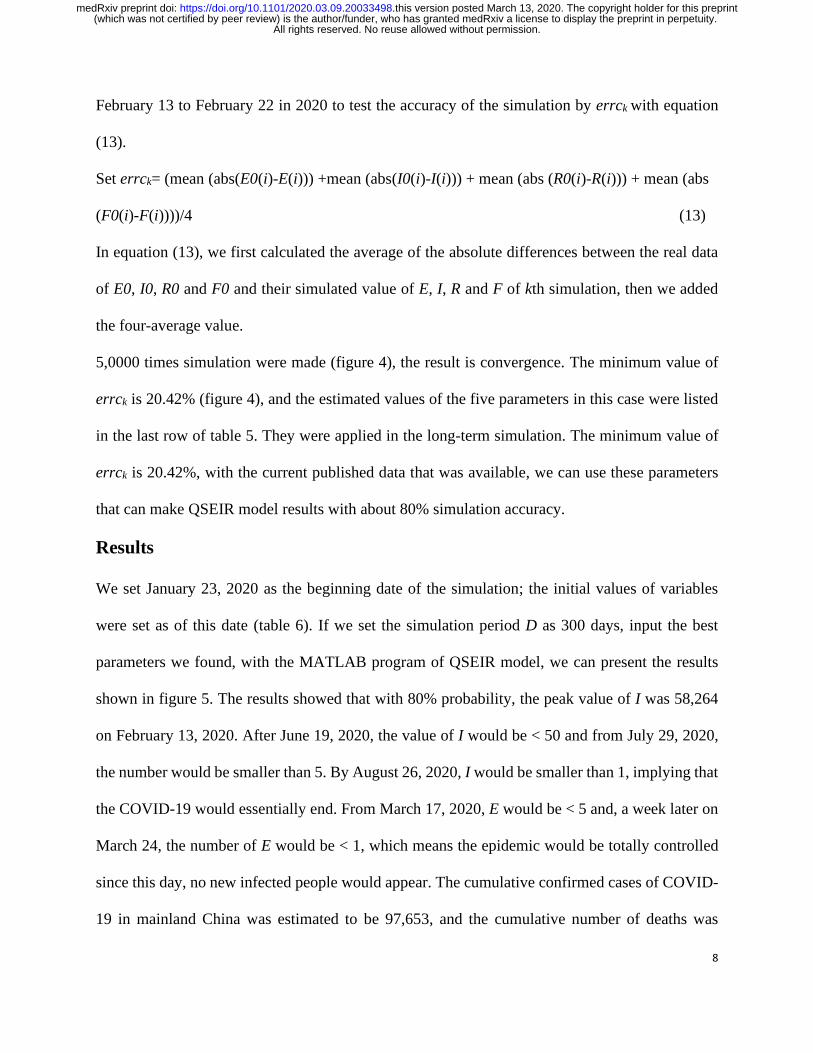
February 13 to February 22 in 2020 to test the accuracy of the simulation by errck with equation
(13).
Set errck= (mean (abs(E0(i)-E(i))) +mean (abs(I0(i)-I(i))) + mean (abs (R0(i)-R(i))) + mean (abs
(F0(i)-F(i))))/4 (13)
In equation (13), we first calculated the average of the absolute differences between the real data
of E0, I0, R0 and F0 and their simulated value of E, I, R and F of kth simulation, then we added
the four-average value.
5,0000 times simulation were made (figure 4), the result is convergence. The minimum value of
errck is 20.42% (figure 4), and the estimated values of the five parameters in this case were listed
in the last row of table 5. They were applied in the long-term simulation. The minimum value of
errck is 20.42%, with the current published data that was available, we can use these parameters
that can make QSEIR model results with about 80% simulation accuracy.
Results
We set January 23, 2020 as the beginning date of the simulation; the initial values of variables
were set as of this date (table 6). If we set the simulation period D as 300 days, input the best
parameters we found, with the MATLAB program of QSEIR model, we can present the results
shown in figure 5. The results showed that with 80% probability, the peak value of I was 58,264
on February 13, 2020. After June 19, 2020, the value of I would be < 50 and from July 29, 2020,
the number would be smaller than 5. By August 26, 2020, I would be smaller than 1, implying that
the COVID-19 would essentially end. From March 17, 2020, E would be < 5 and, a week later on
March 24, the number of E would be < 1, which means the epidemic would be totally controlled
since this day, no new infected people would appear. The cumulative confirmed cases of COVID-
19 in mainland China was estimated to be 97,653, and the cumulative number of deaths was
All rights reserved. No reuse allowed without permission. (which was not certified by peer review) is the author/funder, who has granted medRxiv a license to display the preprint in perpetuity.
The copyright holder for this preprintthis version posted March 13, 2020. .https://doi.org/10.1101/2020.03.09.20033498doi: medRxiv preprint

9
estimated to be 8,754.
Considering there have 20% estimation error of errc, the peak value of I would be in the range of
[52,438, 64,090] and the peak date would be expected in the range February 7 to February 19,
2020. The end date would be in range from August 20, 2020 to September 1, 2020. During the
period between March18-30, 2020 the epidemic would be totally controlled.
Yan et al. (2020) predicted that the peak value of confirmed cased in mainland China would be >
40,000, Hermanowicz (2020) predicted it to be 65,000, while Li and Feng (2020) estimated 51,600.
There have been a number of studies estimating the peak number and date of confirmed cases in
mainland China in the early stage of the epidemic (Batista, 2020; Gamero et al., 2020;
Hermanowicz, 2020; Liu et al., 2020(a); Shi et al., 2020; Xiong and Yan, 2020). However, due to
the limited emerging understanding of the new virus and its transmission mechanisms, their results
were in the range from January 14, 2020 (Yan et al., 2020) to the beginning of March, 2020 (Geng
et al., 2020) (see table 3). Most of them are in the mid of February, 2020, which are approximate
to the real date February 17, 2020. The results of Wang et al. (2020b), Gamero et al. (2020) Xiong
and Yan (2020), Li et al. (2020c), Hermanowicz (2020) and Shi et al. (2020) were in
correspondence with our results, which are closer to the observed data. With 80% probability, our
prediction of the peak date is 4 days ahead of the real date, the prediction error of the peak value
is 0.43%, both estimates are much closer to the observed values compared with other published
studies.
Furthermore, the existing studies seldom provided estimates of the duration of the epidemic and
effects of different containment strategies in mainland China. At the regional level, Wu et al.
(2020b) concluded that in Guangdong province, the epidemic would be totally controlled by mid
to late March, 2020. The cumulative confirmed cases in Guangdong was ranked second among
All rights reserved. No reuse allowed without permission. (which was not certified by peer review) is the author/funder, who has granted medRxiv a license to display the preprint in perpetuity.
The copyright holder for this preprintthis version posted March 13, 2020. .https://doi.org/10.1101/2020.03.09.20033498doi: medRxiv preprint

10
provinces in China. The number was 1,342 on February 22, 2020, which accounted for 1.74% of
the cumulative confirmed cases in mainland China. The date on which no new exposed cases
should be similar with that of mainland China. The result of Wu et al. (2020b) is correspondence
with our result.
Yang et al. (2020) provided that in Chongqing the end date would be about May 11, 2020. The
peak value of confirmed cases in Chongqing was 41 on January 30, 2020. The cumulative
confirmed cases in Chongqing was 573 on February 22, 2020, accounting for 0.74% of the total in
China. Therefore, its end date should be much earlier than that of mainland China. The end date
of August 26, 2020 in mainland China in our research can be partly explained by Yang et al. (2020).
Sensitivity analysis
How would E, I, R, F change if the value of parameters (α(t), β(t), η(t), δ(t), γ(t)) varied or if the
beginning date January 23, 2020 of the simulation changed? We conducted sensitivity analyses of
them in terms of their impacts on the I index one by one.
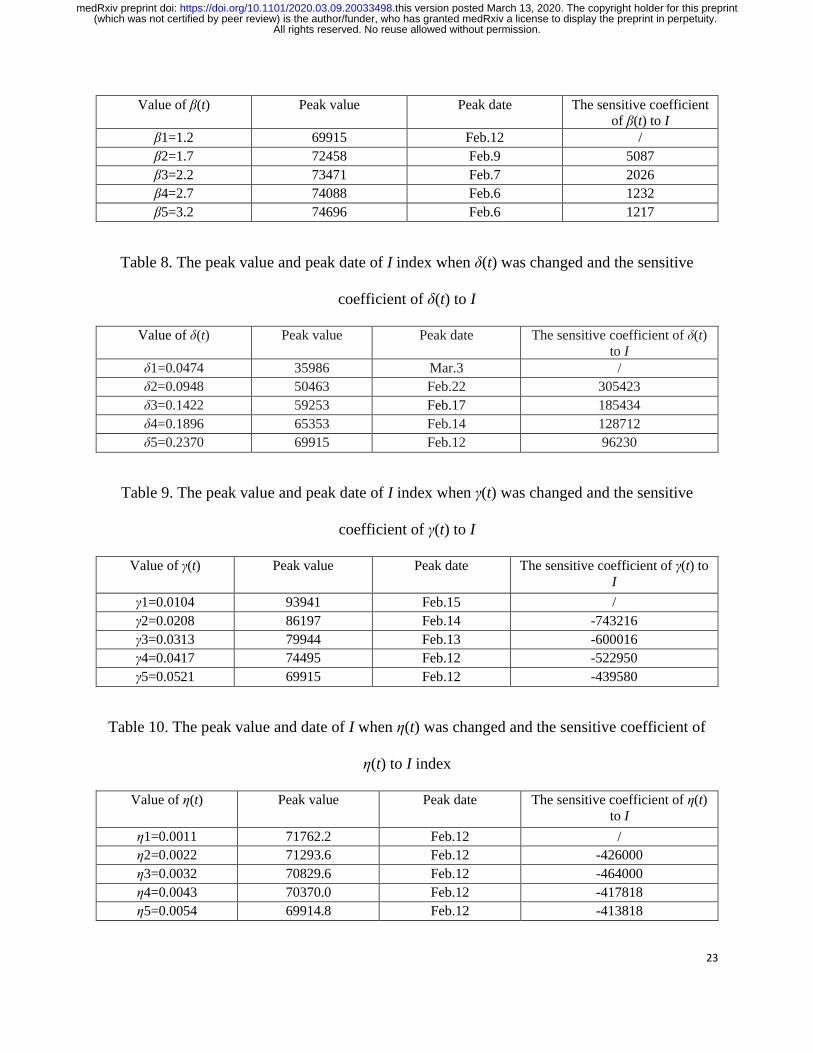
Figures 6-7 and tables 7-8 showed that the larger the value of β(t) or δ(t), the higher the peak value
of the I index and the earlier the peak time. With the increase of β(t) or δ(t), their sensitive
coefficient to I index decreased progressively. The sensitivity coefficient of α(t) to I index was the
biggest. When α(t) increased 0.001%, 8,596 more confirmed cases will be observed (figure 10 and
table 11). These results indicated that quarantine measures (or with vaccination that is not yet
available) are the most effective containment strategy to control the epidemic. Figures 8-9 and
tables 9-10 showed that the greater the value of γ(t) or η(t), the smaller the peak value of the I
index. The peak date of I was not very sensitive to the change of γ(t). When γ(t) increased 1%,
confirmed cases will be decrease between 4,395 and 7,432. When η(t) decreased 1%, 4,138 to
4,640 additional confirmed cases could be expected. The average absolute sensitive coefficient of
All rights reserved. No reuse allowed without permission. (which was not certified by peer review) is the author/funder, who has granted medRxiv a license to display the preprint in perpetuity.
The copyright holder for this preprintthis version posted March 13, 2020. .https://doi.org/10.1101/2020.03.09.20033498doi: medRxiv preprint

11
γ(t) and η(t) to I ranked the second and third in those of five parameters (tables 7-11). This showed
that to improve the rate of cure, the development of special medicine should be the second most
effective measure.
If the beginning date of the simulation changed from January 23 to January 30 or February 6
in2020 with the value of variables in table 12, together with the same estimated value of parameters
in table 5 and, QSEIR program, we can show the main results that started from January 30 in figure
11. Compared with the baseline, the peak value of the I index increased 0.9% or 1.5%. The peak
date of I or the ended date of COVID-19 would be 3 days or 1 day ahead (figure 12 and table 12).
Results mean that the simulating results were not sensitive to the initial start date. The QSEIR
model system is stable.
Due to the downward pressure on the economy, some enterprises resumed work one after another
in compliance with the requirements of epidemic prevention and control. Because newly confirm
ed cases are decreasing day by day since February 17,2020, the outbreak was gradually brought u
nder control, some people began to relax their vigilance. Some began to travel; some went out wi
thout masks. If the control measures are slightly relaxed from March 10, α(t) increased 0.00001 f
rom 0.00006975, which means the number of S increased to 14,000, the end date would be exten
ded from August 26, 2020 to September 14, 2020. And the date that the epidemic can be controll
ed would be extended 70 days, which would be on June 2nd, 2020. The cumulative confirmed cas
es would increase from 97,653 to 111,619, up 14.3% (figure 13). Evidence suggests that the colo
ssal public health efforts of the Chinese Government have saved thousands of lives (Editorial, 20
20). It indicated that the quarantine measures should not be relaxed before the end of March, 202
0 in mainland China.
Conclusion
All rights reserved. No reuse allowed without permission. (which was not certified by peer review) is the author/funder, who has granted medRxiv a license to display the preprint in perpetuity.
The copyright holder for this preprintthis version posted March 13, 2020. .https://doi.org/10.1101/2020.03.09.20033498doi: medRxiv preprint

12
The paper proposed a QSEIR model that considers the unprecedented strict quarantine measures
which are more fit for the epidemic situation in mainland China. Parameter estimation is the most
critical part when using this kind of SEIR model to predict the trend of epidemic (Cao et al., 2020b).
We estimated the model parameters reversely for the QSEIR model from published information
with statistical methods and stochastic simulations; from these experiments, we found the
parameters that achieved the best simulation test results. The application verified that the method
is effective. The paper not only predicted the peak number and peak date of confirmed cases, but
also provided estimates of the sensitivity of parameters of QSEIR, the duration of the epidemic
and effects of different containment strategies at the same time. The long-term simulation result
and sensitive analysis in mainland China showed that the QSEIR model is stable and can be
empirically validated. It is suggested that the QSEIR model can be applied to predict the
development trend of the epidemic in other regions or countries in the world.
Discussions
In QSEIR model, the parameters are dynamically changing for each day. Parameters estimation is
the most important part in the kind of SEIR model (Cao et al., 2020b). The paper illustrated the
method to generate the parameter estimations. Given data limitation, we estimated a constant value
to each of them with 20% errors in simulation tests, which was the best result in 50000 times
stochastic simulation within their statistical ranges. We applied these values in prediction and
obtained better results than existed researches. With the improvement of data quality and more
data, variable parameters can be estimated and the forecasting accuracy of the model could be
enhanced.
The vaccine research and development cycle are relatively long, from researching products to
large-scale production and promotion, it takes about 6-18 months. It seems that the COVID-19
All rights reserved. No reuse allowed without permission. (which was not certified by peer review) is the author/funder, who has granted medRxiv a license to display the preprint in perpetuity.
The copyright holder for this preprintthis version posted March 13, 2020. .https://doi.org/10.1101/2020.03.09.20033498doi: medRxiv preprint

13
vaccination cannot be applied in large-scale quantities before the end of August, 20203.However,
the COVID-19 is now spreading more seriously in other countries and regions in the world and
there is also the possibility of its returning to China. As of March 7, 2020, 21, 110 confirmed cases
of COVID-19 have been reported in 93 countries/territories/ areas. Hence, it is imperative that the
development of vaccines and specific drugs for COVID-19 should be promoted by many countries
with the technical resources to conduct the necessary high-level research. Until they appear, it is
the most important that appropriate quarantine measures are retained. In mainland China, the
quarantine measures should not be relaxed before the end of March, 2020. China can fully resume
production with appropriate anti-epidemic measures beginning in early April, 2020. The results of
this study also implied that other countries now facing the epidemic outbreaks should act more
decisively and take in time quarantine measures though it may have negative short-term public
and economic consequences (Editorial, 2020).
Contributors
Liu X L designed the QSEIR model, gave method to estimate parameters, compiled MATLAB
program, got results and wrote the draft of the manuscript. Hewings G suggested to make sensitive
analysis of parameters and estimate effects of different containment strategies. He edited the
manuscript. Wang S Y explained some results and provided policy implications. Qin M H, Xiang
X, Zheng S and Li X F collected data, some references and analyzed some data, the four of them
made equal contributions to the paper.
Declaration of interests
We declare no competing interests.
Acknowledgements
3 https://www.cnbeta.com/articles/science/947877.htm
All rights reserved. No reuse allowed without permission. (which was not certified by peer review) is the author/funder, who has granted medRxiv a license to display the preprint in perpetuity.
The copyright holder for this preprintthis version posted March 13, 2020. .https://doi.org/10.1101/2020.03.09.20033498doi: medRxiv preprint

14
This paper was supported by the 2019 Chinese Government Scholarship and National Natural
Science Foundation of China under Grants No. 71874184 and No. 71988101.
References
1. Althaus C L. Estimating the reproduction number of Ebola virus (EBOV) during the 2014
outbreak in west Africa. PLoS Currents 2014; 6: ecurrents.
outbreaks.91afb5e0f279e7f29e7056095255b288.
doi:10.1371/currents.outbreaks.91afb5e0f279e7f29e7056095255b288.
2. Anastassopoulou C, Russo L, Tsakris A, et al. Data-based analysis, modelling and forecasting
of the novel Coronavirus (2019-nCoV) outbreak. medRxiv 2020; doi:
https://doi.org/10.1101/2020.02.11.20022186.
3. Ayittey F K, Ayittey M K, Chiwero N B, et al. Economic impacts of Wuhan 2019-nCoV on
China and the world. Journal of Medical Virology 2020; 1–3. doi:
https://doi.org/10.1002/jmv.25706.
4. Batista M. Estimation of the final size of the coronavirus epidemic by the logistic model. Feb
2020; doi: https://doi.org/10.1101/2020.02.16.20023606.
5. Bogoch II, Watts A, Thomas-Bachli A, et al. Pneumonia of unknown etiology in Wuhan,
China: potential for international spread via commercial air travel. Journal of Travel Medicine
2020; doi:10.1093/jtm/taaa1008.
6. Cao Z, Zhang Q, Lu X, et al. Estimating the effective reproduction number of the 2019-nCoV
in China. medRxiv 2020(a); doi: https://doi.org/10.1101/2020.01.27.20018952.
7. Cao Z, Zhang Q, Lu X, et al. Incorporating human movement data to improve epidemiological
estimates for 2019-nCoV. medRxiv 2020(b); doi:
https://doi.org/10.1101/2020.02.07.20021071.
All rights reserved. No reuse allowed without permission. (which was not certified by peer review) is the author/funder, who has granted medRxiv a license to display the preprint in perpetuity.
The copyright holder for this preprintthis version posted March 13, 2020. .https://doi.org/10.1101/2020.03.09.20033498doi: medRxiv preprint

15
8. CNN Business. Accessed February 9, 2020.
https://edition.cnn.com/2020/01/31/economy/china‐ economy‐coronavirus/index.html.
9. Cowling B J, Leung G M. Epidemiological research priorities for public health control of the
ongoing global novel coronavirus (2019-nCoV) outbreak. Eurosurveillance 2020; doi:
https://doi.org/10.2807/1560-7917.ES.2020.25.6.2000110.
10. Editorial. COVID-19: too little, too late? The Lancet 2020; 395,755, March 7. doi:
https://doi.org/10.1016/S0140-6736(20)30522-5.
11. Fan R G, Wang Y B, Luo M, et al. SEIR-based novel pneumonia transmission model and
inflection point prediction analysis (in Chinese). Journal of University of Electronic Science
and Technology of China 2020.
http://kns.cnki.net/kcms/detail/51.1207.T.20200221.1041.002.html.
12. Gamero J, Tamayo J A, Martinez-Roman J A. Forecast of the evolution of the contagious
disease caused by novel coronavirus (2019-nCoV) in China. arXiv preprint arXiv:2002.04739,
2020.
13. Geng H, Xu A D, Wang X Y, et al. Analysis of the role of current prevention and control
measures in the epidemic of new coronavirus based on SEIR model (in Chinese). Journal of
Jinan University (Natural Science & Medicine Edition) 2020; 41(2): 1-7.
http://kns.cnki.net/kcms/detail/44.1282.n.20200214.1318.002.html.
14. Hartley D M, Smith D L. Uncertainty in SARS epidemiology. The Lancet 2003; 362:170-
171.
15. Hermanowicz S W. Forecasting the Wuhan coronavirus (2019-nCoV) epidemics using a
simple (simplistic) model. medRxiv 2020; doi: https://doi.org/10.1101/2020.02.04.20020461.
All rights reserved. No reuse allowed without permission. (which was not certified by peer review) is the author/funder, who has granted medRxiv a license to display the preprint in perpetuity.
The copyright holder for this preprintthis version posted March 13, 2020. .https://doi.org/10.1101/2020.03.09.20033498doi: medRxiv preprint

16
16. Huang Y P. Impact of new coronary pneumonia and policy responses (In Chinese). Business
Observer 2020.
17. IHS Markit. Impacts of coronavirus containment effort ripple through global economy.
Accessed February 9, 2020. http://news.ihsmarkit.com/prviewer/release_only/slug/.
18. IMF News. Statement by international monetary fund president Kristalina Georgyeva on the
economic impact of the COVID-19 epidemic 2020 (In Chinese).
https://www.imf.org/zh/News/Articles/2020/02/22/pr2061-remarks-by-kristalina-georgieva-
to-g20-on-economic-impact-of-covid-19.
19. Joseph T W, Kathy L, Gabriel M L. Nowcasting and forecasting the potential domestic and
international spread of the 2019-nCoV outbreak originating in Wuhan, China: a modelling
study. The Lancet 2020. https://doi.org/10.1016/S0140-6736(20)30260-9.
20. Leung K, Wu J T, Leung G M. Nowcasting and forecasting the Wuhan 2019-nCoV outbreak.
Preprint published by the School of Public Health of the University of Hong Kong 2020;
https://files.sph.hku.hk/download/wuhan_exportation_preprint.pdf.
21. Li Q, Guan X, Wu P, et al. Early transmission dynamics in Wuhan, China, of Novel
Coronavirus–infected pneumonia. New England Journal of Medicine 2020(a); doi:
10.1056/NEJMoa2001316.
22. Li W L, Zhang G L. Impact of new coronary epidemic on China's economy (In Chinese). First
Institute of Finance and Economics 2020. http://www.cbnri.org/news/5442298.html.
23. Li X, Wu Q, Benfu L. Can search query forecast successfully in China's 2019-nCov
pneumonia?. medRxiv 2020(b); doi: https://doi.org/10.1101/2020.02.12.20022400.
24. Lipsitch M, Cohen T, Cooper B, et al. Transmission dynamics and control of severe acute
respiratory syndrome. Science 2003;300(5627): 1966-1970.
All rights reserved. No reuse allowed without permission. (which was not certified by peer review) is the author/funder, who has granted medRxiv a license to display the preprint in perpetuity.
The copyright holder for this preprintthis version posted March 13, 2020. .https://doi.org/10.1101/2020.03.09.20033498doi: medRxiv preprint

17
25. Liu Q, Liu Z, Li D, et al. Assessing the tendency of 2019-nCoV (COVID-19) outbreak in
China. medRxiv 2020(a); doi: https://doi.org/10.1101/2020.02.09.20021444.
26. Liu T, Hu J, Kang M, et al. Transmission dynamics of 2019 novel coronavirus (2019-nCoV).
bioRxiv 2020(b); doi: https://doi.org/10.1101/2020.01.25.919787.
27. Liu Y, Gayle A A, Wilder-Smith A, et al. The reproductive number of COVID-19 is higher
compared to SARS coronavirus. Journal of Travel Medicine 2020(c); doi:
10.1093/jtm/taaa021.
28. Mills C, Robins J, Lipsitch M. Transmissibility of 1918 pandemic influenza. Nature 2004;
432: 904-906. https://doi.org/10.1038/nature03063.
29. Pastor-Satorras R, Castellano C, Mieghem PV, et al. Epidemic processes in complex networks.
Review of Modern Physis 2015; 87(3): 925-979.
30. Rabajante J F. Insights from early mathematical models of 2019-nCoV acute respiratory
disease (COVID-19) dynamics. arXiv preprint arXiv:2002.05296, 2020.
31. Razum O, Becher H, Kapaun A, et al. SARS, lay epidemiology, and fear. The Lancet 2003;
361: 1739-1740.
32. Read J M, Bridgen J R E, Cummings D A T, et al. Novel coronavirus 2019-nCoV: early
estimation of epidemiological parameters and epidemic predictions. medRxiv 2020; doi:
https://doi.org/10.1101/2020.01.23.20018549.
33. Richard H. Offline: 2019-nCoV outbreak—early lessons. The Lancet 2020;
https://doi.org/10.1016/S0140-6736(20)30212-9.
34. Riou J, Althaus C L. Pattern of early human-to-human transmission of Wuhan 2019 novel
coronavirus (2019-nCoV), December 2019 to January 2020. Eurosurveillance 2020, 25(4).
All rights reserved. No reuse allowed without permission. (which was not certified by peer review) is the author/funder, who has granted medRxiv a license to display the preprint in perpetuity.
The copyright holder for this preprintthis version posted March 13, 2020. .https://doi.org/10.1101/2020.03.09.20033498doi: medRxiv preprint

18
35. Sanche S, Lin Y T, Xu C, et al. The novel coronavirus, 2019-nCoV, is highly contagious and
more infectious than initially estimated. arXiv preprint arXiv:2002.03268 2020.
36. Shen M, Peng Z, Xiao Y, et al. Modelling the epidemic trend of the 2019 novel coronavirus
outbreak in China. bioRxiv 2020; doi: https://doi.org/10.1101/2020.01.23.916726.
37. Shi P, Cao S, Feng P. SEIR Transmission dynamics model of 2019 nCoV coronavirus with
considering the weak infectious ability and changes in latency duration. medRxiv 2020; doi:
https://doi.org/10.1101/2020.02.16.20023655.
38. Su S, Li X C, Hao H, et al. Advances in research on SARS-CoV-2[J/OL] (in Chinese). Journal
of Xi'an Jiaotong University (Medical Sciences) 2020.
http://kns.cnki.net/kcms/detail/61.1399.R.20200224.0944.010.html.
39. Tang B, Wang X, Li Q, et al. Estimation of the transmission risk of the 2019-nCoV and its
implication for public health interventions. Journal of Clinical Medicine 2020; 9(2): 462.
doi:10.3390/jcm9020462.
40. Tomie T. Understanding the present status and forecasting of COVID―19 in Wuhan.
medRxiv 2020; doi: https://doi.org/10.1101/2020.02.13.20022251.
41. Tuite A R, Fisman D N. Reporting, epidemic growth, and reproduction numbers for the 2019
Novel Coronavirus (2019-nCoV) epidemic. Annals of Internal Medicine 2020.
42. Wallinga J, Teunis P. Different epidemic curves for severe acute respiratory syndrome reveal
similar impacts of control measures. American Journal of Epidemiology 2004; 160: 509–516.
43. Wang H, Wang Z, Dong Y, et al. Phase-adjusted estimation of the number of Coronavirus
Disease 2019 cases in Wuhan, China. Cell Discovery 2020(a); 6(1): 1-8. doi:
https://doi.org/10.1038/s41421-020-0148-0.
All rights reserved. No reuse allowed without permission. (which was not certified by peer review) is the author/funder, who has granted medRxiv a license to display the preprint in perpetuity.
The copyright holder for this preprintthis version posted March 13, 2020. .https://doi.org/10.1101/2020.03.09.20033498doi: medRxiv preprint

19
44. Wang Z X, Liu Z and Liu Z J. 2019-nCoV analysis and forecast based on machine learning
(in Chinese). Journal of Biomedical Engineering Research 2020(b).
http://kns.cnki.net/kcms/detail/37.1413.R.20200213.0956.002.html.
45. WHO. Novel coronavirus (2019-nCoV) situation report - 7. Jan 27, 2020.
https://www.who.int/docs/default-source/coronaviruse/situation-reports/20200127-sitrep-7-
2019--ncov.pdf?sfvrsn=98ef79f5_2 (accessed Jan 27, 2020).
46. Guan W J, Ni Z Y, Hu Y, et al. Clinical characteristics of 2019 novel coronavirus infection
in China. New England Journal of Medicine 2020, doi: 10.1056/NEJMoa2002032.
47. Wu J T, Leung K, Leung G M. Nowcasting and forecasting the potential domestic and
international spread of the 2019-nCoV outbreak originating in Wuhan, China: a modelling
study. The Lancet 2020(a); doi: https://doi.org/10.1016/ S0140-6736(20)30260-9.
48. Wu W, Bai R H, Li D N, et al. Preliminary prediction of the epidemic trend of 2019 novel
coronavirus (2019-nCoV) pneumonia in Guangdong province (in Chinese). Journal of Jinan
University (Natural Science & Medicine Edition) 2020(b); 41(2): 1-6.
http://kns.cnki.net/kcms/detail/44.1282.n.20200212.1132.004.html.
49. Xiong H, Yan H. Simulating the infected population and spread trend of 2019-nCov under
different policy by EIR model. Available at SSRN 3537083 2020; doi:
https://doi.org/10.1101/2020.02.10.20021519.
50. Yan Y, Chen Y, Liu K J, et al. Modeling and prediction for the trend of outbreak of NCP
based on a time-delay dynamic system (in Chinese). Scientia Sinica Mathematica 2020; 50:
1-8. https://doi.org/10.1360/SSM-2020-0026.
51. Yang Y Q, Sun Q, Wang Y X, et al. Epidemic situation analysis and trend forecast of New
Coronavirus Pneumonia (NCP) in Chongqing (in Chinese). Journal of Chongqing Normal
All rights reserved. No reuse allowed without permission. (which was not certified by peer review) is the author/funder, who has granted medRxiv a license to display the preprint in perpetuity.
The copyright holder for this preprintthis version posted March 13, 2020. .https://doi.org/10.1101/2020.03.09.20033498doi: medRxiv preprint
20
University (Natural Science) 2020; 37(1).
http://kns.cnki.net/kcms/detail/50.1165.n.20200218.0746.002.html.
52. Zhang B, Zhou H, Zhou F. Study on SARS-COV-2 transmission and the effects of control
measures in China. medRxiv 2020; doi: https://doi.org/10.1101/2020.02.16.20023770.
53. Zhang J. Coronavirus will not cripple China’s economy, 2020.
https://www.caixinglobal.com/2020-02-12/opinion-coronavirus-will-not-cripple-chinas-
economy-101514545.html.
54. Zhao S, Lin Q, Ran J, et al. Preliminary estimation of the basic reproduction number of novel
coronavirus (2019-nCoV) in China, from 2019 to 2020: A data-driven analysis in the early
phase of the outbreak. International Journal of Infectious Diseases 2020; doi:
https://doi.org/10.1016/j.ijid.2020.01.050.
55. Zhou T, Liu Q, Yang Z, et al. Preliminary prediction of the basic reproduction number of the
novel coronavirus 2019-nCoV[J/OL] (in Chinese). Journal of Evidence-based Medicine 2020.
http://kns.cnki.net/kcms/detail/51.1656.r.20200204.1640.002.html.
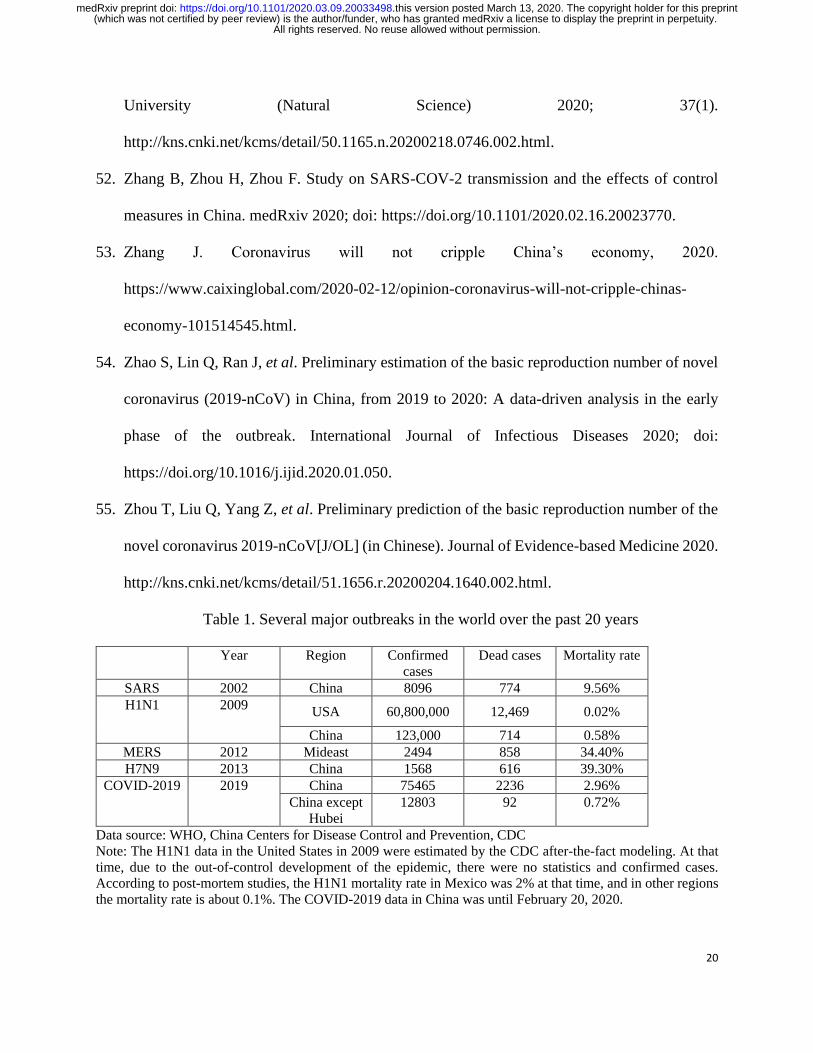
Table 1. Several major outbreaks in the world over the past 20 years
Year Region Confirmed
cases
Dead cases Mortality rate
SARS 2002 China 8096 774 9.56%
H1N1 2009 USA 60,800,000 12,469 0.02%
China 123,000 714 0.58%
MERS 2012 Mideast 2494 858 34.40%
H7N9 2013 China 1568 616 39.30%
COVID-2019 2019 China 75465 2236 2.96%
China except
Hubei
12803 92 0.72%
Data source: WHO, China Centers for Disease Control and Prevention, CDC
Note: The H1N1 data in the United States in 2009 were estimated by the CDC after-the-fact modeling. At that
time, due to the out-of-control development of the epidemic, there were no statistics and confirmed cases.
According to post-mortem studies, the H1N1 mortality rate in Mexico was 2% at that time, and in other regions
the mortality rate is about 0.1%. The COVID-2019 data in China was until February 20, 2020.
All rights reserved. No reuse allowed without permission. (which was not certified by peer review) is the author/funder, who has granted medRxiv a license to display the preprint in perpetuity.
The copyright holder for this preprintthis version posted March 13, 2020. .https://doi.org/10.1101/2020.03.09.20033498doi: medRxiv preprint

21
Table 2. The summary table of the estimated basic reproduction number R0 of four epidemics
from different studies
Epidemic R0 Sourced studies
COVID-19
1.4-2.5 WHO(1.4-2.5); Hermanowicz (2020)(2.4-2.5); Cowling
and Leung (2020)(2.2); Riou and Althaus (2020)(2.2); Li et al. (2020a)(2.2); Rabajante (2020)(2.0); Su et al.
(2020)(2.24-3.58); Li et al., (2020c)( 2.2-3.1); Geng et al. (2020)(2.38-2.72)
2.5-3.0 Zhou et al. (2020) (2.8-3.9); Su et al. (2020) (2.24-3.58);
Geng et al. (2020) (2.38-2.72); Xiong and Yan (2020)
(2.7); Li et al., (2020c) (2.2-3.1); Wu et al. (2020a) (2.68) 3.0-3.5 Zhou et al. (2020) (2.8-3.9); Su et al. (2020) (2.24-3.58); Li
et al., (2020c) (2.2-3.1); Liu et al. (2020c) (3.28); Cao et al.
(2020b) (3.24); Read et al. (2020) (3.11); Cao et al. (2020a) (3.24)
3.5-4.0 Zhou et al. (2020) (2.8-3.9); Su et al. (2020) (2.24-3.58);
Zhang et al. (2020) (3.6) 4.0-7.0 Shen et al. (2002) (4.71); Sanche et al. (2020) (4.7-6.6)
SARS 2.0-5.0 Wallinga and Teunis (2004) Ebola 1.5-2.5 Althaus (2014)
influenza 2.0-3.0 Mills et al. (2004)
Table 3. The predicted peak date of the confirmed cases in 2020 in mainland China from
different studies
Jan. 14 Feb.7 Feb.9 Feb.11 Feb.13 Feb.12-13
Yan et al. (2020)
Tang et al. (2020)
Batista (2020) Tomie (2020) Wang et al. (2020b)
Gamero et al. (2020)
Feb.16 Feb.16/17 Mid of Feb. Feb.19 Feb.29 The beginning
of March
Xiong and Yan
(2020)
Li et al.
(2020a)
Hermanowicz
(2020)
Shi et al.
(2020)
Anastassopoulo
u et al. (2020)
Geng et al.
(2020)
Table 4. The calculated value of four parameters with equations (8)-(12)
Date in 2020 β(t) γ(t) δ(t) η(t)
Jan.23 0.0616 0.1212 0.6000 0.2424
Jan.24 0.0954 0.1481 19.0417 0.5926
Jan.25 0.1458 0.3929 25.4815 0.5357
Jan.26 0.1965 0.0488 14.2407 0.5854
Jan.27 0.3179 0.0957 13.0221 0.2766
Jan.28 0.4043 0.2529 3.7125 0.1529
Jan.29 0.4978 0.0894 1.6203 0.1617
Jan.30 0.5911 0.1090 1.0081 0.0998
Jan.31 0.6778 0.1300 0.7820 0.0830
All rights reserved. No reuse allowed without permission. (which was not certified by peer review) is the author/funder, who has granted medRxiv a license to display the preprint in perpetuity.
The copyright holder for this preprintthis version posted March 13, 2020. .https://doi.org/10.1101/2020.03.09.20033498doi: medRxiv preprint

22
Feb.1 0.7847 0.1102 0.4468 0.0584
Feb.2 0.8778 0.1217 0.4051 0.0472
Feb.3 0.9716 0.0840 0.3499 0.0342
Feb.4 1.0857 0.0995 0.3194 0.0249
Feb.5 1.1482 0.0600 0.2424 0.0168
Feb.6 1.1659 0.0674 0.1747 0.0127
Feb.7 1.1719 0.0688 0.1732 0.0116
Feb.8 1.1494 0.0644 0.1230 0.0096
Feb.9 1.2870 0.0560 0.1281 0.0086
Feb.10 1.3310 0.0520 0.1061 0.0079
Feb.11 1.4721 0.0455 0.0816 0.0059
Feb.12 1.5232 0.0604 0.5748 0.0131
Feb.13 1.5879 0.0354 0.1463 0.0006
Feb.14 1.5590 0.0522 0.0913 0.0054
Feb.15 1.5219 0.0456 0.0851 0.0049
Feb.16 1.4908 0.0448 0.0945 0.0033
Feb.17 1.4570 0.0506 0.1175 0.0029
Feb.18 1.4205 0.0507 0.1302 0.0038
Feb.19 1.3639 0.0473 0.0389 0.0030
Feb.20 1.2854 0.0544 0.0991 0.0030
Feb.21 1.2249 0.0456 0.0998 0.0021
Feb.22 1.2073 0.0400 0.0892 0.0017
Table 5. After 3 steps of selection of parameters in Table 4, the statistical characteristic and the
estimated values of them
β(t) γ(t) δ(t) η(t) α(t)
average 1.1629 0.0562 0.2100 0.0075 0.000076
93
median 0.8778 0.0521 0.1732 0.0054 0.000065
94
variance 0.0567 0.0002 0.0107 0.00004 8.4553E-
10
estimated
values
1.1601 0.0509 0.2101 0.0050 0.000069
75
Table 6. Variables and their initial values in the baseline of QSEIR model
Variables P E0 I0 R0 F0
initial values 14,0005,0000 1072 771 34 25
Table 7. The peak value and peak date of I index when β(t) was changed and the sensitive
coefficient of β(t) to I
All rights reserved. No reuse allowed without permission. (which was not certified by peer review) is the author/funder, who has granted medRxiv a license to display the preprint in perpetuity.
The copyright holder for this preprintthis version posted March 13, 2020. .https://doi.org/10.1101/2020.03.09.20033498doi: medRxiv preprint
23
Value of β(t) Peak value Peak date The sensitive coefficient
of β(t) to I
β1=1.2 69915 Feb.12 /
β2=1.7 72458 Feb.9 5087
β3=2.2 73471 Feb.7 2026
β4=2.7 74088 Feb.6 1232
β5=3.2 74696 Feb.6 1217
Table 8. The peak value and peak date of I index when δ(t) was changed and the sensitive
coefficient of δ(t) to I
Value of δ(t) Peak value Peak date The sensitive coefficient of δ(t)
to I
δ1=0.0474 35986 Mar.3 /
δ2=0.0948 50463 Feb.22 305423
δ3=0.1422 59253 Feb.17 185434
δ4=0.1896 65353 Feb.14 128712
δ5=0.2370 69915 Feb.12 96230
Table 9. The peak value and peak date of I index when γ(t) was changed and the sensitive
coefficient of γ(t) to I
Value of γ(t) Peak value Peak date The sensitive coefficient of γ(t) to
I
γ1=0.0104 93941 Feb.15 /
γ2=0.0208 86197 Feb.14 -743216
γ3=0.0313 79944 Feb.13 -600016
γ4=0.0417 74495 Feb.12 -522950
γ5=0.0521 69915 Feb.12 -439580
Table 10. The peak value and date of I when η(t) was changed and the sensitive coefficient of
η(t) to I index
Value of η(t) Peak value Peak date The sensitive coefficient of η(t)
to I
η1=0.0011 71762.2 Feb.12 /
η2=0.0022 71293.6 Feb.12 -426000
η3=0.0032 70829.6 Feb.12 -464000
η4=0.0043 70370.0 Feb.12 -417818
η5=0.0054 69914.8 Feb.12 -413818
All rights reserved. No reuse allowed without permission. (which was not certified by peer review) is the author/funder, who has granted medRxiv a license to display the preprint in perpetuity.
The copyright holder for this preprintthis version posted March 13, 2020. .https://doi.org/10.1101/2020.03.09.20033498doi: medRxiv preprint

24
Table 11. The peak value and date of I when α(t) was changed and the sensitive coefficient of
α(t) to I index
Value of α(t) Peak value Peak date The sensitive coefficient of α(t) to I
α1=0.00001626 14002.6 Feb.7 /
α2=0.00003252 27960.1 Feb.9 858,291,245
α3=0.00004879 41908.2 Feb.11 857,706,999
α4=0.00006505 55850.7 Feb.11 857,367,762
α5=0.00008131 69914.8 Feb.12 864,845,267
Table 12. The initial values of variables when the simulation began from different dates and the
main results
Initial values Main results
simulation
began date in
2020
E I R F peak value
of I peak date
of I in
2020
end date of the
epidemic in 2020
Jan.23 1072 771 34 25 69915 Feb.12 Aug.22
Jan.30 15238 9308 171 213 70571 Feb.11 Aug.21
Feb.6 26359 28985 1540 636 70953 Feb.15 Aug.25
All rights reserved. No reuse allowed without permission. (which was not certified by peer review) is the author/funder, who has granted medRxiv a license to display the preprint in perpetuity.
The copyright holder for this preprintthis version posted March 13, 2020. .https://doi.org/10.1101/2020.03.09.20033498doi: medRxiv preprint

Figure 1. Timeline comparison between SARS and COVID-19
All rights reserved. N
o reuse allowed w
ithout permission.
(which w
as not certified by peer review) is the author/funder, w
ho has granted medR
xiv a license to display the preprint in perpetuity. T
he copyright holder for this preprintthis version posted M
arch 13, 2020. .
https://doi.org/10.1101/2020.03.09.20033498doi:
medR
xiv preprint

Figure 2. Countries, territories or areas with reported confirmed cases of COVID-19, 22 February 2020 (sourced from WHO)
*The situation report includes information provided by national authorities as of 10 AM Central
European Time
Figure 3. The changes of people among different status when one epidemic outbreaks
type F η(t)
α(t)
β(t)
δ(t)
type E type S
type R
type I
γ(t)
P
All rights reserved. No reuse allowed without permission. (which was not certified by peer review) is the author/funder, who has granted medRxiv a license to display the preprint in perpetuity.
The copyright holder for this preprintthis version posted March 13, 2020. .https://doi.org/10.1101/2020.03.09.20033498doi: medRxiv preprint

Figure 4. Part of simulation results when parameters were set with random values in
their statistical ranges
Figure 5. The main results of QSEIR model with the assigned values of parameters in baseline
6.80E-05
6.85E-05
6.90E-05
6.95E-05
7.00E-05
7.05E-05
7.10E-05
7.15E-05
0
0.05
0.1
0.15
0.2
0.25
1 2 3 4 5 6 7 8 9 10 11 12 13 14 15 16 17 18 19 20
errc δ γ η α(right)
All rights reserved. No reuse allowed without permission. (which was not certified by peer review) is the author/funder, who has granted medRxiv a license to display the preprint in perpetuity.
The copyright holder for this preprintthis version posted March 13, 2020. .https://doi.org/10.1101/2020.03.09.20033498doi: medRxiv preprint

Figure 6. When β(t)=1.2 increase 0.5 each time and other parameters unchanged, the trend of I index
Figure 7. When δ(t)=0.2370 decrease 20% each time and other parameters unchanged, the trend of I
All rights reserved. No reuse allowed without permission. (which was not certified by peer review) is the author/funder, who has granted medRxiv a license to display the preprint in perpetuity.
The copyright holder for this preprintthis version posted March 13, 2020. .https://doi.org/10.1101/2020.03.09.20033498doi: medRxiv preprint

Figure 8. When γ(t)=0.0521 decrease 20% each time and other parameters unchanged, the trend of I index
Figure 9. When η(t)=0.0054 decrease 20% each time and other parameters unchanged, the trend of I
All rights reserved. No reuse allowed without permission. (which was not certified by peer review) is the author/funder, who has granted medRxiv a license to display the preprint in perpetuity.
The copyright holder for this preprintthis version posted March 13, 2020. .https://doi.org/10.1101/2020.03.09.20033498doi: medRxiv preprint

Figure 10. When α(t)=0.00008131 decrease 20% each time and other parameters unchanged, the trend of I index
Figure 11. The main results of QSEIR model when the simulation began on January 30, 2020
All rights reserved. No reuse allowed without permission. (which was not certified by peer review) is the author/funder, who has granted medRxiv a license to display the preprint in perpetuity.
The copyright holder for this preprintthis version posted March 13, 2020. .https://doi.org/10.1101/2020.03.09.20033498doi: medRxiv preprint

Figure12. The comparison of I index when the simulation started from different dates
Figure13. The comparison of I index when strict quarantine measures would be
relaxed (alpha increased from 0.00006975 to 0.00007975) beginning on March10, 2020
0
10000
20000
30000
40000
50000
60000
70000
80000
Jan.
23Fe
b.2
Feb.
12Fe
b.22
Mar
.2M
ar.1
2M
ar.2
2A
pr.1
Apr
.11
Apr
.21
May
.1M
ay.1
1M
ay.2
1M
ay.3
1Ju
ne.1
0Ju
ne.2
0Ju
ne.3
0Ju
ly.1
0Ju
ly.2
0Ju
ly.3
0A
ug.9
Aug
.19
Aug
.29
Sep
.8S
ep.1
8S
ep.2
8O
ct.8
Oct
.18
Oct
.28
Nov
.7
start from Jan.23 start from Jan.30 start from Feb.6
0
10000
20000
30000
40000
50000
60000
70000
Jan.
23Fe
b.2
Feb.
12Fe
b.22
Mar
.2M
ar.1
2M
ar.2
2A
pr.1
Apr
.11
Apr
.21
May
.1M
ay.1
1M
ay.2
1M
ay.3
1Ju
ne.1
0Ju
ne.2
0Ju
ne.3
0Ju
ly.1
0Ju
ly.2
0Ju
ly.3
0A
ug.9
Aug
.19
Aug
.29
Sep.
8Se
p.18
Sep.
28O
ct.8
Oct
.18
Oct
.28
Nov
.7
I1 I2
All rights reserved. No reuse allowed without permission. (which was not certified by peer review) is the author/funder, who has granted medRxiv a license to display the preprint in perpetuity.
The copyright holder for this preprintthis version posted March 13, 2020. .https://doi.org/10.1101/2020.03.09.20033498doi: medRxiv preprint


