MODELING THE EFFECT OF AMMONIA
ON THE GLYCOSYLATION PATTERN OF
MONOCLONAL ANTIBODIES PRODUCED
BY CHINESE HAMSTER OVARY CELLS
by
Joanna Adadevoh
A thesis submitted to the Faculty of the University of Delaware in partial fulfillment of the requirements for the degree of Honors Bachelor of Chemical Engineering with Distinction
Spring 2012
© 2012 Joanna Adadevoh All Rights Reserved

MODELING THE EFFECT OF AMMONIA
ON THE GLYCOSYLATION PATTERN OF
MONOCLONAL ANTIBODIES PRODUCED
BY CHINESE HAMSTER OVARY CELLS
by
Joanna Adadevoh
Approved: __________________________________________________________ Babatunde A. Ogunnaike, Ph.D. Professor in charge of thesis on behalf of the Advisory Committee Approved: __________________________________________________________ Anne S. Robinson, Ph.D. Committee member from the Department of Chemical Engineering Approved: __________________________________________________________ Susan E. Groh, Ph.D. Committee member from the Board of Senior Thesis Readers Approved: __________________________________________________________ Michael Arnold, Ph.D. Director, University Honors Program

iii
ACKNOWLEDGMENTS
I would like to give special thanks to God Almighty, without whom I would
not have had the motivation and strength to complete this thesis. I would also like to
thank my family for their moral support and encouragement. I thank Dean Babatunde
Ogunnaike for giving me the opportunity to work under his research group and for
helping me through with this thesis. I thank the entire Ogunnaike research group, and
in particular Melissa St.Amand and Devesh Radhakrishnan for their continuous
support, advice, and help in the writing of this thesis.
I thank Dr. Anne Robinson who took the time to meet with me to discuss my
thesis work and progress even while she was away from Delaware. Finally, I would
like to thank Dr. Susan Groh for her support and advice during group presentations.
Thanks to you all and God bless.

iv
TABLE OF CONTENTS
LIST OF TABLES ........................................................................................................ vi LIST OF FIGURES ...................................................................................................... vii ABSTRACT .................................................................................................................. ix
1 INTRODUCTION .............................................................................................. 1
1.1 Monoclonal Antibodies ............................................................................. 1 1.2 Glycosylation – Overview ......................................................................... 2 1.3 Glycosylation – Multi-scale Perspective ................................................... 4 1.4 Ammonia ................................................................................................... 5 1.5 Effect of Ammonia on Protein Sialylation ................................................ 6 1.6 Motivation ................................................................................................. 7
2 MODEL DEVELOPMENT ............................................................................... 9
2.1 Introduction to the Model .......................................................................... 9 2.2 Sub-Model 1: Glutamine to Extracellular Ammonium ........................... 11 2.3 Sub-Model 2: Extracellular Ammonium to Intracellular Ammonium .... 12 2.4 Sub-Models 3 – 6: Extracellular Ammonium to Intracellular Processes 14
2.4.1 Sub-Model 3: Reduction in the Expression Level of CMP-SAT 14 2.4.2 Sub-Model 4: Increase in the Intracellular UDP-GlcNAc
Concentration .............................................................................. 17 2.4.3 Sub-Model 5: CMP-NANA Transport Inhibition by UDP-
GlcNAc ........................................................................................ 22 2.4.4 Sub-Model 6: Increase in trans-Golgi pH ................................... 23
2.5 Summary .................................................................................................. 30
3 MODEL RESULTS AND DISCUSSION ....................................................... 32
3.1 Extracellular and Intracellular Ammonium Concentration ..................... 32 3.2 Effect of Extracellular Ammonium on UDP-Glucosamine ..................... 34 3.3 Effect of Extracellular Ammonium on the pH of the trans-Golgi and
on the Activity of the Alpha2,3-Sialyl Transferase Enzyme ................... 36 3.4 Effect of Extracellular Ammonium on CMP-SAT and Alpha-2,3-ST .... 39 3.5 Summary .................................................................................................. 41

v
4 CONCLUSION ................................................................................................ 42
REFERENCES ............................................................................................................. 45
A MODEL DERIVATIONS ................................................................................ 47
A.1 Sialylation Rate Equation ........................................................................ 47
B RELEVANT GRAPHS .................................................................................... 49

vi
LIST OF TABLES
Table 1: Literature Sources for Parameter Values of

vii
LIST OF FIGURES
Figure 1: Structure of a Monoclonal Antibody from Thermo Fisher Scientific Inc., 2012. .................................................................................................. 2
Figure 2: N-Glycan Attached to a MAb ................................................................... 3
Figure 3: Multi-scale nature of glycosylation. .......................................................... 5
Figure 4: Schematic of Approach to Model Development.. ................................... 10
Figure 5: Figures reproduced from Chen and Harcum (2006) ............................... 15
Figure 6: Normalized Gene Expression of CMP-SAT versus Extracellular Ammonium Concentration. ..................................................................... 16
Figure 7: Plots reproduced from Gawlitzek et al. (1999) ....................................... 19
Figure 8: Cell Specific UDP-GlcNAc as a function of Extracellular Ammonium . 20
Figure 9: Sub-Model 4 for the Effect of Ammonium on UDP-GlcNAc ................ 22
Figure 10: Experimental Graph of the Relative Activity of α2,3-ST and β1,4-GT as a Function of pH Obtained from Gawlitzek et al. (2000) ................... 27
Figure 11: Experimental Data of Graph of

viii
Figure 17: Model and Experimental Results for Relative Alpha-2,3-ST Enzyme Activity versus Trans-Golgi pH .............................................................. 38
Figure 18: Rate of CMP-sialic acid Transport as a Function of Extracellular Ammonium Concentration ...................................................................... 39
Figure 19: Relative Activity of Alpha-2,3-ST as a Function of Extracellular Ammonium Concentration ...................................................................... 40
Figure B1: Cell Specific UDP-GlcNAc as a Function of Glutamine Concentration at 80 Hours of Culture Time. ................................................................... 49
Figure B2: Hydrogen Ion Concentration in the Cytosol versus Culture Time .......... 50

ix
ABSTRACT
Monoclonal antibodies (mAbs) are therapeutic recombinant proteins which are
typically produced industrially by Chinese Hamster Ovary Cells (CHO). In order to
approve mAbs for therapeutic purposes, regulatory agencies require manufacturers to
assure the bioactivity, purity, and potency of these proteins to consumers. Regulatory
agencies now encourage manufacturers to develop strategies to control quality
attributes online. One of the most important factors affecting the quality and
bioactivity of mAbs is glycosylation – the addition of a carbohydrate chain to a
protein. Glycosylation is a post-translational modification which exhibits
heterogeneity that arises from variations in site occupancy and structure of attached
glycans. As a result of such heterogeneity, glycosylation presents a challenge to
manufacturers of mAbs yet an on-line control strategy does not exist for glycosylation.
While a number of culture conditions have been found to influence mAb glycoform
distribution, in order to develop effective control schemes, it is important to
understand the mechanisms underlying how these culture conditions affect
glycosylation.
One such culture condition is ammonia levels in culture media. Ammonia has
been found to adversely affect cell growth and viability. It is also known to induce
heterogeneity in glycosylation by affecting the extent of terminal sialylation, the
transfer of a sialic acid residue to a glycoprotein. A few mechanisms have been
proposed to describe how ammonia affects sialylation: one involves the reduction of
CMP-sialic acid transporter (CMP-SAT) expression level by ammonia; another, the

x
inhibition of CMP-SAT by an increase in UDP-GlcNAc in the presence of ammonia;
and still another, the increase in the trans-Golgi pH causing a decrease in sialylation
enzymes. The aim of this study is to develop a model based on these mechanisms in
order to understand at a fundamental level the effects of ammonia on glycosylation.
The model developed in this study can be used in conjunction with the
Krambeck and Betenbaugh (2005) model to determine the ammonia concentration
required in the cell culture to achieve the desired sialic acid content on the mAb. The
model approach can also be employed for other culture conditions that affect
glycosylation. This model work will aid in the development of a method for on-line
quality control of the glycosylation pattern of mAbs.

1
Chapter 1
INTRODUCTION
1.1 Monoclonal Antibodies
Monoclonal antibodies (mAbs) are proteins that have a high specificity for a
target molecule known as an antigen and act as the active component in many
therapeutic protein drugs (Saylor, Dadachova, and Casadevall 2009). MAbs are
composed of two light and two heavy polypeptide chains which are held together by
inter-chain disulfide bonds and non-covalent interactions. As glycoproteins, MAbs
usually have oligosaccharide structures, termed glycans, attached to their CH2 domains
(see Figure 1). The majority of therapeutic monoclonal antibodies are produced as
recombinant proteins in Chinese hamster ovary (CHO) cells that are cultivated in
bioreactors.

2
Figure 1: Structure of a Monoclonal Antibody from Thermo Fisher Scientific Inc., 2012. <http://www.piercenet.com/browse.cfm?fldID=F655EBCB-5056-8A76-4EBE-966C71343C68>
1.2 Glycosylation – Overview
MAbs undergo glycosylation, a post-translational modification in which a
glycan structure is attached to a protein. This cellular process occurs in the
endoplasmic reticulum (ER) and the Golgi apparatus of mammalian cells. There are a
number of ways in which oligosaccharides are attached to proteins and some of the
ways are via an N-glycosidic bond, an O-glycosidic bond, and a
Glycophosphatidylinositol anchor. This thesis focuses on glycosylation that occurs via
an N-glycosidic bond, mainly because it is the most common type of glycosylation
found in biopharmaceuticals and because the glycosylation pattern has a significant

3
effect on the protein structure and function (Butler, 2006). As shown in Figure 2, the
core glycan involved in N-glycosylation is a pentasaccharide consisting of three
mannose and two N-acetylglucosamine (Man3GlcNAc2) that is attached via an N-
glycosidic bond to the Asparagine residue of an Asparagine-X-Serine/Threonine (Asn-
X-Ser/Thr) amino acid sequence where X is any amino acid except Proline (Butler,
2006).
Figure 2: N-Glycan Attached to a MAb
Glycosylation is an important modification of antibodies because it affects the
biological properties of mAbs such as pharmacokinetics, secretion, receptor
recognition and antigenicity (Butler, 2006). However, the intracellular process of
glycosylation is subject to much variability and there is heterogeneity associated with
the final glycan structure. The heterogeneity arises when there are variations in the
mAb glycosylation profile due to varying site occupancy and structure of attached
glycans. Therefore, to assure the safety and efficacy of these products, regulatory
agencies require manufacturers to ensure that glycosylation patterns are consistent
between batches of mAbs. Currently manufacturers merely test the final product
Mannose Glucosamine
X ≠ Proline
4
quality offline and post production. However, regulatory agencies are starting to
encourage online quality assurance of these products, but to date no methods exist to
monitor or control glycosylation online. To address the need for producing mAbs with
consistent glycosylation patterns in the biopharmaceutical industry, the Ogunnaike
group aims to develop a strategy for online real-time control of glycosylation in mAbs.
1.3 Glycosylation – Multi-scale Perspective
The approach that the Ogunnaike group proposes for online real-time control
of glycosylation in mAbs incorporates the multi-scale nature of glycosylation that
consists of micro-scale, meso-scale, and macro-scale levels of impact. Glycosylation,
which occurs in the ER and Golgi (micro-scale), is affected by the intracellular
processes occurring in CHO cells (meso-scale) which in turn are affected by the
culture conditions in the bioreactor (macro-scale). The culture conditions that are
monitored in the bioreactor include ammonia concentration, pH, dissolved oxygen
content, temperature etc. These process variables are easy to measure and control. For
example, the pH of the culture is measured using a pH probe and can be controlled
using a buffer solution. The changes in the culture conditions induce changes in the
intracellular processes occurring within the cell. For instance, an increase in the pH of
the culture could lead to an increase in the pH of the cell cytoplasm. The changes in
the meso-scale in turn affect the glycosylation process occurring in the ER and the
Golgi. For example, an increase in the pH of the cell cytoplasm would affect the pH in
the Golgi which would in turn affect the activity of the glycosylation enzymes. The
change in activity of the glycosylation enzymes would affect the glycosylation pattern
of the mAbs. Figure 3 illustrates the multi-scale nature of glycosylation.

5
Figure 3: Multi-scale nature of glycosylation. Three scales present: macro-scale, meso-scale, and micro-scale.
To ensure that mAb manufacturers obtain the desired final glycan structure on
the antibodies, it is important to develop a method for controlling glycosylation online
during mAb production. Unfortunately, the processes occurring in the meso and
micro-scales that affect glycosylation are not easy to control. However, as explained
above, the cell culture conditions, which are easy to monitor and control, affect the
meso and micro-scale processes. A quantitative correlation between the bioreactor
process conditions and the processes occurring in the meso and micro-scale is required
to develop an effective control strategy for glycosylation. This thesis aims to develop a
mathematical model that would link one of the culture process conditions – ammonia
– to the meso and micro-scale processes such that ammonia’s effect on glycosylation
can be quantified.
1.4 Ammonia
Ammonia (also referred to as ammonium in this thesis) is a toxic byproduct of
amino acid metabolism and it is known to adversely affect the growth and viability of

6
cells in culture (Borys, Linzer and Papoutsakis 1993). A primary source of ammonia
in cell culture is glutamine. Although glutamine is an energy source for cells, its
metabolism and decomposition lead to the production of ammonia in the culture. The
ammonia produced diffuses into the cytosol of the CHO cells and affects some of the
intracellular processes occurring in the cell such as the pH of organelles or activity of
enzymes. These changes in intracellular processes in turn affect the glycosylation
process occurring in the Golgi. For example, studies have shown that ammonia affects
glycosylation by decreasing the extent of terminal sialylation which occurs in the
Golgi (Andersen and Goochee 1994; Yang and Butler, 2000). A number of
mechanisms, which are explained in the following section, have been proposed to
explain how ammonia affects sialylation.
1.5 Effect of Ammonia on Protein Sialylation
Sialylation is a type of glycosylation in which a sialic acid is attached to the
glycan structure of a glycoprotein. The structure of sialic acid varies between species;
the sialic acid associated with humans is N-acetyl-neuraminic acid aka NANA (Butler,
2006). Although most mice have a different sialic acid structure (N-glycolyl-
neuraminic acid, NGNA), CHO cells produce mAbs that have mainly NANA which is
important for compatibility in humans (Butler, 2006).
Sialylation affects the circulatory half-life of mAbs in the human body. A
decrease in the extent of terminal sialylation causes the glycoprotein to be more
susceptible to degradation by asialoglycoprotein receptors and this leads to a decrease
in the circulatory half-life of the drug.
In the cytosol of the cell, sialic acid is present in the form of a nucleotide donor
(CMP-NANA) which is transported to the Golgi apparatus via the CMP-sialic acid

7
transporter (CMP-SAT). In the trans-Golgi, the sialic acid is transferred from the
CMP-NANA molecule to the glycan structure of the mAb via the α-2,3-sialyl
transferase enzyme. A number of mechanisms have been proposed to explain how
ammonia decreases the extent of terminal sialylation and three of these mechanisms
are summarized as follows (Butler, 2006):
• Ammonia decreases the expression of CMP-SAT
• Ammonia is a precursor for UDP-GlcNAc which is a nucleotide that inhibits
CMP-SAT
• Ammonia increases the pH of the trans-Golgi which in turn decreases the
activity of the α-2,3-sialyl transferase enzyme.
These mechanisms are employed in developing a mathematical model for the effect of
ammonia on glycosylation – specifically on the extent of terminal sialylation – and are
investigated in greater detail in the following chapters.
1.6 Motivation
The main purpose of this thesis is to develop a mathematical model to
investigate the effect of ammonia on the glycosylation pattern of monoclonal
antibodies. Developing this mathematical model will be the first step in mapping out
the influence of culture conditions on glycosylation following a multi-scaled
perspective. With this mathematical model, experimenters will be able to determine
how much glutamine should be added to the cell culture in order to achieve a desired
sialic acid content in the final glycan distribution of the mAb. The ability to predict the
extent of terminal sialylation for a given glutamine or ammonia concentration would
help manufacturers decide how much glutamine to add to their culture in order to get
their desired sialic acid distribution. A few simplifying assumptions were made in the

8
development of the model and will be further discussed in subsequent chapters.
However, these assumptions can be relaxed in order to expand the case range to which
the model applies. The model approach used for this thesis could also be used for
other culture conditions that affect glycosylation. The following chapters are divided
into Model Development (Chapter 2), Model Results (Chapter 3) and Conclusion
(Chapter 4).

9
Chapter 2
MODEL DEVELOPMENT
2.1 Introduction to the Model
The mathematical model developed to investigate the effect of ammonium on
the glycosylation pattern of monoclonal antibodies is made up of a combination of six
sub-models. Each sub-model describes a specific stage in the pathway of ammonium
from the cell culture to the Golgi. To begin, the first sub-model is the relationship
between the glutamine concentration in the culture and the extracellular ammonium
concentration. The ammonium present in the culture arises from the decomposition
and cellular metabolism of glutamine. This first sub-model is important because it will
allow users to predict the quantity of glutamine required to obtain an extracellular
ammonium concentration that would yield the desired sialic acid distribution once the
main model is completely developed. The second sub-model gives the correlation
between the extracellular and intracellular ammonium concentrations. Once the
intracellular ammonium concentration is computed, its effect on intracellular
processes can also be determined. In particular, this thesis focuses on the following
intracellular processes (Butler, 2006):
1) Reduction in the expression level of CMP-SAT
2) Increase in the intracellular UDP-GlcNAc concentration
3) Inhibition of CMP-NANA transport by UDP-GlcNAc
4) Increase in the pH of the trans-Golgi and its effect on enzyme activity

10
Each of these intracellular processes has a sub-model. All the sub-models are
explained in greater detail in the following sections of this chapter. To sum up the
approach to the model development, glutamine is decomposed or metabolized to form
ammonium. The ammonium diffuses into the cell and affects some of the intracellular
processes including UDP-GlcNAc expression levels, CMP-SAT expression levels and
activity, and trans-Golgi pH. These intracellular processes in turn affect the extent of
terminal sialylation. A schematic to explain the model approach is displayed in Figure
4.
Figure 4: Schematic of Approach to Model Development. Each sub-model is labeled 1 to 6 on the diagram.
It is important to note that the graphs illustrated in the following sections of
Chapter 2 are based on the experimental results of some researchers – whose names
will be explicitly stated – and on how their experimental results aid the model
development.

11
2.2 Sub-Model 1: Glutamine to Extracellular Ammonium
Glutamine, when present in the culture, diffuses through the cell membrane
into the mitochondrial matrix where it is catabolized by a phosphate-dependent
glutaminase to form glutamate and a molecule of ammonium (Schneider et al., 1996).
The glutamate is further degraded by glutamate dehydrogenase to form another
molecule of ammonium. The molecules of ammonium present in the mitochondrion
form an equilibrium with ammonia based on the pH of the matrix:

12
where k is the glutamine decomposition rate constant and [Gln] is the glutamine
concentration. k depends on the pH of the media and is given by
13
transport. The ammonia, on the other hand, diffuses from the cytosol to the culture
because it has a higher permeability through the cell membrane. Hence, there is a
continuous flux of ammonium/ammonia in and out of the cell membrane. Wu, Ray,
and Shuler (1993) developed a model for the flux of ammonium into the cell
membrane as shown:

14
No literature value was found for

15
initial concentration of 10mM NH4+. Other than the difference in their ammonium
concentrations, the cultures were exposed to the same conditions. The ammonium
concentration in each culture was measured at different culture times. At the end of the
culture time, the cells were harvested and the supernatant and pellets were preserved at
-20 and -80oC, respectively, for subsequent gene expression analysis. The expression
level of the CMP-SAT gene was measured using real time quantitative reverse
transcription (QRT) polymerase chain reaction (PCR). The results that are relevant to
the development of sub-model 3 are displayed in Figure 5.
Figure 5: Figures reproduced from Chen and Harcum (2006)
Nor
mal
ized
Gen
e E
xpre
ssio
n
[NH4+]control = white bars
[NH4+]elevated = black bars
Control ( ) Elevated ( )

16
These results show that though the gene expression of the CMP-SAT (also
known as CMP-SiaT in the Chen and Harcum paper) does not vary with culture time,
it does decrease with an increase in ammonium concentration in the culture. This is
consistent with one of the previously proposed mechanisms by which ammonium
affects sialylation.
From these experimental results, a plot of normalized CMP-SAT gene
expression versus ammonium concentration in the culture was made for the case of
elevated ammonium. A linear equation was fit to the plot using Minitab® to obtain a
direct relationship between ammonium and the gene expression level of CMP-SAT.
The plot obtained and the corresponding linear equation are shown in Figure 6.
12111098
2.0
1.5
1.0
0.5
[NH4+] mM
Norm
aliz
ed C
MP-
SAT
Gene
Exp
ress
ion
S 0.128326R-Sq 76.7%R-Sq(adj) 68.9%
Regression95% CI95% PI
CMP-SAT Gene Expression versus Extracellular Ammonium ConcentrationCMP-SAT = - 0.2550 + 0.1274 [NH4+]
Figure 6: Normalized Gene Expression of CMP-SAT versus Extracellular Ammonium Concentration.

17
Figure 6 shows an upward sloping curve which implies that as the ammonium
concentration increases, the CMP-SAT gene expression increases. However, this is
inconsistent with the experimental results in Figure 5 and the mechanisms proposed by
previous studies. The trend of the graph, however, can be explained. If two CHO cell
cultures have different concentrations of ammonium, the culture with the lower
concentration of ammonium will have a higher CMP-SAT expression. This
relationship is what is observed in Figure 5. Figure 6, however, shows the trend of
CMP-SAT with ammonium for one culture and does not compare to another culture
with a different ammonium concentration. Hence, it is possible for the CMP-SAT
expression in a culture with elevated ammonium to increase during the culture period,
and still be relatively lower when compared to another culture of lower ammonium
concentration. The red dotted line represents the confidence interval and the blue
dotted line represents the prediction interval of the graph. The p-value associated with
the graph in Figure 6 is 0.052 implying that the results are statistically relevant. Figure
5 and 6 are effective for explaining the effect of ammonium on CMP-SAT but they
will not be used in the model development because they represent data for the gene
expression, not protein concentration, of CMP-SAT. This analysis of the effect of
ammonia on CMP-SAT was performed in order to obtain a comprehensive
understanding of the role of ammonium on glycosylation. However, it was not
included in the model. For model calculations, the CMP-SAT concentration was
assumed to be constant.
2.4.2 Sub-Model 4: Increase in the Intracellular UDP-GlcNAc Concentration
To develop a sub-model for the effect of ammonium on the intracellular
concentration of UDP-GlcNAc, a study performed by Gawlitzek et al. (1999) was

18
analyzed. In the study, 15N from ammonium was incorporated into the glycan structure
of a mAb produced by CHO cells. The cells were initially cultured in a 10 l bioreactor
with a working volume of 8.5 l for 4 days. During the 4 days, the cells were not
subject to any ammonium ions or glutamine except those present in the culture
medium. On the 4th day, the cells were harvested and resuspended in 4 media types:
(1) glutamine-free + 13 mM NaCl, (2) glutamine-free + 13 mM 15NH4Cl, (3)
glutamine containing + 13 mM NaCl, (4) glutamine-containing + 13 mM 15NH4Cl.
Each media type was duplicated resulting in 8 flasks of CHO culture. The cultures
were harvested on the 10th day. The ammonium concentration and intracellular
uridine-5’-diphospho-N-acetyl hexosamine (UDP-GNAc) pool in each culture were
measured each day. UDP-GNAc is the sum of the UDP-glucosamine (UDP-GlcNAc)
and UDP-galactosamine (UDP-GalNAc) content present in the cell. The results from
Gawlitzek et al. that are relevant to the development of sub-model 4 are presented in
Figure 7.

19
Figure 7: Plots reproduced from Gawlitzek et al. (1999)
– Gln + 13 mM NaCl – Gln + 13 mM 15NH4Cl + Gln + 13 mM NaCl + Gln + 13 mM 15NH4Cl

20
The plots on Figure 7 show the trends in extracellular ammonium
concentration and cell specific UDP-GNAc content with culture time. From these
results, the graph of cell specific UDP-GlcNAc versus extracellular ammonium
concentration was plotted for the first four culture days. It was assumed that the UDP-
GlcNAc content was half of the reported UDP-GNAc. This assumption was based on
the knowledge that UDP-GlcNAc is in equilibrium with UDP-GalNAc. Figure 8
shows the plot of the experimental values and the exponential model fit with
equation

21
The model compares well with the last three experimental data points.
However, the first two experimental points do not fit well to the model because they
do not follow the exponential relationship. Based on this discrepancy between the
experimental and model curve, it was assumed that the first two measurements of
UDP-GlcNAc were taken during the cell growth lag phase when the cells were
focused on adapting to the culture environment rather than on growing or producing
UDP-GlcNAc. This is a valid assumption because the first two UDP-GlcNAc
measurements were taken before day 2 of cell culturing. In light of this, a second
model was developed to determine the effect of ammonium on UDP-GlcNAc. In this
second model, it was assumed that before day 2, the cells have a constant UDP-
GlcNAc content and that after day 2, the UDP-GlcNAc content varies exponentially
with ammonium. It was also projected that after a certain culture time, the UDP-
GlcNAc content will reach a saturation point where no more UDP-GlcNAc will be
produced regardless of the extracellular ammonium concentration. This projection was
based on the knowledge that cells usually reach a stationary and, eventually, death
phase where the cells channel their remaining culture nutrients towards their viability
rather than productivity. Based on these assumptions and projections, the UDP-
GlcNAc cell content followed saturation kinetics with respect to extracellular
concentration. A graph of the modified model of the effect of ammonium on UDP-
GlcNAc is shown in Figure 9. A graph of the experimental results obtained from
Gawlitzek et al. (1999) is also shown in Figure 9.

22
121086420
8
7
6
5
4
3
2
1
0
[NH4+] mM
Cell
Spec
ific
UDP-
GlcN
Ac
(fm
ol)
Sub-Model 4Experimental
Variable
Cell Specific UDP-GlcNAc versus Extracellular Ammonium Concentration
Figure 9: Sub-Model 4 for the Effect of Ammonium on UDP-GlcNAc
The model shows a decrease in cell specific UDP-GlcNAc at an ammonium
concentration of 2 mM and then a gradual increase until it reaches a saturation point.
This decrease in UDP-GlcNAc is also seen in the experimental results (Figure 8) and
probably represents the stage in the cell culture where no UDP-GlcNAc is being
produced but the amount initially present is decreasing because it is being used for
intracellular processes such as being transported into the Golgi apparatus for
glycosylation reactions (Krambeck and Betenbaugh, 2005).
2.4.3 Sub-Model 5: CMP-NANA Transport Inhibition by UDP-GlcNAc
UDP-GlcNAc, when in excess in the cell, leads to the inhibition of CMP-SAT
that results in a decrease in the transport of CMP-NANA from the cytosol to the
Golgi. In the previous section of this Chapter, the effect of ammonium on the
expression level of UDP-GlcNAc was evaluated. Knowing the expression level of

23
UDP-GlcNAc, it is possible to determine the rate of transport of CMP-NANA into the
Golgi. CMP-SAT activity follows Michaelis-Menten kinetics; hence this rate
expression was employed to determine the transport rate. CMP-SAT was taken as the
enzyme, CMP-NANA as the substrate, and UDP-GlcNAc as the inhibitor. No other
inhibitors of CMP-SAT were taken into account. The resulting Michaelis-Menten
equation is shown in equation 8:
24
cell cytosol, it equilibrates with ammonia and H+ ion. Ammonia, which has a high
permeability, diffuses through the membrane to the Golgi where it is in equilibrium
with ammonium as given by the following reaction

25
Hence the saturation constant of

26
The ODEs were solved using the ODE 15s solver in MATLAB. The pH was
derived from the model knowing that pH = -log [H+]. Table 2 lists the literature
sources from which the model parameters were obtained. No literature values were
found for
; however, numbers within the order of magnitude of reported flux values for other ions were used. Table 2: Literature Sources for Parameter Values of Sub-Model 6 for H+ Concentration in the trans-Golgi Model Parameter Parameter Value Literature Source Wu, Ray, and Shuler, 1993 2500 µm3 Jimenez del Val et al.,2011 6.5 µm3 Jimenez del Val et al.,2011 99 µm2 Jimenez del Val et al.,2011 Wu, Ray, and Shuler, 1993 60 mM/pH Wu, Ray, and Shuler, 1993 Once the effect of ammonia on the pH of the trans-Golgi was quantified, it was important to determine how the increase in the Golgi pH would affect the activity of the α2,3-ST enzyme. A study performed by Gawlitzek et al. (2000) showed that the optimum pH of the enzyme was 6.5, which is the physiological pH of the trans-Golgi. The study also showed that the activity of the enzyme decreased as the pH increased above 6.5. This study was done using CHO cells that produced recombinant immunoadhesin tumor necrosis factor-IgG (TNFR-IgG). CHO cell lysate containing the enzyme was exposed to chloroquine, which has a similar intracellular pH effect as ammonium, and the enzyme activity was “determined using an assay based on the incorporation of fluorescently labeled [sialic acid] into an asialo-acceptor glycoprotein” (Gawlitzek et al., 2000). The graph of the enzyme activity versus pH obtained experimentally is shown in Figure 10.

27
Figure 10: Experimental Graph of the Relative Activity of α2,3-ST and β1,4-GT as a Function of pH Obtained from Gawlitzek et al. (2000)
The graph shows the relative enzyme activity for both α2,3-ST and β1,4-
galactosyltransferase (β1,4-GT) enzymes but this thesis is only concerned with the
results for α2,3-ST. The result of this study was consistent with previous studies that
showed that the normal pH of the trans-Golgi is 6.5 and that the activity of the enzyme
decreases with increasing pH above the optimum (Andersen and Goochee, 1995).
A Michaelis-Menten formulation was used to develop a model for the α2,3-ST
enzyme activity as a function of pH (named sub-model 6b). The following
assumptions were made in developing the model
1) α2,3-ST is an ionizing enzyme and depends on the pH of the Golgi to function.
This means that α2,3-ST becomes active when it binds with an H+ ion. This
assumption was made in order to incorporate the effect of the H+ ion on the
activity of the enzyme.
α2,3-ST ( ) β1,4-GT ( )

28
2) α2,3-ST has two active sites where the CMP-NANA and the glycan structure
of the protein bind.
3) Other sugar molecules compete with the substrates for the occupancy of the
active sites.
The derivation of the model is shown in Appendix A. The resulting sub-model 6b is
shown in equation 15:

29

30
Table 3: Literature Sources for Parameter Values Used in the α2,3-ST Enzyme Activity Model
Model Parameter Parameter Value Literature Source
484 min-1 Krambeck and Betenbaugh, 2005
1 µM Krambeck and Betenbaugh, 2005
950 µM Jimenez del Val et al.,2011
57 µM Krambeck and Betenbaugh, 2005
0.8 µM Chiaramonte et al., 2001
260 µM Krambeck and Betenbaugh, 2005
1200 µM Jimenez del Val et al.,2011
The values K1, K2, and

31
3) Relationship between extracellular ammonium concentration and the
expression level of CMP-SAT.
4) Relationship between extracellular ammonium concentration and UDP-
GlcNAc concentration.
5) Correlation between UDP-GlcNAc concentration and CMP-NANA
transport.
6) Correlation between extracellular ammonium concentration and the pH of
the trans-Golgi.
With sub-models 1 to 6 developed, they are combined to form the main model which
computes the effect of ammonia on the extent of terminal sialylation.

32
Chapter 3
MODEL RESULTS AND DISCUSSION
After developing the six sub-models which make up the mathematical model
that computes the effect of ammonium on the glycosylation pattern of mAbs, the
results of the model were obtained and analyzed. Chapter 3 focuses on the results and
discussion of the sub-models and how these results help to explain the effect of
ammonia on the glycosylation of mAbs produced by CHO cells. The sub-models are
listed below for reference:
1. Sub-model 1: Glutamine NH4+
extracellular
2. Sub-model 2: NH4+
extracellular NH4+
intracellular
3. Sub-model 3: NH4+
extracellular CMP-SAT
4. Sub-model 4: NH4+
extracellular UDP-GlcNAc
5. Sub-model 5: UDP-GlcNAc Transport of CMP-NANA
6. Sub-model 6: NH4+
extracellular trans-Golgi pH α2,3-ST activity
3.1 Extracellular and Intracellular Ammonium Concentration
Sub-model 1 (equation 5) and sub-model 2 (equation 6) that were previously
discussed in Chapter 2 were employed in this section. The model equations were used
to determine the ammonium concentration in the CHO cell culture and cytosol with a
known glutamine concentration of 20 mM and no initial ammonium concentration.
The model results displayed in Figure 12 are for CHO cells seeded at a density of
4E+4 cells/mL and at a temperature of 37 oC for 144 hours.

33
160140120100806040200
12
10
8
6
4
2
0
time (hours)
Am
mon
ium
Con
cent
rati
on (
mM
)
ExtracellularIntracellular
Variable
Ammonium Concentration versus Culture Time
Figure 12: Model Results for Extracellular and Intracellular Ammonium Concentrations as a Function of Culture Time. For cells seeded at 4E+4 cells/mL with a glutamine concentration of 20 mM
Figure 12 shows that the intracellular ammonium concentration is always less
than the extracellular concentration. The model values are biologically reasonable and
can be compared to the experimental values from Chen and Harcum (2006) that are
shown in Figure 5. The study shows that for the control culture (no extra ammonium
added to the culture), the extracellular ammonium concentration at 61 hours was 4
mM which is similar to the model concentration of 3 mM.
The models were also used to determine the extracellular and intracellular
ammonium concentrations at 80 hours of culture time for different initial glutamine
concentrations. Figure 13 shows the graph of this simulation.
34
302520151050
6
5
4
3
2
1
0
Glutamine Concentration in Culture (mM)
Am
mon
ium
Con
cent
rati
on (
mM
)
ExtracellularIntracellular
Variable
Ammonium Concentration versus Glutamine Concentration at 80 Hours
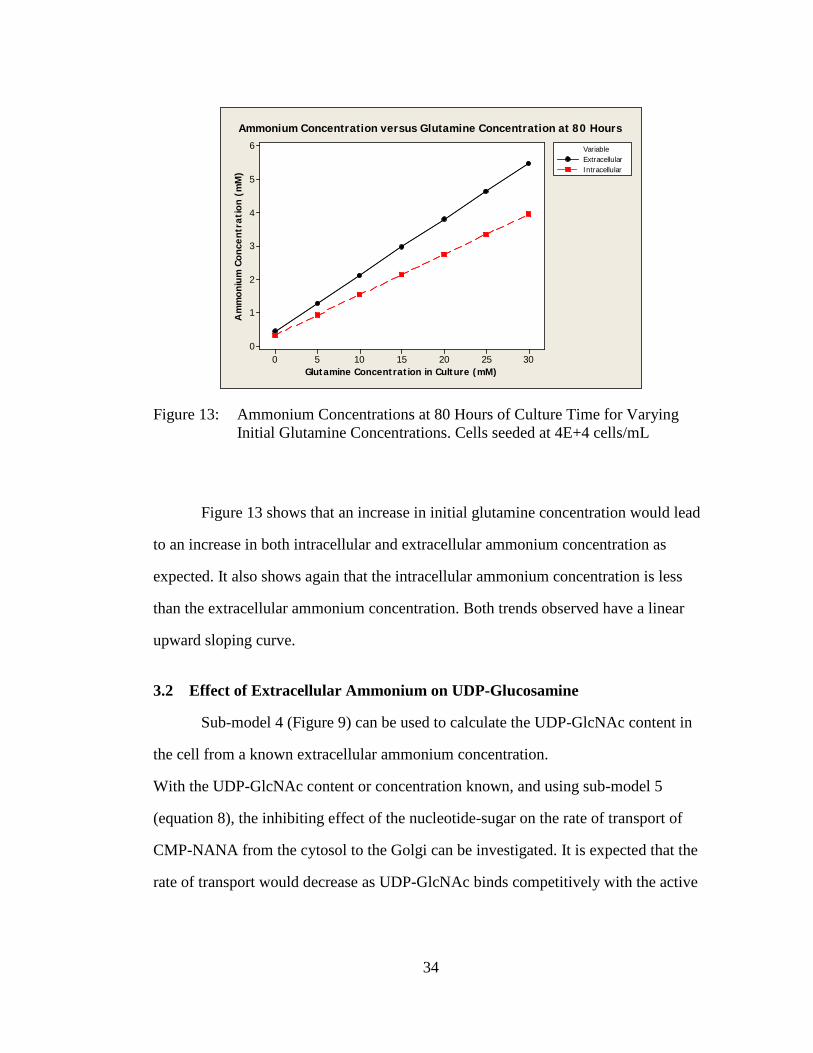
Figure 13: Ammonium Concentrations at 80 Hours of Culture Time for Varying Initial Glutamine Concentrations. Cells seeded at 4E+4 cells/mL
Figure 13 shows that an increase in initial glutamine concentration would lead
to an increase in both intracellular and extracellular ammonium concentration as
expected. It also shows again that the intracellular ammonium concentration is less
than the extracellular ammonium concentration. Both trends observed have a linear
upward sloping curve.
3.2 Effect of Extracellular Ammonium on UDP-Glucosamine
Sub-model 4 (Figure 9) can be used to calculate the UDP-GlcNAc content in
the cell from a known extracellular ammonium concentration.
With the UDP-GlcNAc content or concentration known, and using sub-model 5
(equation 8), the inhibiting effect of the nucleotide-sugar on the rate of transport of
CMP-NANA from the cytosol to the Golgi can be investigated. It is expected that the
rate of transport would decrease as UDP-GlcNAc binds competitively with the active

35
site of CMP-SAT. Figure 14 shows this expected trend. As the concentration of UDP-
GlcNAc in the cytosol increases due to an increase in the ammonium concentration in
the cell, the rate of transport decreases.
3.02.52.01.51.00.50.0
350
300
250
200
150
100
50
0
[UDP-GlcNAc] nM
Rat
e of
Tra
nspo
rt o
f CM
P-NA
NA (
pmol
/mg-
min
)
Rate of Transport of CMP-NANA vs. UDP-GlcNAc Concentration
Figure 14: Inhibiting Effect of UDP-GlcNAc on Transport of CMP-NANA into the Golgi
Figure 14 shows that the rate of transport of CMP-NANA decreases rapidly
with a little increase in UDP-GlcNAc. At a UDP-GlcNAc concentration of 1 nM, the
rate of transport of CMP-NANA is almost at 0 pmol/mg-min. This result implies that
the effect of the increase of UDP-GlcNAc on the transport of CMP-NANA is
significant.

36
3.3 Effect of Extracellular Ammonium on the pH of the trans-Golgi and on the Activity of the Alpha2,3-Sialyl Transferase Enzyme
An increase in intracellular ammonium concentration decreases the activity of
the α2,3-ST enzyme by increasing the pH of the trans-Golgi above the optimum pH.
Therefore, in order to investigate the decrease in activity of the enzyme, the pH of the
trans-Golgi has to be determined. Sub-model 6a (equation 10) was used to compute
the hydrogen ion concentration, and consequently the pH, in the trans-Golgi. Figure 15
shows the model results of pH versus extracellular ammonium concentration over the
course of a CHO cell culture seeded at a density of 4E+4 cells/mL with 20 mM
glutamine and total culture time of 144 hours.
121086420
6.75
6.50
6.25
6.00
5.75
5.50
Extracellular Ammonium Concentration (mM)
tran
s-Go
lgi p
H
trans-Golgi pH versus Extracellular Ammonium Concentration
Figure 15: Hydrogen ion Concentration in the Golgi as a Function of Intracellular Ammonium Concentration
As can be seen in the graph in Figure 15, the pH of the trans-Golgi increases
with an increase in extracellular ammonium concentration (as predicted in literature)

37
until it reaches a steady state at a pH of 6.63. The model result shows that initial
increase in extracellular ammonium concentration causes a significant rise in the trans-
Golgi pH. The rise in trans-Golgi pH above the optimum pH would lead to a drop in
the α2,3-ST enzyme activity. Sub-model 6b was used to investigate this relationship
between pH and α2,3-ST enzyme activity. Figure 16 shows the trend observed.
6.756.506.256.005.755.50
16
14
12
10
8
6
4
2
trans-Golgi pH
Alp
ha-2
,3-S
T En
zym
e A
ctiv
ity
umol
/mg-
min
Enzyme Activity versus Trans-Golgi pH
Figure 16: Alpha-2,3-ST Enzyme Activity as a Function of Trans-Golgi pH
Figure 16 shows that the maximum enzyme activity is at 15 µmol/mg-min and
occurs at a pH of 6.30. The figure shows that as the trans-Golgi pH increases, the
enzyme activity initially increases until it reaches a maximum, and thereafter
decreases. This model result differs from literature in terms of the enzyme’s optimum
pH. Literature reports the optimum pH as 6.5 (Gawlitzek et al., 2000; Andersen and
Goochee, 1995). Figure 17 is shown below to further compare between the model
results and the results obtained from Gawlitzek et al. (2000).

38
7.57.06.56.05.5
100
90
80
70
60
50
40
30
20
10
trans-Golgi pH
Rel
ativ
e A
lpha
-2,3
-ST
Enzy
me
Act
ivit
y Model ResultExperimental Result
Variable
Relative Enzyme Activity versus trans-Golgi pH
Figure 17: Model and Experimental Results for Relative Alpha-2,3-ST Enzyme Activity versus Trans-Golgi pH
The model result displayed in Figure 17 follows the general trend of the
experimental results obtained from Gawlitzek et al., 2000. The main differences
between the model and experimental results are the optimum trans-Golgi pH and the
trans-Golgi pH range over which the enzyme remains active. These differences
probably exist due to the approximate parameter values used in the development of the
model, specifically the values of
,

39
3.4 Effect of Extracellular Ammonium on CMP-SAT and Alpha-2,3-ST
With the different sub-models developed, it is easy to directly determine the
effect of extracellular ammonium on the rate of transport of CMP-sialic acid from the
cytosol to the Golgi. It is also easy to determine the relationship between extracellular
ammonium concentration and alpha-2,3-ST activity. Figures 18 and 19 show the
previously stated relationships respectively.
543210
350
300
250
200
150
100
50
0
Extracellular Ammonium Concentration (mM)
Rat
e of
Tra
nspo
rt o
f CM
P-si
alic
aci
d (p
mol
/mg-
min
) Rate of Transport of CMP-sialic acid vs. [NH4+]extra
Figure 18: Rate of CMP-sialic acid Transport as a Function of Extracellular Ammonium Concentration

40
43210
100
90
80
70
60
50
40
30
20
10
Extracellular Ammonium Concentration (mM)
Rel
ativ
e A
lpha
-2,3
-ST
Enzy
me
Act
ivit
y
Relative Alpha-2,3-ST Enzyme Activity versus [NH4+]extra
Figure 19: Relative Activity of Alpha-2,3-ST as a Function of Extracellular Ammonium Concentration
Figure 18 shows an initial lag in CMP-sialic acid transport as extracellular
ammonium concentration increases up till approximately 1.8 mM. Thereafter, a steady
decease in the transport is observed until an ammonium concentration of 3.7 mM is
reached. At this point, the rate of transport is negligible. A possible explanation for
this trend is that at low extracellular ammonium concentrations, the flux of ammonium
into the cell is not high such that the intracellular ammonium is not enough to produce
an excess of UDP-GlcNAc. Without an excess of UDP-GlcNAc, CMP-SAT will not
be inhibited and the transport of CMP-sialic acid will remain at a high rate.
Figure 19 shows a steady increase in the relative α2,3-ST enzyme activity until
a maximum is reached; this is followed by a decrease in relative enzyme activity until
a saturation point is reached at approximately 1.4 mM extracellular ammonium. This
result seems to imply that at a certain point, the α2,3-ST enzyme activity is not

41
affected by the extracellular ammonium concentration. The validity of this result can
be checked by performing experiments to see how extracellular ammonium
concentration affects α2,3-ST enzyme activity.
The model developed in this thesis provides a novel method for directly
mapping extracellular ammonium concentration to CMP-sialic acid transport and
α2,3-ST enzyme activity.
3.5 Summary
This chapter presented and examined the results obtained from the different
sub-models that make up the mathematical model for the effect of ammonia on
glycosylation. The model results generated generally have a similar trend as the results
seen in literature. However, some inconsistencies between the model and experimental
results are probably due to approximate parameter values used for developing the
model. Although not implemented in this thesis, the model results can be linked up
with the Krambeck and Betenbaugh (2005) model to compute the sialic acid content of
the mAb as a function of glutamine or ammonium concentration in the culture. When
the link between this thesis work and the Krambeck model is made, experimenters will
be able determine how much glutamine to add to the culture to achieve the desired
sialic acid content.

42
Chapter 4
CONCLUSION
Ammonia, one of the CHO cell culture conditions, affects the glycosylation
pattern of mAbs by decreasing the extent of terminal sialylation. Some mechanisms
were proposed to explain the effect of ammonia on glycosylation. These mechanisms
are as follows (Butler, 2006):
• Ammonia decreases the expression of CMP-SAT
• Ammonia is a precursor for UDP-GlcNAc which is a nucleotide that inhibits
CMP-SAT
• Ammonia increases the pH of the trans-Golgi which in turn decreases the
activity of the α-2,3-sialyl transferase enzyme.
The mechanisms stated above were incorporated in the development of a
mathematical model to explain the effect of ammonium on glycosylation following a
multi-scale perspective. First, it was important to map out how the ammonium is
introduced into the cell culture and eventually into the cell cytoplasm. Then, the
function of the ammonium in the intracellular processes of the cell was explored,
taking into consideration the proposed mechanisms. Finally, the effect of the
intracellular processes on glycosylation was investigated. The mathematical model is
made up of six sub-models which are listed as:
1. Sub-model 1: Glutamine NH4+
extracellular
2. Sub-model 2: NH4+
extracellular NH4+
intracellular
3. Sub-model 3: NH4+
extracellular CMP-SAT

43
4. Sub-model 4: NH4+
extracellular UDP-GlcNAc
5. Sub-model 5: UDP-GlcNAc Transport of CMP-NANA
6. Sub-model 6: NH4+
extracellular trans-Golgi pH α2,3-ST activity
From the results obtained from the sub-models, it was found that the UDP-GlcNAc
content in the cell – which is increased by the presence of ammonium – had a
significant effect on the transport of CMP-NANA from the cell cytosol to the Golgi
apparatus thereby decreasing the amount of sialic acid available for sialylation in the
Golgi. It was also found that the presence of ammonium significantly affects the pH of
the trans-Golgi by rapidly increasing the pH until it reaches a steady-state value. This
increase in pH in turn affects the activity of the α2,3-ST enzyme. When the pH is
above the optimum value, the enzyme activity decreases leading to a decrease in
sialylation. Coupling ammonium’s effect on CMP-SAT and α2,3-ST would lead to a
considerable decrease in the sialic acid content of mAbs.
Based on comparison of model results with literature, it can be assumed that
the model results are consistent with literature to a reasonable extent. However, in the
future, experiments can be performed to support the validity of the model presented.
For example, CHO cells can be cultured with the seeding density, culture temperature,
glutamine concentration, and other culture parameters known. The glutamine and
resulting extracellular and intracellular ammonium concentrations would be monitored
over culture time. Similarly, the CMP-SAT and UDP-GlcNAc expression levels, the
trans-Golgi pH, and α2,3-ST activity in the cell would be measured. The known
culture parameters can be inputted to the model to obtain model results. The model
results can be compared to the experimental values to analyze how closely the model
fits the experimental results.

44
By linking the model developed in this thesis with the Krambeck and
Betenbaugh (2005) model, it would be possible to determine the sialic acid content of
mAbs given the glutamine or ammonium concentration. This model approach can be
adopted for other process variables that affect the glycan pattern of mAbs. This work
will aid in developing a method for real-time quality control of glycosylation of mAbs.

45
REFERENCES
Mello de Queiroz et al. "Study of membrane potential in T lymphocytes subpopulations using flow cytometry." BMC Immunology (2008).
Andersen, D.C. and Goochee C.F. "The effect of ammonia on the O-linked glycosylation of granulocyte colony-stimulating factor produced by Chinese hamster ovary cells." Biotechnol. Bioeng. 47 (1995): 96-105.
—. "The effect of cell-culture conditions on the oligosaccharide structures of secreted glycoproteins." Curr. Opin. Biotechnol. 5 (1994): 546-549.
Butler, M. "Optimisation of the cellular metabolism of glycosylation for recombinant proteins produced by mammalian cell systems." Cytotechnology (2006): 57-76.
Chen, Peifeng and Sarah W. Harcum. "Effects of Elevated Ammonium on Glycosylation Gene Expression in CHO cells." Metabolic Engineering 8 (2006): 123-132.
Chiaramonte, et al. "Inhibition of CMP-Sialic Acid Transport into Golgi Vesicles by Nucleoside Monophosphates." Biochemistry 40 (2001): 14260-14267.
Gawlitzek, Martin, et al. "Ammonium Alters N-Glycan Structures of Recombinant TNFR-IgG: Degradative Versus Biosynthetic Mechanisms." Biotechnology and Bioengineering 68 (2000): 637-646.
—. "Incorporation of 15N from ammonium into the N-linked oligosaccharides of an immunoadhesin glycoprotein expressed in Chinese hamster ovary cells." Glycobiology 9 (1999): 125-131.
Jimenez del Val, Ioscani, Judit M Nagy and Cleo Kontoravdi. "A Dynamic Mathematical Model for Monoclonal Antibody N-Linked Glycosylation and Nucleotide Sugar Donor Transport Within a Maturing Golgi Apparatus." Biotechnol. Prog. 27 (2011): 1730-1743.
Kim, J.H., et al. "Dynamic measurement of the pH of the Golgi complex in living cells using retrograde transport of the verotoxin receptor." J Cell Biol 134 (1996): 1387-1399.

46
Krambeck, Frederick J. and Michael J. Betenbaugh. "A Mathematical Model of N-Linked Glycosylation." Biotechnology and Bioengineering 92 (2005): 711-728.
M.C., Borys, Linzer D.I. and Papoutsakis E.T. "Culture pH affects expression rates and glycosylation of recombinant mouse placental lactogen proteins by Chinese hamster ovary (CHO) cells." Biotechnology 11 (1993): 720-724.
Ozturk, Sedettin S. and Bernhard O. Palsson. "Chemical Decomposition of Glutamine in Cell Culture Media: Effect of Media Type, pH, and Serum Concentration." Biotechnol. Prog. 6 (1990): 121-128.
Roos, Albert and Walter F. Boron. "Intracellular pH." Physiological Reviews 61 (1981): 296-434.
Saylor, Carolyn, Ekaterina Dadachova and Arturo Casadevall. "Monoclonal antibody-based therapies for microbial diseases." Vaccine 27 (2009): G38-G46.
Schneider, Markus, Ian W. Marison and Urs von Stockar. "The importance of ammonia in mammalian cell culture." Journal of Biotechnology 46 (1996): 161-185.
Seksek, O., J. Biwersi and A.S. Verkman. "Direct measurement of trans-Golgi pH in living cells and regulation by second messengers." J Biol Chem (1995): 4967–4970.
Thermo Fisher Scientific Inc. Antibody Labeling and Immobilization Sites. 2012. 4 April 2012 < http://www.piercenet.com/browse.cfm?fldID=F655EBCB-5056-8A76-4EBE-966C71343C68>.
von Figura, K. and A. Hasilik. "Lysosomal enzymes and their receptors." Ann Rev Biochem 55 (1986): 167-193.
Wu, P., Ray N.G. and M.L. Shuler. "A Computer Model for Intracellular pH Regulation in Chinese Hamster Ovary Cells." Biotechnol. Prog. 9 (1993): 374-384.
Yang, M. and M. Butler. "Effects of ammonia on CHO cell growth, erythropoietin production, and glycosylation." Biotechnol. Bioeng 68 (2000): 370-380.

47
Appendix A
MODEL DERIVATIONS
A.1 Sialylation Rate Equation
Consider the following reaction in which a sialic acid molecule is attached to a
polysaccharide in a reversible manner

48
49
Appendix B
RELEVANT GRAPHS
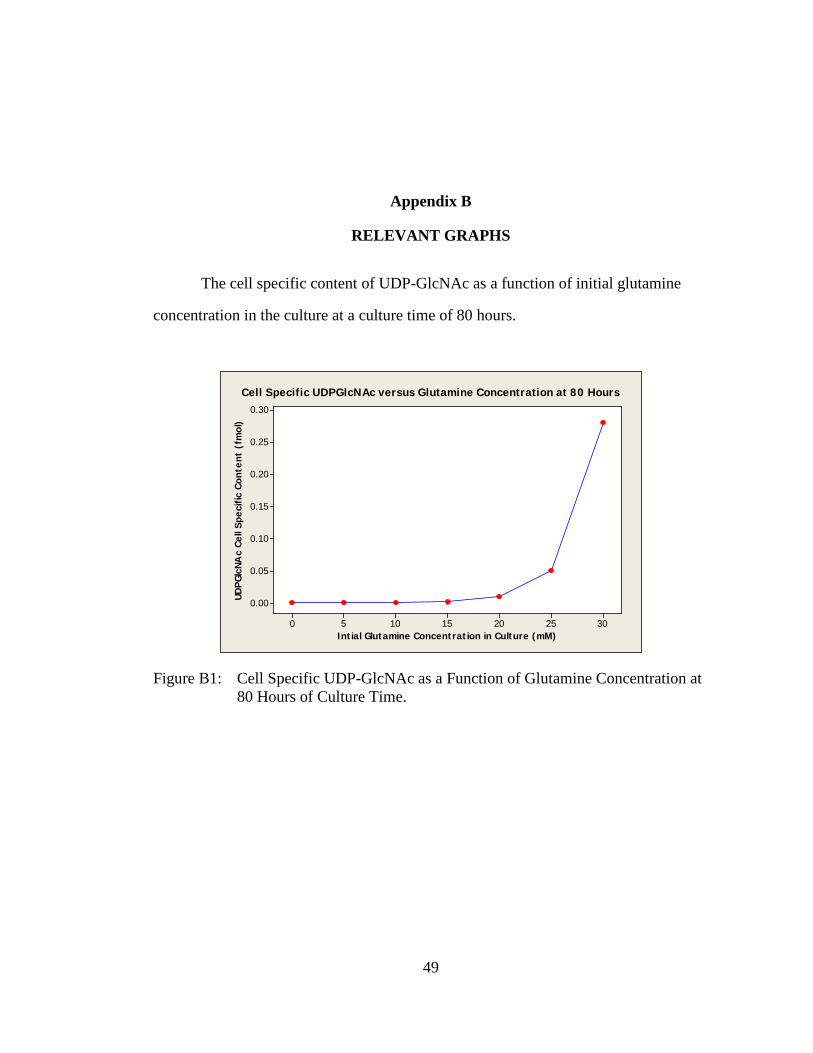
The cell specific content of UDP-GlcNAc as a function of initial glutamine
concentration in the culture at a culture time of 80 hours.
302520151050
0.30
0.25
0.20
0.15
0.10
0.05
0.00
Intial Glutamine Concentration in Culture (mM)
UDPG
lcNA
c Ce
ll Sp
ecifi
c Co
nten
t (f
mol
)
Cell Specific UDPGlcNAc versus Glutamine Concentration at 80 Hours
Figure B1: Cell Specific UDP-GlcNAc as a Function of Glutamine Concentration at 80 Hours of Culture Time.
50
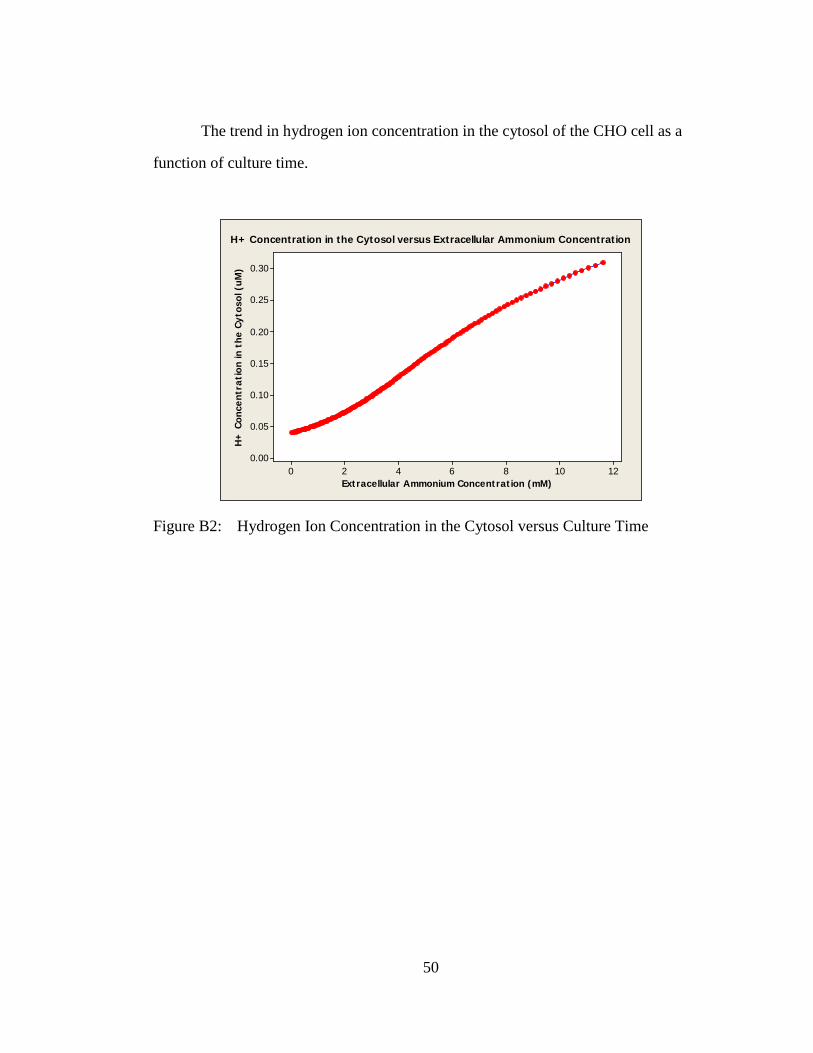
The trend in hydrogen ion concentration in the cytosol of the CHO cell as a
function of culture time.
121086420
0.30
0.25
0.20
0.15
0.10
0.05
0.00
Extracellular Ammonium Concentration (mM)
H+
Con
cent
rati
on in
the
Cyt
osol
(uM
)H+ Concentration in the Cytosol versus Extracellular Ammonium Concentration
Figure B2: Hydrogen Ion Concentration in the Cytosol versus Culture Time


