Minutes of the Federal Open Market Committee March 15–16, 2016
A joint meeting of the Federal Open Market Committee and the Board of Governors was held in the offices of the Board of Governors of the Federal Reserve System in Washington, D.C., on Tuesday, March 15, 2016, at 1:00 p.m. and continued on Wednesday, March 16, 2016, at 9:00 a.m.1
PRESENT:
Janet L. Yellen, Chair William C. Dudley, Vice Chairman Lael Brainard James Bullard Stanley Fischer Esther L. George Loretta J. Mester Jerome H. Powell Eric Rosengren Daniel K. Tarullo
Charles L. Evans, Patrick Harker, Robert S. Kaplan, Neel Kashkari, and Michael Strine, Alternate Members of the Federal Open Market Committee
Jeffrey M. Lacker, Dennis P. Lockhart, and John C.
Williams, Presidents of the Federal Reserve Banks of Richmond, Atlanta, and San Francisco, respectively
Brian F. Madigan, Secretary Matthew M. Luecke, Deputy Secretary David W. Skidmore, Assistant Secretary Michelle A. Smith, Assistant Secretary Scott G. Alvarez, General Counsel Steven B. Kamin, Economist Thomas Laubach, Economist David W. Wilcox, Economist Thomas A. Connors, Michael P. Leahy, David E.
Lebow, Stephen A. Meyer, Christopher J. Waller, and William Wascher, Associate Economists
Simon Potter, Manager, System Open Market Account
1 The Federal Open Market Committee is referenced as the “FOMC” and the “Committee” in these minutes.
Lorie K. Logan, Deputy Manager, System Open Market Account
Robert deV. Frierson, Secretary of the Board, Office of
the Secretary, Board of Governors Michael S. Gibson, Director, Division of Banking
Supervision and Regulation, Board of Governors Nellie Liang, Director, Office of Financial Stability
Policy and Research, Board of Governors James A. Clouse, Deputy Director, Division of
Monetary Affairs, Board of Governors William B. English, Senior Special Adviser to the
Board, Office of Board Members, Board of Governors
Andrew Figura, Ann McKeehan, David Reifschneider,
and Stacey Tevlin,2 Special Advisers to the Board, Office of Board Members, Board of Governors
Trevor A. Reeve, Special Adviser to the Chair, Office
of Board Members, Board of Governors Linda Robertson, Assistant to the Board, Office of
Board Members, Board of Governors Diana Hancock and Michael G. Palumbo, Senior
Associate Directors, Division of Research and Statistics, Board of Governors; Beth Anne Wilson, Senior Associate Director, Division of International Finance, Board of Governors
Ellen E. Meade and Robert J. Tetlow, Senior Advisers,
Division of Monetary Affairs, Board of Governors Jane E. Ihrig and David López-Salido, Associate
Directors, Division of Monetary Affairs, Board of Governors
2 Attended the discussion of the economic and financial situ-ation through the close of the meeting.
Page 1_____________________________________________________________________________________________
Stephanie R. Aaronson and Glenn Follette,3 Assistant Directors, Division of Research and Statistics, Board of Governors
Penelope A. Beattie,4 Assistant to the Secretary, Office
of the Secretary, Board of Governors David H. Small, Project Manager, Division of
Monetary Affairs, Board of Governors Kurt F. Lewis, Principal Economist, Division of
Monetary Affairs, Board of Governors Randall A. Williams, Information Manager, Division of
Monetary Affairs, Board of Governors Kenneth C. Montgomery, First Vice President, Federal
Reserve Bank of Boston David Altig, Ron Feldman, Alberto G. Musalem,
Glenn D. Rudebusch, and Daniel G. Sullivan, Executive Vice Presidents, Federal Reserve Banks of Atlanta, Minneapolis, New York, San Francisco, and Chicago, respectively
Michael Dotsey, Evan F. Koenig, Paolo A. Pesenti, and
John A. Weinberg, Senior Vice Presidents, Federal Reserve Banks of Philadelphia, Dallas, New York, and Richmond, respectively
Edward S. Knotek II, Giovanni Olivei, and Jonathan L.
Willis, Vice Presidents, Federal Reserve Banks of Cleveland, Boston, and Kansas City, respectively
Developments in Financial Markets and Open Market Operations The manager of the System Open Market Account (SOMA) reported on developments in domestic and for-eign financial markets, including recent monetary policy actions of foreign central banks and the expectations of market participants for the trajectory of U.S. monetary policy. The deputy manager followed with a briefing on money market developments and System open market operations conducted by the Open Market Desk during the period since the Committee met on January 26–27, 2016. Experience during the intermeeting period con-tinued to suggest that the operational framework for
3 Attended Wednesday session only.
monetary policy implementation was effective in main-taining control over the federal funds rate. Also, the transitions in early March to the FR 2420 reporting form (Report of Selected Money Market Rates) as the under-lying source of data for computing the effective federal funds rate, and to a volume-weighted median as the cal-culation method, proceeded smoothly. In addition, the deputy manager reviewed recent and projected trends in foreign portfolio income of the SOMA, including the implications for portfolio income of foreign nominal in-terest rates that were very low, even negative.
The deputy manager also outlined factors that the Com-mittee might consider in determining whether to offer term reverse repurchase agreements (RRPs) over the end of the first quarter. In the ensuing discussion of this question among Committee participants, it was noted that, in view of the very elevated capacity of the over-night (ON) RRP facility that would remain available for the time being, offering term RRPs in addition to ON RRPs would be unlikely to enhance control of the fed-eral funds rate over quarter-end, and offering term RRPs at an interest rate spread over ON RRPs could margin-ally increase the Federal Reserve’s interest costs. For these reasons, Committee participants generally pre-ferred not to offer term RRPs over the end of the first quarter. Participants noted that it may be appropriate to offer term RRPs at some point in the future after the Committee reintroduces an aggregate cap on ON RRP operations, and the Committee’s decisions regarding term RRPs over quarter-ends had no implications for the FOMC’s plan to phase out the ON RRP facility when it was no longer needed to help control the federal funds rate.
By unanimous vote, the Committee ratified the Desk’s domestic transactions over the intermeeting period. There were no intervention operations in foreign curren-cies for the System’s account over the intermeeting pe-riod.
Staff Review of the Economic Situation The information reviewed for the March 15–16 meeting suggested that labor market conditions were continuing to improve in the first quarter, and that the pace of ex-pansion in real gross domestic product (GDP) was pick-ing up somewhat from the previous quarter. Consumer price inflation was still running below the Committee’s longer-run objective of 2 percent, restrained in part by decreases in both consumer energy prices and the prices of non-energy imports. Survey-based measures of
4 Attended Tuesday session only.
Page 2 Federal Open Market Committee_____________________________________________________________________________________________
longer-run inflation expectations were little changed, on balance, in recent months, while market-based measures of inflation compensation remained low.
Total nonfarm payroll employment increased in January and February at a solid average monthly pace. The un-employment rate declined to 4.9 percent in January and remained at that level in February, while both the labor force participation rate and the employment-to-popula-tion ratio increased over these months. The share of workers employed part time for economic reasons edged down in January and February. The rates of private-sec-tor job openings, hires, and quits rose a little in Decem-ber. The four-week moving average of initial claims for unemployment insurance benefits moved down in Feb-ruary and early March after increasing a little in January. Labor compensation continued to rise at a modest pace. Compensation per hour in the nonfarm business sector increased 2½ percent over the four quarters of 2015, and the employment cost index rose nearly 2 percent over the 12 months ending in December; both increases were similar to their averages in recent years. Average hourly earnings for all employees increased 2¼ percent over the 12 months ending in February, about ¼ percentage point more than over the preceding 12 months.
Industrial production increased in January. Manufactur-ing output rose, reversing the declines seen in the two previous months, and the output of utilities moved up sharply as the demand for heating rebounded after hav-ing been held down by unseasonably warm weather in December. Mining output was unchanged following four months of sizable declines that resulted from de-creases in drilling activity. Automakers’ assembly sched-ules and broader indicators of manufacturing produc-tion, such as the readings on new orders from national and regional manufacturing surveys, mostly pointed to a modest pace of gains in factory output over the next few months. Information on drilling activity for crude oil and natural gas through early March was consistent with further declines in mining output.
Growth in real personal consumption expenditures (PCE) appeared to pick up some in the first quarter. The components of the nominal retail sales data used by the Bureau of Economic Analysis to construct its estimate of PCE were little changed, on net, in January and Feb-ruary, but spending on energy services appeared likely to increase somewhat and the rate of sales of new light mo-tor vehicles stepped up following a decline in December. Recent readings on key factors that influence consumer spending generally pointed toward solid growth in real
PCE over the first half of the year. Gains in real dispos-able income picked up in December and January. Households’ net worth was supported both by a re-bound in equity prices following declines earlier in the year and by further increases in home values through January. Also, consumer sentiment in the University of Michigan Surveys of Consumers remained at an elevated level in February.
Recent information on housing activity was consistent with a continued gradual recovery in this sector. Starts for new single-family homes moved higher, on balance, in January and February, and building permits were little changed. Starts of multifamily units declined on net. New home sales fell in January, more than reversing an increase in December. Sales of existing homes increased further in January following a strong gain in December.
Real private expenditures for business equipment and in-tellectual property products appeared to be increasing only modestly in the first quarter. Nominal shipments of nondefense capital goods excluding aircraft declined in January, and forward-looking indicators of equipment spending, such as new orders for nondefense capital goods along with recent readings from national and re-gional surveys of business conditions, were generally soft. Firms’ nominal spending for nonresidential struc-tures excluding drilling and mining increased somewhat in January after having declined for two months. Indi-cators of spending for structures in the drilling and min-ing sector, such as the number of oil and gas rigs in op-eration, continued to fall through early March. The lim-ited available data suggested that inventory investment continued to decline in the early part of the year. None-theless, with the exception of the energy sector, inven-tories generally seemed well aligned with the pace of sales.
Growth in total real government purchases appeared to be modest in the first quarter. Federal government spending for defense was soft in January and February, while nondefense spending seemed likely to be slightly boosted early in the year by the effect of the 2015 Bipar-tisan Budget Act. Nominal construction spending by state and local governments increased sharply in January, but the payrolls of these governments were little changed, on net, over the first two months of the year.
The U.S. international trade deficit widened in both De-cember and January, as exports declined in both months, continuing a downward trend that began in late 2014, with particular weakness in exports of capital goods. Im-ports rose slightly in December before falling back in January. Net exports subtracted from real GDP growth
Minutes of the Meeting of March 15–16, 2016 Page 3_____________________________________________________________________________________________
in the fourth quarter, and the January trade data sug-gested that net exports would continue to weigh on growth in the first quarter.
Total U.S. consumer prices as measured by the PCE price index increased 1¼ percent over the 12 months ending in January, partly restrained by declines in con-sumer energy prices. Core PCE price inflation, which excludes changes in food and energy prices, was 1¾ per-cent over the same 12-month period, held down in part by decreases in the prices of non-energy imports and the pass-through of declines in energy prices. Over the 12 months ending in February, total consumer prices as measured by the consumer price index (CPI) rose 1 per-cent, while core CPI inflation was around 2¼ percent. Both readings on core inflation were boosted, in part, by movements in prices for some categories of goods and services whose prices tend to be volatile. Survey measures of longer-run inflation expectations—includ-ing those from the Michigan survey, Blue Chip Eco-nomic Indicators, Survey of Professional Forecasters, Survey of Primary Dealers, and Survey of Market Partic-ipants—were generally little changed on balance. In February, the Michigan survey measure of median infla-tion expectations over the next 5 to 10 years was below its typical range of the past 15 years, likely reflecting—at least in part—decreases in energy prices over the past year and a half.
Foreign real GDP growth slowed in the fourth quarter, with Canadian activity restrained by declines in oil- related investment and the Japanese economy contract-ing amid weakness in consumption. Economic growth continued to be steady but modest in the euro area and the United Kingdom, while Brazil remained in recession. In contrast, some economies in emerging Asia recorded robust growth. Indicators pointed to a pickup in growth in most foreign economies in the current quarter but to a further softening of growth in China. Inflation in the advanced foreign economies remained low. In contrast, inflation rose in China because of a rebound in local food prices, while inflation in much of South America remained elevated, reflecting weaker currencies. Con-cerns about persistently low inflation spurred further monetary policy accommodation by the Bank of Japan (BOJ) and the European Central Bank (ECB).
Staff Review of the Financial Situation Financial markets were turbulent over the first month and a half of the year, apparently reflecting investors’ concerns about global growth prospects and associated risks to the U.S. outlook. However, these concerns ap-
peared to diminish beginning in mid-February, and do-mestic financial conditions generally eased, on balance, since the January FOMC meeting: Stock prices rose, eq-uity price volatility declined, and credit spreads on cor-porate bonds narrowed. The dollar depreciated against most foreign currencies, and long-term sovereign bond yields declined amid easing by central banks in advanced foreign economies.
Yields on 5- and 10-year nominal Treasury securities de-clined at the outset of the intermeeting period, reflecting the continued pullback from risky assets that began early in the year on concerns about prospects for global eco-nomic growth. These yields subsequently increased as market sentiment improved and were little changed, on balance, over the intermeeting period. Measures of in-flation compensation over the next 5 years rose, on net, consistent with increases in oil prices, while inflation compensation 5 to 10 years ahead was little changed on the period and remained at the lower end of its historical range.
After becoming considerably flatter early in the inter-meeting period, the path of the federal funds rate im-plied by market quotes on interest rate derivatives steep-ened subsequently as financial market conditions im-proved and was little changed, on balance, over the in-termeeting period. However, the median respondent to the Desk’s March Survey of Primary Dealers and to the Survey of Market Participants expected only two in-creases in the FOMC’s target range for the federal funds rate this year, one fewer than they had projected in Jan-uary.
Broad equity market indexes increased, on balance, over the intermeeting period and continued to exhibit a high correlation with crude oil prices. Reflecting the im-provement in investor sentiment that started in mid-February, corporate bond spreads narrowed, with spreads on investment-grade issues finishing the period slightly lower while spreads on speculative-grade is-sues—particularly those for the lowest-rated bonds—declined appreciably.
Financing conditions for investment-grade nonfinancial firms continued to be relatively accommodative. Cor-porate bond issuance by these firms was robust in Janu-ary and February, while speculative-grade bond issuance stayed subdued. Commercial and industrial loan growth at banks was also strong, mostly driven by the origina-tion of large loans to investment-grade borrowers. Re-financings of institutional leveraged loans were near zero in February, as was equity issuance through initial public offerings.
Page 4 Federal Open Market Committee_____________________________________________________________________________________________
The credit quality of speculative-grade nonfinancial cor-porations continued to show signs of deterioration. Market analysts’ earnings forecasts for speculative-grade companies, including those outside the energy sector, were revised down for the first quarter of 2016 amid concerns about a deterioration in the global economic outlook. In the broader corporate bond market, the vol-ume of downgrades of ratings outpaced that of up-grades, even for investment-grade securities, in January and February, with energy firms accounting for most of the downgrades in February. The default rate on nonfi-nancial bonds remained somewhat elevated compared with typical levels outside recession periods.
Financing conditions for commercial real estate (CRE) tightened somewhat over the intermeeting period but re-mained accommodative. Spreads on commercial mort-gage-backed securities (CMBS) continued to widen, on net, despite the narrowing of spreads in broader bond markets. Reportedly in response, CMBS issuance was down somewhat over the first two months of the year, although CRE loans on banks’ balance sheets continued to increase at a robust pace through February.
Lending conditions in residential real estate markets were little changed, on balance, over the intermeeting period. Financing conditions in consumer credit mar-kets generally remained accommodative, and outstand-ing student and auto debt continued to grow at a robust pace.
During the intermeeting period, foreign financial condi-tions improved on net. After deteriorating further early in the period, foreign equity prices bounced back and credit spreads on emerging market bonds narrowed, in both cases returning to December levels in most coun-tries. Since the January FOMC meeting, the dollar de-preciated, on net, against most foreign currencies. Long-term sovereign bond yields declined notably in the ad-vanced economies, in part as foreign central banks an-nounced additional monetary policy easing measures. The BOJ introduced a negative deposit rate. The ECB announced a comprehensive package of easing measures, including a further cut in benchmark policy rates, accelerated and more expansive asset purchases, and a new round of targeted long-term refinancing op-erations.
Over the period since mid-December, when the Com-mittee raised the target range for the federal funds rate ¼ percentage point, U.S. financial market conditions had registered relatively small changes, on balance, amid significant volatility. Financial derivatives suggested that
market participants had revised down their expected tra-jectory of the federal funds rate somewhat, and yields on medium- and longer-term Treasury securities declined 20 to 30 basis points. Yields on investment- and specu-lative-grade corporate bonds were down slightly less, leaving spreads over Treasury securities little changed over the period between mid-December and mid-March. Similarly, broad equity price indexes ended this interval only a bit lower, and one-month-ahead option-implied volatility on the S&P 500 index, the VIX, de-clined on balance. The broad index of the foreign ex-change value of the dollar was also roughly unchanged, on net, since the December meeting.
Staff Economic Outlook In the U.S. economic forecast prepared by the staff for the March FOMC meeting, real GDP in the first half of the year was projected to increase a little more slowly than in the forecast prepared for the January meeting, although estimated real GDP growth in the fourth quar-ter of last year was revised up. Beyond the near term, real GDP was expected to increase slightly faster than in the previous forecast, largely reflecting a somewhat higher projected path for equity prices and a lower as-sumed trajectory for the foreign exchange value of the dollar. The staff continued to project that real GDP would expand at a somewhat faster pace than potential output in 2016 through 2018, supported primarily by in-creases in consumer spending. The unemployment rate was expected to gradually decline further and to run somewhat below the staff’s estimate of its longer-run natural rate over this period; the staff’s estimate of the natural rate was revised down slightly in this forecast.
The staff’s forecast for inflation over the first half of the year was revised up somewhat, reflecting recent in-creases in the price of crude oil as well as stronger-than-expected data on core consumer prices early in the year. The staff continued to project that inflation would in-crease gradually over the next several years, as energy prices and the prices of non-energy imported goods were expected to begin steadily rising later this year. Be-yond 2016, the forecast was a bit lower than the previous projection, primarily reflecting a flatter expected path for crude oil prices. As a result, inflation was projected still to be slightly below the Committee’s longer-run objec-tive of 2 percent in 2018.
The staff viewed the uncertainty around its March pro-jections for real GDP growth, the unemployment rate, and inflation as similar to the average of the past 20 years. The risks to the forecast for real GDP were
Minutes of the Meeting of March 15–16, 2016 Page 5_____________________________________________________________________________________________
seen as tilted to the downside, reflecting the staff’s as-sessment that neither monetary nor fiscal policy was well positioned to help the economy withstand substantial adverse shocks; in addition, global economic prospects were still seen as an important downside risk to the fore-cast. Consistent with the downside risk to aggregate de-mand, the staff viewed the risks to its outlook for the unemployment rate as skewed to the upside. The risks to the projection for inflation were still seen as weighted to the downside, reflecting the possibility that longer-term inflation expectations may have edged down, and that the foreign exchange value of the dollar could rise substantially, which would put additional downward pressure on inflation.
Participants’ Views on Current Conditions and the Economic Outlook In conjunction with this FOMC meeting, members of the Board of Governors and Federal Reserve Bank pres-idents submitted their projections of the most likely out-comes for real GDP growth, the unemployment rate, in-flation, and the federal funds rate for each year from 2016 through 2018 and over the longer run. Each par-ticipant’s projections were conditioned on his or her judgment of appropriate monetary policy. The longer-run projections represent each participant’s assessment of the rate to which each variable would be expected to converge, over time, under appropriate monetary policy and in the absence of further shocks to the economy. These projections and policy assessments are described in the Summary of Economic Projections, which is an addendum to these minutes.
In their discussion of the economic situation and the outlook, meeting participants viewed the information re-ceived over the intermeeting period as suggesting that economic activity had been expanding moderately de-spite the global economic and financial developments of recent months. Household spending had been increas-ing at a moderate rate, and the housing sector had im-proved further; however, business fixed investment and net exports had been soft. A range of labor market in-dicators, including strong employment growth and rising labor force participation, pointed to a further strength-ening of the labor market. Participants generally saw the data on economic activity and labor market conditions as broadly consistent with their earlier expectations. In-flation picked up in recent months, but it continued to run below the Committee’s 2 percent longer-run objec-tive. Market-based measures of inflation compensation remained low, while survey-based measures of longer-term inflation expectations were little changed, on bal-ance, in recent months. Early in the intermeeting period,
concerns among investors about the global economic outlook appeared to trigger a sharp reduction in their risk-taking. Financial conditions deteriorated, with eq-uity prices falling and credit spreads on riskier corporate bonds widening. Subsequently, investor sentiment re-bounded, and domestic and global financial conditions eased on net over the intermeeting period.
With respect to the outlook for economic activity and the labor market, participants shared the assessment that, with gradual adjustments in the stance of monetary policy, real GDP would continue to increase at a mod-erate rate over the medium term and labor market indi-cators would continue to strengthen. Participants ob-served that strong job gains in recent months had re-duced concerns about a possible slowing of progress in the labor market. Many participants, however, antici-pated that relative strength in household spending would be partially offset by weakness in net exports associated with lackluster foreign growth and the appreciation of the dollar since mid-2014. In addition, business fixed investment seemed likely to remain sluggish. Further-more, participants generally saw global economic and fi-nancial developments as continuing to pose risks to the outlook for economic activity and the labor market in the United States. In particular, several participants ex-pressed the view that the underlying factors abroad that led to a sharp, though temporary, deterioration in global financial conditions earlier this year had not been fully resolved and thus posed ongoing downside risks. Sev-eral participants also noted the possibility that economic activity or labor market conditions could turn out to be stronger than anticipated. For example, strong expan-sion of household demand could result in rapid employ-ment growth and overly tight resource utilization, partic-ularly if productivity gains remained sluggish.
Notwithstanding the downward revisions to recent retail sales data, participants were encouraged by the moderate average growth of consumer spending over recent quar-ters. Continued increases in household spending had buoyed growth of overall aggregate demand despite the volatility in financial markets. Among the various cate-gories of household spending, participants noted that motor vehicle sales remained particularly strong, albeit with some support from price discounting and other in-centives. Looking ahead, participants generally expected consumer spending to continue to rise moderately. Solid gains in employment and income, the relatively high ra-tio of household wealth to income, low gasoline prices, and a high level of consumer confidence were seen as factors that should contribute to moderate growth in consumer spending.
Page 6 Federal Open Market Committee_____________________________________________________________________________________________
Reports on the housing sector were mixed, with some participants noting a weakening of housing activity in re-gions adversely affected by the decline in energy prices. Nonetheless, fundamentals for housing activity were seen as strong except for a reported shortage of builda-ble lots in some areas. Some participants reported that contacts were generally upbeat about the outlook for housing construction in their Districts, and participants anticipated that activity in the housing sector would con-tinue to expand this year.
In contrast, several participants noted recent softness in business fixed investment and signs that the sluggish growth would continue. Orders and shipments for non-defense capital goods had been about flat. Capital ex-penditures continued to be depressed by the contraction in the energy sector. Capital spending plans appeared to remain soft. The possible adverse effects on investment spending of concerns about global growth and the asso-ciated volatility in financial markets were also noted. District reports on commercial construction activity, however, were generally positive.
With regard to the external sector, a number of partici-pants said that they expected declines in net exports to continue to subtract from real GDP growth, reflecting weak foreign activity as well as the earlier appreciation of the dollar. The outlook for growth abroad had dimmed in recent months, suggesting a more persistent drag on growth of U.S. exports. A couple of participants commented that emerging market economies faced an extended period of less rapid export growth, reflecting slower economic growth in many advanced foreign economies and in China. It also was noted that weak growth abroad could lead to further appreciation of the dollar.
In discussing domestic business conditions, several par-ticipants noted that their contacts saw rising sales in the retail sector and that reports from firms in the services sector were mostly strong. In some Districts, surveys suggested that manufacturing activity had bottomed out. However, a number of participants commented that pre-vious declines in commodity and energy prices, along with the earlier appreciation of the dollar and weak for-eign activity, continued to weigh on manufacturing ac-tivity. A few participants also noted that such factors were reducing farm incomes in their Districts.
During the intermeeting period, the labor market strengthened further. In their comments on labor mar-ket conditions, participants cited strong payroll gains and a further tick down in the civilian unemployment rate. Broader measures of labor force underutilization had
also shown progress, including an increase in labor force participation. The quits rate had returned to its pre- recession level, as had households’ perceptions of job availability and firms’ assessments of the difficulty of fill-ing jobs, providing further evidence of improved labor market conditions. Some participants judged that cur-rent labor market conditions were at or near those con-sistent with maximum sustainable employment, noting that the unemployment rate was at or below their esti-mates of its longer-run normal level and citing anecdotal reports of labor shortages or increased wage pressures. In contrast, some other participants judged that the economy had not yet reached maximum employment. They noted several indicators other than the unemploy-ment rate that pointed to remaining underutilization of labor resources; these indicators included the still-high rate of involuntary part-time employment and the low level of the employment-to-population ratio for prime-age workers. The surprisingly limited extent to which aggregate data indicated upward pressure on wage growth also suggested some remaining slack in labor markets.
Participants commented on the recent increase in infla-tion. Some participants saw the increase as consistent with a firming trend in inflation. Some others, however, expressed the view that the increase was unlikely to be sustained, in part because it appeared to reflect, to an appreciable degree, increases in prices that had been rel-atively volatile in the past. Participants continued to an-ticipate that inflation would run below the Committee’s 2 percent objective in the near term but that, as the tran-sitory effects of earlier declines in energy and import prices dissipated and the labor market strengthened fur-ther, inflation would rise to 2 percent over the medium term. Several participants indicated that the persistence of global disinflationary pressures or the possibility that inflation expectations were moving lower continued to pose downside risks to the inflation outlook. A few oth-ers expressed the view that there were also risks that could lead to inflation running higher than anticipated; for example, overly tight resource utilization could push inflation above the Committee’s 2 percent goal, particu-larly if productivity gains remained sluggish.
Participants discussed readings from various market- and survey-based measures of longer-run inflation ex-pectations. Some survey-based measures had edged down, while others had remained stable and one had edged up; such measures were little changed, on balance, in recent months. The market-based measures of infla-tion compensation that had declined earlier were still at low levels. Several participants noted that some of the
Minutes of the Meeting of March 15–16, 2016 Page 7_____________________________________________________________________________________________
softness in the market-based measures likely reflected changes in risk and liquidity premiums, and that some of the survey-based measures appeared to be excessively sensitive to movements in gasoline prices. Some partic-ipants concluded that longer-run inflation expectations remained reasonably stable, but some others expressed concern that longer-run inflation expectations may have already moved lower, or that they might do so if inflation was to persist for much longer at a rate below the Com-mittee’s objective.
Participants discussed the implications of the global eco-nomic and financial developments of the past few months for the medium-term outlook, and they offered different characterizations of the risks to the U.S. econ-omy stemming from these developments. Many partic-ipants expressed a view that the global economic and fi-nancial situation still posed appreciable downside risks to the domestic economic outlook. Some noted that re-cent financial market turbulence provided an important reminder that the ability of central banks to offset the effects of adverse economic shocks might be limited, particularly by the low level of policy interest rates in most advanced economies. In contrast, a few noted that the actions taken by several foreign central banks in re-cent weeks to increase monetary accommodation likely had helped mitigate downside risks to the global out-look. Nonetheless, many participants indicated that the heightened global risks and the asymmetric ability of monetary policy to respond to them warranted caution in making adjustments to the stance of U.S. monetary policy.
Participants generally agreed that the incoming infor-mation indicated that the U.S. economy had been resili-ent to recent global economic and financial develop-ments, and that the domestic economic indicators that had become available in recent weeks had been mostly consistent with their expectations. Moreover, the sharp asset price movements that occurred earlier in the year had been reversed to a large extent, but longer-term in-terest rates and market participants’ expectations for the future path of the federal funds rate remained lower. Taking these developments into account, participants generally judged that the medium-term outlook for do-mestic demand was not appreciably different than it had been when the Committee met in December. However, most participants, while recognizing the likely positive effects of recent policy actions abroad, saw foreign eco-nomic growth as likely to run at a somewhat slower pace than previously expected, a development that probably would further restrain growth in U.S. exports and tend to damp overall aggregate demand. Several participants
also cited wider credit spreads as a factor that was likely to restrain growth in demand. Accordingly, many par-ticipants expressed the view that a somewhat lower path for the federal funds rate than they had projected in De-cember now seemed most likely to be appropriate for achieving the Committee’s dual mandate. Many partici-pants also noted that a somewhat lower projected inter-est rate path was one reason for the relatively small revi-sions in their medium-term projections for economic ac-tivity, unemployment, and inflation.
Several participants also argued for proceeding cau-tiously in reducing policy accommodation because they saw the risks to the U.S. economy stemming from devel-opments abroad as tilted to the downside or because they were concerned that longer-term inflation expecta-tions might be slipping lower, skewing the risks to the outlook for inflation to the downside. Many participants noted that, with the target range for the federal funds rate only slightly above zero, the FOMC continued to have little room to ease monetary policy through con-ventional means if economic activity or inflation turned out to be materially weaker than anticipated, but could raise rates quickly if the economy appeared to be over-heating or if inflation was to increase significantly more rapidly than anticipated. In their view, this asymmetry made it prudent to wait for additional information re-garding the underlying strength of economic activity and prospects for inflation before taking another step to re-duce policy accommodation.
For all of these reasons, most participants judged it ap-propriate to maintain the target range for the federal funds rate at ¼ to ½ percent at this meeting while noting that global economic and financial developments con-tinued to pose risks. These participants saw their judg-ment as consistent with the Committee’s data-depend-ent approach to setting monetary policy; it was noted that, in this context, the relevant data include not only domestic economic releases, but also information about developments abroad and changes in financial condi-tions that bear on the economic outlook. A couple of participants, however, saw an increase in the target range to ½ to ¾ percent as appropriate at this meeting, citing evidence that the economy was continuing to expand at a moderate rate despite developments abroad and earlier volatility in financial conditions, continued improve-ment in labor market conditions, the firming of inflation over recent months, and the apparent leveling-off of oil prices. In their judgment, increasing the target range for the federal funds rate too gradually in the near term risked having to raise it quickly later, which could cause economic and financial strains at that time.
Page 8 Federal Open Market Committee_____________________________________________________________________________________________
Participants agreed that their ongoing assessments of the data and the implications for the outlook, rather than calendar dates, would determine the timing and pace of future adjustments to the stance of monetary policy. They expressed a range of views about the likelihood that incoming information would make an adjustment appropriate at the time of their next meeting. A number of participants judged that the headwinds restraining growth and holding down the neutral rate of interest were likely to subside only slowly. In light of this expec-tation and their assessment of the risks to the economic outlook, several expressed the view that a cautious ap-proach to raising rates would be prudent or noted their concern that raising the target range as soon as April would signal a sense of urgency they did not think ap-propriate. In contrast, some other participants indicated that an increase in the target range at the Committee’s next meeting might well be warranted if the incoming economic data remained consistent with their expecta-tions for moderate growth in output, further strengthen-ing of the labor market, and inflation rising to 2 percent over the medium term.
Committee Policy Action In their discussion of monetary policy for the period ahead, members judged that information received since the Committee met in January suggested that economic activity had been expanding at a moderate pace despite the global economic and financial developments of re-cent months. They also agreed that household spending had been increasing at a moderate rate, and that the housing sector had improved further; however, business fixed investment and net exports had been soft. Mem-bers saw a range of recent indicators, including strong job gains, as pointing to additional strengthening of the labor market. Members noted that inflation had picked up in recent months; however, they also noted that in-flation had continued to run below the Committee’s 2 percent longer-run objective, partly reflecting declines in energy prices and in prices of non-energy imports. Market-based measures of inflation compensation re-mained low. Survey-based measures of longer-term in-flation expectations were little changed, on balance, in recent months.
With respect to the economic outlook and its implica-tions for monetary policy, members continued to expect that, with gradual adjustments in the stance of monetary policy, economic activity would expand at a moderate pace and labor market indicators would continue to strengthen. However, they saw global economic and fi-nancial developments as continuing to pose risks. Mem-bers also continued to expect inflation to remain low in
the near term, in part because of earlier declines in en-ergy prices, but to rise to 2 percent over the medium term as the transitory effects of declines in energy and import prices dissipated and the labor market strength-ened further. Members noted the increase in inflation reported in recent months but expressed a range of views about the extent to which the increase would prove persistent. Several members expressed concern that longer-run inflation expectations may have de-clined. Members agreed they would continue to monitor inflation developments closely.
Against the backdrop of its discussion of current condi-tions, the economic outlook, and the risks and uncer-tainties surrounding the outlook, the Committee decided to maintain the target range for the federal funds rate at ¼ to ½ percent at this meeting. This accommodative stance of monetary policy was expected to support fur-ther improvement in labor market conditions and a re-turn to 2 percent inflation. One member, however, pre-ferred to raise the target range for the federal funds rate, indicating that the current low level of real interest rates was not appropriate in the context of current economic conditions and the progress that had been achieved to-ward the Committee’s objectives.
Members again agreed that, in determining the timing and size of future adjustments to the target range for the federal funds rate, the Committee would assess realized and expected economic conditions relative to its objec-tives of maximum employment and 2 percent inflation. This assessment would take into account a wide range of information, including measures of labor market condi-tions, indicators of inflation pressures and inflation ex-pectations, and readings on financial and international developments. In light of the current shortfall of infla-tion from 2 percent, the Committee agreed that it would carefully monitor actual and expected progress toward its inflation goal. The Committee expected that eco-nomic conditions would evolve in a manner that would warrant only gradual increases in the federal funds rate, and that the federal funds rate was likely to remain, for some time, below levels that were expected to prevail in the longer run. Indeed, several members noted that their current projections of the path for the federal funds rate that would likely be appropriate this year and next were lower than they had projected in December. However, members agreed that future data and developments could lead to changes in the economic outlook and in their projections of appropriate monetary policy, and that the actual path of the federal funds rate would de-pend on the economic outlook as informed by incoming data.
Minutes of the Meeting of March 15–16, 2016 Page 9_____________________________________________________________________________________________
The Committee also decided to maintain its existing pol-icy of reinvesting principal payments from its holdings of agency debt and agency mortgage-backed securities in agency mortgage-backed securities and of rolling over maturing Treasury securities at auction, and it antici-pated doing so until normalization of the level of the federal funds rate is well under way. This policy, by keeping the Committee’s holdings of longer-term secu-rities at sizable levels, should help maintain accommoda-tive financial conditions.
At the conclusion of the discussion, the Committee voted to authorize and direct the Federal Reserve Bank of New York, until it was instructed otherwise, to exe-cute transactions in the SOMA in accordance with the following domestic policy directive, to be released at 2:00 p.m.:
“Effective March 17, 2016, the Federal Open Market Committee directs the Desk to undertake open market operations as necessary to maintain the federal funds rate in a target range of ¼ to ½ percent, including overnight reverse repur-chase operations (and reverse repurchase opera-tions with maturities of more than one day when necessary to accommodate weekend, holiday, or similar trading conventions) at an offering rate of 0.25 percent, in amounts limited only by the value of Treasury securities held outright in the System Open Market Account that are available for such operations and by a per-counterparty limit of $30 billion per day.
The Committee directs the Desk to continue roll-ing over maturing Treasury securities at auction and to continue reinvesting principal payments on all agency debt and agency mortgage-backed securities in agency mortgage-backed securities. The Committee also directs the Desk to engage in dollar roll and coupon swap transactions as necessary to facilitate settlement of the Federal Reserve’s agency mortgage-backed securities transactions.”
The vote also encompassed approval of the statement below to be released at 2:00 p.m.:
“Information received since the Federal Open Market Committee met in January suggests that economic activity has been expanding at a mod-erate pace despite the global economic and finan-cial developments of recent months. Household spending has been increasing at a moderate rate, and the housing sector has improved further;
however, business fixed investment and net ex-ports have been soft. A range of recent indica-tors, including strong job gains, points to addi-tional strengthening of the labor market. Infla-tion picked up in recent months; however, it con-tinued to run below the Committee’s 2 percent longer-run objective, partly reflecting declines in energy prices and in prices of non-energy im-ports. Market-based measures of inflation com-pensation remain low; survey-based measures of longer-term inflation expectations are little changed, on balance, in recent months.
Consistent with its statutory mandate, the Com-mittee seeks to foster maximum employment and price stability. The Committee currently expects that, with gradual adjustments in the stance of monetary policy, economic activity will expand at a moderate pace and labor market indicators will continue to strengthen. However, global eco-nomic and financial developments continue to pose risks. Inflation is expected to remain low in the near term, in part because of earlier declines in energy prices, but to rise to 2 percent over the medium term as the transitory effects of declines in energy and import prices dissipate and the la-bor market strengthens further. The Committee continues to monitor inflation developments closely.
Against this backdrop, the Committee decided to maintain the target range for the federal funds rate at ¼ to ½ percent. The stance of monetary policy remains accommodative, thereby support-ing further improvement in labor market condi-tions and a return to 2 percent inflation.
In determining the timing and size of future ad-justments to the target range for the federal funds rate, the Committee will assess realized and ex-pected economic conditions relative to its objec-tives of maximum employment and 2 percent in-flation. This assessment will take into account a wide range of information, including measures of labor market conditions, indicators of inflation pressures and inflation expectations, and readings on financial and international developments. In light of the current shortfall of inflation from 2 percent, the Committee will carefully monitor actual and expected progress toward its inflation goal. The Committee expects that economic con-ditions will evolve in a manner that will warrant only gradual increases in the federal funds rate;
Page 10 Federal Open Market Committee_____________________________________________________________________________________________
the federal funds rate is likely to remain, for some time, below levels that are expected to prevail in the longer run. However, the actual path of the federal funds rate will depend on the economic outlook as informed by incoming data.
The Committee is maintaining its existing policy of reinvesting principal payments from its hold-ings of agency debt and agency mortgage-backed securities in agency mortgage-backed securities and of rolling over maturing Treasury securities at auction, and it anticipates doing so until normali-zation of the level of the federal funds rate is well under way. This policy, by keeping the Commit-tee’s holdings of longer-term securities at sizable levels, should help maintain accommodative fi-nancial conditions.”
Voting for this action: Janet L. Yellen, William C. Dudley, Lael Brainard, James Bullard, Stanley Fischer, Loretta J. Mester, Jerome H. Powell, Eric Rosengren, and Daniel K. Tarullo.
Voting against this action: Esther L. George.
Ms. George dissented because she believed that a 25 ba-sis point increase in the target range for the federal funds rate was warranted at this meeting. Although risks to the global economy had increased in recent months and fi-nancial markets were unusually volatile at times, she be-lieved that monetary policy should focus primarily on progress toward the Committee’s longer-run objectives.
Recently, labor market conditions had continued to strengthen, with the economy apparently near full em-ployment, and some data had suggested a firming of un-derlying inflation trends. She believed that monetary policy should respond to these developments by gradu-ally removing accommodation. She noted that, in such circumstances, postponing the removal of accommoda-tion could increase financial distortions and risks to the economy and undermine the achievement of the Com-mittee’s longer-run objectives.
Consistent with the Committee’s decision to leave the target range for the federal funds rate unchanged, the Board of Governors took no action to change the interest rates on reserves or discount rates.
It was agreed that the next meeting of the Committee would be held on Tuesday–Wednesday, April 26–27, 2016. The meeting adjourned at 10:40 a.m. on March 16, 2016.
Notation Vote By notation vote completed on February 16, 2016, the Committee unanimously approved the minutes of the Committee meeting held on January 26–27, 2016.
_____________________________ Brian F. Madigan
Secretary
Minutes of the Meeting of March 15–16, 2016 Page 11_____________________________________________________________________________________________
Summary of Economic Projections
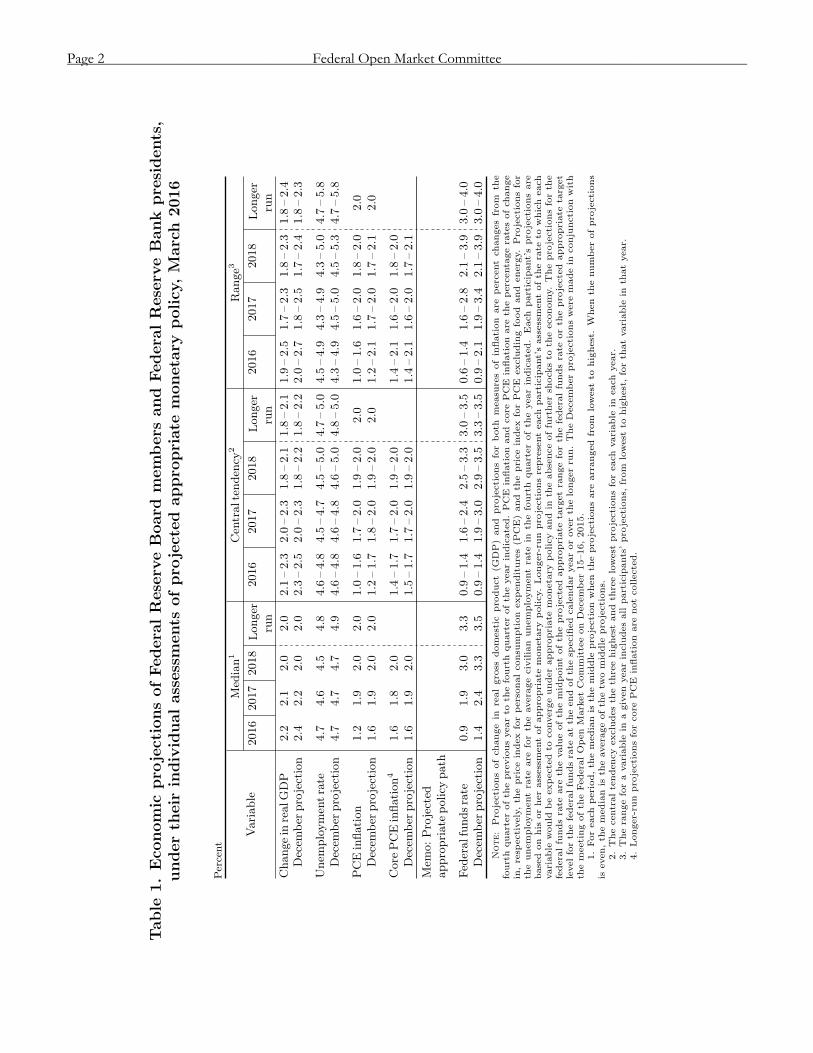
In conjunction with the Federal Open Market Commit-tee (FOMC) meeting held on March 15–16, 2016, meet-ing participants submitted their projections of the most likely outcomes for real output growth, the unemploy-ment rate, inflation, and the federal funds rate for each year from 2016 to 2018 and over the longer run. Each participant’s projection was based on information avail-able at the time of the meeting, together with his or her assessment of appropriate monetary policy and assump-tions about the factors likely to affect economic out-comes. The longer-run projections represent each par-ticipant’s assessment of the value to which each variable would be expected to converge, over time, under appro-priate monetary policy and in the absence of further shocks to the economy. “Appropriate monetary policy” is defined as the future path of policy that each partici-pant deems most likely to foster outcomes for economic activity and inflation that best satisfy his or her individual interpretation of the Federal Reserve’s objectives of maximum employment and stable prices.
FOMC participants generally expected that, under ap-propriate monetary policy, growth in real gross domestic product (GDP) would be at or somewhat above their individual estimates of the longer-run growth rate in 2016 and 2017 and would converge toward the longer-run rate in 2018 (table 1 and figure 1). All participants projected that by the end of the current year, the unem-ployment rate would decline to, or fall below, their indi-vidual estimates of the longer-run normal unemploy-ment rate—that is, their projected unemployment gaps would be zero or negative—and that these zero or neg-ative gaps would persist through 2018, even though many participants reduced their estimates of the longer-run normal rate. All participants projected that inflation, as measured by the four-quarter change in the price in-dex for personal consumption expenditures (PCE), would pick up in 2016 and 2017 from the very low rate seen in 2015. Participants generally projected inflation to be either at or just slightly below the Committee’s 2 percent objective by the end of 2018.
As shown in figure 2, participants expected that it would be appropriate to raise the target range for the federal funds rate gradually over the projection period as head-winds to economic growth dissipate slowly over time and as inflation rises toward the Committee’s goal of 2 percent. Consistent with this outlook, nearly all par-
ticipants projected that the appropriate level of the fed-eral funds rate would be below their individual estimates of its longer-run level through 2018.
Almost all participants regarded the levels of uncertainty associated with their forecasts for economic growth and the unemployment rate as broadly similar to the norms of the previous 20 years and shared a similar view re-garding the uncertainty surrounding their inflation pro-jections. Participants were about evenly divided as to whether they judged the risks to their forecasts for real GDP growth to be weighted to the downside or broadly balanced; no participant saw risks to real GDP growth as weighted to the upside. Participants who thought that risks to their outlook for real GDP growth were skewed to the downside tended to cite developments in foreign economies, recent volatility in financial markets, or the limited capacity of policy to respond to adverse develop-ments as contributing to that view. Risk perceptions re-garding the unemployment rate were more dispersed. Most participants regarded risks to their unemployment rate forecasts as broadly balanced, but four participants considered risks as skewed toward a higher unemploy-ment rate, and two viewed risks as weighted toward a lower unemployment rate. A majority of participants thought that the risks attending their projections for PCE price inflation were weighted to the downside; al-most all of these participants also saw risks to core PCE inflation as tilted in the same direction. Among the rea-sons cited by participants for perceptions of downside risk to their inflation projections were ongoing develop-ments in overseas economies and their possible implica-tions for U.S. import prices, declines in energy prices since December, and low readings for some indicators of long-term inflation expectations.
The Outlook for Economic Activity A substantial majority of participants expected that, con-ditional on their individual assumptions about appropri-ate monetary policy, real GDP in 2016 and 2017 would increase at a rate above their individual estimates of the longer-run normal growth rate before decelerating to a pace at or near their individual estimates of the longer-run normal rate. A number of participants indicated that they expected domestic factors—including improving labor market conditions, stronger household and busi-ness balance sheets, lower consumer energy prices, and a still-accommodative stance of monetary policy—to contribute to strength in aggregate expenditures, while
Page 1_____________________________________________________________________________________________
Table
1.Economic
projectionsofFederalReserveBoardmembersandFederalReserveBankpresidents,
underth
eir
individualassessments
ofprojectedappropriate
monetarypolicy,M
arch2016
Percent
Variable
Median1
Centraltendency2
Range3
2016
2017
2018
Longer
run
2016
2017
2018
Longer
run
2016
2017
2018
Longer
run
Changein
realGDP
2.2
2.1
2.0
2.0
2.1
–2.3
2.0
–2.3
1.8
–2.1
1.8
–2.1
1.9
–2.5
1.7
–2.3
1.8
–2.3
1.8
–2.4
Decemberprojection
2.4
2.2
2.0
2.0
2.3
–2.5
2.0
–2.3
1.8
–2.2
1.8
–2.2
2.0
–2.7
1.8
–2.5
1.7
–2.4
1.8
–2.3
Unemploymentrate
4.7
4.6
4.5
4.8
4.6
–4.8
4.5
–4.7
4.5
–5.0
4.7
–5.0
4.5
–4.9
4.3
–4.9
4.3
–5.0
4.7
–5.8
Decemberprojection
4.7
4.7
4.7
4.9
4.6
–4.8
4.6
–4.8
4.6
–5.0
4.8
–5.0
4.3
–4.9
4.5
–5.0
4.5
–5.3
4.7
–5.8
PCEinflation
1.2
1.9
2.0
2.0
1.0
–1.6
1.7
–2.0
1.9
–2.0
2.0
1.0
–1.6
1.6
–2.0
1.8
–2.0
2.0
Decemberprojection
1.6
1.9
2.0
2.0
1.2
–1.7
1.8
–2.0
1.9
–2.0
2.0
1.2
–2.1
1.7
–2.0
1.7
–2.1
2.0
Core
PCEinflation4
1.6
1.8
2.0
1.4
–1.7
1.7
–2.0
1.9
–2.0
1.4
–2.1
1.6
–2.0
1.8
–2.0
Decemberprojection
1.6
1.9
2.0
1.5
–1.7
1.7
–2.0
1.9
–2.0
1.4
–2.1
1.6
–2.0
1.7
–2.1
Memo:Projected
appropriate
policypath
Federalfundsrate
0.9
1.9
3.0
3.3
0.9
–1.4
1.6
–2.4
2.5
–3.3
3.0
–3.5
0.6
–1.4
1.6
–2.8
2.1
–3.9
3.0
–4.0
Decemberprojection
1.4
2.4
3.3
3.5
0.9
–1.4
1.9
–3.0
2.9
–3.5
3.3
–3.5
0.9
–2.1
1.9
–3.4
2.1
–3.9
3.0
–4.0
Note:
Pro
jectionsofch
angein
realgro
ssdomestic
pro
duct(G
DP)and
pro
jectionsforboth
measu
resofinflation
are
percentch
angesfrom
the
fourth
quarterofth
epreviousyearto
thefourth
quarterofth
eyearindicated.PCE
inflation
and
core
PCE
inflation
are
thepercenta
gera
tesofch
ange
in,resp
ectively,th
epriceindex
forpersonalconsu
mption
expenditures(P
CE)and
thepriceindex
forPCE
excludingfood
and
energ
y.Pro
jectionsfor
theunemploymentra
teare
forth
eavera
gecivilian
unemploymentra
tein
thefourth
quarterofth
eyearindicated.Each
participant’spro
jectionsare
based
on
his
orherassessmentofappro
priate
moneta
rypolicy.Longer-ru
npro
jectionsrepresenteach
participant’sassessmentofth
era
teto
whicheach
variable
would
beexpectedto
converg
eunderappro
priate
moneta
rypolicyandin
theabsenceoffurthersh
ock
sto
theeconomy.Thepro
jectionsforth
efedera
lfundsra
teare
thevalueofth
emidpointofth
epro
jected
appro
priate
targ
etra
ngeforth
efedera
lfundsra
teorth
epro
jected
appro
priate
targ
et
levelforth
efedera
lfundsra
teatth
eendofth
esp
ecifiedcalendaryearoroverth
elongerru
n.TheDecemberpro
jectionswere
madein
conjunctionwith
themeetingofth
eFedera
lOpen
Mark
etCommitteeon
December15–16,2015.
1.Foreach
period,th
emedian
isth
emiddle
pro
jection
when
thepro
jectionsare
arranged
from
lowest
tohighest.W
hen
thenumberofpro
jections
iseven,th
emedian
isth
eavera
geofth
etw
omiddle
pro
jections.
2.Thecentraltendencyexcludesth
eth
reehighest
and
threelowest
pro
jectionsforeach
variable
ineach
year.
3.Thera
ngeforavariable
inagiven
yearincludesall
participants’pro
jections,
from
lowest
tohighest,forth
atvariable
inth
atyear.
4.Longer-ru
npro
jectionsforcore
PCE
inflation
are
notcollected.
Page 2 Federal Open Market Committee_____________________________________________________________________________________________
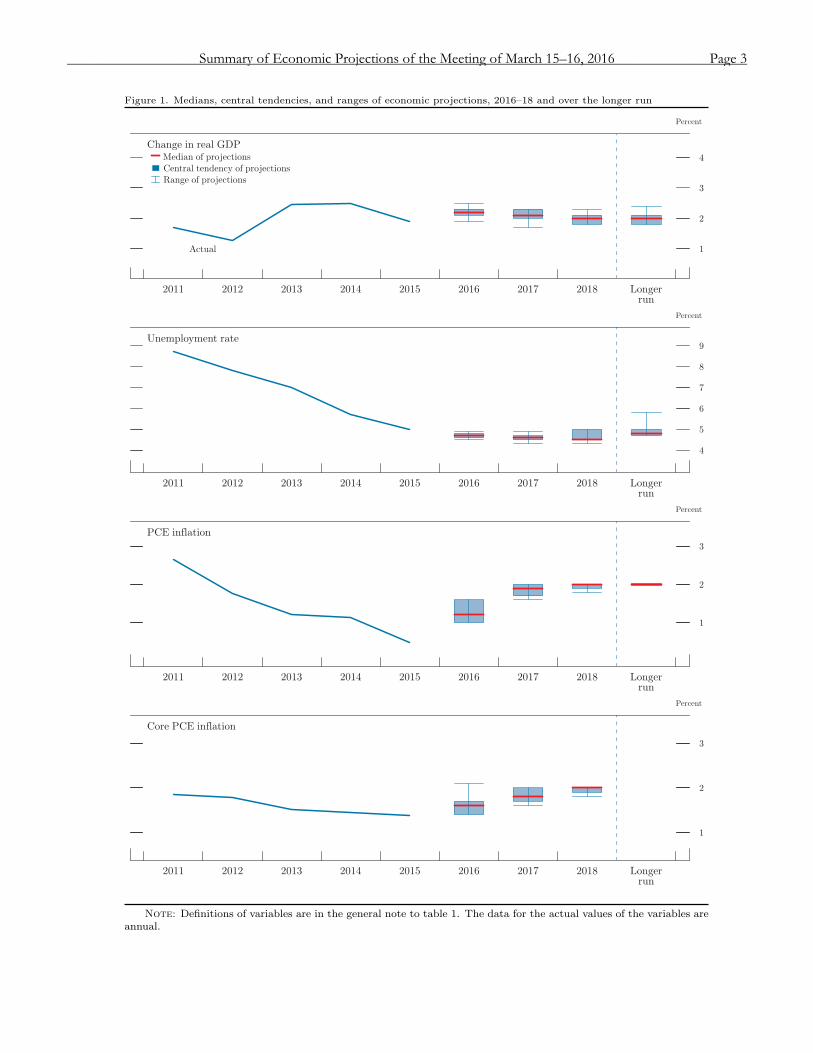
Figure 1. Medians, central tendencies, and ranges of economic projections, 2016–18 and over the longer run
Change in real GDP
Percent
1
2
3
4
2011 2012 2013 2014 2015 2016 2017 2018 Longerrun
Central tendency of projections
Range of projections
Median of projections
Actual
Unemployment rate
Percent
4
5
6
7
8
9
2011 2012 2013 2014 2015 2016 2017 2018 Longerrun
PCE inflation
Percent
1
2
3
2011 2012 2013 2014 2015 2016 2017 2018 Longerrun
Core PCE inflation
Percent
1
2
3
2011 2012 2013 2014 2015 2016 2017 2018 Longerrun
Note: Definitions of variables are in the general note to table 1. The data for the actual values of the variables areannual.
Summary of Economic Projections of the Meeting of March 15–16, 2016 Page 3_____________________________________________________________________________________________
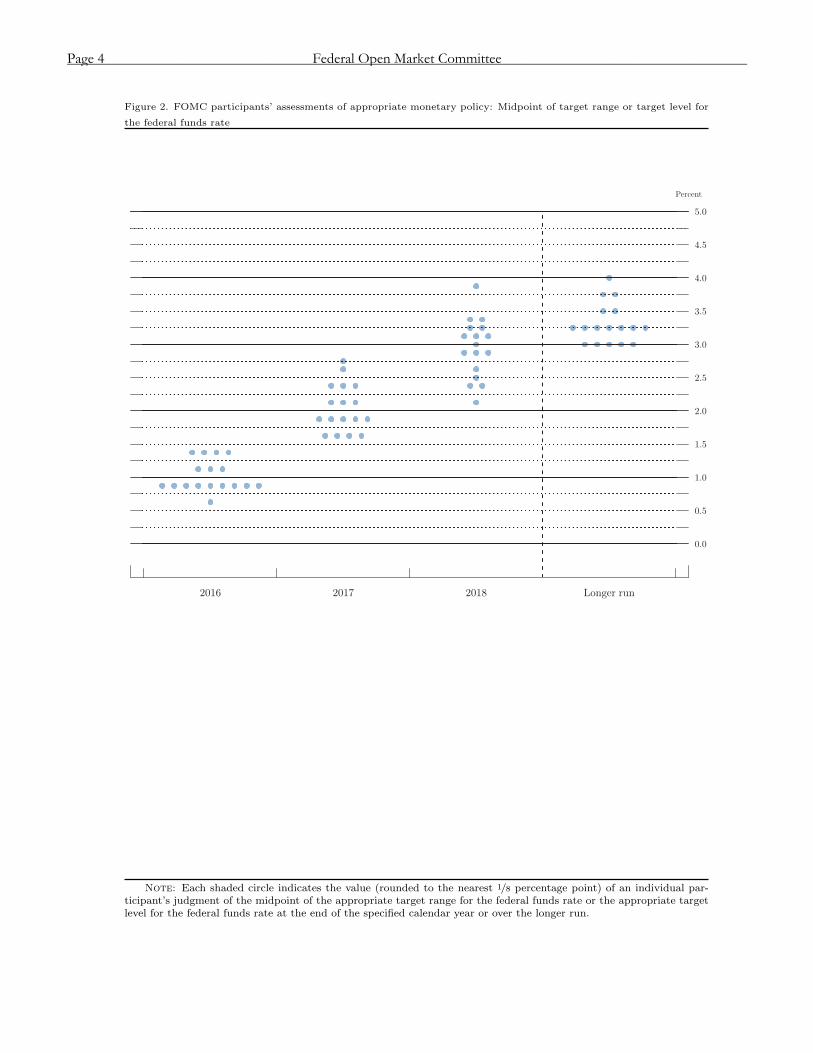
Figure 2. FOMC participants’ assessments of appropriate monetary policy: Midpoint of target range or target level for
the federal funds rate
Percent
0.0
0.5
1.0
1.5
2.0
2.5
3.0
3.5
4.0
4.5
5.0
2016 2017 2018 Longer run
Note: Each shaded circle indicates the value (rounded to the nearest 1/8 percentage point) of an individual par-ticipant’s judgment of the midpoint of the appropriate target range for the federal funds rate or the appropriate targetlevel for the federal funds rate at the end of the specified calendar year or over the longer run.
Page 4 Federal Open Market Committee_____________________________________________________________________________________________
foreign conditions were projected to be a source of weakness for some time.
Compared with their forecasts prepared for the Sum-mary of Economic Projections (SEP) in December, most participants marked down their projections of real GDP growth in 2016, and several did so for 2017. Over-all, the median value of participants’ projections for real GDP growth in 2016 was revised down a little to 2.2 per-cent, and that for 2017 was revised down slightly to 2.1 percent.
The median forecast for the unemployment rate was a bit lower in 2017 and 2018 than in December and showed a modest downward tilt over the three years of the forecast. Participants cited stronger-than-expected labor market data in recent months as a factor explaining these revisions. Moreover, many participants also re-duced their estimates of the longer-run normal rate of unemployment, resulting in a modest reduction in the median of the longer-run rate. Thus, while a majority expected the unemployment rate gap to turn negative by the end of this year, fewer participants projected a nega-tive gap at that time than was the case in December. For 2017, all participants projected a negative unemploy-ment rate gap, and a substantial majority did so for 2018 as well. All told, however, the medians of the unemploy-ment rate gaps for the three years of the projection were essentially unchanged from the December SEP.
Figures 3.A and 3.B show the distribution of partici-pants’ views regarding the likely outcomes for real GDP growth and the unemployment rate through 2018 and in the longer run. The distribution of the projections of GDP growth shifted toward lower values for 2016; dif-ferences from December for 2017 and 2018 were less noteworthy, but there was a modest narrowing of the distribution for 2018. The distributions of projections for the unemployment rate in 2017 and beyond shifted modestly toward lower values, relative to the December SEP, on the basis of strong labor market indicators in recent months.
The Outlook for Inflation All participants projected PCE price inflation to pick up in 2016 and to rise further in 2017. For 2018, nearly all expected PCE price inflation to be at or very close to the Committee’s 2 percent longer-run objective. However, relative to the December SEP, almost all participants marked down their projections for PCE price inflation in 2016, observing that declines in energy prices since the end of last year and continued strength in the dollar were expected to impart additional downward pressure on inflation this year. Many participants also lowered
their projections for inflation in 2017, although the me-dian value for that year was unchanged. Inflation pro-jections in 2018 were little changed from December. Re-garding core PCE price inflation, some participants marked down their projections for 2016, although al-most all still expected core inflation to rise gradually over the projection period and to be at or very close to 2 per-cent by the end of 2018. Factors cited by participants as contributing to their expectation that inflation will rise over the medium term included recent readings for core inflation, an anticipation that improvements in labor markets will continue, the fading effects of recent dollar appreciation and declines in oil prices, and an assessment that long-term inflation expectations will remain at levels consistent with the FOMC’s 2 percent objective, all sup-ported by a stance of monetary policy that participants generally described as accommodative.
Figures 3.C and 3.D provide information on the distri-bution of participants’ views about the outlook for infla-tion. The distribution for PCE price inflation in 2016 shifted notably to the left compared with the December SEP, while changes in the distributions of projections for 2017 and 2018 were small. The distributions of par-ticipants’ projections for core PCE price inflation shifted only a touch toward lower values for 2017 and 2018 as compared with December.
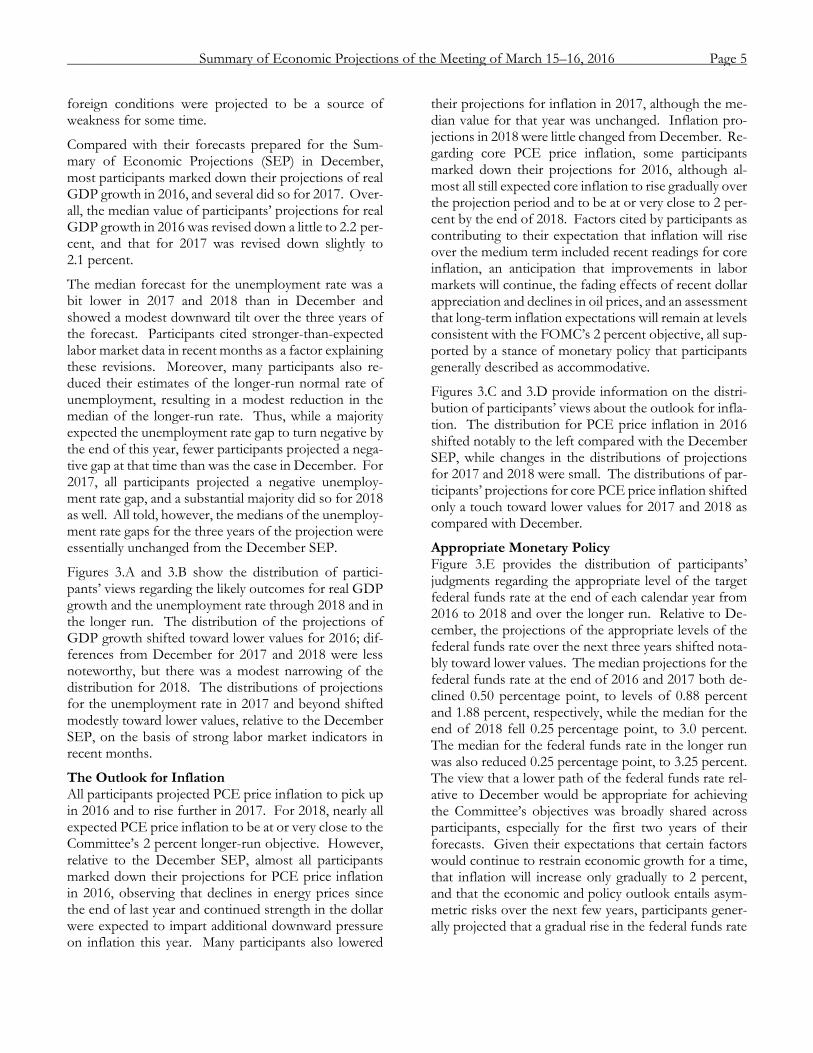
Appropriate Monetary Policy Figure 3.E provides the distribution of participants’ judgments regarding the appropriate level of the target federal funds rate at the end of each calendar year from 2016 to 2018 and over the longer run. Relative to De-cember, the projections of the appropriate levels of the federal funds rate over the next three years shifted nota-bly toward lower values. The median projections for the federal funds rate at the end of 2016 and 2017 both de-clined 0.50 percentage point, to levels of 0.88 percent and 1.88 percent, respectively, while the median for the end of 2018 fell 0.25 percentage point, to 3.0 percent. The median for the federal funds rate in the longer run was also reduced 0.25 percentage point, to 3.25 percent. The view that a lower path of the federal funds rate rel-ative to December would be appropriate for achieving the Committee’s objectives was broadly shared across participants, especially for the first two years of their forecasts. Given their expectations that certain factors would continue to restrain economic growth for a time, that inflation will increase only gradually to 2 percent, and that the economic and policy outlook entails asym-metric risks over the next few years, participants gener-ally projected that a gradual rise in the federal funds rate
Summary of Economic Projections of the Meeting of March 15–16, 2016 Page 5_____________________________________________________________________________________________
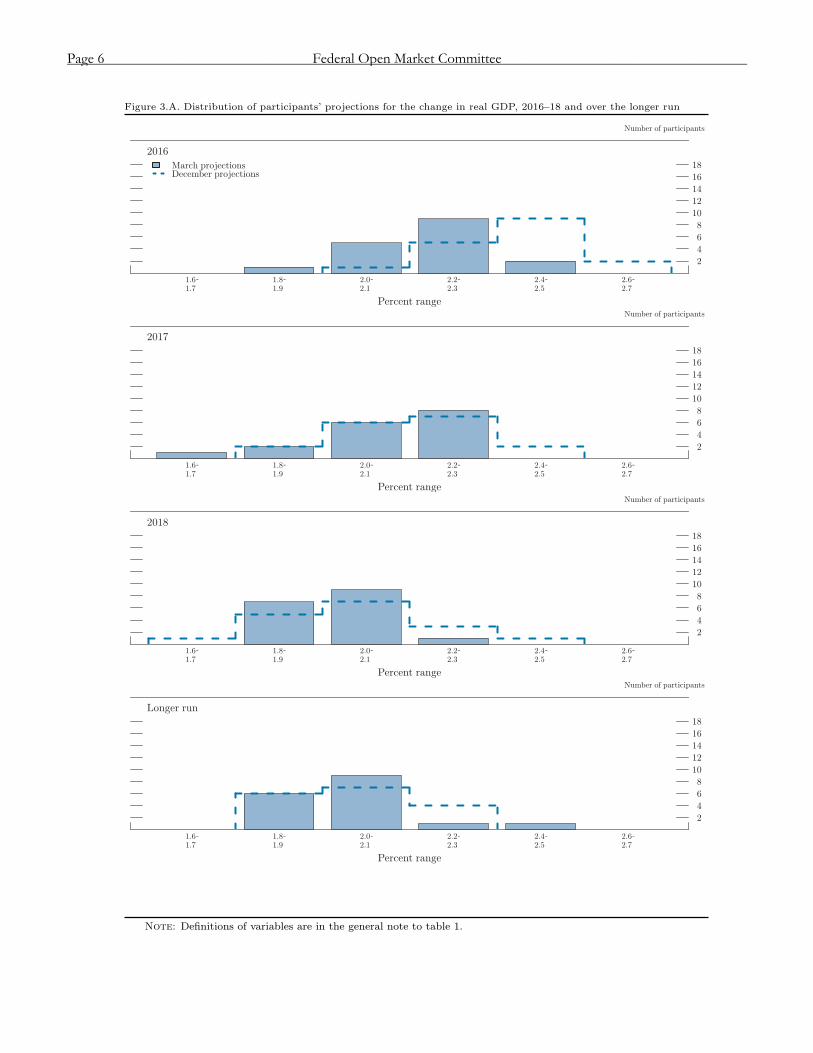
Figure 3.A. Distribution of participants’ projections for the change in real GDP, 2016–18 and over the longer run
2016
Number of participants
2
4
6
8
10
12
14
16
18
1.6 1.8 2.0 2.2 2.4 2.6 1.7 1.9 2.1 2.3 2.5 2.7
Percent range
March projectionsDecember projections
2017
Number of participants
2
4
6
8
10
12
14
16
18
1.6 1.8 2.0 2.2 2.4 2.6 1.7 1.9 2.1 2.3 2.5 2.7
Percent range
2018
Number of participants
2
4
6
8
10
12
14
16
18
1.6 1.8 2.0 2.2 2.4 2.6 1.7 1.9 2.1 2.3 2.5 2.7
Percent range
Longer run
Number of participants
2
4
6
8
10
12
14
16
18
1.6 1.8 2.0 2.2 2.4 2.6 1.7 1.9 2.1 2.3 2.5 2.7
Percent range
Note: Definitions of variables are in the general note to table 1.
Page 6 Federal Open Market Committee_____________________________________________________________________________________________
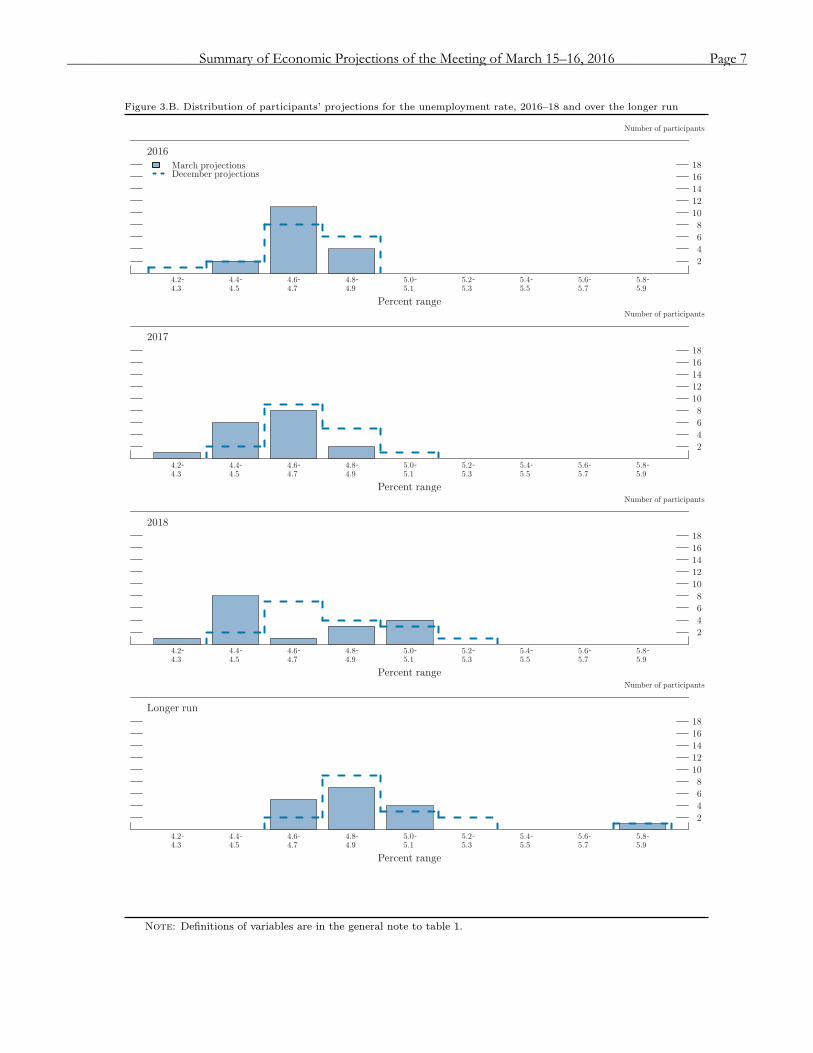
Figure 3.B. Distribution of participants’ projections for the unemployment rate, 2016–18 and over the longer run
2016
Number of participants
2
4
6
8
10
12
14
16
18
4.2 4.4 4.6 4.8 5.0 5.2 5.4 5.6 5.8 4.3 4.5 4.7 4.9 5.1 5.3 5.5 5.7 5.9
Percent range
March projectionsDecember projections
2017
Number of participants
2
4
6
8
10
12
14
16
18
4.2 4.4 4.6 4.8 5.0 5.2 5.4 5.6 5.8 4.3 4.5 4.7 4.9 5.1 5.3 5.5 5.7 5.9
Percent range
2018
Number of participants
2
4
6
8
10
12
14
16
18
4.2 4.4 4.6 4.8 5.0 5.2 5.4 5.6 5.8 4.3 4.5 4.7 4.9 5.1 5.3 5.5 5.7 5.9
Percent range
Longer run
Number of participants
2
4
6
8
10
12
14
16
18
4.2 4.4 4.6 4.8 5.0 5.2 5.4 5.6 5.8 4.3 4.5 4.7 4.9 5.1 5.3 5.5 5.7 5.9
Percent range
Note: Definitions of variables are in the general note to table 1.
Summary of Economic Projections of the Meeting of March 15–16, 2016 Page 7_____________________________________________________________________________________________
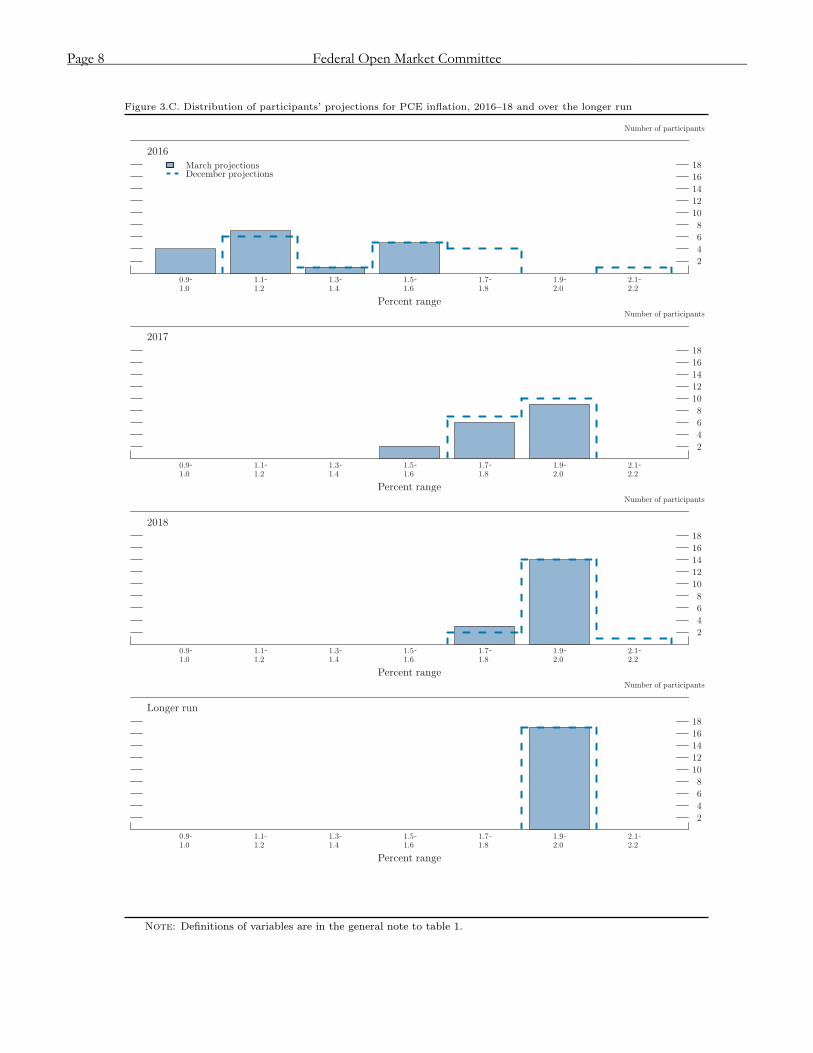
Figure 3.C. Distribution of participants’ projections for PCE inflation, 2016–18 and over the longer run
2016
Number of participants
2
4
6
8
10
12
14
16
18
0.9 1.1 1.3 1.5 1.7 1.9 2.1 1.0 1.2 1.4 1.6 1.8 2.0 2.2
Percent range
March projectionsDecember projections
2017
Number of participants
2
4
6
8
10
12
14
16
18
0.9 1.1 1.3 1.5 1.7 1.9 2.1 1.0 1.2 1.4 1.6 1.8 2.0 2.2
Percent range
2018
Number of participants
2
4
6
8
10
12
14
16
18
0.9 1.1 1.3 1.5 1.7 1.9 2.1 1.0 1.2 1.4 1.6 1.8 2.0 2.2
Percent range
Longer run
Number of participants
2
4
6
8
10
12
14
16
18
0.9 1.1 1.3 1.5 1.7 1.9 2.1 1.0 1.2 1.4 1.6 1.8 2.0 2.2
Percent range
Note: Definitions of variables are in the general note to table 1.
Page 8 Federal Open Market Committee_____________________________________________________________________________________________
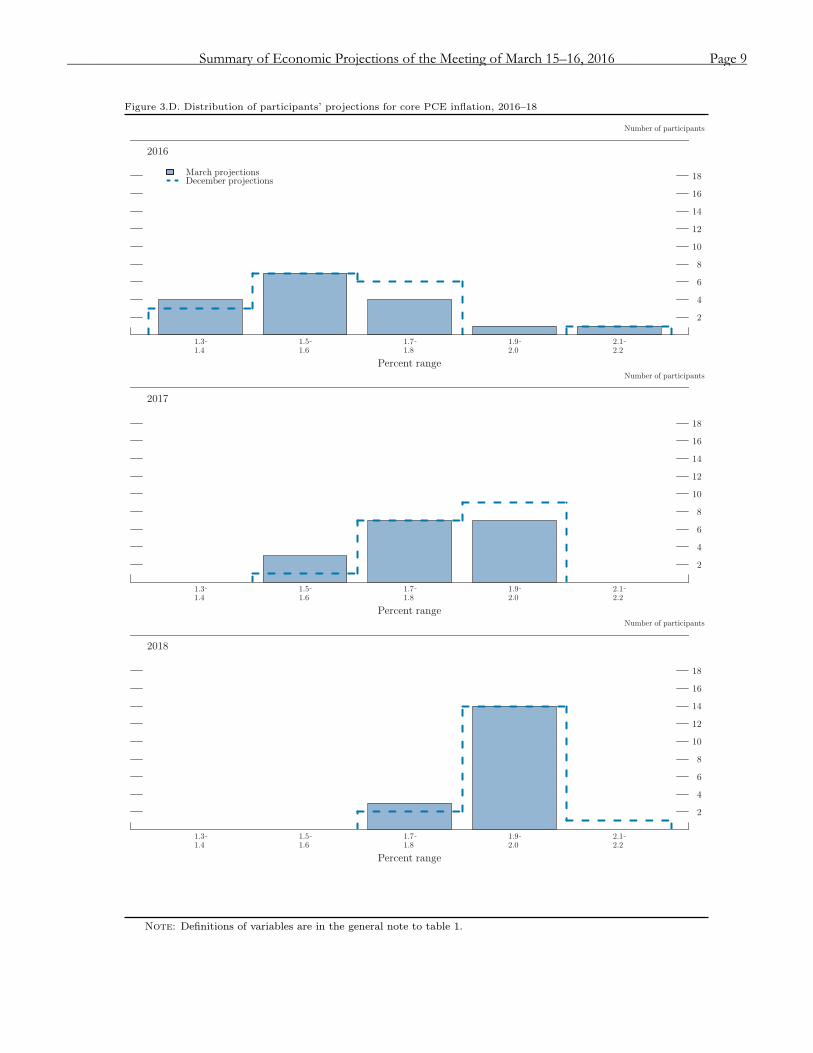
Figure 3.D. Distribution of participants’ projections for core PCE inflation, 2016–18
2016
Number of participants
2
4
6
8
10
12
14
16
18
1.3 1.5 1.7 1.9 2.1 1.4 1.6 1.8 2.0 2.2
Percent range
March projectionsDecember projections
2017
Number of participants
2
4
6
8
10
12
14
16
18
1.3 1.5 1.7 1.9 2.1 1.4 1.6 1.8 2.0 2.2
Percent range
2018
Number of participants
2
4
6
8
10
12
14
16
18
1.3 1.5 1.7 1.9 2.1 1.4 1.6 1.8 2.0 2.2
Percent range
Note: Definitions of variables are in the general note to table 1.
Summary of Economic Projections of the Meeting of March 15–16, 2016 Page 9_____________________________________________________________________________________________
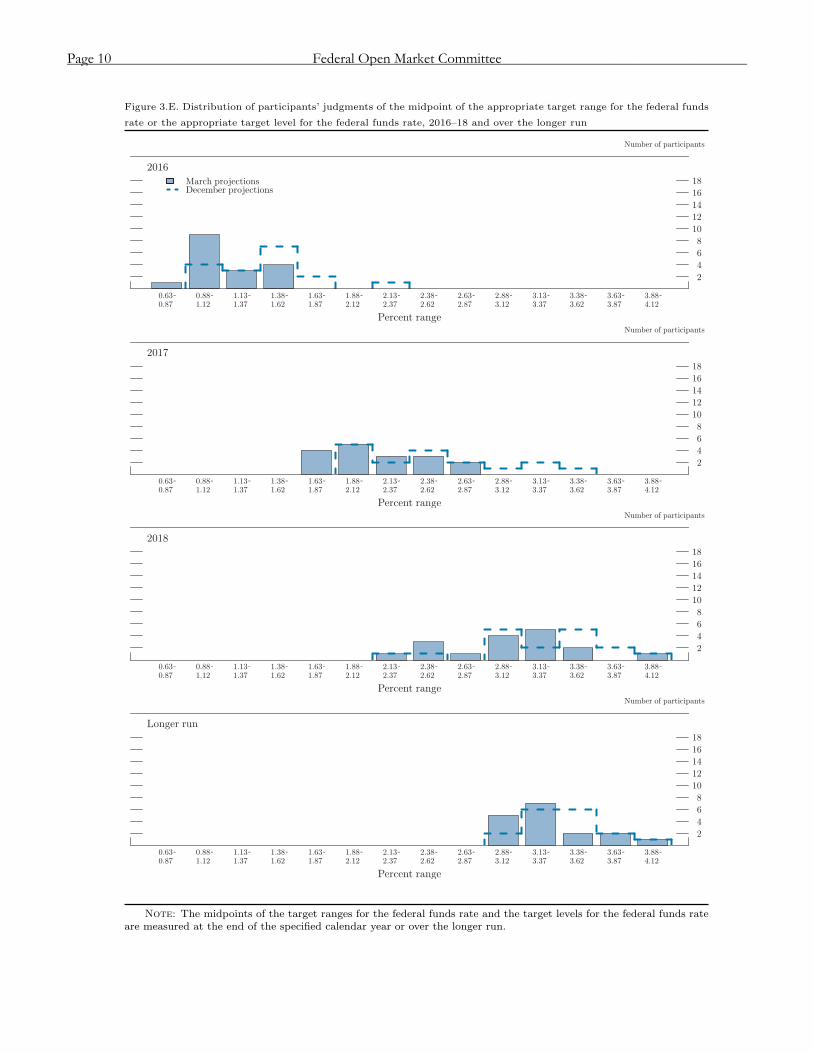
Figure 3.E. Distribution of participants’ judgments of the midpoint of the appropriate target range for the federal funds
rate or the appropriate target level for the federal funds rate, 2016–18 and over the longer run
2016
Number of participants
2
4
6
8
10
12
14
16
18
0.63 0.88 1.13 1.38 1.63 1.88 2.13 2.38 2.63 2.88 3.13 3.38 3.63 3.88 0.87 1.12 1.37 1.62 1.87 2.12 2.37 2.62 2.87 3.12 3.37 3.62 3.87 4.12
Percent range
March projectionsDecember projections
2017
Number of participants
2
4
6
8
10
12
14
16
18
0.63 0.88 1.13 1.38 1.63 1.88 2.13 2.38 2.63 2.88 3.13 3.38 3.63 3.88 0.87 1.12 1.37 1.62 1.87 2.12 2.37 2.62 2.87 3.12 3.37 3.62 3.87 4.12
Percent range
2018
Number of participants
2
4
6
8
10
12
14
16
18
0.63 0.88 1.13 1.38 1.63 1.88 2.13 2.38 2.63 2.88 3.13 3.38 3.63 3.88 0.87 1.12 1.37 1.62 1.87 2.12 2.37 2.62 2.87 3.12 3.37 3.62 3.87 4.12
Percent range
Longer run
Number of participants
2
4
6
8
10
12
14
16
18
0.63 0.88 1.13 1.38 1.63 1.88 2.13 2.38 2.63 2.88 3.13 3.38 3.63 3.88 0.87 1.12 1.37 1.62 1.87 2.12 2.37 2.62 2.87 3.12 3.37 3.62 3.87 4.12
Percent range
Note: The midpoints of the target ranges for the federal funds rate and the target levels for the federal funds rateare measured at the end of the specified calendar year or over the longer run.
Page 10 Federal Open Market Committee_____________________________________________________________________________________________
over that period would be appropriate; almost all partic-ipants judged it advisable for the federal funds rate to remain below their individual estimates of its longer-run normal level through the end of 2018.
Although the median of participants’ projections of the federal funds rate in the longer run moved lower, the range of estimates for the longer-run rate was unchanged from December. Hence, with all participants anticipat-ing that inflation would eventually reach the Commit-tee’s objective of 2 percent, the range of participants’ judgments of the longer-run level of the real federal funds rate was also unchanged from December, at 1 to 2 percent; the median value for the longer-run real rate was 1.25 percent, down 0.25 percentage point from De-cember.
Participants’ views of the appropriate path for monetary policy were informed by their judgments about the out-look for economic activity, labor markets, and inflation as well as the risks and uncertainties associated with that outlook. One important consideration for many partic-ipants was their assessment that several factors—includ-ing weak foreign economic conditions, a persistently high exchange value of the dollar, and tighter financial conditions—will continue to restrain economic growth for a time and thus collectively imply a temporarily low level for the neutral rate of interest. These forces, com-bined with the current proximity of short-term interest rates to their effective lower bound and the related asym-metry of risks around the outlook for real GDP growth and inflation, were noted as reasons why a gradual ap-proach to raising the federal funds rate would be appro-priate, provided that the outlook for the economy un-folded about as expected. Another consideration under-lying the anticipated gradual removal of policy accom-modation involved the prospects for inflation to return to the Committee’s objective of 2 percent. In assessing those prospects, participants weighed the implications of a range of factors, including indicators of longer-run in-flation expectations and the magnitude and persistence of the effects of both low energy prices and the earlier appreciation of the dollar. Judgments regarding the likely future strength of the labor market and future wage gains also figured into participants’ forecasts for inflation.
1 Table 2 provides estimates of the forecast uncertainty for the change in real GDP, the unemployment rate, and total con-sumer price inflation over the period from 1996 through 2015. At the end of this summary, the box “Forecast Uncertainty”
Uncertainty and Risks As in the December SEP, nearly all participants judged the levels of uncertainty around their projections for real GDP growth, the unemployment rate, and both headline and core PCE price inflation as broadly similar to the average levels of the past 20 years (as shown in the left-hand column of figure 4).1 In contrast, participants re-vised appreciably their assessments of the risks to real GDP growth, the unemployment rate, and both headline and core inflation since December (as shown in the right-hand column). Eight participants saw the risks to real GDP growth as weighted to the downside—up from three in December. Four participants saw risks to the unemployment rate as skewed toward higher unem-ployment—two more than in December—while two continued to see risks weighted toward lower unemploy-ment. Explanations for the less marked shift in risks to the outlook for the unemployment rate versus the out-look for real GDP growth included favorable labor mar-ket news over the past three months. More generally, participants cited financial market and global economic conditions, either on their own or coupled with the lim-ited capacity of policymakers to respond to possible ad-verse economic conditions, as reasons for the downward tilt to their perceptions of the risks to growth. Turning
discusses the sources and interpretation of uncertainty in the economic forecasts and explains the approach used to assess the uncertainty and risks attending the participants’ projec-tions.
Table 2. Average historical projection error ranges Percentage points
Variable 2016 2017 2018
Change in real GDP1 . . . . . . . . . ±1.6 ±2.1 ±2.1
Unemployment rate1 . . . . . . . . . . ±0.5 ±1.2 ±1.7
Total consumer prices2 . . . . . . . . ±0.9 ±1.1 ±1.1
NOTE: Error ranges shown are measured as plus or minus the root mean squared error of projections for 1996 through 2015 that were released in the spring by various private and government forecasters. As described in the box “Forecast Uncertainty,” under certain assumptions, there is about a 70 percent probability that actual outcomes for real GDP, unemployment, and consumer prices will be in ranges implied by the average size of projec-tion errors made in the past. For more information, see David Reifschneider and Peter Tulip (2007), “Gauging the Uncertainty of the Economic Outlook from Historical Forecasting Errors,” Finance and Economics Discussion Se-ries 2007-60 (Washington: Board of Governors of the Federal Reserve Sys-tem, November), available at www.federalreserve.gov/pubs/feds/2007/ 200760/200760abs.html; and Board of Governors of the Federal Reserve System, Division of Research and Statistics (2014), “Updated Historical Forecast Errors,” memorandum, April 9, www.federalreserve.gov/ foia/files/20140409-historical-forecast-errors.pdf.
1. Definitions of variables are in the general note to table 1. 2. Measure is the overall consumer price index, the price measure that
has been most widely used in government and private economic forecasts. Projection is percent change, fourth quarter of the previous year to the fourth quarter of the year indicated.
Summary of Economic Projections of the Meeting of March 15–16, 2016 Page 11_____________________________________________________________________________________________
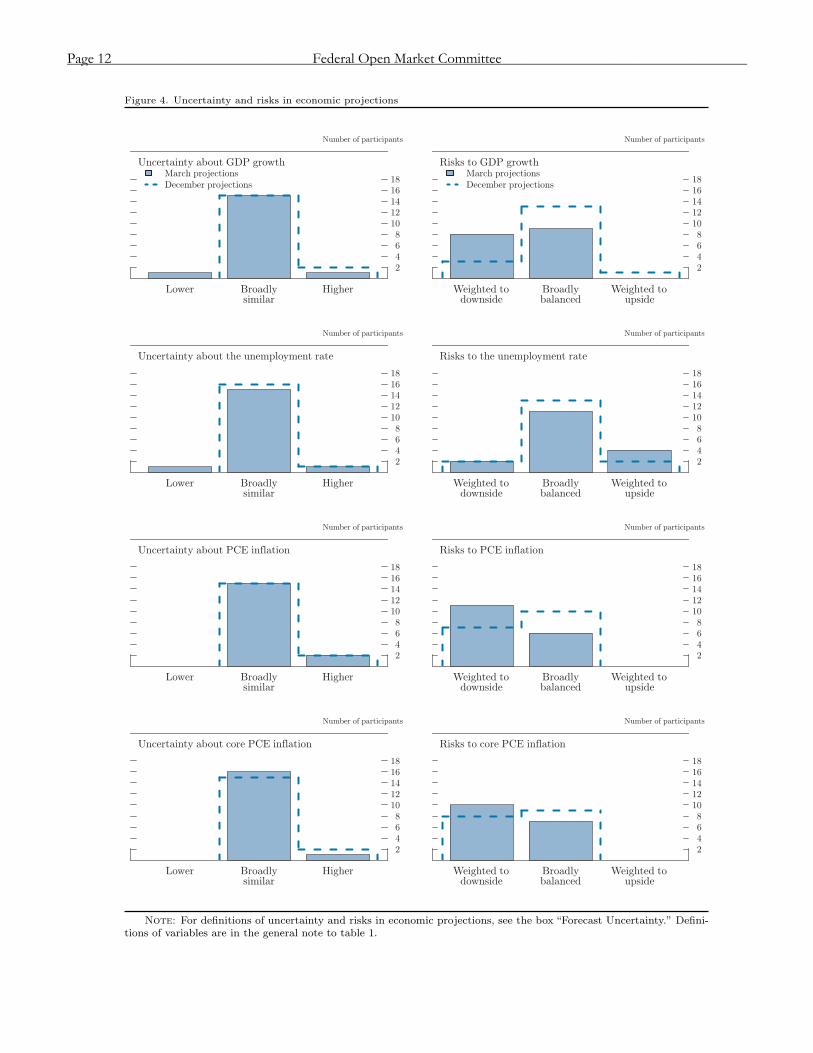
Figure 4. Uncertainty and risks in economic projections
Uncertainty about GDP growth
Number of participants
2468
1012141618
Lower Broadly Highersimilar
March projections
December projections
Uncertainty about the unemployment rate
Number of participants
2468
1012141618
Lower Broadly Highersimilar
Uncertainty about PCE inflation
Number of participants
2468
1012141618
Lower Broadly Highersimilar
Uncertainty about core PCE inflation
Number of participants
2468
1012141618
Lower Broadly Highersimilar
Risks to GDP growth
Number of participants
2468
1012141618
Weighted to Broadly Weighted todownside balanced upside
March projections
December projections
Risks to the unemployment rate
Number of participants
2468
1012141618
Weighted to Broadly Weighted todownside balanced upside
Risks to PCE inflation
Number of participants
2468
1012141618
Weighted to Broadly Weighted todownside balanced upside
Risks to core PCE inflation
Number of participants
2468
1012141618
Weighted to Broadly Weighted todownside balanced upside
Note: For definitions of uncertainty and risks in economic projections, see the box “Forecast Uncertainty.” Defini-tions of variables are in the general note to table 1.
Page 12 Federal Open Market Committee_____________________________________________________________________________________________
to inflation, 11 participants indicated that the risks to their headline inflation forecasts were skewed to the downside, up from 7 in December, and nearly all of these participants saw the same tilt to the risks for core inflation. Many participants noted some recent evidence
of a deterioration, or an absence of improvement, in in-dicators of long-term inflation expectations as contrib-uting to increased downside risks for inflation, while some pointed to the further declines in energy prices.
Summary of Economic Projections of the Meeting of March 15–16, 2016 Page 13_____________________________________________________________________________________________
Forecast Uncertainty
The economic projections provided by the members of the Board of Governors and the presidents of the Federal Reserve Banks inform discussions of monetary policy among policy-makers and can aid public understanding of the basis for policy actions. Considerable uncer-tainty attends these projections, however. The economic and statistical models and relation-ships used to help produce economic forecasts are necessarily imperfect descriptions of the real world, and the future path of the economy can be affected by myriad unforeseen develop-ments and events. Thus, in setting the stance of monetary policy, participants consider not only what appears to be the most likely eco-nomic outcome as embodied in their projec-tions, but also the range of alternative possibil-ities, the likelihood of their occurring, and the potential costs to the economy should they oc-cur.
Table 2 summarizes the average historical accuracy of a range of forecasts, including those reported in past Monetary Policy Reports and those prepared by the Federal Reserve Board’s staff in advance of meetings of the Federal Open Market Committee. The projec-tion error ranges shown in the table illustrate the considerable uncertainty associated with economic forecasts. For example, suppose a participant projects that real gross domestic product (GDP) and total consumer prices will rise steadily at annual rates of, respectively, 3 percent and 2 percent. If the uncertainty at-tending those projections is similar to that ex-perienced in the past and the risks around the projections are broadly balanced, the numbers reported in table 2 would imply a probability of about 70 percent that actual GDP would ex-
pand within a range of 1.4 to 4.6 percent in the current year and 0.9 to 5.1 percent in the second and third years. The corresponding 70 percent confidence intervals for overall inflation would be 1.1 to 2.9 percent in the current year and 0.9 to 3.1 percent in the second and third years.
Because current conditions may differ from those that prevailed, on average, over history, participants provide judgments as to whether the uncertainty attached to their projections of each variable is greater than, smaller than, or broadly similar to typical levels of forecast un-certainty in the past, as shown in table 2. Partic-ipants also provide judgments as to whether the risks to their projections are weighted to the up-side, are weighted to the downside, or are broadly balanced. That is, participants judge whether each variable is more likely to be above or below their projections of the most likely out-come. These judgments about the uncertainty and the risks attending each participant’s projec-tions are distinct from the diversity of partici-pants’ views about the most likely outcomes. Forecast uncertainty is concerned with the risks associated with a particular projection rather than with divergences across a number of differ-ent projections.
As with real activity and inflation, the out-look for the future path of the federal funds rate is subject to considerable uncertainty. This un-certainty arises primarily because each partici-pant’s assessment of the appropriate stance of monetary policy depends importantly on the evolution of real activity and inflation over time. If economic conditions evolve in an unexpected manner, then assessments of the appropriate setting of the federal funds rate would change from that point forward.
Page 14 Federal Open Market Committee_____________________________________________________________________________________________


