Microbiological Water Quality in Irrigation Water,Treated Wastewater, and Untreated Wastewaterand Its Impact on Vegetables in Sonora, Mexico
Item Type text; Electronic Dissertation
Authors Gortares-Moroyoqui, Pablo
Publisher The University of Arizona.
Rights Copyright © is held by the author. Digital access to this materialis made possible by the University Libraries, University of Arizona.Further transmission, reproduction or presentation (such aspublic display or performance) of protected items is prohibitedexcept with permission of the author.
Download date 28/04/2018 17:17:58
Link to Item http://hdl.handle.net/10150/195909
MICROBIOLOGICAL WATER QUALITY IN IRRIGATION WATER, TREATED WASTEWATER, AND UNTREATED WASTEWATER AND ITS IMPACT ON
VEGETABLES IN SONORA, MEXICO
by
Pablo Gortáres-Moroyoqui
_______________________
A Dissertation Submitted to the Faculty of the
DEPARTMENT OF SOIL, WATER, AND ENVIRONMENTAL SCIENCE
In Partial Fulfillment of the Requirements For the Degree of
DOCTOR OF PHILOSOPHY
In the Graduate College
THE UNIVERSITY OF ARIZONA
2 0 0 7
2
THE UNIVERSITY OF ARIZONA GRADUATE COLLEGE
As members of the Dissertation Committee, we certify that we have read the dissertation
prepared by Pablo Gortáres-Moroyoqui entitled Microbiological Water Quality in
Irrigation Water, Treated Wastewater, and Untreated Wastewater and Its Impact on
Vegetables in Sonora, México and recommend that it be accepted as fulfilling the
dissertation requirement for the Degree of Doctor of Philosophy
_______________________________________________________________________ Date: 7/27/2007
Charles P. Gerba, Ph.D. _______________________________________________________________________ Date: 7/27/2007
Martin Karpiscak, Ph.D. _______________________________________________________________________ Date: 7/27/2997
Ian Pepper, Ph.D _______________________________________________________________________ Date: 7/27/2007
Kelly A. Reynolds, Ph.D. Final approval and acceptance of this dissertation is contingent upon the candidate’s submission of the final copies of the dissertation to the Graduate College. I hereby certify that I have read this dissertation prepared under my direction and recommend that it be accepted as fulfilling the dissertation requirement. ________________________________________________ Date: 7/27/2007 Dissertation Director: Charles P. Gerba, Ph.D.
3
STATEMENT BY AUTHOR This dissertation has been submitted in partial fulfillment of requirements for an advanced degree at The University of Arizona and is deposited in the University Library to be made available to borrowers under rules of the Library. Brief quotations from this dissertation are allowable without special permission, provided that accurate acknowledgment of source is made. Requests for permission for extended quotation from or reproduction of this manuscript in whole or in part may be granted by the head of the major department or the Dean of the Graduate College when in his or her judgment the proposed use of the material is in the interests of scholarship. I all others instances, however, permission must be obtained from the author.
SIGNED: Pablo Gortáres-Moroyoqui
4
ACKNOWLEDGEMENTS I would like to thank Dr. Gerba for his invaluable advice, motivation, patient and excellent guidance. Dr. Gerba is one of the few professors I have known who really worry for his student. It is great for me have been one of his students. Dr. Gerba also is one of the few professors I have known who always is available to help international students for many countries on the world, particularly from Latin America. I would like to thank Dr. Karpiscak for his guidance through the development of this research. I think, Karpiscak´s comments and suggestions related to grammar, spelling, and others focused on improve my dissertation written has been invaluable. Thanks to every one of my teachers for their taught and for help me and guidance me to reach my goal. I gratefully acknowledge the support and cooperation of all my friends, Gerba lab staff, and graduate students. There are many names but particularly I would like to mention some of them: Jaime, Absar, Amy, Faezeh, Cristobal, Jorge, Juan Antonio, Patricia, Pam, Pat, Carlos, Kelly R., Janette, Mohamed, Luis, and Frank. I would like to thank Luciano for his help and support through the development of this research work and also because his one of my best friends. Thanks to my family: Eva Luz, Juan Pablo, and America for their love and because they are always with me, even in a goods and hardest moments. Also, I would like to thank Dr. Velez for encourage me and her words to end and achieve my Ph.D. Thank to PROMEP (Programa para el Mejoramiento de la Planta Académica), and ITSON for the economical support during my Ph.D. program. Finally, thank very much to the rest members of my committee, the last one: Dr. Pepper and Dr. Reynolds; and the first one: Dr. K. Lansey, Dr. M. Conklin and Dr. R. Frye
5
DEDICATION
This work is dedicated with much love to my family: Eva Luz (my wife), Juan Pablo (my son), and America (my daughter). Also, this work is dedicated to my parents. Margarita
(my mother) and in the memory of Francisco (my father)
6
TABLE OF CONTENTS
ABSTRACT.................................................................................................................. 10
INTRODUCTION ........................................................................................................ 11
Problem Definition ....................................................................................................... 11
Literature Review ......................................................................................................... 12
Water scarcity, irrigation water and water quality.................................................... 12
Microbiological water quality and waterborne diseases........................................... 13
Water regulations in the United States and Latin America....................................... 16
Occurrence of waterborne pathogens in waters of Latin America ............................. 17
Microorganism survival and transport at environmental conditions .......................... 18
Wastewater reuse and its implications ....................................................................... 19
Emerging pathogens ................................................................................................. 20
Food safety ................................................................................................................ 22
Vegetables and food-borne ........................................................................................ 24
Some studies related to vegetables contaminated..................................................... 28
Dissertation Format....................................................................................................... 32
PRESENT STUDY....................................................................................................... 33
REFERENCES ............................................................................................................. 35
APPENDIX A:
MICROBIOLOGICAL WATER QUALITY IN A LARGE IRRIGATION SYSTEM:
EL VALLE DEL YAQUI, SONORA MÉXICO.......................................................... 43
Abstract ......................................................................................................................... 44
7
TABLE OF CONTENTS, continued
Keywords ...................................................................................................................... 45
Introduction................................................................................................................... 45
Methods ........................................................................................................................ 46
Sampling ................................................................................................................... 47
Chemical and microbial analysis ............................................................................... 48
Data Analysis ............................................................................................................ 49
Results........................................................................................................................... 49
Discussion..................................................................................................................... 51
Conclusions................................................................................................................... 53
Acknowledgments ........................................................................................................ 53
References..................................................................................................................... 54
APPENDIX B:
ASSESSMENT OF AERATED LAGOONS FOR PRODUCTION OF IRRIGATION
WATER ........................................................................................................................ 65
Abstract ......................................................................................................................... 66
Key words ..................................................................................................................... 66
Introduction................................................................................................................... 67
Methods ........................................................................................................................ 69
Chemical water quality.............................................................................................. 69
Irrigation plots........................................................................................................... 69
Soil Samples.............................................................................................................. 70
8
TABLE OF CONTENTS, continued
Vegetable Samples .................................................................................................... 71
Results and Discussion ................................................................................................. 73
Chemical water quality ............................................................................................. 73
Treated wastewater reuse.......................................................................................... 74
Conclusions................................................................................................................... 75
Acknowledgments ........................................................................................................ 75
References..................................................................................................................... 76
APPENDIX C:
THE IMPACT OF IRRIGATION WATER QUALITY ON MICROBIAL
CONTAMINATION OF PRODUCE........................................................................... 84
Abstract ......................................................................................................................... 85
Key Words .................................................................................................................... 85
Introduction................................................................................................................... 86
Methods ........................................................................................................................ 87
Location of Study ...................................................................................................... 87
Irrigation and Plot Design......................................................................................... 88
Irrigation Water Analysis.......................................................................................... 88
Soil Analysis ............................................................................................................. 90
Vegetable Analysis ................................................................................................... 91
Results........................................................................................................................... 93
Water quality............................................................................................................. 93
9
TABLE OF CONTENTS, continued
Soil quality ................................................................................................................ 94
Vegetable quality ...................................................................................................... 95
Discussion..................................................................................................................... 97
Conclusions................................................................................................................... 99
Acknowledgments ...................................................................................................... 100
References................................................................................................................... 101
10
ABSTRACT
In México, wastewater recycling is an important alternative source of water,
particularly in arid regions like the state of Sonora, México. In El Valle del Yaqui,
Sonora, México, where 500 million m3 per year of wastewater is available for recycling
in agriculture activities . The main objective of the three studies presented in this
dissertation was to assess the microbial water quality of surface water, untreated
wastewater, and treated wastewater for produce irrigation, as well as the impact of
microbial water quality on vegetable contamination. The results suggest that the three
sources of water meet Mexican and international guidelines for use in production of food
crops.
Despite wide differences in the concentration of bacterial indicators (Escherichia
coli, Clostridium perfringens) and enteric pathogens (Cryptosporidium, Giardia, and
enteroviruses) in the various types of water studied there was little impact on
contamination of the produce studied (carrots, lettuce, tomatoes, and peppers) at harvest.
Apparently, the time between the last irrigation event and harvesting was sufficient to
allow for die-off of enteric organisms that may have contaminated the produce.
11
INTRODUCTION
Problem Definition
El Valle del Yaqui has been a point of interest for many people either to invest, to
work, or to live, particularly due to its agricultural development. El Valle del Yaqui is an
integration of five counties --Bacum, Guaymas, Navojoa, Etchojoa, and Cajeme-- with a
population around 700,000. El Valle del Yaqui is widely known as one of the most
modern regions in Mexico in terms its irrigation system. El Valle del Yaqui (27oN,
100oW) is in the state of Sonora in north-western Mexico. The coastal plain, which is
approximately 60 Km wide, is between the Gulf of California (west) and the foothills of
the Sierra Madre Occidental (east), some of which can reach heights of 1,500 m. The
major part, approximately 225, 000 ha, of El Valle del Yaqui is occupied by an irrigation
district fed by the Alvaro Obregón Dam, which has a capacity of 3,000 x106 m3.
The irrigation water requirement for all agriculture (225,000 ha) is around 2.5
million cubic meter per year. However, during the last ten years severe problems were
experienced in finding enough irrigation water due to the drought conditions. Reuse of
treated wastewater could aid in meeting the demand for agriculture.
In México, wastewater recycling is an important alternative source of water,
particularly in arid regions like the state of Sonora. In El Valle del Yaqui, Sonora,
México, where 500 million m3 of wastewater per year are discharged including
agricultural, industrial, and municipal. Recycling treated wastewater could be an
excellent alternative to meet water demand for agriculture requirements. Since 1997, two
wastewater treatment plants have been operating in Cd. Obregón, Sonora, which is the
12
main city in el Valle del Yaqui. The treatment capacity of these plants is around 1,500
liters per second (47.3 millions of m3 per year).
Although, a number of studies have been carried out to evaluate water quality,
treatment and reuse of irrigation wastewater and sewage (Gortáres, 1992; Gortáres, 1993;
Gortáres, 1997), investigations have been focused on the detection of indicators and not
pathogens. The purpose of this study was to better assess the quality of existing irrigation
water and compare it to reclaimed wastewater. The potential of pathogens in the
wastewater to contaminate crops was also assessed.
Literature Review
Water scarcity, irrigation water and water quality
Population growth has resulted in increased water demand and greater
contamination of water from the disposal of waters in many parts of the world, including
Mexico . In many areas the use of water is limited by its quality rather than by the
quantity available (Maidment, 1993). According to Brooks et al. (1997) water quality
involves a long list of individual components and chemical constituents. These authors
claim that a water quality standard refers to the physical, chemical, or biological
characteristics or properties of water in relation to a specified use related to physical,
chemical and biological properties of waters. Changes in water quality due to watershed
use can make water unusable for drinking but can be acceptable for fisheries, irrigation,
or other uses. The pollution of water is a term generally used when the water quality is
degraded or defiled in some way by human activities. However, water quality
13
degradation also results from natural events, such a large rainstorms, fires, or volcanic
eruptions (Brooks et al., 1997). This degradation either can be caused by point pollution
or non-point pollution. Point pollution is a regulatory term meaning a source that
discharges through a pipe at a known location, such as from industries and municipalities.
While non-point pollution refer to pollution that occurs over a wide area and usually is
associated with land use activities such as agricultural cultivation, grazing of livestock,
and forest management practices (Brooks, et al., 1997; Maidment, 1993; Metcalf and
Eddy, 1994).
Water quality is important not only because of its linkage to the suitability of
water for various uses and its impact on public health, but also because water quality has
an intrinsic value. The quality of life is often judged on the availability of pristine waters.
The availability of good and clear water is also a public health issue. Many human
diseases, especially those causing cholera, diarrhea, and others are serious problems in
the world, including United States where disease outbreaks have occurred (Maidment,
1993).
Microbiological water quality and waterborne diseases.
A waterborne disease is an illness caused by the ingestion of water contaminated
by human or animal feces or urine containing pathogenic microorganisms. The
elimination of these microorganisms has been realized by filtration and disinfection of the
water supplies. These approaches have been practiced since the nineteenth century
resulting in a dramatic decrease in the incidence of waterborne disease such as typhoid
14
fever and cholera. Until the late 1960s, it was thought that threats from waterborne
disease had been controled in developing countries by proper water treatment. However,
some waterborne diseases related to viruses and protozoa were detected, suggesting that
these agents are more resistant to disinfection than enteric bacteria (Percival et al., 2000)
Waterborne diseases are among the three major causes of illnesses and death in
the world, such as cholera, hepatitis, giardiasis, and others. In developing countries, like
many Latin American and Caribbean countries, acute diarrheas, not including typhoid
fever, hepatitis and others, are among the ten major causes of illnesses resulting in
thousands of deaths every year. Furthermore, a study carried out by the World Health
Organization (WHO) established that in 1988 there was an average of 4.6 events of
diarrhea per year in each child under five years in American countries (Cañez and del
Puerto, 1992). It was also estimated that, in 1996, every eight seconds a child died from a
water-related disease and each year more than 5 million people died from illness linked to
unsafe drinking water or inadequate sanitation (Percival et al., 2000). This increase in the
number of cases of waterborne diseases during the last 30 years has been due to the
apparition of both new and old agents, which are refereed to as emerging and re-
emerging pathogens, respectively (Forrest and Gushulak, 1997; Miller et al. 1998)
The main disease-causing microorganisms in drinking water, water used in
preparing food, or food that has been in contact with contaminated water include:
bacteria, viruses, and parasites. Although these microorganisms can cause an amply
variety of diseases, those diseases of special concern in developing countries are acute
diarrhea, cholera, typhoid fever, and infectious hepatitis (Cañez and del Puerto, 1992;
15
Bitton, 1994). Sobsey et al. (1993) affirm that many waterborne outbreaks of
gastroenteritis are documented ever year. However, no etiology has been found for
approximately half of them, but it is suspected that many are of human viral origin. Many
human viruses may infect the gastrointestinal tract and can be excreted into the
environment. Once in the environment, these enteric viruses may reach water supplies,
recreational waters, crops, and shellfish, through sewage, land runoff, solid waste,
landfills, and septic tanks. The enteric viruses in the environment create a public health
risk because they are transmitted via the fecal-oral route through contaminated water and
low numbers are able to initiate infection in humans. Diseases caused by enteric viruses
range from trivial to sever, or even fatal (Rose, 1986)
The enteric viruses include: rotaviruses, Norwalk and Norwalk-like viruses,
adenoviruses, reoviruses, hepatitis A virus, and enteroviruses. The enteroviruses are the
enteric viruses most commonly detected in polluted water. The enteroviruses such as
polioviruses, coxsackie A and B viruses, and echoviruses can cause a variety of illness
ranging from gastroenteritis to myocarditis and aseptic meningitis (Abbazadegan et al.,
1999). Abbazadegan et al. (1999) affirm that numerous studies have documented the
presence of enteroviruses in raw and treated drinking water, wastewater, and sludge.
16
Rose (1986) states that the concern in regards to viruses is due five reasons: (1)
scarce information concerning the occurrence and significance of viruses such as the
Norwalk viruses because methods are not available to grow and study them; (2) currently
available methods may recover less than 50 % of the viruses present; (3) studies suggest
that enteric viruses can survive longer than bacteria in the environment and are not as
efficiently removed by conventional treatment processes; (4) because of the low
infectious dose, if even one virus particle is ingested by a susceptible individual, it could
cause disease; and (5) the present bacterial indicator system used to evaluate fecal
pollution is not always reflective of the presence of these viruses. Although some of these
factors have been addressed in the United States, in México all of these are currently
important.
Water regulations in the United States and Latin America
Since 1974 there have been national regulations for drinking water in the United
States (U.S.). The Environmental Protection Agency is the federal authority in charge to
develop and enforce environmental regulations in the U.S. In 1893, the Interstate
Quarantine Act was developed to establish drinking water in the U.S. This Act resulted in
the creation of the first water-related regulation in 1912. This regulation prohibited the use
the common drinking cup on interstate carriers. But later it was understood that even when
the cup was considered clean, the quality of the water to be pour into was more important.
This gave rise to the first bacterial standard in 1914 and was the framework use by federal,
17
state, and municipal water facilities from 1914 to 1975 ensuring the safety of water for
community water systems (Pepper et al., 1996).
In recent years, the finding of enteric viruses and protozoan parasites in water gave
rise to the Information Collection Rule that requires monitoring of these microorganisms in
drinking water supplies from surface sources serving 100,000 people or more for a limited
time to asses the adequacy of treatment in the U.S. On the other hand, water regulation in
Latin American countries is in the early stages. Regulations requires just the detection of
coliforms to assess the quality of the water use by the population (AWWA, 1999). Viruses
and parasite testing is not required due to the higher cost of testing and the current lack of
appropriate laboratories and trained personal, the latter may not be in effect for too long
due to the increase effort of the Latin American countries regulatory agency to train
personnel in these techniques.
Occurrence of waterborne pathogens in waters of Latin America
According to World Health Organization (WHO), “Infectious diseases caused by
pathogenic bacteria, viruses or by parasites are the most common and widespread health
risk associated with drinking-water”. These organisms are transmitted through human
and animal excreta. Fecal contamination can occur if there are cases or carriers in the
community, then increasing the chances of finding the excreted organisms in the water.
Use of contaminated water for drinking, food preparation, contact during washing or
bathing, and even inhaling water aerosols may result in infection (WHO, 1999). WHO
recommend that water that is going to be used for drinking and household purposes do
not contain water-borne pathogens. In addition, the most used indicator for water
18
microbiological quality, Escherichia coli, must not to be present in 100-ml samples of
any water intended for human consumption. However, scientists have found the presence
of E. coli in pristine places, particularly in tropic areas.
In Latin America, most of the water regulations for drinking water are based on
the use of fecal coliform as an indicator of water quality. However, coliform-free water is
not an indication that the water is completely safe to drink. Pathogens such as rotavirus,
enterotoxigenic Escherichia coli (ETEC), Shigella, Campylobacter jejuni and
Cryptosporidium parvum are important etiological agents of diarrheal disease in Latin
America. The main reason that most of the studies on water quality are done for bacterial
testing is because of the cost of performing test for viruses and parasites are more
expensive. But the increase use of novel techniques such as Polymerase Chain Reaction
(PCR) should help to look for pathogens other than bacteria (Naranjo et al., 1990).
Microorganism survival and transport at environmental conditions
The survival of pathogenic organisms in wastewater, soil, and crops depends on
many factors such as (Rowe and Abdel-Magids, 1995): 1) Indoor/outdoor environment,
2) Soil moisture content, 3) Methods of wastewater disposal, 4) Crop type, 5) Distance of
crop parts from soil surface, 6) Seasons and temperature, 7) Wastewater and soil pH, 8)
Time pathogen remained in wastewater before it use on soil and crops 9) Treatment level
of wastewater, 10) Methods of soil cultivation or soil disturbance, 11) Depth of soil, 12)
Sunlight, 13) Organic matter in soil, and 14) Antagonistic soil microorganisms.
19
According to Yates and Yates (1991) there are two major factors controlling
microbial fate in the subsurface: survival and movement. In general, both survival and
movement are controlled by the specific type of microorganism, the physical and
chemical properties of the soil, and the climate of the environment. The survival
characteristic of microorganisms is usually studied as a net decay rate. Decay or
inactivation is the irreversible destruction of contaminants (microorganisms in this case)
by chemical, physical, or biological process.
Wastewater reuse and its implications
In n many arid environments an alternative source of water is required to meet the
growing demands of the community, agriculture, and industry, thus wastewater has
become a viable option (Rose, 1986). The utilization of wastewater in arid regions in the
world has been a common practice, especially in countries such as Australia, Israel,
México, Saudi Arabia, South Africa, and the United Arab Units. Also, countries with
semiarid and humid regions are involved in wastewater reclamation and reuse. The most
numerous wastewater reuse projects in the United States are in Arizona, California,
Colorado, Florida, Georgia, Kansas, South Carolina, and Texas (Rowe and Abdel-Magid,
1995). Although the use of wastewater for agricultural irrigation has been practiced for
centuries, recently a conservative approach in fully utilizing this source of water has been
taken. The uncertainty of the health risks to an exposed population through wastewater
irrigation practices because of the possible presence of enteric pathogenic organism is
one of the major disadvantages of wastewater reuse (Rose, 1986). Pathogenic bacteria,
parasites, and viruses are all found in sewage and may survive treatment processes.
20
Furthermore in the environment, many are able to exist for prolonged periods of time and
outbreaks associated with wastewater irrigation have been documented.
Sadowski et al. (1978a) and Rose (1986) have demonstrated that crops directly
irrigated with wastewater become contaminated with enteric microorganisms. Although
enteric viruses do not grow on contaminated vegetables, they can survive long enough to
cause disease in humans. Studies developed by Tierney et al. (1977) and Ward and Irving
(1987), in which enteric viruses have added to sewage effluent used for crop irrigation
have shown that viruses can remain viable from 3 to 5 weeks. Furthermore, Badawy et
al. (1985) affirm that enteroviruses and rotaviruses can survive 1-4 months on vegetables
during commercial and household storage.
Emerging pathogens
Morse (1995) defines emerging infectious diseases as infections that have newly
appeared in a population or have existed but are rapidly increasing in incidence or
geographic range. The author claims that factors precipitating diseases emergence
include ecological changes, human demographic behavior, international travel and
commerce, technology and industry, microbial adaptation and changes, and breakdown in
public measures as well as deficiencies in public health infrastructure. Correspondingly,
Forrest and Gushulak (1997) establish that emerging pathogens have been defined as
clinically distinct infectious diseases whose incidence in humans has increased. Most of
the emerging pathogens are not actually “new” pathogen-causing diseases, but may be
“reemerging”. Many of these simply have not been identified before, while others have
21
existed but have been sequestered from a population such that they have not caused
significant widespread disease. In the same way, the Centers for Disease Control and
Prevention (CDC, 1994) defined emerging pathogen as an infectious agent whose
incidence in humans has increased dramatically within the last 20 years, or one that has
probability of increasing in the future.
According to Morse (1995) “most emerging infectious appear to be caused by
pathogens already present in the environment, brought out of obscurity or given a
selective advantage by changing conditions and afforded an opportunity to infect new
host populations”
Forrest and Gushulak (1995), mention that the major factors which can facilitate
the development of new diseases include environments, reservoir/vector components
(animal factors), microbial characteristics, and human. These authors suggest that the
human factors are the most important and can include agricultural and economic
development, changes in human demographic and behavior, international travel and
commerce, technology and industry changes, and breakdown or deficiencies in public
health systems.
Each change occurring in the food chain, even realized for encompassing human,
technological, environmental factors, creates a new selection pressure that drives
microbial adaptation and emergence potential (Miller et al., 1998).
Meng and Doyle (1997) affirm that many microorganisms previously
unrecognized as food-borne or harmful are emerging pathogens transmitted by food.
They mention that pathogens recognized as significant causes of human illness include
22
Escherichia coli, Listeria monocytogenes, Aerobacter butzleri, Helicobacter pylori,
Cryptosporidium parvum, and Cyclospora.
According to Miller et al. (1998) the food-borne pathogens that have emerged
within the past 20 to 25 years include: Campylobacter jejuni, Clostridium botulinum
(infant botulism), Escherichia coli O157:H7, Listeria monocytogenes, Salmonella
enteriditis, Vibrio cholerae (Latin America), Vibrio vulnificus, Yersinia enterocolitica,
Norwalk and Norwalk-like viruses, Rotavirus, Cryptosporidium parvum, Giardia
lamblia, Toxoplasma gondii, and bovine spongiform encephalopathy
Food safety
According to Nguyen and Carlin (1994) minimally processed fresh (MPF) fruit
and vegetables are fresh, raw fruits or vegetables processed in order to supply a ready-to-
eat or ready-to-use product. The main features of MPF fruit and vegetables include: 1)
the presence of cut surfaces or damaged plant tissues, 2) minimal processing that cannot
ensure sterility or microbial stability of the product, 3) active metabolism of the plant
tissue, and 4) confinement of the product. These features are adequate for microorganism
proliferation.
MPR fruits and vegetables are an important and rapidly developing class of foods
so it is essential to know if these foods can serve as vehicles for many different food-
borne pathogenic microorganisms. In most cases, these MPR foods are consumed without
cooking, making the presence of pathogens a concern. Pathogens can reach MPR food
from several sources including, but no limited, irrigation or wash water, infected
23
operator, fertilizers of animal waste and municipal biosolids, and operation facilities with
poor sanitation (Han et al., 2000).
There are two critical points related to the level of pathogens on vegetables when
they are growing in the field, the first one is how pathogens can reach vegetables and the
second one how pathogens can attach vegetable surfaces. The former one is related to
transport processes and different mechanisms can occur depending on if the vegetables
are root growth such as carrots or onions, surface growth such as leaf vegetables (lettuce
or cabbage), or aerial growth such as tomatoes or peppers. The last point, attachment, is
related to sorption mechanisms. No matter how pathogens reach vegetable surfaces, it is
possible to assume that sorption mechanisms are likely to be the same in the three
different types of growth vegetables mentioned above.
Food safety is one of the greatest health public concerns in the United States. In
the US each year food-borne illness affects 6 to 80 million persons, cause 9 000 deaths,
and cost an estimated five billion US dollars. Many of the food-borne diseases are caused
by emerging pathogens.
According to Majkowski (1997) the food-borne paradigm has shifted, in the past
an outbreak affected a small local population, had a high attack rate, and involved locally
prepared food products with limited distribution. However, now outbreaks involve large
populations and maybe multi-state and even international. In many cases, the pathogenic
organism has a low infective dose and sometimes is never isolated from the food product.
Delay in identifying the causative agent can allow the outbreak to spread, increasing the
number of cases. Tauxe (1997) mention that a series of outbreaks were investigated for
24
the Centers for Disease Control and Prevention (CDC) and linked with a variety of
pathogens found on fresh fruits and vegetables harvested in the USA and elsewhere. In
this study, various possible points of contamination were identified, including
contamination during production and harvest, initial processing and picking, distribution,
and final processing.
Shuval et al. (1986) claimed that the microbiological contamination of vegetables
is most important because of the survival time can be from several days until months.
This is particularly important when microorganisms are present on the most moist and
protected vegetables areas. Monge et al. (1996) mention that in some studies carried out
using untreated wastewater for irrigation, the sanitary quality of vegetables was reduced.
However, according to Castro and Flórez (1990) only 48 percent of E. coli present on
vegetables originated from irrigation water.
Vegetables and food-borne
Food-borne diseases are a persistent challenge and concern to health worldwide.
New and emerging pathogens appear, and new food vehicles continue to be implicated as
a result of the changing industrial ecology of food production and consumption (Tauxe et
al., 1997). The presence of numerous genera of spoilage bacteria, yeasts, molds, and
occasionally pathogens on fresh produce has been recognized for many years. Numerous
microorganism capable of causing human illness have been isolated and outbreaks of
human gastroenteritis have been linked to the consumption of contaminated vegetables
(Beuchat, 1996; Beuchat et al., 1998).
25
Consumption of fresh vegetables has greatly increased at the expense of processed
products. Consumers perceive fresh vegetables to be more nutritious than their processed
counterpart (Garg et al., 1990). Hotchkiss and Banco (1992) mention Americans
consumed 37% more fresh vegetables in 1988 than in 1971. In addition, they affirm that
annual per capita fresh fruit consumption increased by 10.3 Kg over the same period. In
the same way, Tauxe et al. (1997) affirmed that consumption of fresh fruits and
vegetables has increased in the United States in the past two decades. Furthermore the
geographic sources and distribution of fresh produce have expanded greatly
The Centers for Disease Control and Prevention (CDC) reports that the number of
food-borne disease outbreaks doubled between 1973 and 1987, and 1988 and 1991
(mentioned by Tauxe et al., 1997). During 1995, major outbreaks were associated with
Salmonella serotype Stanley on alfalfa sprouts, Salmonella Hartford in unpasteurized
orange juice, Shigella spp. on lettuce and onions, Escherichia coli O157:H7 on lettuce,
and hepatitis A virus on tomatoes (Tauxe et al., 1997).
Tauxe et al. (1997) mention that the distribution pattern for fresh produce in the
United States generally disperse production lots widely, and contamination of produce
frequently is intermittent and low level. These authors suggest that trace-back of produce
to its origins is particularly difficult due to the complex network of growers, packers,
shippers, re-packers, distributors, brokers, retailers, and consumers, which often involves
several states as well as countries.
Although consumer education about basic principles of food safety is an
important component of prevention, by itself it is insufficient. Food-borne diseases reach
26
the consumer through long chains of industrial production, in which many opportunities
for contamination exists. The general strategy of prevention is to understand the
mechanisms by which contamination and disease transmission can occur well enough to
interrupt them (Tauxe, 1997).
Jackson (1990) suggests that scientific advances in methodology and
epidemiology have resulted in a renewed awareness of food-borne disease, and increase
contact among nations of the world has stimulated rapid global distribution of food as
well as food-borne pathogens. In addition, this author affirms that new food vehicles are
being identified for old, familiar, and new pathogens (emergent). Some organisms of
recent interest such as Bacillus, Yersenia, Campylobacter, Listeria, Sporothrix, Giardia,
Cryptoporidium, and Anisakis are the foci of new investigations, as are the more familiar
food-borne pathogens which include Salmonella, Shigella, Clostridium, Staphylococcus,
Entamoeba and Ascaris.
Jackson (1990) affirms that if human illnesses are grouped by organ system,
gastrointestinal infections rank second in incidence, respiratory disease are first,
circulatory disease third, and skeletomuscular injuries fourth. In the U.S. this means, on
the average, one digestive tract episode per person per year; death from gastrointestinal
infections range from 35,000 to 40,000 annually. With the portion of gastrointestinal
infections attributed, conservatively, to food as the vehicle being one third of the total,
the cost of food-borne illness is about $40 billion for acute cases.
Disease outbreaks caused by consumption of contaminated fruits and vegetables
occur less frequently than those caused by consumption of contaminated meat and

27
poultry. However, food-borne illness outbreaks have been reported from vegetables and
fruits contaminated with pathogenic microorganisms (Albrecht et al., 1995).
Beuchat et al. (1998) suggest that an increased per capita consumption of fresh
and lightly processed produce in the United States and other countries, coupled with an
increase in importation of produce from regions where standards for growing and
handling produce may be compromised, has resulted in heightened interest in outbreaks
of human gastroenteritis that may be attributed to consumption of contaminated fresh
produce, particularly salad vegetables.
The contamination of fresh produce can be not only due to water quality
insufficiency and scarceness sanitary conditions during growing of vegetables but also to
several factors, which are described by Beuchat (1996), who mentions the mechanisms
by which fresh produce can become contaminated with pathogenic microorganisms and
serve as vehicles of human disease. The main factors, grouped in two categories,
involved in these mechanisms pre-harvest and post-harvest factors. Pre harvest factor
include: animal and human feces, soil, irrigation water, green or inadequate composted
manure, air (dust), wild and domestic animals, and human handling. Post harvest factors
include: animal and human feces, human handling (workers and consumers), harvesting
equipment (field to packing shed), wild and domestic animal, air (dust), wash and rinse
water, packing processes (sorting, cutting, packing, and other further processing
equipment), ice, transport vehicles, improper storage (temperature and physical
environment), improper packing, cross-contamination, improper display temperature, and
improper handling after wholesale or retail purchase.

28
Brackett (1992) mention that some pathogenic organisms of concern in minimally
processed produce include: Listeria monocytogenes, Clostridium botulinum, Shigella sp.,
Salmonella sp., parasites and viruses. Therefore, every step from production through
consumption will influence the microbiology of fresh produce. For a better understanding
of the production/processing/distribution of fresh produce system, this author, grouped it
into the following four broad areas: 1) production, 2) processing, 3) storage, and 4)
marketing.
Some studies related to vegetables contaminated
Several years ago, Maxcy (1978), evaluated the magnitude of contamination and
the nature of representative microbial contaminants on fresh lettuce. Also specific
microbes of public health interest were added to test portions to determine their fate
during storage of lettuce as salad at room temperature. The microbial plate counts, on
fresh lettuce commonly were over 105 CFU/g and the diversity of the microflora
indicated favorable microenvironments for many types of bacteria. Inoculated Salmonella
typhimurium, Escherichia coli, and Staphylococcus aueres fared well on lettuce salad and
were able to grow at room temperature.
Food preparation for consumption outside the home is a rapidly growing segment
of the food industry at the United States of America and in many countries. The common
way for vegetable production has inherent opportunities for contamination from such
sources as manure for fertilizer, contaminated irrigation water, wild animals, and personal
contact in the harvesting process (Maxcy, 1978). However, Dunlop and Wang (1961)
found few pathogens on lettuce irrigated with sewage.
29
Several studies (Ercolani, 1976; Fowler and Foster, 1976; Gould, 1973; Hall et
al., 1967)) have demonstrated that lettuce as prepared for salads by traditional methods
and evaluated immediately may carry a total microbial load of millions per gram.
According to Priepke et al. (1976) and Maxcy (1978) some of these microorganisms may
grow during storage. They argue that more rapid growth would be expected at warmer
conditions than room temperature.
Rosas et al. (1984) reported a study in Xochimilco county, part of Mexico City,
related to the microbiological quality of vegetables irrigated with wastewater.
Xochimilco is one of the most fertile agricultural areas in the Valley of Mexico and
where a large portion of fresh vegetables are produced for the consumption of Mexico
City. The crops included in this study were radish, spinach, lettuce, parsley, and celery.
The highest bacterial counts were found in leafy vegetables such as spinach with 8,700
MPN/100 g for total coliforms and 2,400 MPN/100 g for fecal coliforms and lettuce with
37,000 MPN/100 g for total coliforms and 3,600 MPN/100 g for fecal coliforms. The
total coliforms values found in irrigation water ranged from 4X10⁴ to 29 X104 CFU/100
ml and for fecal coliforms the values ranged from 5X10² to 30X102 CFU/100 ml.
Monge and Chinchilla (1996) carried out a study in Costa Rica of eight different
vegetables. Cryptosporidium spp oocysts were found in 5.0% (4 samples) of cilantro
leaves, 8.7% (7 samples) of cilantro roots and 2.5% (2 samples) of lettuce sampled. They
reported that for cilantro roots and lettuce a positive linear correlation (P < 0.05) was
established between the presence of Cryptosporidium spp oocysts and fecal coliforms and
E. coli.
30
Odumeru et al. (1997) studied the microbiological quality of ready-to-use
vegetables including chopped lettuce, salad mix, cauliflower florets, sliced celery,
coleslaw mix, broccoli florets, and sliced green peppers before and after processing. All
vegetables, with the exception of green peppers, showed up to 1-log decrease in aerobic
colony counts after processing. They reported that microbial population increased to
processing levels after four days of storage at both 4 and 10oC. Green peppers had the
highest bacterial counts while cauliflower and chopped lettuce had the lowest counts at
both storage temperatures. Listeria monocytogenes was detected in 13 of 120 (10.8%) of
vegetables samples stored at 10 oC but not in 175 samples stored at 4 oC after 7 days. E.
coli was detected in 2 of 120 (1.7%) processed vegetable samples after 7 days of storage
at 10oC and one of 65 (1.5%) unprocessed vegetables. E. coli not was detected in
vegetables samples stored at 4 oC.
In addition, the above mentioned authors affirmed that E. coli levels on
unprocessed and processed green peppers was not significantly different. Similar results
were reported for chopped lettuce (9.0 MPN/g). Listeria monocytogenes was detected in
one of 65 (1.5%) unprocessed samples (celery). L. monocytogenes was not detected on
unprocessed iceberg lettuce, cauliflower, green and red cabbage, carrots, broccoli, and
green peppers. Pathogenic bacteria including Salmonella spp., Campylobacter spp.,
Yersinia enterocolitica (serotype O:3) and verocytotoxigenic E. coli (VTEC, including
O157:H7) were not detected in any vegetables tested.
Ortega et al. (1997) carried out a study in Peru. Samples of vegetables including
cabbage, celery, cilantro, green onion, ground green chili, leeks, lettuce, parsley, yerba
31
Buena, basil, and huacatay were collected at several small markets. They reported that of
the total of vegetables examined, 14.5% contained C. parvum oocysts and only 1.5 had
Cyclospora oocysts. They also detected Cryptosporidium parvum and Cyclospora
cayetanensis oocysts using scanning electron microscopy on the surface of vegetables
after washing with distilled water.
Seo and Frank (1999), based on their study about lettuce leaves inoculated with E.
coli O157:H7, found E coli attached to the surface, trichomes, stomata, and cut edges. In
addition, they demonstrated that these bacteria were entrapped 20 to 200 µm below the
surface in stomata and cut edges. Furthermore, these authors claim that many live E. coli
were found in stomata and cut edges after of chlorine treatment (20 mg/l for 5 minutes).
Also, they found that E. coli did not preferentially adhere to biofilm produced by
Pseudomonas fluorescens on the leaf surface. Romberger et al. (1993 establish that leaf
surfaces are usually considered to be hydrophobic due to the presence of a waxy cuticle.
Hirotani et al. (2002) demonstrated the presence of indicator microorganisms of
fecal pollution on surfaces of vegetables obtained in retail local market in the U.S.A. and
Mexico. They found at least one of the indicators, among coliphages, fecal streptococci,
total coliforms, and fecal coliforms, on the vegetables tested which included: tomato,
lettuce, cabbage, leek, bell pepper, long pepper, carrots, radish, celery, spinach, Chinese
cabbage, and parsley
Odumeru et al. (1997) suggested a zero tolerance for Salmonella spp., VTEC,
Campylobacter spp., and pathogenic Y. enterocolitica for ready-toe-use vegetables. For
L. monocytogenes they mentioned a limit of ≤ 100 CFU/g.
32
Dissertation Format
This dissertation consists of three manuscripts prepared for publication and
presented as appendices. The three manuscripts are the results of investigations carried
out in El Valle del Yaqui Sonora, México. Appendix A is a study of the microbiological
water quality of a large irrigation system. This manuscript has been submitted to Journal
of Food Protection. Appendix B is an assessment of aerated lagoons for production of
irrigation water. Finally, Appendix C is related to the impact of irrigation water quality
on microbial contamination of produce.
The dissertation author was responsible for all the research presented in the
manuscripts, with the following exceptions: Appendix B: Chemical water quality
parameters were done by the laboratory staff of the treatment wastewater plant facility.
Appendix B and C: Vegetables were planted with the help of the experimental field staff.
33
PRESENT STUDY
The methods, results, and conclusions of this study are presented in the
manuscripts appended to this dissertation. The following is a summary of the most
important findings in this document.
The manuscript “Microbiological Water Quality in a Large Irrigation Systems: El
Valle del Yaqui, Sonora Mexico” is determined the microbial water quality of a large
system and how quality varies with respect to canal system (upper and lower), canal size,
impact to near-by communities and the travel distance of irrigation water. Ninety percent
of the samples contained fecal coliforms levels lower than those recommended by WHO
(Gerba and Rose, 2003) and were within Mexican Guidelines (Secretaria del Medio
Ambiente, Recursos Naturales y Pesca, 1997). No significant difference was found in the
water quality due to canal system, canal size (main vs. lateral), and the vicinity of
sampling sites to communities or towns. However, there was a significant difference with
travel distance from the origin of the water. This variation was more significant for E.
coli (p < 0.011) and total coliforms (p< 0.022).
The manuscript in Appendix B, “Assessment of Aerated Lagoons for Production
of Irrigation Water” is a study whose primary objective was to determine if aerated
lagoon used to treat municipal water, in Ciudad Obregón, could meet the World Health
Organization and Mexican Guidelines for reclaimed wastewater to be used for food crop
irrigation. In addition, the impact of microbiological quality on vegetables (carrots,
lettuce, and tomatoes) was assessed. Data for treated wastewater appear to indicate that
the treated wastewater effluent can be used in agricultural to irrigate restricted crops. The
34
concentrations of all organisms studied were higher in RWW than in TWW, however, no
significant difference was observed on the microbiological quality of vegetables
regardless of the type of irrigation water used.
The manuscript “The Impact of Irrigation Water Quality on Microbial
Contamination of Produce” is presented in Appendix C. The main objective of this study
was to assess the potential for contamination of vegetables during irrigation with
untreated wastewater and surface water. Untreated municipal wastewater from a small
town (El Tobarito) in El Valle del Yaqui, Sonora, México and surface irrigation water
from storage dam were used to irrigate three different vegetables (carrots, lettuce, and
green peppers). All of the studied microorganisms (total coliforms, Escherichia coli,
Clostridium perfringens, Cryptosporidium oocysts, Giardia cysts, coliphages, and
enteroviruses) were present in untreated wastewater, but only total coliforms, E coli, and
Clostridium perfringens were present in the surface irrigation water. Total coliforms, E.
coli, and C. perfringens were detected on all vegetables regardless of irrigation source
water. A greater concentration of total coliforms, E. coli, and C. perfringens was found
on carrots followed by lettuce and green peppers. E. coli levels were 10 to 100 times
greater on produce irrigated with untreated water than those irrigated with surface water.
35
REFERENCES
Abbaszadegan M., Stewart P., and Lechevallier M. 1999. A strategy to detection of viruses in groundwater by PCR. Appl. Environ. Microb., 65:444-449. Albrecht J. A., Hamouz F. L., Sumner S. S., Melch V. 1995. Microbial evaluation of vegetable ingredients in salads bars. J. Food Protect., 55:683-685. Altekruse S. F., Cohen M.L., and Swerdlow D. L.1997. Emerging foodborne diseases. Emerg. Infect. Dis., 3:285-293. American Public Health Association, American Water Works Association, and Water Environment Federation. (APHA).1998. Standard Methods for the Examination of Water and Wastewater. Washington, D. C., American Public Health Association. .American Water Works Asossiation (AWWA). 1999.Waterborne pathogens. AWWA M48 (First edition) AWWA Manual of Water Supply Practices. 310 pp. Ayers, R. S. and Westcot, D. W. 1989. Water for agriculture. FAO Irrigation and Drainage paper. Food and Agriculture Organization of the United Nations, 29 Rev. 1. Roem, Italy. Badawy, A. S., Gerba, C. P. and Kelly, L. M. 1985. Survival of rotavirus SA-11 on vegetables. Food Microbiol., 2:199-205. Badawy A. S., Rose J. B., and Gerba C.P.1990. Comparative survival of enteric viruses and coliphages on sewage irrigated grass. J. Environ. Sci. Heal. A., 25:937-952. Beuchat L. R. 1996. Pathogenic microorganisms associated with fresh produce. J. Food Protect., 59:204-216. Beuchat L. R., Nail B. V., Adler B. B., and Clavero M. R. S. 1998. Efficacy of spray application of chlorinated water in killing pathogenic bacteria on raw apples, tomatoes, and lettuce. J. Food Protect., 61:1305-1311. Bisson W. J., and Cabelli V. J. 1979. Membrane-filter enumeration method for Clostridium perfringens. Appl. Environ. Microb., 37:55-66. Bitton G. 1994. Wastewater Microbiology (Second edition). Wiley Sons, New York, US. Blumenthal, U. J., Mara, D. D., Peasey, A., Ruiz-Palacios, G. and Stott, R. 2000 B. World Health Organ., 78:1104-16.
36
Brackett R. E. 1992. Shelf stability and safety of fresh produce as influenced by sanitation and disinfection. J. Food Protect., 55:808-814. Brenner, A., Shandalov, S., Messalem, R., Yakirevich, A., Oron, G. and Rebhun, M. 2000. Wastewater reclamation for agricultural reuse in Israel: trends and experimental results. Water Air Soil Poll., 123:167-182. Brooks K. N., Folliot P.F., Gregersen H. M., and DeBano L. F. 1997. Hydrology and the Management of Watershed (Second edition). Iowa State University Press/Ames. Cañez P. R. C. y del Puerto Q. C. 1992. El agua y su influencia en la salud, p 7-70. En Agua y salud. Serie Salud Ambiental No 3. Instituto Nacional de Higiene Epidemiología y Microbilogía de Cuba. Castro M. and Flórez L. A. 1990. Evaluación de riesgos para la salud por el uso de aguas residuales en agricultura: Aspectos microbiológicos. Centro Panamericano de Ingeniería Sanitaria (CEPIS), Lima Peru. 32 pp. Ceballos, B. S., Soares N. E., Moraes M. R., Catao R. M. and Konig A. 2003. Microbiological aspects of an urban river used for unrestricted irrigation in the semi-arid region of north-east Brazil. Water Sci. Technol., 47:51-57. Centers for Control Disease Control and Prevention (CDC). 1994. Addressing emerging infectious disease threats: A prevention strategy for the United Status. Centers for Disease Control. U. S. Dept. Health and Human Services, Public Health Service. Atlanta, GA, USA. Dunlop S. G. and Wang W.L. 1961. Studies on the use of sewage effluent for irrigation of truck crops. J. Milk Food Technol., 24:44-47. Ercolani G. L. 1976. Bacteriological quality assessment of fresh marketed lettuce and fennel. Appl. Environ. Microbl., 31:847-852. Forrest D.M. and Gushulak B.1997. Emerging pathogens: Threat and opportunity. Perspect. Biol. Med. 40:19-125. Fowler J. L. and Foster J. F. 1976. A microbiological survey of three green salads – can guidelines be recommended for these salads? J. Milk Food Technol. 39:111-113. Francis G. A., Thomas C., and O'Beirne D. 1999. The microbiological safety of minimally processed vegetables. Int. J. Food Sci. Technol, 34:1-22. Garg N., Churey J. J., and Splittstoesser D.F.1990. Effect of processing conditions on the microflora of fresh-cut vegetables. J. Food Protect., 53:701-703.
37
Geldreich, E. E., and Bordner R. H. 1971. Fecal contamination of fruits and vegetables during cultivation and processing for market. A review. J. Milk Food Technol., 34:184-195. Gerba, C. P. and Rose, J. B. 2003. International guidelines for water recycling: microbiological considerations. Water Sci. Technol.: Watrer Supply, 3:311-316. Gould W. A.1973. Micro-contamination of horticultural products. Hort. Sci., 8:116-119. Gortáres M. P. 1992. Problemática ambiental por aguas residuales urbanas agrícolas e industriales en el Valle del Yaqui. VIII Congreso Nacional de Ingenieria Sanitaria y Ambiental. Gortáres M. P. 1993. Evaluación de la calidad del agua residual agricola desde su origen hasta su descarga en la zona costera. Reporte de investigación, IMTA-CNA, México. Gortáres, M. P., and Castro E. L . 1993. Aspectos biotecnológicos en la auto purificatión de aguas residuales agrícolas, urbanas e industriales. Biotecnología, 3:AM115-AM118. Gortáres M. P. 1997. Impacto ambiental del reuso de aguas residuales agrícolas del Valle del yaqui en actividades agropecuarias. Reporte de investigación, SIMAC, México. Gortáres M. P. 1998. Reuso de las aguas residuales tratadas de Cd. Obregón, Sonora. Proyecto de Investigación, SIMAC, México. Hall H. E., Brown D. F:, and Lewis K H. 1967. Examination of market foods for coliform organism. Appl. Microbiol., 15:1062-1069. Han Y., Sherman D. M., Linton R. H., . Nielsen S. S. and Nelson P. E. 2000. The effects of washing and chlorine dioxide gas on survival and attachment of EC O157:H7 to green pepper surfaces. Food Microbiol., 17: 521-533. Hirotani H., Naranjo J, Moroyoqui G. P., Gerba C. P.. 2002. Demonstration of indicator microorganisms on surface of vegetables on market in the United States and Mexico. J. Food Sci., 67:1847-1850. Hotchkiss J H. and Banco M. J. 1992. Influence of new packing technologies on the growth of microorganisms in produce. J. Food Protect., 55: 815-820. Jackson G. J. 1990. Public health and research perspectives on the microbial contamination of foods. J. Anim. Sci., 68:884-891.

38
Jimenez B., Chávez A., and Hernández C, 1999. Alternative treatment for wastewater destinated for agriculture use. Wat. Sci. Techl., 40:355-362. Jimenez B., and Chavez-Mejia A. 1997. Treatment of Mexico City wastewater for irrigation purposes. Environ. Technol., 18:721-730. Karim, M.R., Manishadi, F. D., Karpiscak, M. M., and Gerba, C. P. 2004. The persistence and removal of enteric pathogens in constructed wetlands. Water Res., 38:1831-1837. Maidment R. D. 1993. 1993. Handbook of Hydrology. Mc-Graw Hill, Inc.
Majkowski J. 1997. Strategies for rapid response to emerging foodborne microbial hazards. Emerg. Infect. Dis., 3:551-554. Martinez-Acuña M.A. 2002. Determinación de huevos de helmino en el efluente de la planta de tratamiento de agua residual "zona sur" de Cd. Obregón, Sonora, durante el período primavera-verano 2000. Dirección de Investigación y Estudios de Posgrado. Ciudad Obregón, Sonora, México, Instituto Tecnológico de Sonora: 128 pp. Maxcy R. B. 1978. Lettuce as a carrier of microorganisms of public health significance. J. Food Protect., 41:435-438. Meng J. and Doyle M. P. 1997. Emerging issues in microbiological food safety. Annu. Rev. Nutr., 17:255-275. Metcalf and Eddy, Inc. 1994. Wastewater Engineering: Treatment, Disposal, and Reuse (Third edition). Irwin Mc-Graw-Hill. Miller M. A. and Paig J. C. 1998. Other food borne infections. Vet. Clin. N. Am.-Food A., 14:71-89. Miller A. J., Smith J. L., Buchanan R. L. 1998. Factors affecting the emergence of new pathogens and research strategies leading to their control. J. Food Safety, 18:243-263. Monge R., and M.L. Arias. 1996. Presence of various pathogenic microorganisms in fresh vegetables in Costa Rica. Arch. Latinoam. Nutri., 46:292-294. Monge R. and Chinchilla M. 1996. Presence of Cryptosporidium Oocysts in fresh vegetables. J. Food Protect. ,59:202-203. Monge R., Chinchilla M., and Reyes L. 1996. Seasonality of parasites and intestinal bacteria in vegetables that are consumed raw in Costa Rica. Rev. Biol. Trop., 44:369-375.
39
Monroy, O. G., Fama M., Meraz, Montoya L., and Macario H. 2000. Anaerobic digestion for wastewater treatment in México: State of the technology. Water. Res., 34:803-1816. Morse S. S. 1995. Factors in the emergence of infectious diseases. Emerg. Infect. Dis., 1:7-15.
Naranjo, J.E., Toranzos, G.A., Rose, J.B., and Gerba C. P. 1990. Occurrence of Enteric Viruses and Protozoan Parasites in water in Panama, Proceeding of Second Bienial Water Symposium Microbiological Aspects. Nguyen-The C. and Carlin F. 1994. The microbiology of minimally processed fresh fruits and vegetables. Crit. Rev. Food Sci., 34:371-401. Noy J. , and Feinmesser A 1977. Chapter 3. The use of wastewater for agricultural irrigation, 73-92. In Water renovation and reuse (H. I. Shuval editor). New York, Academic Press. Odumeru J. A., MitchellS. J., Alves D. M., Lynch J. A, Yee A. J., Wang S. L., Styliadis S., and Farber J. M. 1997. Assessment of the microbiological quality of ready-to-use vegetables for health-care food services. J. Food Protect., 60:954-960. Okafo, C. N., Umon V. J. and Galadima M.. 2003. Occurrence of pathogens on vegetables harvested from soils irrigated with contaminated streams. Sci. Total Environ., 11:49-56. Ortega Y. R., Roxas C. R., Gilman R. H., Miller N. J., Cabrera L., Taquiri C, and Sterling C. R. 1997. Isolation of Cryptosporidium parvum and Cyclospora cayetanensis from vgetables collected in markets of an endemic region in Peru. Am J. Trop. Med. Hyg., 57:683-686. Pepper, I. L., Gerba C. P:, Brendecke J. W. 1995. Environmental Microbiology: A Laboratory manual. Academic Press, San Diego, CA.
Pepper, I.L., Gerba, C.P., and Brusseau M. L. 1996. M.L. Environmental and Pollution Science, Academic Pres. Percival S. L., Walker J. T., and Hunter P. R. 2000. Chapter 3: Waterborne diseases. p 29-40 In Microbiological Aspects of Biofilms and Drinking Water (Percival S. L, . Walker J. T., and Hunter P. R, editors). CRC Press, Boca Raton, Fl. USA.

40
Pianetti A., Sabatini L., Bruscolini F., Chiaverini F., and Cecchetti G. 2004. Fecal contamination indicators, Salmonella, vibrio and aeromonas in water used for the irrigation of agricultural products. Epidemiol. Infect., 132:231-238. Priepke P. E., Wei L. S, and Nelson A. I. 1976. Refrigerated storage of prepackaged salad vegetables. J. Food Sci., 41:379-382. Romberger J. A., Hejnowicz Z., and Hill J. F. 1993. Plant structure: function and development. Spring-Verlag, Berlin. Rosas I., Baez A., and Coutiño M. 1984. Bacteriological quality of crops irrigated with wastewater in the Xochimilco plots, Mexico City, Mexico. Appl. Environ. Microb., 47:1074-1079. Rose J. B. 1986. Microbial aspects of wastewater reuse for irrigation. Crit. Rev. Env. Contr., 16:231-256.
Rowe D. R. and Abdel-Magid I M. 1995. Handbook of waste water reclamation and
reuse, pp 1-13. Boca Raton, CRC Lewis Publishers. Sadovski A.Y., Fattal B., and Katzenelson E. 1974. Evaluation of methods for a quantitative estimation of microbial contamination of sewage irrigated vegetables. Fifth Scientific Conference of the Israel Ecological Society, Tel Aviv, Israel. Sadovski A. Y., Fattal B., and Goldberg D. 1978a. Microbial contamination of vegetables irrigated with sewage effluent by the drip method. J. Food Protect., 41:336-340. Sadovski A.Y., Fattal B, Goldberg D., Katzenelson E., and Shuval H I. 1978b. High levels of microbial contamination of vegetables irrigated with wastewater by the drip method. Appl. Environ. Microb., 36:824-30. Scott, J.A. 1994. Chapter 7: Viruses. In Methods of soil analysis: Microbiological and biochemical properties (Mickelson S. H. and Bigham J.M editors). Madison, Wisconsin, Soil Science Society of America, Inc. Part2:117-118.
Secretaría de Comercio y Fomento Industrial (SECOFI). 1999. Norma mexicana NMX-AA-113-SCFI-1999 análisis de agua - Determinación de Huevos de Helminto - Método de prueba. Diario Oficial de la Federación, August 5, 1999. Mexico City. Secretaría del Medio Ambiente Recursos Naturales y Pesca, SEMARNAP. 1997. NOM-001-ECOL-1996 - Que establece los límites máximos permisibles de contaminantes en las descargas de aguas residuales en agua y bienes nacionales. Diario Oficial de la Federación, January 6, 1997. Mexico City.
41
Secretaría del Medio Ambiente Recursos Naturales y Pesca, SEMARNAP. 1998. NOM-003-ECOL-1996 - Que establece los límites máximos permisibles de contaminantes para las aguas residuales tratadas que se reusen en servicio al público. Diario Oficial de la Federación, September 21, 1997. Mexico City. Seo K. H. and Frank J. F. 1999. Attachment of Escherichia coli O157:H7 to lettuce leaf surface and bacterial viability in response to chlorine treatment as demonstrated by using conofocal scanning laser microscopy. J. Food Protect., 62:3-9. Shuval H., Yekutiel P. and Fattal B. 1986. An epidemiological model of the potential health risk associated with various pathogens in wastewater irrigation. Wat. Sci. Technol., 18:191-198 Shuval H., Lampert Y., and Fattal B. 1997. Development of a risk assessment approach for evaluating wastewater reuse standards for agriculture. Water Sci. Technol., 35:15-20. Shuval H.I., Wax Y, Yekutiel P., and Fattal B. 1989. Transmission of enteric disease associated with wastewater irrigation: a prospective epidemiological study. Am J. Public Health, 79:850-852. Sobsey M. D., Duffor C. P., Gerba C. P., LeChevallier M. W., and Payment P. 1993. Using a conceptual framework for assessing risks to health from microbes in drinking water. J. Am. Water Works Assoc., 85:44-48. Sokal, R. and Rohlf, F. 1995. Biometry. 3rd edition. W. H. Freeman, NY. Stine, S. W., Song I., Choi C. Y. and Gerba C. P.. 2005. Application of microbial risk assessment to the development of standards for enteric pathogens in water used to irrigate fresh produce. J. Food Protect., 68:913-918. Tauxe R., Kruse H., Hedberg C., Potter M., Madde J., and . Wachsmuth K. 1997. Microbial hazards and emerging issues associated wit produce: A preliminary report to the national advisory committee on microbiological criteria foods. J. Food Protect., 60: 1400-1408. Tauxe. R. V. 1997. Emerging foodborne diseases: An evolving public health challenge. Emerg. Infect. Dis., 3 4:425-434. Thurston-Enriquez, J. A.. Watt P. , Dowd S. E., Enriquez R., Pepper I. L: and Gerba C. P. 2002. Detection of protozoan parasites and microsporidia in irrigation waters used for crop production. J. Food Protect., 65:378-382.
42
Tierney J. T., Sullivan R., and Larkin E. P. 1977. Persistence of poliovirus 1 in soil and on vegetables grown in soil previously flooded with inoculated sewage sludge or effluent. Appl. Environ. Microb., 33:109-113. Turco R. F. 1994. Chapter 9: Coliform bacteria. In Methods of Soil Analysis: Microbiological and Biochemical Properties (Mickelson S. H. and Bigham J.M editors). Madison, Wisconsin, Soil Science Society of America, Inc. Part2:145-158.
USEPA .1996. ICR protozoan method for detecting Giardia cysts and Cryptopsporidium oocysts in water by a fluorescent antibody procedure: In ICR Microbial Laboratory Manual. Report EPA/600/R-95/1/18U. S. Environmental Protection Agency, Washington, D. C., pp. VII-1 - VII-44. Ward B. K. and Irving L. G.. 1987. Virus survival on vegetables spray-irrigated with wastewater. Water Res., 21:57-63. Wollum A. G. 1994. Soil sampling for microbiological analysis. In Methods of Soil Analysis: Microbiological and Biochemical properties (Mickelson s. H. and Bigham J. M.). Madison, Wisconsin, Soil Science Society of America, Inc. Part 2:2-13. World Health Organization (WHO). 1989. Health Guidelines for the use of Wastewater in Agriculture and Aquaculture. Geneva, World Health Organization: 63 pp World Healt Organization (WHO). 1999. “Removing obstacle from Healthy Development”, Report on Infectious diseases. Yates, M. V. and Yates S.R. 1991. Chapter 3: Modeling microbial transport in the subsurface: a mathematical discussion. In Modeling the environmental fate of microorganisms (Hurst C. J. editor). American Society for MIcrobiology, Washington, US. Zuberer D.A. (1994). Chapter 8: Recovery and enumeration of viable bacteria. In Methods of Soil Analysis: Microbiological and Biochemical Properties (Mickelson S. H and Bigham J M.). Madison, Wisconsin, Soil Science Society of America, Inc. Part 2:119-144.
43
APPENDIX A:
MICROBIOLOGICAL WATER QUALITY IN A LARGE IRRIGATION
SYSTEM: EL VALLE DEL YAQUI, SONORA MÉXICO
Pablo Gortáres-Moroyoqui1,2*, Luciano Castro-Espinoza1, Jaime E. Naranjo2, Martin M.
Karpiscak3, Robert Freitas2, and Charles P. Gerba2
1Departamento de Ciencias del Agua y del Medio Ambiente, Dirección de Recursos
Naturales, Instituto Tecnológico de Sonora 5 de Febrero 818 Sur, 85,000 Cd. Obregón,
Sonora, México
2Department of Soil, Water, and Environmental Science, The University of Arizona,
Veterinary Science and Microbiology 409, Tucson, Arizona, 85721 USA
3Office of Arid Lands Studies, The University of Arizona, 955 E. 6th Street, Tucson,
Arizona, 85719 USA
44
Abstract
The primary objective in this study was to determine the microbial water quality
of a large irrigation system and how quality varies with respect to canal size, impact of
near-by communities and the travel distance from the source in the El Valle del Yaqui,
Sonora, Mexico. In this arid region, 220,000 hectares are irrigated with eighty percent of
irrigation water being supplied from an extensive water supply system including three
dams on the Yaqui River watershed. The stored water flows to the irrigated fields through
two main canal systems (severing the upper and lower Yaqui valley) and then through
smaller lateral canals that deliver the water to the fields. A total of 146 irrigation water
samples were collected from 52 sample sites during three sampling events. Not all sites
could be accessed on each occasion. All of the samples contained coliform bacteria
ranging from 1,140 to 68,670 MPN/100 ml with an arithmetic mean of 11,416 MPN/100
ml. Ninety-eight percent of the samples contained less than 1,000 MPN/100 ml
Escherichia coli, with an arithmetic mean of 291 MPN/100 ml. Coliphage were detected
in less than 30% of the samples with an arithmetic average equal to 141 PFU/100 ml. No
significant difference was found in water quality between to the two major canal systems
(upper and lower), canal-size (main vs. lateral), and the proximiy of sampling sites to
human habitation (presence of various villages and towns along the length of the canals).
There was a significant decrease in coliforms (p<0.011) and E. coli (<0.022)
concentrations as travel distances increase from the City of Obregon.

45
Keywords
Irrigation water, Escherichia coli, viruses, coliphage, enteric viruses, Cryptosporidium,
Giardia
Introduction
Irrigated land comprises around 15% of the arable world’s land and produces 36%
of the overall food supply (Ayers and Wescot, 1989). Irrigation water may be
contaminated by agricultural runoff from storm events, waterfowl, and sewage. The
microbial water quality of irrigation water is important when used to grow vegetables that
are eaten fresh or minimally processed. The growing demand for fresh produce has been
satisfied by an increase in importation of fresh produce from countries where hygiene
standards may be compromised. Enteric protozoan pathogens have been detected in
irrigation waters which can contaminate produce during irrigation (Stine et al., 2005;
Thurston-Enriquez et al., 2002). Few studies have looked at the microbial quality of
irrigation systems. In existing studies the irrigation water was obtained from rivers or
other sources which had sewage discharges (Brenner et al., 2000; Ceballos et al., 2003;
Okafo et al., 2003; Pianetti et al., 2004).
This study focused on the occurrence of microbial indicators and enteric
pathogens, and the potential impacts of human habitation, canal type, and water travel
distance in a developing country. The source of water was a reservoir, and the canal
system had no known sewage discharges into the system.
46
Methods
The study was conducted in El Valle del Yaqui (27o N, 100o W), which is located
in the state of Sonora in the northwestern region of Mexico. The coastal plain, which is
approximately 60 km wide, is between the Gulf of California (west) and the foothills of
the Sierra Madre Occidental (east). Approximately 220,000 ha of El Valle del Yaqui is
supplied with irrigation water by the Alvaro Obregon (Oviachic— a Yaqui name) dam,
which has a capacity of 3,000 x 106 m3. This dam is part of the Yaqui River watershed.
The irrigation system in El Valle del Yaqui is one of the largest and most modern
agricultural areas in Mexico and comprises a canal network of 2,774 km (Gortáres and
Castro, 1993). It is divided into the upper zone (UZ) and lower zone (LZ). Each zone has
one main canal (upper main canal and lower main canal). The main (15 m in width)
canals branch into smaller primary canals, and then into smaller secondary (one meter in
width) canals running perpendicular to the primary canals. The secondary canals further
branch into tertiary canals (less than one meter in width) which eventually deliver water
to the irrigated fields. The upper main canal has a length of 120 km, a flow rate 110 m3/s,
and serves an irrigated area of 100,000 ha. The lower main canal has a length of 100 km,
a flow rate of 120 m3/s, and is used to irrigate 120,000 ha. Both main canals have earthen
banks approximately one meter above the surrounding farmland. The combined length of
all the primary and secondary canals is 2,554 km. Approximately 2,500 million cubic
meters of water pass through this system every year.

47
Sampling
Fifty-two sampling sites were selected at random locations using a map of the
system to represent different distances from the reservoir sources. The sample sites were
both in the upper and lower irrigation zones. Samples were collected from the main,
primary, and secondary canals (Fig. 1). Selected sites close to Ciudad Obregón were
considered as close to the dam source (1 to 20 km) while sampling locations between 50
and 60 Km from Ciudad Obregon) were considered as distant. There are several small
towns in the El Valle del Yaqui in the irrigated areas. Sample locations were also
categorized as close to towns or distant (greater than 2 km). The number and distribution
of sampling locations is shown in Table 1. Sampling was conducted three times during
the irrigation season (February, March, and November 2000). It required three
consecutive days to collect all of the samples. Water samples were always collected in
the morning using sterile one-liter polycarbonate bottles. All samples were placed in a
cooler with ice (approximately 4 oC), transported back to the laboratory, and analyzed
within 6 hours of collection.
Water samples for the protozoan parasites and enteroviruses were collected
according to the ICR Microbial Laboratory Manual (USEPA, 1996). Positively charged
1MDS filter cartridges (CUNO Inc., Meriden, CT) were used to process 400 liter virus
samples and Filterite polypropylene cartridges (Filterite Corporation, Timorium, MD)
were used to process 100 liter parasite samples.
48
Chemical and microbial analysis
Water samples were analyzed for temperature (T), pH, dissolved oxygen (DO),
turbidity (TUR), total coliforms (TC), fecal coliforms (FC), and coliphages (CPH). In
addition, five sample locations were chosen to test for enteroviruses (EV),
Cryptosporidium oocysts (CRY), and Giardia cysts (G) during the November sampling.
These locations were chosen based on the higher levels of total coliforms and E. coli
found during the February and March sampling.
The Colilert Quanti-tray system was used for coliform and E. coli quantification
(IDEXX Laboratories Inc., Westbrook, ME).
The double-layer agar was used to detect coliphages using E. coli, strain ATCC
15597 (American Type Culture Collection, Rockville, MD) (Pepper et al., 1995) . Four
replicates of five and one milliliter aliquots of water were assayed for each sample. The
strain of E. coli used detects both somatic and male specific coliphages.
Cryptosporidium oocysts and Giardia cysts were detected using an indirect
fluorescent antibody procedure (USEPA, 1996). The Ensys Hydrofluor-Combo kit
(Strategic Diagnostics, Inc., Newark DE) was used for staining.
Samples for enteroviruses were processed according to protocols 9510C and
9510D from the Standard Methods for the Examination of Water and Wastewater
(APHA, 1998). Samples were assayed on the BGM cell line as described in protocol
9510G using cytopathic effects (CPE). The cell cultures were observed for CPE for 14
days. If no CPE was observed they were passed a second time onto fresh monolayers.
49
Virus concentration was calculated by the Most Probable Number Method (MPN), also
from APHA (1998).
Temperature, pH, and dissolved oxygen were measured in the field according to
procedures described in Standard Methods for the Examination of Water and Wastewater
(APHA, 1998). Turbidity was measured using a turbidimeter (Hach Chemical Co.,
Loveland, CO).
Data Analysis
Total coliforms, E. coli, and coliphage results were analyzed to determine the
microbiological quality variation as a function of factors including, water travel distance,
type of canal (main, primary, and secondary ), irrigation zone (upper or lower) as well as
whether they were within 2 km of a town or village. Statistical analysis was done using
the analysis of variance (ANOVA) with the SYSTAT 9.0 program (Sokal and Rholf,
1995). The level of significance was defined as 95 percent (α = 0.05). Therefore, p values
less than 0.05 generated by ANOVA are considered to be statistically significant.
Results
Water temperature ranged between 14.5 and 26.0oC with a mean of 21oC; pH
ranged from 6.8 and 8.9 with a mean of 7.6. Dissolved oxygen levels were close to
saturation in most of the samples with a mean of 8.3 mg/l. Turbidity ranged between
<0.01 to 57.4 NTU with a mean of 9.3 NTU, and flow lineal velocity variation in the
canals was between 0.0 and 1.63 m/s with a mean of 0.43 m/s (Table 2).
50
Total coliforms ranged from 1,140 and 68,670 MPN/100 ml with a mean of
11,416 MPN/100 ml. E .coli ranged between 1 and 22,325 MPN/100 ml with a mean of
291 MPN/100 ml. Coliphage ranged from <5 and 8700 PFU/100 ml with a mean of 141
PFU/100 ml (Table 2). All the samples were greater than 1,000 MPN/100 ml for total
coliforms. While that 98 percent of the samples were less than 1,000 MPN/100 ml for E.
coli. Also for coliphages approximately 95 percent of the samples were less than 1000
PFU/100 ml (Figure 2).
Enteroviruses varied between 0.016 and 0.12 MPN/100 ml with a mean of 0.05
MPN/100 ml. Cryptosporidium ranged between < 0.8 and 5.8 oocysts/100 ml with a
mean of 1.8 oocysts/100 ml, and Giardia ranged from < 0.8 and 9.1 cysts/100 ml with a
mean of 3.5 cysts/100 ml (Table 2).
Table 3 show water quality results analyzed by canal system (upper or lower).
Physicochemical parameters and total coliforms values were similar in both canal
systems. Although fecal coliforms, Clostridium , coliphages, Crypstosporidium, Giardia,
and Enteroviruses levels were slightly lower in the upper system than the lower one
(Figure 3), they were not significantly different (p < 0.05). There was a tendency for
indicator organisms to increase in the smaller canals, but the differences were not
significant (Figure 4). The number of samples, however, that were collected in the
smallest (tertiary) canals was somewhat limited and may have impacted the results.
Based on statistical analysis there was a significant difference in the concentration
of indicators on travel distance of the water from the dam. This variation is more
significant for E. coli (p< 0.011) and total coliforms (p < 0.022). Ciudad Obregon is a
51
city with approximately 300,000 inhabitants and activity in this area (i.e. urban runoff)
could adversely impact the quality of the water in the canals. Concentrations of all
microbial indicators were greater for the sampling sites close to populated (towns and
villages) areas than those more distant (Figure 5). However, this difference was not
found to be significant (P <0.05).
All microbial indicators were in relatively greater concentrations at sites
considered close to the source (City of Obregón) than those at a greater distance from the
source (Figure 6). However, this difference was not found to be significant (P <0.05).
Discussion
Around ninety eight percent of the samples contained fecal coliform levels less
than that recommended by WHO (Gerba and Rose, 2003) and Mexican guidelines
(Secretaría del Medio Ambiente Recursos Naturales y Pesca, 1997) for irrigation water.
Irrigation systems are a complex set of canals designed to deliver water to fields for crop
production. No previous studies have been conducted on factors which may influence the
occurrence of indicators of microbial quality. In addition, few studies have been
conducted on the quality of irrigation waters in general. Existing studies deal with
sewage contaminated source water (Ceballos et al., 2003; Pianetti et al., 2004; Okafo et
al., 2003). Geldrich and Bordner (1971) conducted a study in the 1960’s of irrigation
canal waters in the western United States. At that time sewage was still being discharged
into irrigation waters, as noted by the authors. Based on their observations on the
occurrence of Salmonella they recommended that irrigation waters should contain not
52
more than 1,000 fecal coliforms/100 ml. Most other studies have dealt with standands for
the use of reclaimed sewage effluents for irrigation (Gerba and Rose, 2003).
Although not statistically significant, it was observed in this study what tended to
decrease with decreasing canal size. There was significant increase in water quality (i.e.
lower concentrations of E. coli and coliforms) the greater the travel distance from the
city of Obregón. This suggests that passage of the canals near the city may have resulted
in some microbial contamination. Die-off of the indicator bacteria and coliphage from
UV light and predation may have caused this observed decrease.
During this study, it was possible to collect only a small number of samples for
virus and protozoan parasites. The data from these samples demonstrated that some
contamination by enteric viruses and protozoan parasites had taken place. Additional
studies would be necessary to assess the significance of these results. However, the
results do demonstrate that the E. coli and coliphage detected in the irrigation canals are
reflective of the presence of waterborne enteric pathogens.
There are no generally accepted standards for irrigation waters used for produce
production, except when reclaimed water is used as the source. Reclaimed water
standards are also linked to required advanced treatment of the wastewater (Gerba and
Rose, 2003). Suggested fecal coliform standards for crop irrigation range from <1 to
1,000 per 100 mL (Gerba and Rose, 2003). Currently there are no suggested standards
for E. coli, which is a member of the fecal coliform group.
53
Conclusions
There was not a significant variation in the water quality with respect to canal-
zone, canal type, stream location, and proximity to populated areas. However, results
suggest that microbial indicator levels slightly increase as the water flowed through
smaller canals. In addition, the denser the human habitation resulted in greater average
concentration of indicator organisms.
There was a significant variation in the water quality with respect to the water
travel distance. However, this variation was not easily defined because some times
microbial levels decrease and suddenly increase and again decrease in all the water travel
distance. This behavior could have been due to non point source of microbial
contaminants discharging to irrigation canals.
Acknowledgments
Authors would like to express their appreciation to Eunice Guzmán, from Instituto
Tecnológico de Sonora in Ciudad Obregón, Sonora México, for their assistance during
the laboratory analysis. This project was funded in part by The Special Research Grants
Program Food Safety Research of the United States Department of Agriculture.
54
References American Public Health Association, American Water Works Association and Water Environment Federation. 1998. Standard methods for the examination of water and wastewater. American Public Health Association, Washington, D. C. Ayers, R. S. and Westcot D. W. 1989. Water for agriculture. FAO Irrigation and Drainage paper. Food and Agriculture Organization of the United Nations, 29 Rev. 1. Rome, Italy. Brenner, A., Shandalov S., Messalem R., Yakirevich A., Oron G. and Rebhun M. 2000 Wastewater reclamation for agricultural reuse in israel: trends and experimental results. J Water Air Soil Poll., 123:167-182. Ceballos, B. S., Soares N. E., Moraes M. R, Catao R. M. and Konig A. 2003. Microbiological aspects of an urban river used for unrestricted irrigation in the semi-arid region of north-east Brazil. Water Sci. Technol., 47:51-57. Geldreich, E. E., and Bordner R. H. 1971. Fecal contamination of fruits and vegetables during cultivation and processing for market. A review. J. Milk Food Technol., 34:184-195. Gerba, C. P. and Rose, J. B. 2003. International guidelines for water recycling: microbiological considerations. Water Sci. Technol. Water Supply, 3:311-316. Gortáres, P. and Castro, L. 1993. Aspectos biotecnológicos en la autopurificación de aguas residuales agrícolas, urbanas e industriales. Biotecnología, 3:Am115-Am118.
Pepper, I. L., Gerba C. P:, Brendecke J. W. 1995. Environmental Microbiology: A Laboratory manual. Academic Press, San Diego, CA.
Okafo, C. N., Umon V. J. and Galadima M. 2003. Occurrence of pathogens on vegetables harvested from soils irrigated with contaminated streams. Sci. Total Environ., 11:49-56. Pianetti A., Sabatini L., Bruscolini F., Chiaverini F., and Cecchetti G. 2004. Fecal contamination indicators, Salmonella, vibrio and aeromonas in water used for the irrigation of agricultural products. Epidemiol. Infect., 132:231-238. Secretaría del Medio Ambiente Recursos Naturales y Pesca, SEMARNAP. 1997. NOM-001-ECOL-1996 - Que establece los límites máximos permisibles de contaminantes en las descargas de aguas residuales en agua y bienes nacionales. Diario Oficial de la Federación, January 6, 1997. Mexico City.
55
Sokal, R. and Rohlf, F. 1995. Biometry. 3rd edition. W. H. Freeman, New York. Stine, S. W., Song I., Choi C. Y. and Gerba C. P.. 2005. Application of microbial risk assessment to the development of standards for enteric pathogens in water used to irrigate fresh produce. J. Food Protect., 68:913-918. Thurston-Enriquez, J. A. Watt P. , Dowd S. E., Enriquez R., Pepper I. L. and Gerba C. P. 2002. Detection of protozoan parasites and microsporidia in irrigation waters used for crop production. J. Food Protect., 65:378-382.
United State Environmental Protection Agency (USEPA).1996. ICR protozoan method for detecting Giardia cysts and Cryptopsporidium oocysts in water by a fluorescent antibody procedure: In ICR Microbial Laboratory Manual. Report EPA/600/R-95/1/18U. S. Environmental Protection Agency, Washington, D. C., pp. VII-1 - VII-44.
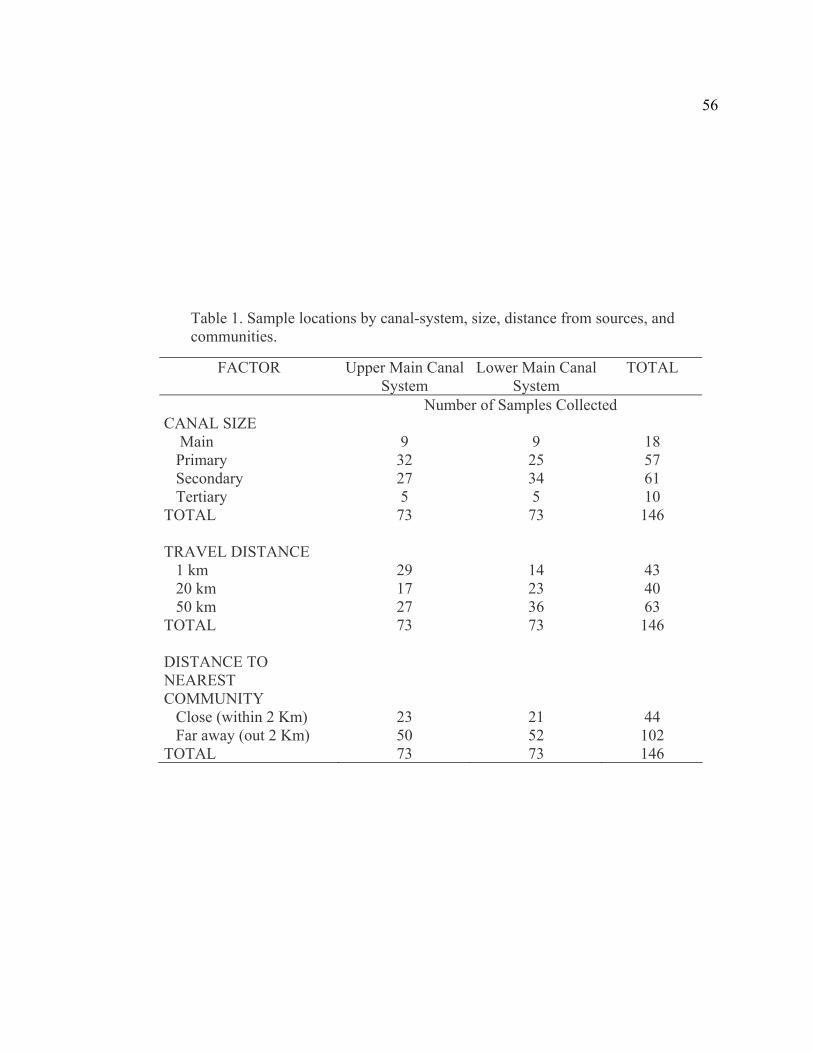
56
Table 1. Sample locations by canal-system, size, distance from sources, and communities.
FACTOR Upper Main Canal System
Lower Main Canal System
TOTAL
Number of Samples Collected CANAL SIZE Main Primary Secondary Tertiary TOTAL
9 32 27 5 73
9 25 34 5 73
18 57 61 10 146
TRAVEL DISTANCE 1 km 20 km 50 km TOTAL
29 17 27 73
14 23 36 73
43 40 63 146
DISTANCE TO NEAREST COMMUNITY Close (within 2 Km) Far away (out 2 Km) TOTAL
23 50 73
21 52 73
44 102 146
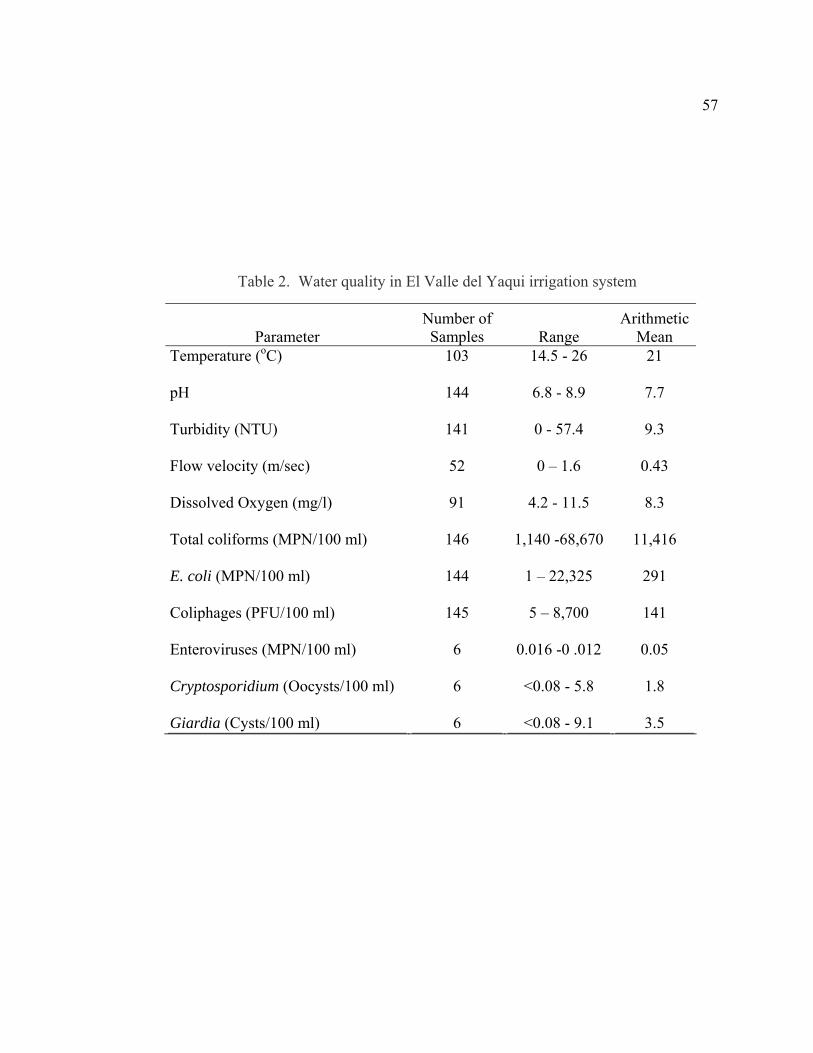
57
Table 2. Water quality in El Valle del Yaqui irrigation system
Parameter Number of Samples Range
Arithmetic Mean
Temperature (oC) pH Turbidity (NTU) Flow velocity (m/sec) Dissolved Oxygen (mg/l) Total coliforms (MPN/100 ml) E. coli (MPN/100 ml) Coliphages (PFU/100 ml) Enteroviruses (MPN/100 ml) Cryptosporidium (Oocysts/100 ml) Giardia (Cysts/100 ml)
103
144
141
52
91
146
144
145 6 6 6
14.5 - 26
6.8 - 8.9
0 - 57.4
0 – 1.6
4.2 - 11.5
1,140 -68,670
1 – 22,325
5 – 8,700
0.016 -0 .012
<0.08 - 5.8
<0.08 - 9.1
21
7.7
9.3
0.43
8.3
11,416
291
141
0.05
1.8
3.5

Table 3. Variation of water quality in El Valle del Yaqui irrigation system by main canal system (upper and lower).
Samples Range Mean Parameter
Upper lower Upper Lower Upper Lower
Temperature (oC)
pH
Turbidity (NTU)
Flow velocity (m/s)
Dissolved Oxygen (mg/l)
Total coliforms (MPN/100 ml)
E. coli (MPN/100 ml)
Coliphages (PFU/100 ml)
51
72
68
23
43
73
71
72
52
72
73
26
48
73
73
73
15.4 - 26
6.8 - 8.8
1 - 35.8
0.05 - 1.0
4.9 -11.5
1,779 – 68,670
1 – 1,300
5 – 95
14.5 - 25.5
6.8 - 8.9
0 - 57.4
0 - 2.3
4.2 - 11.4
1,140 – 54,750
1 – 22,325
5 – 8,700
20.8
7.8
8.1
0.4
8.4
11,860
70
9.3
21
7.5
10.5
0.4
8.1
10,970
506
271
58
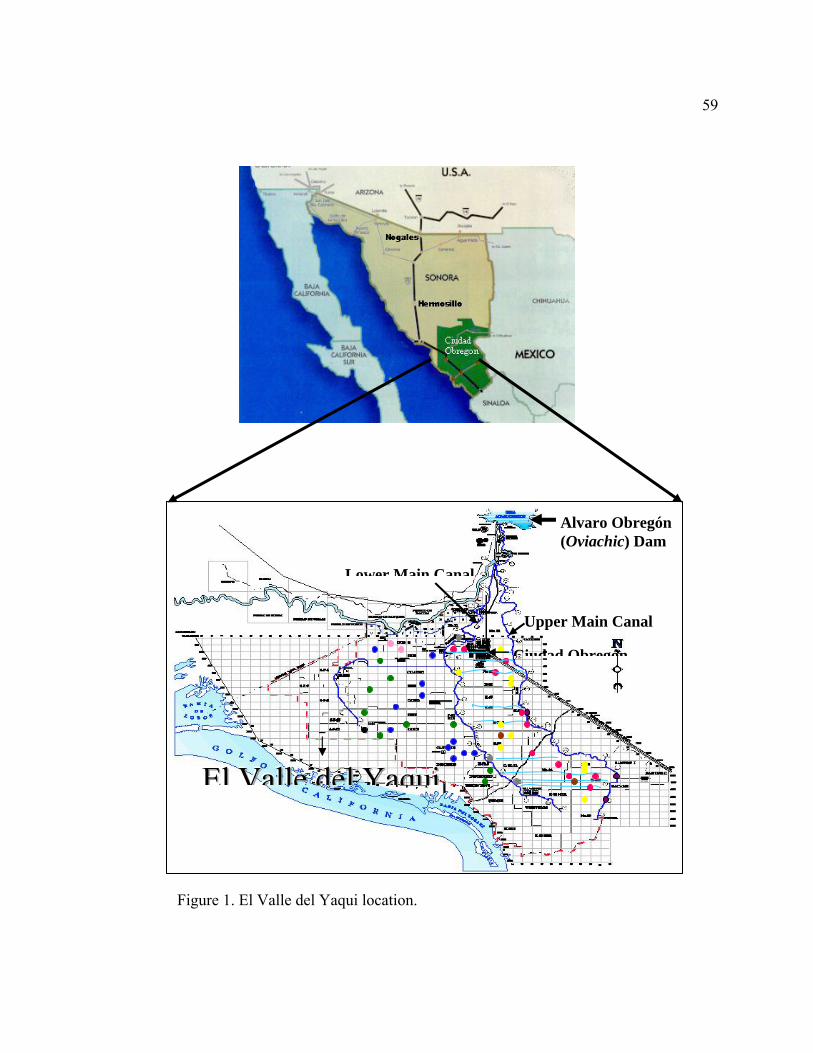
59
Upper Main Canal
Lower Main Canal
Alvaro Obregón (Oviachic) Dam
EEElll VVVaaalllllleee dddeeelll YYYaaaqqquuuiii
Ciudad Obregón
Figure 1. El Valle del Yaqui location.
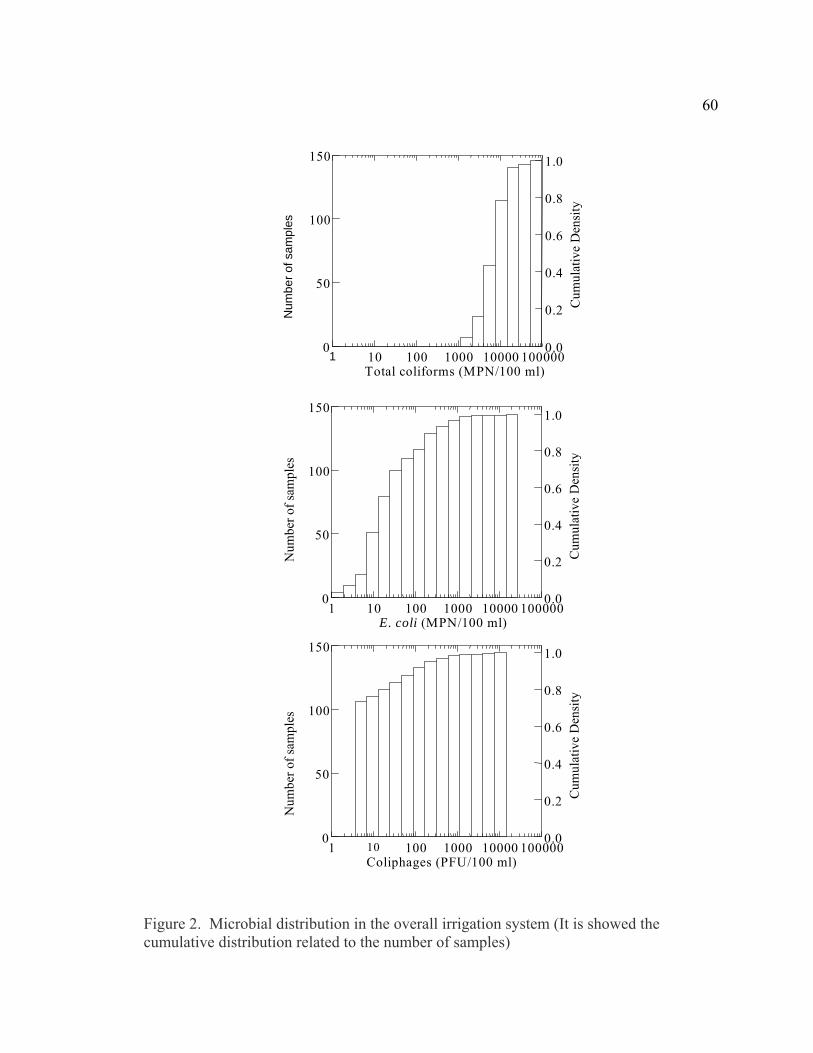
60
Figure 2. Microbial distribution in the overall irrigation system (It is showed the cumulative distribution related to the number of samples)
1 10 100 1000 10000 100000Total coliforms (MPN/100 ml)
0
50
100
150
Num
ber o
f sam
ples
0.0
0.2
0.4
0.6
0.8
1.0
Cum
ulat
ive
Den
sity
1 10 100 1000 10000 100000E. coli (MPN/100 ml)
0
50
100
150
Num
ber o
f sam
ples
0.0
0.2
0.4
0.6
0.8
1.0
Cum
ulat
ive
Den
sity
1 10 100 1000 10000 100000Coliphages (PFU/100 ml)
0
50
100
150
Num
ber o
f sam
ples
0.0
0.2
0.4
0.6
0.8
1.0
Cum
ulat
ive
Den
sity
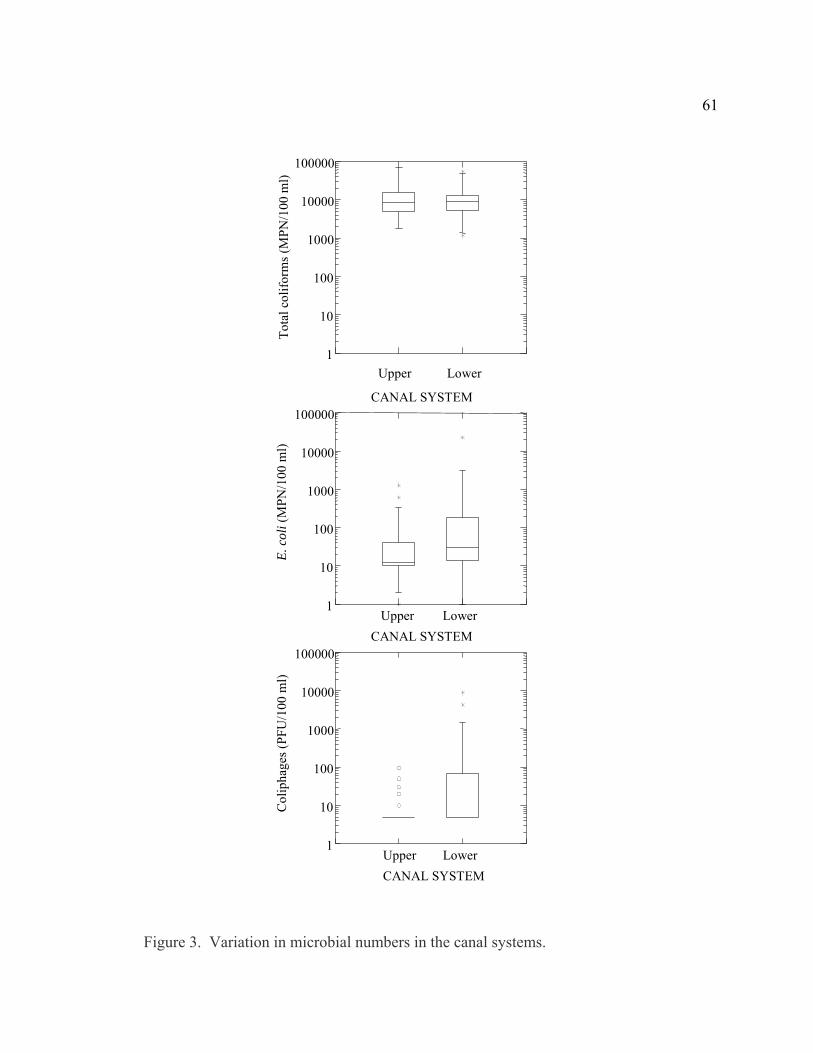
61
Figure 3. Variation in microbial numbers in the canal systems.
Upper Lower
CANAL SYSTEM
1
10
100
1000
10000
100000
Tota
l col
iform
s (M
PN/1
00 m
l)
Upper Lower CANAL SYSTEM
1
10
100
1000
10000
100000
E. c
oli (
MPN
/100
ml)
Upper Lower CANAL SYSTEM
1
10
100
1000
10000
100000
Col
ipha
ges (
PFU
/100
ml)
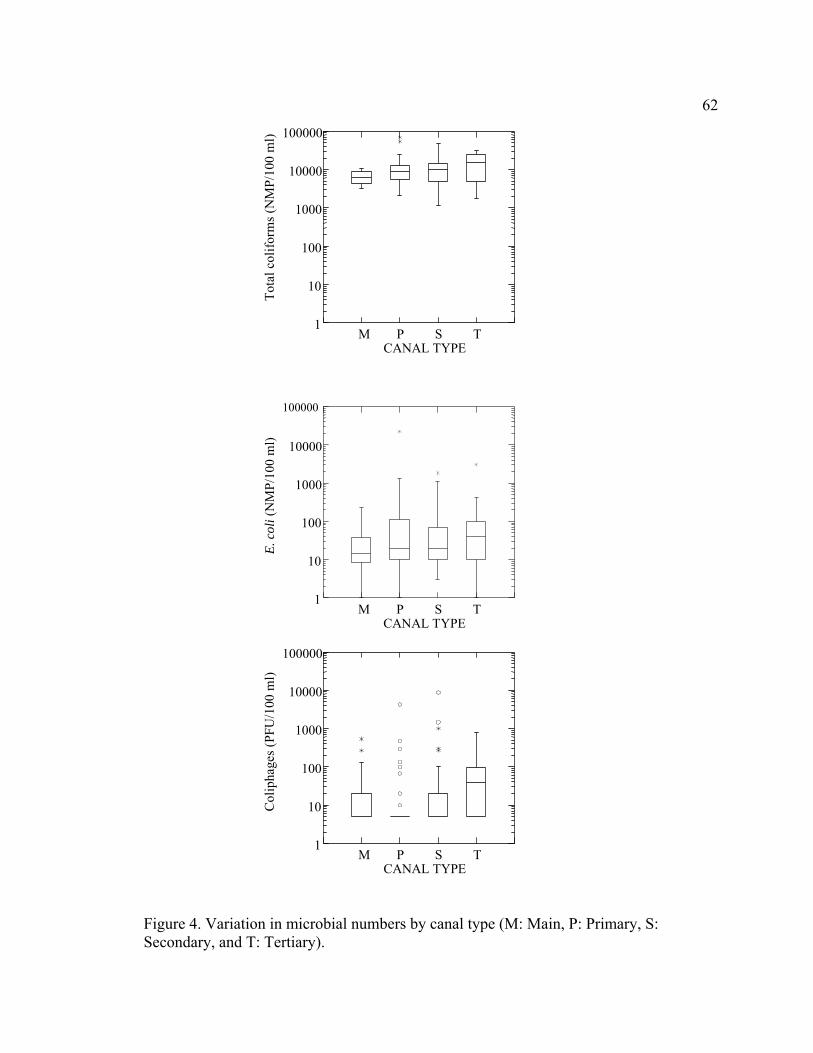
62
Figure 4. Variation in microbial numbers by canal type (M: Main, P: Primary, S: Secondary, and T: Tertiary).
M P S TCANAL TYPE
1
10
100
1000
10000
100000
Tota
l col
iform
s (N
MP/
100
ml)
M P S TCANAL TYPE
1
10
100
1000
10000
100000
E. c
oli (
NM
P/10
0 m
l)
M P S TCANAL TYPE
1
10
100
1000
10000
100000
Col
ipha
ges (
PFU
/100
ml)
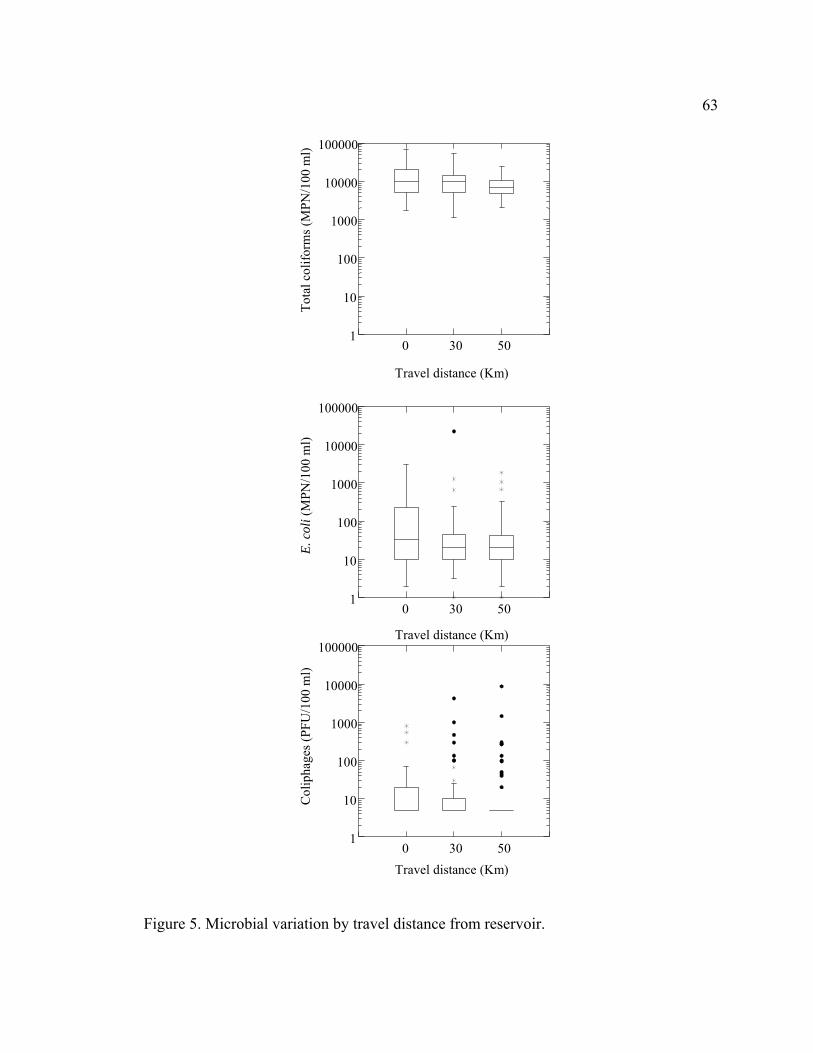
63
Figure 5. Microbial variation by travel distance from reservoir.
50300
Travel distance (Km)
1
10
100
1000
10000
100000
Tota
l col
iform
s (M
PN/1
00 m
l)
50300
Travel distance (Km)
1
10
100
1000
10000
100000
E. c
oli (
MPN
/100
ml)
50300 Travel distance (Km)
1
10
100
1000
10000
100000
Col
ipha
ges (
PFU
/100
ml)
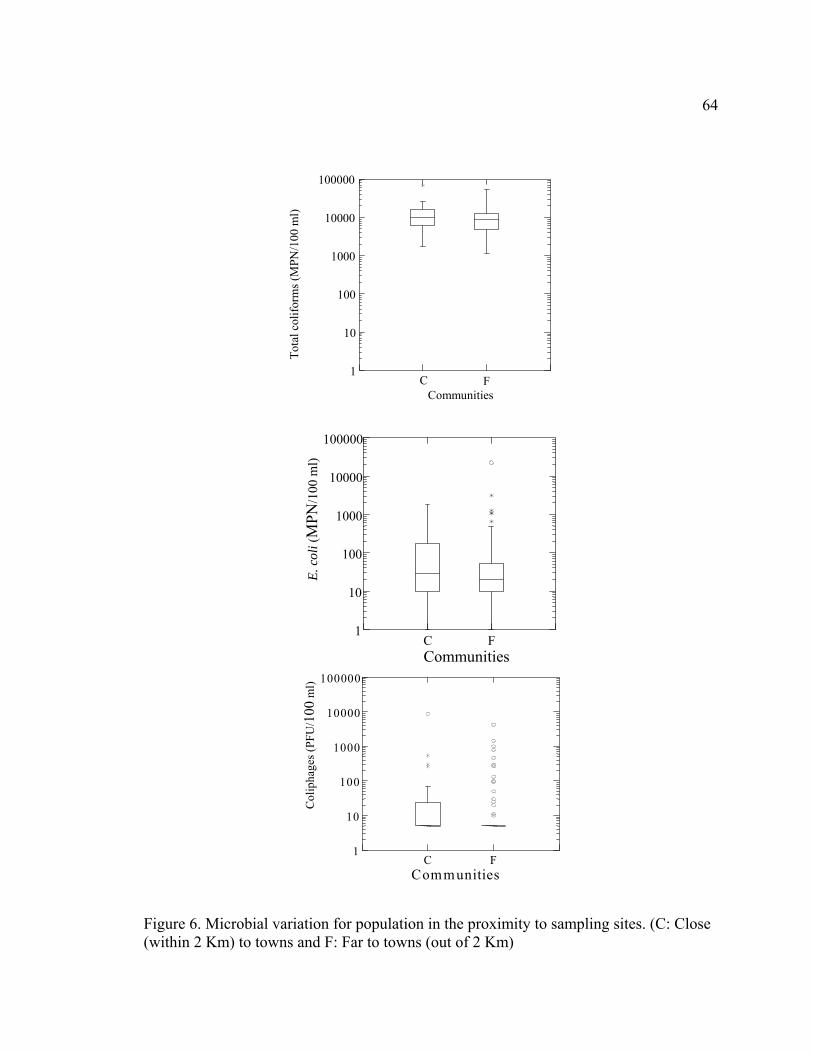
64
Figure 6. Microbial variation for population in the proximity to sampling sites. (C: Close (within 2 Km) to towns and F: Far to towns (out of 2 Km)
C FCommunities
1
10
100
1000
10000
100000
Tota
l col
iform
s (M
PN/1
00 m
l)
C FCommunities
1
10
100
1000
10000
100000
E. c
oli (
MPN
/100
ml)
C FCommunities
1
10
100
1000
10000
100000
Col
ipha
ges (
PFU
/100
ml)
65
APPENDIX B:
ASSESSMENT OF AERATED LAGOONS FOR PRODUCTION OF IRRIGATION WATER
Pablo Gortáres-Moroyoqui1,3, Luciano Castro-Espinoza1, Alberto Torres2, Jaime E.
Naranjo3, Martin Karpiscak4, and Charles P. Gerba3
1Departamento de Ciencias del Agua y del Medio Ambiente, Dirección de Recursos
Naturales, Instituto Tecnológico de Sonora 5 de Febrero 818 Sur, 85,000 Cd. Obregón,
Sonora, México
2Sistema de Ingeniería Sanitaria, S. A., Cd. Obregón, Sonora, México
3Department of Soil, Water, and Environmental Science2, The University of Arizona,
Veterinary Science and Microbiology 409, Tucson, Arizona, 85721 USA
4Office of Arid Lands Studies, The University of Arizona, 955 E. 6th Street, Tucson,
Arizona, 85719 USA
66
Abstract
Treated wastewater is an important potential source of irrigation water in arid
regions of the world. The reuse of treated wastewater for the irrigation of edible, non-
edible crops and others plants depend on its physical, chemical, and microbiological
quality. The World Health Organization has suggested treatment and microbial standards
for reclaimed waste water to be used for food crop irrigation. The primary objective of
this study was to determine if aerated lagoons used to treat municipal wastewater could
meet these guidelines. In addition, to assess the impact of microbiological quality on
vegetables, plots of carrots, lettuce, and tomatoes were established using furrow irrigation
with both raw wastewater (RWW) and treated wastewater (TWW). Results indicate that
the physical, chemical, and microbiological quality of treated wastewater is acceptable
for agricultural irrigation as well as other uses. The microbiological quality of vegetables
was not significantly different using treated or raw wastewater.
Key words Wastewater, irrigation, reuse, vegetables, water quality, E. coli, Giardia,
Cryptosporidium, enteroviruses, helminthes
67
Introduction In many arid environments an alternative source of water is required to meet the
growing demands of the communities, agriculture, and industry, thus wastewater reuse
has become an increasingly important possible option (Rose, 1986) . The utilization of
wastewater in arid regions in the world has been a common practice, especially in
countries such as Australia, Israel, México, Saudi Arabia, South Africa, and the United
Arab Emirates. Although the use of wastewater for agricultural irrigation has been
practiced for centuries, it must be treated and carefully managed to prevent transmission
of enteric pathogens and toxic chemical contaminants.
Public health risk due to the possible presence of enteric pathogenic organism is
one of the major disadvantages for recycling wastewater (Rose, 1986). It is well
established that, pathogenic bacteria, parasites, and viruses are found in sewage and they
may survive treatment processes. Once in the environment, many of these are able to
persist for prolonged periods of time. Sadowski et al. (1978) and Rose (1986) have
demonstrated that crops directly irrigated with wastewater become contaminated with
enteric microorganisms. Although enteric viruses do not grow on contaminated
vegetables, they can survive long enough to cause disease in humans. Studies done by
Tierney et al. (1977), and Ward and Irving (1987) in which enteric viruses were added to
sewage effluent used for crop irrigation showed that viruses can remain viable from 3 to
5 weeks on crops. Furthermore, Badawy et al. (1985) found that enteroviruses and
rotaviruses can survive 1-4 months on vegetables during commercial and household
storage after harvesting.
68
Before 1990, only 10 percent of municipal wastewater in Mexico was treated.
Currently, between 20 and 30 percent of the municipal wastewater receives some
treatment (Monroy et al. , 2000). In 1994, the reuse of raw wastewater (RWW) was
forbidden (Mexican Clean Water Program) and an arrangement to increase the volume of
treated municipal wastewater was implemented by the Mexican Government. In 1996,
two municipal WW treatment plants started operations in Ciudad Obregón, Sonora.
These plants include primary (screen and sedimentation) and secondary treatment. The
secondary treatment consists of three sets of three lagoons each, working sequentially.
Every set includes an aerated pond, one facultative pond and finally an anaerobic-
sedimentation lagoon. After the secondary treatment, the effluent is chlorinated. In total,
both plants are treating around 1.0 cubic meter per second. Presently, this treated water is
not being used and is discharged to an open canal which travels 60 km to the Gulf of
Mexico.
Severe drought conditions have occurred in recent years in Sonora, Mexico.
Therefore, the reuse of wastewater represents a potential alternative water supply for
irrigated agriculture. However, before recycling treated wastewater is allowed additional
information is needed on the quality of the treated wastewater. Hence, the goal of this
study was to determine the physical, chemical, and microbiological quality of treated
wastewater in Ciudad Obregón, Sonora and to assess the microbiological impact on
agricultural products furrow irrigated using treated wastewater.
69
Methods
The study was conducted at El Instituto Tecnológico de Sonora in Ciudad
Obregón, Sonora, Mexico, between May 1999 and April 2001. The project was carried
out in two main parts: One of them related to the effluent quality evaluation and another
to assess the microbiological impact on vegetables irrigated by treated wastewater
Chemical water quality
Wastewater quality parameters studied included: pH, temperature (T), electrical
conductivity (EC), total dissolved solids (TDS), total nitrogen (TN), free ammonia (NH3),
hardness (H), alkalinity (ALK), setteable solids (SS), phosphate (PO4), chloride (Cl),
biological oxygen demand (BOD), chemical oxygen demand (COD), detergents (DET)
greases (G), fecal coliforms (FC), cyanide (CN) and heavy metals (As, Cd, Cr, Cu, Hg,
Mn, Ni, Pb, and Zn). Analyses were carried out according to Standards Methods for
Examination of Water and Wastewater (APHA, 1998).
Irrigation plots
Three vegetables, lettuce (leaf), carrots (root), and tomatoes (fruiting body), were
planted in a total of six-344 m2 plots. Three plots, one for each vegetable, were irrigated
using treated wastewater (TWW); other three plots were supplied with raw municipal
wastewater (RWW), as a control. There were five irrigation events, with each application
being 20 cm of water supplied to each plot by furrow irrigation. Water, soil, and
vegetable samples were analyzed for the presence of several organisms.
70
During each irrigation event, samples of RWW and TWW were collected for
microbial assay. One-liter samples of both TWW and RWW were collected for bacteria
assays according to the recommendations of APHA (American Public Health Association
et al.., 1998). One hundred-ninety liters of TWW were processed for parasites and
enteroviruses, according to the ICR Microbial Laboratory Manual (USEPA, 1996). Five
hundreds milliliter RWW samples were collected for parasites and viruses. Fecal
coliforms were detected using the membrane filter technique, using FC media as
described in Standard Methods (APHA, 1998). Coliphages were assayed by the double-
layer agar method described by Pepper et al. (1995). Cryptosporidium oocysts and
Giardia cysts were assayed according to the ICR method (USEPA, 1996). Enzys
Hydrofluor-Combo kit was used to detect Giardia cysts and Cryptosporidium oocysts.
Enteroviruses were detected by production of cytopathogenic effects on the BGM cell
line (APHA, 1998). The 9510C protocol was followed to elute and concentrate the
treated wastewater samples (TWW). While the 9510D protocol was used to concentrate
RWW samples. Both TWW and RWW samples were assayed via the cell culture
technique as described in the 9510G protocol. Helminthes eggs were assayed as
maintained by the Mexican Standard recommendation NMX-AA113-SCFI-1999
(SECOFI, 1999).
Soil Samples
Soil samples were collected and processed according to the recommendations
given by Wollum (1994). Two composite soil samples were collected from each plot
before wastewater was applied to irrigate vegetable plants, and after vegetables were
71
harvested. Eight samples were randomly taken from the top 20 cm of soil and mixed to
make each composite sample. Ten grams of each composite soil sample were weighed
and mixed with 95-ml of phosphate buffered solution (PBS) containing sodium dodecyl
sulfate (SDS) in 250-ml previously sterilized bottles. The bottles were shaken by hand
for 30 to 60 seconds and then placed on a horizontal shaker (rotary Lab Line shaker) and
shaken for 20 minutes. After shaking, the bottles were allowed to stand for
approximately 30 seconds. The soil extract was used to determine Cryptosporidium
oocysts and Giardia cysts following the same procedure as outlined by Karim et al.
(2004) for sediment samples.
Vegetable Samples
Five samples from each plot of lettuce, carrot, and tomatoes were randomly
collected. All harvesting were conducted between four and fourteen days after an
irrigation event. Vegetable samples were placed in sterile containers and transported in a
cooler with ice to the laboratory. Approximately 250 grams of each vegetable were
placed into sealable plastic bags. The vegetables were eluted by shaking at 150 rpm on a
flat lab shaker for 10 minutes in a phosphate buffered saline solution (0.85 % NaCl in
0.02 M K2HPO4, pH 7.4 ± 0.2) at ratio of 1:2 (W/V, weight of vegetables to volume of
rinse solution). This solution was then tested for the same organisms as the water
samples. A similar volume of eluate was mixed with 500 ml beef extract and flocculated
to concentrate enteroviruses to concentrate the eluate to a final volume of 20 – 25 ml
before assay on the BGM wells. This procedure follows the method protocol 9510 c in
72
APHA (1998). The cysts and oocysts were concentrated from 250 ml of this eluate to a
volume of 10 – 25 ml by low speed centrifugation and then assayed as the water samples.
73
Results and Discussion
Chemical water quality
Table 1 shows physical and chemical results and Table 2 shows the
microbiological results. Effluent quality is similar as reported in other studies (Rose,
1986; Sadowsky, 1978; Metcalf and Eddy, 1994). Comparison of these results as well as
between Mexican and international guidelines is shown in Table 3. Data for treated
wastewater appear to indicate that the treated wastewater effluent can be used in
agricultural to irrigate restricted crops. Although an exhaustive screening of all the
parameters that must be satisfied to demonstrate the reuse of effluent would be
recommended in other activities such as industrial, recreational, and aquifer recharge was
not carried out as part of the present study, several parameters studied in treated
wastewater met some of those requirements. Parasites such as Cryptosporidium and
Giardia are not included in Mexican and International guidelines for irrigation water or
reuse of treated wastewater these are of concern particularly because of their
concentration levels are close to the infective doses (Bitton, 1994; Blumenthal et al..,
2000).
The level of Cryptosporidium, 18 ooysts/100 ml, and Giardia, 1200 cyst/100 ml
is greater than the infective dose levels. Therefore, precautions must be taken if the
effluent is used to grow fresh-food or activities where direct human contact is expected.
Results from this study confirm that fecal coliform (99.998 %), coliphages (99.4%) and
enteric viruses (99.1 %) were efficiently removed by the wastewater treatment processes.
However, lower removals were observed for BOD (60 %) or COD (57%), as well as
74
Helminthes (> 84.6 %), Cryptosporidium oocysts (68.4 %), and Giardia cysts (50.0 %).
The relatively low removal efficiency for organic matter and helminthes, nevertheless,
was sufficient to guarantee that the treated wastewater met the Mexican and International
guidelines to be used in agriculture (SEMARNAP, 1997; SEMARNAP, 1998).
Treated wastewater reuse
Results of microbiological quality of vegetables irrigated by TWW and RWW
are shown in Table 4. Organisms were found at relatively low concentrations whether the
vegetables were irrigated with RWW or TWW. The concentrations of all organisms
studied were higher in RWW than in TWW, however, no significant difference was
observed on the microbiological quality of vegetables regardless of the type of irrigation
water used. Cryptosporidium and Giardia were found to accumulate on the soil irrigated
with RWW or TWW (Figure 1). Parasite accumulation in soil is due to size of
Cryptosporidium oocysts (2 – 4 µ) and Giardia cysts (6-10 µ) which is greater than soil
pore size (1 – 2 µ).
75
Conclusions
Data for treated wastewater appear to indicate that the treated wastewater effluent
can be used in agricultural to irrigate restricted crops. However, due to the level of
Cryptosporidium, 18 ooysts/100 ml, and Giardia, 1200 cyst/100 ml is greater than the
infective dose levels, precautions must be taken if the effluent is used to grow fresh-food
or activities where direct human contact is expected.
Even though the RWW contained much greater concentrations of indicators
bacteria, parasites, and viruses no significant difference was found in the microbial
quality of vegetables irrigated with raw wastewater or with treated wastewater.
Acknowledgments
The authors would like to express their appreciation to Eunice Guzmán and
Norma Celis from Instituto Tecnológico de Sonora in Ciudad Obregón, Sonora, México,
for their assistance during the laboratory analysis. This project was funded by El Sistema
de Investigación del Mar Cortes (SIMAC)

76
References
American Public Health Association (APHA), American Water Works Association (AWWA), and Water Environment Federation (WEF). (1998) Standard Methods for the Examination of Water and Wastewater, American Public Health Association, Washington, D. C. Ayers, R. S. and Westcot, D. W. 1989. Water for agriculture. FAO Irrigation and Drainage paper. Food and Agriculture Organization of the United Nations, 29 Rev. 1. Roem, Italy. Badawy, A. S., Gerba, C. P. and Kelly, L. M. 1985. Survival of rotavirus SA-11 on vegetables. Food Microbiol., 2:199-205. Blumenthal, U. J., Mara, D. D., Peasey, A., Ruiz-Palacios, G. and Stott, R. 2000 B. World Health Organ., 78:104-116. Karim, M.R., Manishadi, F. D., Karpiscak, M. M., and Gerba, C. P. 2004. The persistence and removal of enteric pathogens in constructed wetlands. Water Res., 38:1831-1837. Metcalf and Eddy, Inc. 1994. Wastewater Engineering: Treatment, Disposal, and Reuse (Third edition). Irwin Mc-Graw-Hill. Monroy, O. G., Fama M., Meraz, Montoya L., and Macario H. 2000. Anaerobic digestion for wastewater treatment in México: State of the technology. Wat. Res., 34:1803-1816. Pepper, I. L., Gerba, C. P. and Brendecke, J. W.1995. Environmental Microbiology: A Laboratory Manual. Academic Press, San Diego, CA. Rose J. B. 1986. Microbial aspects of wastewater reuse for irrigation. Crit. Rev. Environ. Contr., 16:231-256.
Rowe D. R. and Abdel-Magid I M. 1995. Handbook of waste water reclamation and
reuse, p 1-13. Boca Raton, CRC Lewis Publishers. Sadovski A.Y., Fattal B, Goldberg D., Katzenelson E., and Shuval H I. 1978b. High levels of microbial contamination of vegetables irrigated with wastewater by the drip method. Appl. Environ. Microbiol., 36:824-30. Secretaría de Comercio y Fomento Industrial (SECOFI). 1999. Norma mexicana NMX-AA-113-SCFI-1999 análisis de agua - Determinación de Huevos de Helminto - Método de prueba. Diario Oficial de la Federación, August 5, 1999. Mexico City

77
Secretaría del Medio Ambiente Recursos Naturales y Pesca, SEMARNAP. 1997. NOM-001-ECOL-1996 - Que establece los límites máximos permisibles de contaminantes en las descargas de aguas residuales en agua y bienes nacionales. Diario Oficial de la Federación, January 6, 1997. Mexico City. Secretaría del Medio Ambiente Recursos Naturales y Pesca, SEMARNAP. 1998. NOM-003-ECOL-1996 - Que establece los límites máximos permisibles de contaminantes para las aguas residuales tratadas que se reusen en servicio al público. Diario Oficial de la Federación, September 21, 1997. Mexico City. Tierney J. T., Sullivan R., and Larkin E. P.. 1977. Persistence of poliovirus 1 in soil and on vegetables grown in soil previously flooded with inoculated sewage sludge or effluent. Appl. Environ. Microbiol., 33:109-113. United State Environmental Protection Agency (USEPA) .1996. In ICR Microbial Laboratory Manual. Report EPA/600/R-95/1/18U. S. Environmental Protection Agency, Washington, D. C., p VII-1 - VII-44. Ward B. K. and Irving L. G.. 1987. Virus survival on vegetables spray-irrigated with wastewater. Wat. Res., 21:57-63. Wollum A. G. 1994. Soil sampling for microbiological analysis. In Methods of Soil Analysis: Microbiological and Biochemical properties (Mickelson s. H. and Bigham J. M.). Madison, Wisconsin, Soil Science Society of America, Inc. Part 2:2-13.

Table 1. Physical and chemical water quality
RWW TWW REMOVAL Samples
Number Range Mean Samples Number Range Mean %
T (oC) 655 19.0 – 34.0 27.4 655 18.0 – 35.0 27.3 PH 700 6.8 – 8.0 7.1 698 6.7 – 8.0 7.0 EC 241 538.0 – 1131 684.5 241 587.0 – 995.0 689.0 ALK 57 168.0 – 280.0 228.0 57 175.0 – 282.0 222.2 2.5 HARD 57 102.0 – 157.0 122.5 57 104.0 – 163.0 126.9 Cl 57 42.0 – 93.0 59.8 57 50.0 – 135.0 65.1 TS TSS
53 614
452.0 – 627.0 105 – 690
542.2 178.7
52 548
315.0 – 592.046.0 – 165.0
474.0 71.4
12.6 60.0
TDS 53 308.0 – 464.0 385.1 52 226.0 – 523.0 401.7 SS 604 0.7 – 4.0 2.0 241 < 0.1 N-NH3 6. 18.8 – 22.4 20.8 8 17.0 – 20.1 18.1 13.0 NT 20 25.7 – 33.3 29.9 29 21.3 – 35.7 26.3 12. PO4 27 4.4 – 6.3 5.2 28 3.6 – 5.9 4.6 11.5 BOD 162 107.0 – 263.9 169.1 257 40.4 – 94.1 66.9 60.4 COD 501 234.7 – 640.0 433.4 508 111.1 – 244.2 186.6 56.9 DET 6 5.4 – 9.6 7.2 7 1.3 – 2.9 2.4 66.7 G 3 10.4 – 12.1 11.4 38 3.1 – 23.6 6.5 43.0
Units are given in mg/ml except pH, temperature (oC), and EC ( dS/cm). Cyanide and heavy metals were below detection limits (< 0.001 for Hg, < 0.002 for CN, < 0.01 for As and Ni, < 0.02 for Cd, < 0.03 for Cu, and < 0.1 for Cr, Pb, and Zn). Removal percent was estimated using the mean values
78
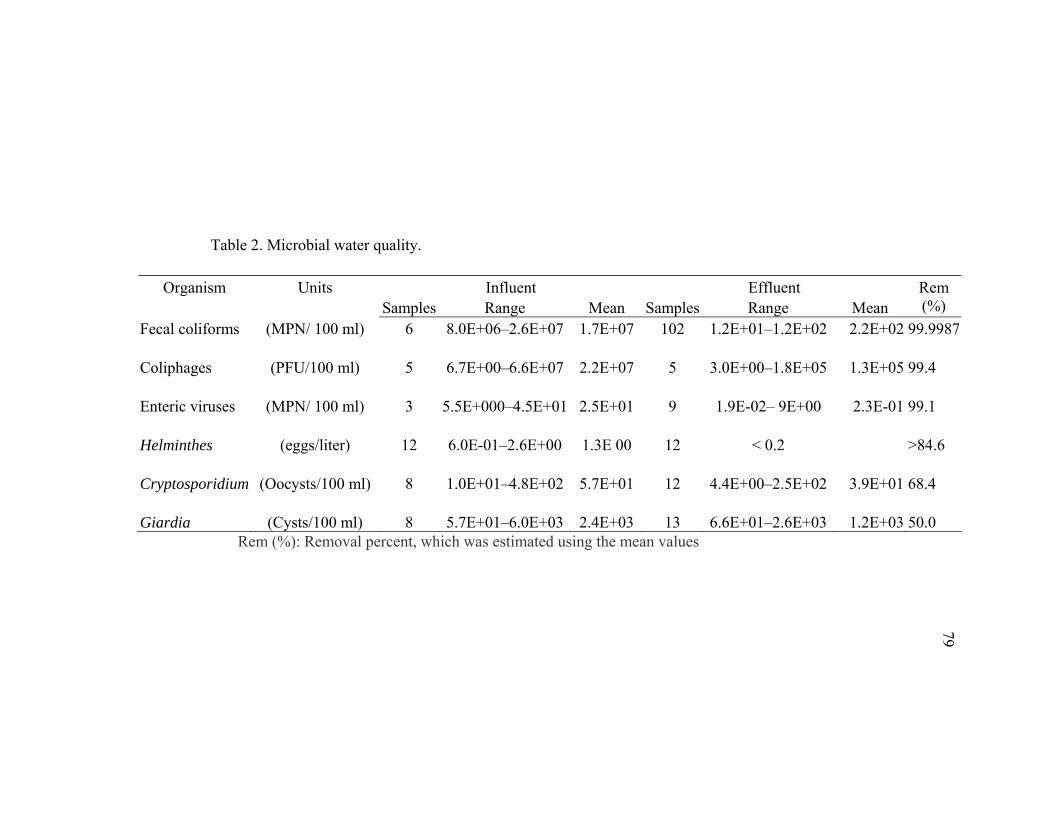
Table 2. Microbial water quality.
Rem (%): Removal percent, which was estimated using the mean values
Influent Effluent Organism
Units Samples Range Mean Samples Range Mean
Rem (%)
Fecal coliforms (MPN/ 100 ml) 6 8.0E+06–2.6E+07 1.7E+07 102 1.2E+01–1.2E+02 2.2E+02 99.9987 Coliphages (PFU/100 ml) 5 6.7E+00–6.6E+07 2.2E+07 5 3.0E+00–1.8E+05 1.3E+05 99.4 Enteric viruses (MPN/ 100 ml) 3 5.5E+000–4.5E+01 2.5E+01 9 1.9E-02– 9E+00 2.3E-01 99.1 Helminthes (eggs/liter) 12 6.0E-01–2.6E+00 1.3E 00 12 < 0.2 >84.6 Cryptosporidium (Oocysts/100 ml) 8 1.0E+01–4.8E+02 5.7E+01 12 4.4E+00–2.5E+02 3.9E+01 68.4 Giardia (Cysts/100 ml) 8 5.7E+01–6.0E+03 2.4E+03 13 6.6E+01–2.6E+03 1.2E+03 50.0
79
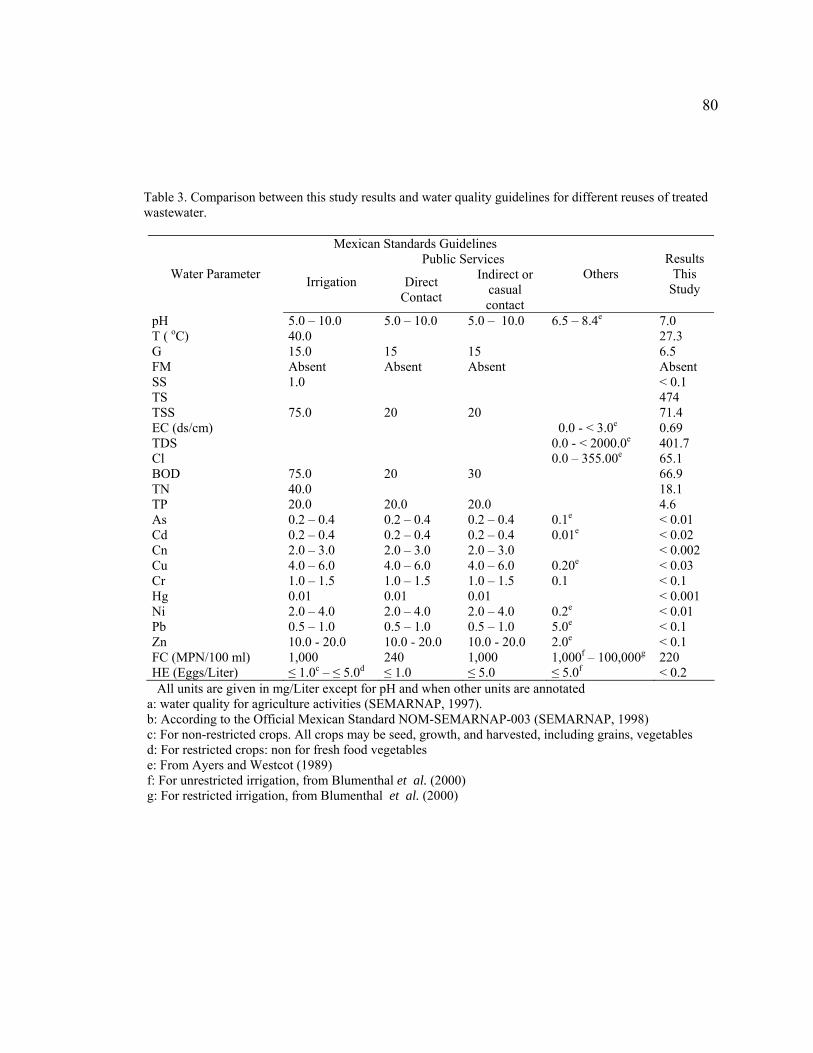
80
Table 3. Comparison between this study results and water quality guidelines for different reuses of treated wastewater.
Mexican Standards Guidelines Public Services
Water Parameter Irrigation Direct Contact
Indirect or casual contact
Others Results
This Study
pH T ( oC) G FM SS TS TSS EC (ds/cm) TDS Cl BOD TN TP As Cd Cn Cu Cr Hg Ni Pb Zn FC (MPN/100 ml) HE (Eggs/Liter)
5.0 – 10.0 40.0 15.0 Absent 1.0 75.0 75.0 40.0 20.0 0.2 – 0.4 0.2 – 0.4 2.0 – 3.0 4.0 – 6.0 1.0 – 1.5 0.01 2.0 – 4.0 0.5 – 1.0 10.0 - 20.0 1,000 ≤ 1.0c – ≤ 5.0d
5.0 – 10.0 15 Absent 20 20 20.0 0.2 – 0.4 0.2 – 0.4 2.0 – 3.0 4.0 – 6.0 1.0 – 1.5 0.01 2.0 – 4.0 0.5 – 1.0 10.0 - 20.0 240 ≤ 1.0
5.0 – 10.0 15 Absent 20 30 20.0 0.2 – 0.4 0.2 – 0.4 2.0 – 3.0 4.0 – 6.0 1.0 – 1.5 0.01 2.0 – 4.0 0.5 – 1.0 10.0 - 20.0 1,000 ≤ 5.0
6.5 – 8.4e 0.0 - < 3.0e 0.0 - < 2000.0e
0.0 – 355.00e 0.1e 0.01e 0.20e 0.1 0.2e 5.0e 2.0e
1,000f – 100,000g ≤ 5.0f
7.0 27.3 6.5 Absent < 0.1 474 71.4 0.69 401.7 65.1 66.9 18.1 4.6 < 0.01 < 0.02 < 0.002 < 0.03 < 0.1 < 0.001 < 0.01 < 0.1 < 0.1 220 < 0.2
All units are given in mg/Liter except for pH and when other units are annotated a: water quality for agriculture activities (SEMARNAP, 1997). b: According to the Official Mexican Standard NOM-SEMARNAP-003 (SEMARNAP, 1998) c: For non-restricted crops. All crops may be seed, growth, and harvested, including grains, vegetables d: For restricted crops: non for fresh food vegetables e: From Ayers and Westcot (1989) f: For unrestricted irrigation, from Blumenthal et al. (2000) g: For restricted irrigation, from Blumenthal et al. (2000)
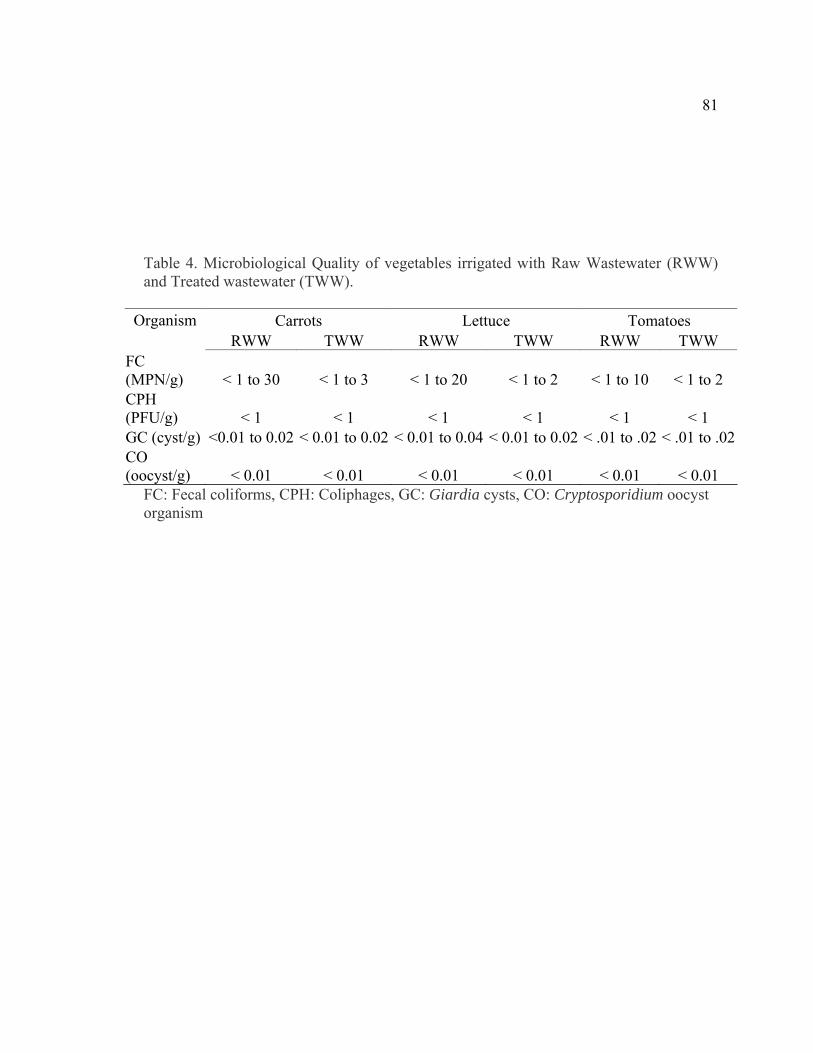
81
Table 4. Microbiological Quality of vegetables irrigated with Raw Wastewater (RWW) and Treated wastewater (TWW).
Carrots Lettuce Tomatoes Organism RWW TWW RWW TWW RWW TWW
FC (MPN/g) < 1 to 30 < 1 to 3 < 1 to 20 < 1 to 2 < 1 to 10 < 1 to 2 CPH (PFU/g) < 1 < 1 < 1 < 1 < 1 < 1 GC (cyst/g) <0.01 to 0.02 < 0.01 to 0.02 < 0.01 to 0.04 < 0.01 to 0.02 < .01 to .02 < .01 to .02CO (oocyst/g) < 0.01 < 0.01 < 0.01 < 0.01 < 0.01 < 0.01
FC: Fecal coliforms, CPH: Coliphages, GC: Giardia cysts, CO: Cryptosporidium oocyst organism
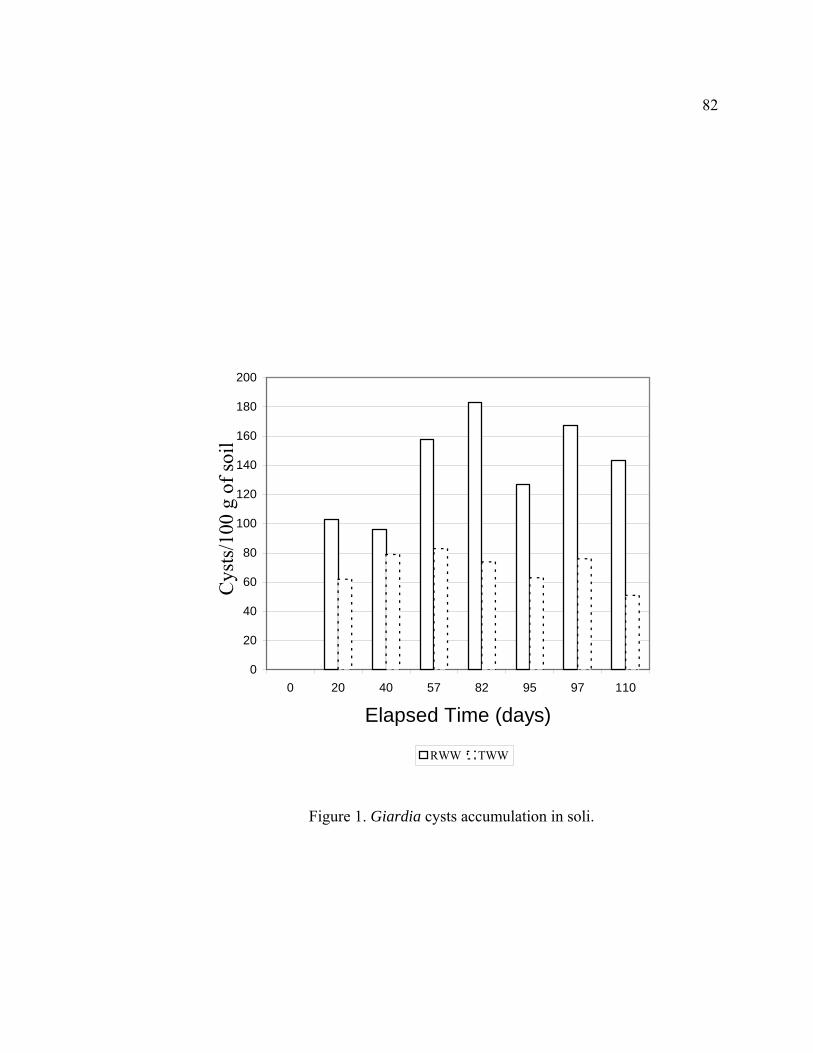
82
0
20
40
60
80
100
120
140
160
180
200
0 20 40 57 82 95 97 110
Elapsed Time (days)
Cys
ts/1
00 g
of s
oil
RWW TWW
Figure 1. Giardia cysts accumulation in soli.
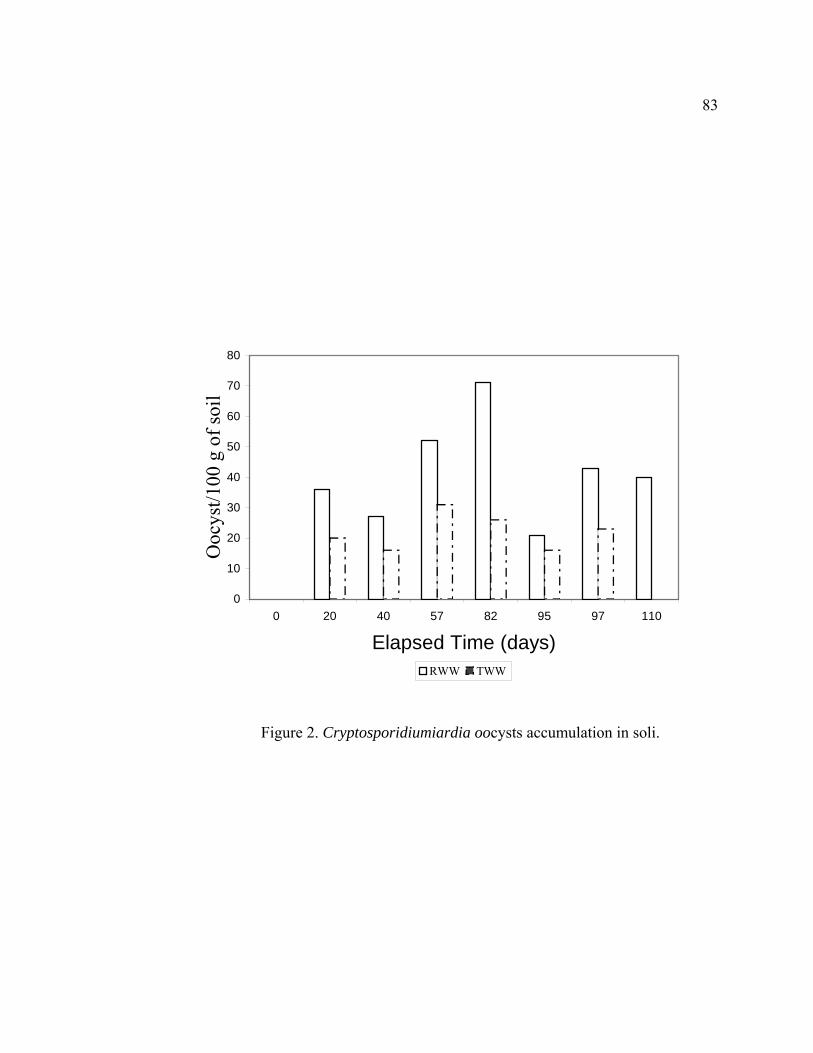
83
0
10
20
30
40
50
60
70
80
0 20 40 57 82 95 97 110
Elapsed Time (days)
Ooc
yst/1
00 g
of s
oil
RWW TWW
Figure 2. Cryptosporidiumiardia oocysts accumulation in soli.
84
APPENDIX C:
THE IMPACT OF IRRIGATION WATER QUALITY ON MICROBIAL CONTAMINATION OF PRODUCE
Pablo Gortáres-Moroyoqui1,2, Luciano Castro-Espinoza1, Jaime E. Naranjo2, Faezeh
Manshadi2, Charles P. Gerba2*, Martin M. Karpiscak3, and Robert J. Freitas2
1Departamento de Ciencias del Agua y del Medio Ambiente, Dirección de Recursos
Naturales, Instituto Tecnológico de Sonora 5 de Febrero 818 Sur, 85,000 Cd. Obregón,
Sonora, México
2Department of Soil, Water, and Environmental Science2, The University of Arizona,
Veterinary Science and Microbiology 409, Tucson, Arizona, 85721 USA
3Office of Arid Lands Studies, The University of Arizona, 955 E. 6th Street, Tucson,
Arizona, 85719 USA
85
Abstract
The goal of this study was to assess the potential for contamination of vegetables
during irrigation with untreated wastewater and surface water. Untreated municipal
wastewater (WW) from a small town (El Tobarito) in El Valle del Yaqui, Sonora, Mexico
and surface irrigation water (IW) from storage dams were used to irrigate three different
vegetables: lettuce, carrot, and green pepper. Samples of each vegetable, as well as WW
and IW, were examined for: total coliforms, Escherichia coli, Clostridium perfringens,
Cryptosporidium oocysts, Giardia cysts, coliphages, and enteroviruses. All of the
studied microorganisms were present in the untreated wastewater, but only total
coliforms; E. coli and C. perfringens were present in the surface irrigation water. Total
coliforms, E. coli, and C. perfringens were detected on all vegetables regardless of
irrigation source water. The highest concentration of these organisms was found on
carrots followed by lettuce and green peppers. E. coli levels were 10 to 100 times on
produce irrigated with untreated wastewater vs. surface water.
Key Words
Treated wastewater, untreated wastewater, water quality, vegetables, E. coli, Giardia,
Cryptosporidium, enteroviruses, helminthes
86
Introduction
Minimally processed and refrigerated (MPR) fruits and vegetables are important
sources of fresh produce and their per capita consumption is increasing. In most cases,
MPR foods are consumed raw, making the presence of pathogens a concern. Han et al.
(2000) noted that pathogens can reach MPR food from several sources including, but not
limited, irrigation or wash water, infected operators, animal waste and municipal
biosolids used as fertilizers, and operational facilities with poor sanitation. Each year
food-borne illness affects 6 to 80 million people, cause 9,000 deaths, and cost an
estimated five billion dollars in the USA (Altekruse et al., 1997). Fresh fruit and
vegetable consumption in the USA has increased approximately 60 percent during the
last 30 years (Forrest and Gushulak, 1997; Majkowski, 1997; Miller and Paige, 1998).
In many arid environments additional sources of water are needed to meet the
growing demands of municipalities, agriculture, and industry. Wastewater as one of the
few growing sources of supplies has increasingly become a viable supply option (Rose,
1986). The use of wastewater in arid regions in the world has been a common practice,
especially in countries such as Australia, Israel, Mexico, Saudi Arabia, South Africa, and
the United Arab Emirates (Rowe and Abdel-Magids, 1995).
Several studies have demonstrated that crops directly irrigated with wastewater
become contaminated with enteric pathogens including viruses (Sadovski et al., 1974;
Sadovski et al., 1978a; Sadovski et al., 1978b; Rose, 1986). Although enteric viruses
cannot grow on contaminated vegetables, they can survive long enough to cause disease
in humans (Rowe and Abdel-Magids, 1995). Studies conducted by Tierney et al. (1977)
87
and Ward and Irving (1987), in which enteric viruses were added to sewage effluent used
for crop irrigation, have shown that viruses can remain viable from 3 to 5 weeks under
growing conditions. Furthermore, Badawy et al. (1985, 1990) affirm that enteroviruses
and rotaviruses can survive 1-4 months on vegetables during commercial and household
storage after harvesting.
In Mexico, particularly in arid regions like the state of Sonora, wastewater
recycling has been an important potential alternative source to satisfy the growing
demand for water (Jimenez and Chavez-Mejia, 1997; Jimenez et al., 1999). In recent
years, several projects have been conducted in El Valle del Yaqui, Sonora, Mexico, to
evaluate water quality, treatment, and reuse of wastewater and sewage for irrigation
(Gortares, 1992; 1993; 1997;1998; Gortares and Castro, 1993), as well as to assess the
level of enteric organisms on vegetables sold in supermarkets (Hirotani et al., 2002).
The goal of this study was to assess the microbiological water quality of both
surface irrigation water and untreated municipal wastewater and their potential for
contamination of vegetables irrigated with these waters.
Methods
Location of Study
The study was conducted at El Instituto Tecnológico de Sonora in Ciudad
Obregón, Sonora, Mexico, located in El Valle del Yaqui (The Yaqui Valley) (Figure 1),
which occupies five counties including Bacum, Guaymas, Navajoa, Etchojoa, and
Cajeme, with an overall population of around 700,000 inhabitants. Cuidad Obregon,
88
which is located in Cajem County has 400,000 inhabitants and it is the major city in El
Valle del Yaqui. The Yaqui Valley is widely known as one of the most developed
agricultural regions in Mexico.
Irrigation and Plot Design
Untreated domestic wastewater (WW) from El Tobarito, a small town close to the
experimental field, and surface irrigation water (IW) were used to irrigate the
experimental plants. The surface irrigation water originates from a dam on the Yaqui
River and does not receive sewage discharges. Three vegetables, lettuce (leaf), carrots
(root), and green peppers (fruiting body), were planted in six-156 m2 experimental plots.
Distribution and plot size are shown in Figure 2. Seeds of the selected vegetables were
planted at the end of November 2000, and only IW was used for all plots for the first two
months. After, one plot of each vegetable was irrigated, every 10-15 days, using WW
and the control plots continued to be supplied with IW. Furrow irrigation was used to
deliver a total of 16,125 gallons (61,036 liters) to each plot during seven irrigation events.
Water, soil, and vegetable samples were analyzed for several organisms according to the
methodology described below.
Irrigation Water Analysis
To establish background concentrations, both WW and IW were analyzed for the
presence of the following organisms: Total coliforms, Escherichia coli, Listeria
monocytogenes, Clostridium perfringens, Cryptosporidium oocysts, Giardia cyst,
89
coliphages, and enteroviruses. During each irrigation event, three one liter-samples of
both types of water (IW and WW) were collected for bacteria and coliphages, but only
one sample was collected for parasites and enteroviruses. In the case of IW, 190 liters
were collected for parasites and enteroviruses, according to Standard Methods for the
Examination of Water and Wastewater (APHA, 1998). Positively charged filters 1MDS
filter cartridges (Cuno Inc., Meriden, CT) were used to collect virus samples and Filterite
polypropylene cartridges (Filterite Corporation, Timorium, MD) were used to collect
parasite samples. In contrast only five hundred milliliters of unfiltered WW samples were
collected for parasites and enteroviruses .
Simultaneous enumeration of total coliforms and E. coli was performed using the
Colilert Quanti-tray system (IDEXX Laboratories, Inc., West Brook, MA). Results were
reported as Most Probable Number (MPN) per ml.
Membrane filtration was used to detect C. perfringens as described by Bisson and
Cabelli (1979). The samples were heat shocked at 65-70oC in a water bath to stimulate
sporulation of vegetative cells. Heat shocked water samples were then filtered through a
0.45 µm pore size membrane filter and transferred to mCP media (Acumedia, Baltimore,
MD) and incubated in an anaerobic jar for 24 hours at 42oC. Yellow colonies turning
pink to red after exposure to ammonium hydroxide vapor were considered as presumptive
Clostridium colonies.
The double-layer agar method described by Peppers et al. (1995) was used to
detect coliphages using E. coli, strain ATCC 15597, four replicates of five and one
milliliter aliquots of both types of waters were assayed for each sample.

90
Cryptosporidium and Giardia were concentrated by density gradient
centrifugation and detected by use of an indirect fluorescent antibody (APHA, 1998).
The Ensys Hydrofluor-Combo II kit (Product Number 7080500 from Strategic Diagnostic
Inc., Newark, DE) for the simultaneous detection of Giardia cysts and Cryptosporidium
oocysts was used.
Enteric viruses were analyzed according to Standard Methods for the Examination
of Water and Wastewater (APHA, 1998). Protocol 9510C was followed to elute and
concentrate the irrigation water samples (IW). Five hundred milliliters samples of WW
were concentrated following the 9510D protocol. Both IW and WW samples were
assayed using the cell culture technique as described in protocol 9510G, in which
cytopathic effects (CPE) on BGM cells is used for virus detection. Cell cultures were
observed for CPE during 14 days. If no CPE was observed, they were passed a second
fourteen-day period.
Soil Analysis
Soil samples were collected and processed according to Wollum (1994), Scott
(1994), and Zuberer (1994). Two composite soil samples were collected from each plot
before and after the application of WW. Eight soil simple samples (around 50 to 100
grams each) were randomly taken from the top 20 cm of soil and mixed to make each
composite sample. Ten grams of each composite soil sample were weighed and mixed
with 96-ml of peptone water (0.1%) in 250-ml sterile bottles. The bottles were shaken by
hand for 30 to 60 seconds and then placed on a horizontal rotary shaker and shaken for 20
91
minutes. After shaking, the bottles were allowed to stand for approximately 30 seconds.
The soil extract was used directly or after decimal dilutions with peptone water (0.1%) to
determine Escherichia coli, Clostridium perfringens, and coliphage concentrations. E.
coli and coliforms were detected according to the procedure described by Turco (1994),
while Clostridium perfringens and coliphage were assayed using the same technique used
for water samples.
Vegetable Analysis
Twenty-four samples were randomly collected from each plot of lettuce and
carrots, while twelve samples were randomly collected from each plot of green peppers.
All harvesting was conducted between ten and fourteen days after an irrigation event.
Vegetable samples were placed in sterile containers and transported on ice to the
laboratory. Each lettuce sample (approximately 500 grams) consisted of the first two
outer leaves of four heads of lettuce. The surface area of lettuce was estimated assuming
that this vegetable has a somewhat spherical shape. The diameter of each head sampled
was measured and the surface area was estimated using the sphere surface equation. (a =
πr2, where a is the surface area, and r is the radius)
Approximately 500 grams samples of carrot and green pepper were used for
microbial assays. The surface area of each individual carrot and green pepper was
estimated. Since these vegetables are somewhat conical in shape, the length and top
diameter of each carrot and each green pepper was measured and the surface area was
determined using the circular cone surface equation. (a = 2πr*(r2 + h2)1/2, where a is the
92
lateral surface area, r is the radius and h is the length). Each carrots sample consisted of
around 6 to 10 individual carrots and each green peppers sample consisted between 8 and
15 individual green pepper.
Vegetable samples were placed into Ziploc clear plastic bags, which were
collected inside four-liter beakers. Vegetable samples were eluted by shaking at 150
revolutions per minute on a water bath shaker (New Brunswick Scientific, Edison, NJ,
USA) for 10 minutes in a phosphate buffered saline solution (0.85% NaC1 in 0.02 M
K2HPO4, pH 7.4 to 7.8) a ratio of 1:2 (W/V, weight of vegetables to volume of rinse
solution). The elution obtained from the shaken vegetable samples was analyzed for the
same organisms as the water samples. All vegetable samples were analyzed for bacteria
and bacteriophages but only eight samples from each plot of lettuce and carrot and four
samples from each plot of green peppers were analyzed for parasites and enteroviruses.
The same techniques as described for water samples were used to determine the
concentration of total coliforms, E. coli, C. perfringens, and coliphage.
Cryptosporidium oocysts and Giardia cysts were concentrated and detected from
250 ml volumes of the vegetable elution using the same procedure like water samples
Enteroviruses were concentrated from 250 ml aliquots of the vegetable elution by
addition of 500 ml of 10% beef extract and concentrated to a final volume of 20 to 25 ml
by flocculation (protocol 9510C from APHA, 1998).
The recovery efficiency for each organism assayed in this study was determined
previously using saline solution to elute organisms from vegetables and according to the
technique indicated in the part of water samples for each organism. Values of recovery
93
efficiency are given on Table 1. Lettuce and green peppers were used to carry out the
assessment of two methods for the recovery of organism from vegetables surfaces.
Particularly, lettuce was selected for this purpose based on the morphological complexity
of wax structure present on its leaves. It was assumed that if saline solution could be used
to recover organism from lettuce leaves this option would likely work better with both
green peppers and carrots.
Results
Water quality
Irrigation Water
The results of the microbial analysis of IW and WW are shown in Table 2. The
number of fecal coliform (E. coli) found in the IW ranged from 1.04 and 3.70 with a
geometric mean of 2.41 log10 MPN/100 ml. This geometric mean value was found to be
below both the Mexican and International Standards (1000 MPN/100 ml) for irrigation
water (Secretaria del Medio Ambiente Recursos Naturales y Pesca, 1997; WHO, 1989;
Blumenthal et al., 2000). No enteroviruses or protozoan parasite were detected in the
IW. Coliphage concentrations ranged from 2.00 to 2.94 log10 per liter.
Cryptosporidium oocysts and Giardia cysts were below the detection limit in this
study. Clostridium perfringens concentrations ranged from 2.0 to 5.58 log10 per liter. In
contrast, L. monocytogenes was not detected.
Wastewater
94
The concentrations of the organisms studied in the WW are similar to those found
in typical municipal wastewater (Rose, 1986). All the organisms evaluated were detected
at concentrations 100 to 1,000 times greater in WW than in IW. E. coli ranged between
6.30 and 7.21 log10 MPN/100 ml with a geometric mean of 7.69 log10 MPN/100 ml.
Coliphages ranged from 5.20 and 6.55 log10 PFU/100 ml with a geometric mean of 6.62
log10 PFU/100 ml. Cryptosporidium oocyst values ranged between 2.8 and 3.78 log10/100
ml with a geometric mean of 3.16 log10 oocysts/100 ml and Giardia cysts between 3.84
and 4.67 log10/100 ml with a geometric mean of 4.21 log10 cysts/100 ml. Enteroviruses
ranged from 0.94 and 3.18 log10/100 ml with a geometric mean of 1.91 log10 MPN/100
ml.
Soil quality
The results of the soil analysis are shown in Table 3. The concentration of total
coliforms and E. coli were below the detection limit (≤ 3.30 CFU/g) in soil samples
collected prior to the application of wastewater. Post harvest sampling taken after several
applications of wastewater contained a geometric mean of 120 coliforms per gram and 4
to 110 E. coli per gram. In contrast, C. perfringens did not increase in numbers after
application of the wastewater. The geometric mean values obtained for soil samples were
321 and 145 CFU/g before and after wastewater application. Coliphages were not
detected (less than the detection limit, ≤ 0.67 PFU/g) either in soil samples taken before
or after wastewater application.
95
Vegetable quality
Microbiological results for vegetables are given in Tables 4, 5, and 6. Listeria
monocytogenes, parasites, enteroviruses, and coliphages were not detected on the
harvested lettuce, carrots, and green peppers irrigated with IW or WW. Only total
coliforms and E. coli were detected on the harvested vegetables. Results of lettuce
sample analysis are shown in Table 4. Total coliforms were greater than 48 MPN/g in all
samples. E. coli was not detected on the vegetables irrigated with IW (≤ 0.02 MPN/g);
however, when WW was used, 11 of 24 samples were positive (geometric mean of 0.05
MPN/g).
C. perfringens was found on all the vegetables whether irrigated with IW or WW.
When IW water was used, values were between 0.2 and 3.75 MPN/g with a geometric
mean of 0.9 MPN/g while WW irrigated lettuce had between 0.38 and 3.98 MPN/g with a
geometric mean of 1.16 MPN/g for IW and WW, respectively. Coliphages,
enteroviruses, Giardia cysts, and Cryptosporidium oocysts were not detected.
Results of carrot samples are shown in Table 5. All (24) samples were positive
for total coliforms whether irrigated with IW or WW. The values ranged between 3.1
and 48.4 MPN/g with a geometric mean of 10.6 MPN/g and between 4.7 and 39.7 MPN/g
with a geometric mean of 17.5 MPN/g for IW and WW, respectively. E. coli was
detected in only two of 24 samples irrigated with IW and 22 of 24 samples when WW
was applied (geometric mean of 0.17 MPN/g). C. perfringens was positive for all
samples (24) whether the vegetables were irrigated with IW or WW. The level of
96
Clostridium was between 0.5 and 39.0 CFU/g with a geometric mean of 11.0 CFU/g on
the carrots when IW was applied. Carrots irrigated with WW ranged from 2.0 and 22.0
CFU/g with a geometric mean of 8.6 CFU/g. All carrot samples analyzed for coliphages
(24 samples), enteroviruses (8 samples), Giardia cysts (8 samples), and Crytosporidium
oocysts (8 samples) were below the detection limits for these organisms.
Results of green pepper samples are shown in Table 6. Eleven of twelve green
peppers samples were positive for total coliforms from plots irrigated using IW or WW.
The level of coliforms, on green peppers samples, was between 0.5 and 4.7 MPN/g
coliforms with a geometric mean of 1.2 MPN/g when IW was used and between 0.4 and
17.2 MPN/g with a geometric mean of 3.3 MPN/g for WW irrigated plants. E. coli was
found in only one of twelve green pepper samples irrigated with IW while 9 of 12
samples from irrigated WW vegetables were positive with values between 0.02 and 5.5
MPN/g and a geometric mean of 0.16 MPN/g.
C. perfringens was detected in three of twelve green pepper samples when IW
was used and only two of twelve samples when WW was used with a value of 0.05
CFU/g. No coliphages, enteroviruses, Giardia cysts, or Cryptosporidium oocysts were
detected.
Although more positive samples were detected for E. coli and C. perfringens (Fig.
6), when WW was used for irrigation in comparison to IW for all three vegetables
studied, the number of organisms per gram of vegetable was not significantly different
between vegetables irrigated with IW and WW.
97
Discussion
No significant difference in the number of indicator organisms and enteric
pathogens were found on vegetables irrigated with IW or WW. Geldreich and Bordner
(1971) reported that when the amount of fecal coliforms in irrigation water is low (less
than 630 MPN per 100 ml) no significant differences were observed in the number or
organisms found on root crops and leafy vegetables. However, when the amount of fecal
coliforms was around 53,000 MPN per 100 ml, they found a greater difference between
root crops and leafy vegetables. The level of fecal coliforms, 269 CFU per 100 g for root
crops and 16 CFU per 100 g of leafy vegetables, reported by Geldriech and Bordner
(1971), is similar to levels of E. coli in this study, 17 CFU per 100 g of root crops
(carrots) and 5 CFU per 100 g for leafy vegetables (lettuce).
The numbers of E. coli, fecal coliforms, and Clostridium perfringens detected in
this study as well as those reported by Geldreich and Bordner (1971) are on the order of
0.1 and 2.0 log10 per 100 g of vegetables. In contrast, these values are much lower than
those reported in other studies of vegetables (Ercolani, 1976; Beuchat, 1996; Francis et
al., 1999; Garg et al., 1990; Hirotani et al., 2002; Monge and Arias, 1996; Monge and
Chinchilla, 1996; Nguyen-the and Carlin, 1994). However, in most of these studies the
vegetables were collected from supermarkets and restaurants and not from the field.
Results obtained in our own study as well as the Geldriech and Bordner (1971) strongly
C. perfringens, and parasites in the wastewater used in this study, only small numbers of
these organisms were detected in both soil and vegetables. The low level of microbes
98
found in the soil and vegetables may be due to inactivation of the organism on the crops
(Seo and Frank, 1999; Noy and Feinmesser, 1977) and the method used to elute the
samples during analysis (Sadovski et al., 1978b; Jackson, 1990; Sadovski et al., 1978a).
The vegetables were not harvested until 10-14 days after the last irrigation event which
may have allowed for a significant decrease of the indicator organisms.
According to several studies (Brackett, 1992; Rowe and Abdel-Magids, 1995;
Beuchat, 1996; Beuchat, 1998; Brackett, 1992), organisms can survive for varying
periods of time in soils depending on different factors such as the physical and chemical
properties of the soil, the type of microorganism, and environmental conditions. Some
investigators (Sadovski et al., 1978b; Sadovski et al., 1978a; Shuval et al., 1989; Monge
et al., 1996; Shuval et al., 1997) have suggested that environmental conditions such as
sunlight, temperature, rainfall and others have an important effect on the ability of
organisms to survive in the soil.
The Mexican and international microbiological water quality standards used for
agriculture irrigation established that, in addition to fecal coliforms, the number of
helminthes eggs is another indicator to be considered. Although helminthes eggs were
not analyzed in this study, Martinez-Acuña (2002) demonstrated, in a study carried out in
municipal wastewater from ciudad Obregón Sonora México, that these eggs are below
that value (≤1 helminthe egg/liter) recommended for WHO (1989) and Mexican
Standards (Secretaria del Medio Ambiente Recursos Naturales y Pesca, 1997) for
unrestricted irrigation.
99
According to Blumenthal et al. (2000), the absence of fecal indicator bacteria in
wastewater may be unnecessarily strict and could result in high costs per case of infection
averted. Furthermore, they suggest that the high costs might be justifiable in
industrialized countries with low levels of endemic enteric disease. However, that may
not be justifiable in countries with higher levels of endemic enteric infections, where
these diseases are more often transmitted through poor hygiene and sanitation than
through wastewater reuse and where resources for preventive health care are limited. The
authors recommend that other potential sources of crop contamination should be
considered such as crop handling, transportation, and the sale of produce in unhygienic
markets.
Conclusions
In spite of the great difference in the microbial water quality of IW and WW used
to irrigate the vegetables tested in this study, no significant differences were found in the
microbiological quality of field harvested vegetables after ten to fourteen days. The
highest level of microbial contamination was found on carrots, followed by lettuce with
even lower microbial concentrations on green peppers.
Although the differences in microbial numbers between IW and WW were around
three to four logs, no significant differences were found in either the soil microbial
populations or the vegetable. Lack of these differences may be due to indicator die-off
since the last irrigation event (10-14 days), low level of crop exposure, and the sensitivity
of the methods used to detect the enteric viruses and parasites.
100
Acknowledgments
The authors would like to express their appreciation to Eunice Guzmán, Ramses
Cuevas, and Martha Godínez, from Instituto Tecnológico de Sonora in Ciudad Obregón,
Sonora, México, for their assistance during the laboratory analysis. This project was
funded in part by the United States Department of Agriculture.
101
References
Altekruse S. F., Cohen M.L., and Swerdlow D. L.1997. Emerging foodborne diseases. Emerg. Infect. Dis., 3:285-293. American Public Health Association, American Water Works Association, and Water Environment Federation.(APHA) 1998. Standard Methods for the Examination of Water and Wastewater. Washington, D. C., American Public Health Association. Badawy, A. S., Gerba, C. P. and Kelly, L. M. 1985. Survival of rotavirus SA-11 on vegetables. Food Microbiol., 2:199-205. Badawy A. S., Rose J. B., and Gerba C.P.1990. Comparative survival of enteric viruses and coliphages on sewage irrigated grass. J. Environ. Sci. Heal. A., 25:937-952. Beuchat L. R. 1996. Pathogenic microorganisms associated with fresh produce. J. Food Protect., 59:204-216. Beuchat L. R., Nail B. V., Adler B. B., and Clavero M. R. S. 1998. Efficacy of spray application of chlorinated water in killing pathogenic bacteria on raw apples, tomatoes, and lettuce. J. Food Protect., 61:1305-1311. Bisson W. J., and Cabelli V. J. 1979. Membrane-filter enumeration method for Clostridium perfringens. Appl. Environ. Microb., 37:55-66. Blumenthal, U. J., Mara, D. D., Peasey, A., Ruiz-Palacios, G. and Stott, R. 2000 B. World Health Organ., 78:1104-16. Brackett R. E. 1992. Shelf stability and safety of fresh produce as influenced by sanitation and disinfection. J. Food Protect., 55:808-814. Ercolani G. L. 1976. Bacteriological quality assessment of fresh marketed lettuce and fennel. Appl. Environ. Microb., 31:847-852. Forrest D.M. and Gushulak B.1997. Emerging pathogens: Threat and opportunity. Perspect. Biol. Med., 40:119-125. Francis G. A., Thomas C., and O'Beirne D. 1999. The microbiological safety of minimally processed vegetables. Int. J. Food Sci. Technol., 34:1-22.
102
Garg N., Churey J. J., and Splittstoesser D.F.1990. Effect of processing conditions on the microflora of fresh-cut vegetables. J. Food Protect., 53:701-703. Geldreich, E. E., and Bordner R. H. 1971. Fecal contamination of fruits and vegetables during cultivation and processing for market. A review. J. Milk Food Technol., 34:184-195. Gortáres M. P. 1992. Problemática ambiental por aguas residuales urbanas agrícolas e industriales en el Valle del Yaqui. VIII Congreso Nacional de Ingenieria Sanitaria y Ambiental. Gortáres M. P. 1993. Evaluación de la calidad del agua residual agricola desde su origen hasta su descarga en la zona costera. Reporte de investigación, IMTA-CNA, México. Gortáres, M. P., and Castro E. L . 1993. Aspectos biotecnológicos en la auto purificatión de aguas residuales agrícolas, urbanas e industriales. Biotecnología, 3:AM115-AM118. Gortáres M. P. 1997. Impacto ambiental del reuso de aguas residuales agrícolas del Valle del yaqui en actividades agropecuarias. Reporte de investigación, SIMAC, México. Gortáres M. P. 1998. Reuso de las aguas residuales tratadas de Cd. Obregón, Sonora. Proyecto de Investigación, SIMAC, México. Han Y., Sherman D. M., Linton R. H., . Nielsen S. S, and Nelson P. E. 2000. The effects of washing and chlorine dioxide gas on survival and attachment of EC O157:H7 to green pepper surfaces. Food Microbiol., 17:521-533. Hirotani H., Naranjo J, Moroyoqui G. P., Gerba C. P.. 2002. Demonstration of indicator microorganisms on surface of vegetables on market in the United States and Mexico. J. Food Sci., 67:1847-1850. Jackson G. J. 1990. Public health and research perspectives on the microbial contamination of foods. J. Anim. Sci., 68:884-891. Jimenez B., Chávez A., and Hernández C, 1999. Alternative treatment for wastewater destinated for agriculture use. Wat. Sci. Technol., 40:355-362. Jimenez B., and Chavez-Mejia A. 1997. Treatment of Mexico City wastewater for irrigation purposes. Environ. Technol., 18:721-730. Majkowski J. 1997. Strategies for rapid response to emerging foodborne microbial hazards. Emerg. Infect. Dis., 3:551-554.
103
Martinez-Acuña M.A. 2002. Determinación de huevos de helmino en el efluente de la planta de tratamiento de agua residual "zona sur" de Cd. Obregón, Sonora, durante el período primavera-verano 2000. Dirección de Investigación y Estudios de Posgrado. Ciudad Obregón, Sonora, México, Instituto Tecnológico de Sonora: 128 pp. Miller M. A. and Paig J. C. 1998. Other food borne infections. Vet. Clin. N. Am.-Food A., 14: 71-89. Miller A. J., Smith J. L., Buchanan R. L. 1998. Factors affecting the emergence of new pathogens and research strategies leading to their control. J. Food Safety, 18:243-263. Monge R., and M.L. Arias. 1996. Presence of various pathogenic microorganisms in fresh vegetables in Costa Rica. Arch. Latinoam. Nutr.,. 46:292-294. Monge R. and Chinchilla M. 1996. Presence of Cryptosporidium Oocysts in fresh vegetables. J. Food Protect., 59:202-203. Monge R., Chinchilla M., and Reyes L. 1996. Seasonality of parasites and intestinal bacteria in vegetables that are consumed raw in Costa Rica. Rev. Biol. Trop., 44:369-375. Nguyen-The C. and Carlin F. 1994. The microbiology of minimally processed fresh fruits and vegetables. Crit. Rev. Food Sci. Nut., 34:371-401. Noy J. and Feinmesser A. 1977. Chapter 3. The use of wastewater for agricultural irrigation, 73-92. In Water renovation and reuse (H. I. Shuval editor). New York, Academic Press. Pepper, I. L., Gerba C. P:, Brendecke J. W. 1995. Environmental Microbiology: A Laboratory manual. Academic Press, San Diego, CA. Rose J. B. 1986. Microbial aspects of wastewater reuse for irrigation. Crit. Rev. Environ. Contr., 16:231-256.
Rowe D. R. and Abdel-Magids I M. 1995. Handbook of waste water reclamation and
reuse, p 1-13. Boca Raton, CRC Lewis Publishers. Seo K. H. and Frank J. F. 1999. Attachment of Escherichia coli O157:H7 to lettuce leaf surface and bacterial viability in response to chlorine treatment as demonstrated by using conofocal scanning laser microscopy. J. Food Protect., 62:3-9. Sadovski A.Y., Fattal B., and Katzenelson E. 1974. Evaluation of methods for a quantitative estimation of microbial contamination of sewage irrigated vegetables. Fifth Scientific Conference of the Israel Ecological Society, Tel Aviv, Israel.
104
Sadovski A. Y., Fattal B., and Goldberg D. 1978a. Microbial contamination of vegetables irrigated with sewage effluent by the drip method. J. Food Protect., 41:336-340. Sadovski A.Y., Fattal B, Goldberg D., Katzenelson E., and Shuval H I. 1978b. High levels of microbial contamination of vegetables irrigated with wastewater by the drip method. Appl. Environ. Microb., 36:824-30. Scott, J.A. (1994). Chapter 7: Viruses. In Methods of soil analysis: Microbiological and biochemical properties (Mickelson S. H. and Bigham J.M editors). Madison, Wisconsin, Soil Science Society of America, Inc. Part2:117-118.
Secretaría del Medio Ambiente Recursos Naturales y Pesca, SEMARNAP. (1997) NOM-001-ECOL-1996 - Que establece los límites máximos permisibles de contaminantes en las descargas de aguas residuales en agua y bienes nacionales. Diario Oficial de la Federación, January 6, 1997. Mexico City.
Shuval H., Lampert Y., and Fattal B. 1997. Development of a risk assessment approach for evaluating wastewater reuse standards for agriculture. Water Sci. and Technol., 35:15-20. Shuval H.I., Wax Y, Yekutiel P., and Fattal B. 1989. Transmission of enteric disease associated with wastewater irrigation: a prospective epidemiological study. Am J. Public Health, 79:850-852.
Tierney J. T., Sullivan R., and Larkin E. P.. 1977. Persistence of poliovirus 1 in soil and on vegetables grown in soil previously flooded with inoculated sewage sludge or effluent. Appl. And Environ. Microb., 33:109-113. Turco R. F. 1994. Chapter 9: Coliform bacteria. In Methods of Soil Analysis: Microbiological and Biochemical Properties (Mickelson S. H. and Bigham J.M editors). Madison, Wisconsin, Soil Science Society of America, Inc. Part2:145-158.
Ward B. K. and Irving L. G.. 1987. Virus survival on vegetables spray-irrigated with wastewater. Wat. Res., 21:57-63.
Wollum A. G. 1994. Soil sampling for microbiological analysis. In Methods of Soil Analysis. Part 2: Microbiological and Biochemical properties (Mickelson s. H. and Bigham J. M.). Madison, Wisconsin, Soil Science Society of America, Inc. Part 2:2-13. World Health Organization WHO. 1989. Health Guidelines for the use of Wastewater in Agriculture and Aquaculture. Geneva, World Health Organization: 63 pp.

105
Zuberer D.A. (1994). Chapter 8: Recovery and enumeration of viable bacteria. In Methods of Soil Analysis: Microbiological and Biochemical Properties (Mickelson S. H and Bigham J M.). Madison, Wisconsin, Soil Science Society of America, Inc. Part 2:119-144.
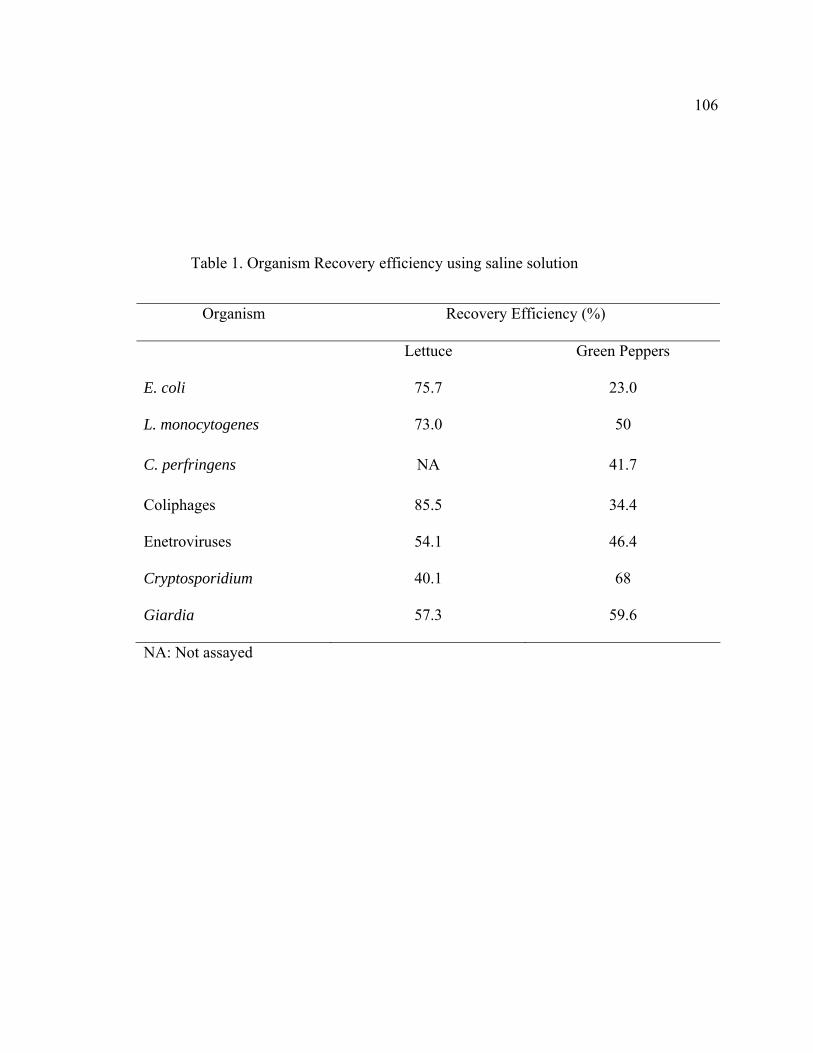
106
Table 1. Organism Recovery efficiency using saline solution
NA: Not assayed
Organism Recovery Efficiency (%)
Lettuce Green Peppers
E. coli 75.7 23.0
L. monocytogenes 73.0 50
C. perfringens NA 41.7
Coliphages 85.5 34.4
Enetroviruses 54.1 46.4
Cryptosporidium 40.1 68
Giardia 57.3 59.6

Table 2. Microbiological Analysis of Irrigation Water (IW) and Wastewater (WW). All organism numbers are Log10
Statistics Total
Coliform (MPN/1)
E. coli
(MPN/1)
Coliphage (PFU/1)
C. perfringens
(CFU/1)
Enteroviruses
(MPN/1)
Giardia (Cysts/1)
Cryptosporidium
(Oocysts/1) IW WW IW WW IW WW IW WW IW WW IW WW IW WW Number of Samples
15 15 18 18
18 18
18 15
5 5
5 5
5 5
Minimum 3.91 7.38 2.04 7.30 2.00 6.20 2.00 4.71 NA 1.94 NA 4.84 NA 3.80 Maximum 5.89 8.62 4.70 8.21 2.94 7.55 3.53 5.58 NA 4.18 NA 5.67 NA 4.78 Median 4.67 8.05 3.61 7.62 2.00 6.62 2.81 5.37 <-1.65 3.01 <0.124 5.22 <0.124 4.10 Geometric Mean 4.71 8.02 3.41 7.69 2.12 6.73 2.75 5.20 <-1.65 2.91 <0.124 5.21 <0.124 4.16 Standard Deviation 0.56 0.40 0.92 0.28 0.29 0.36 0.46 0.33 NA 0.85 NA 0.34 NA 0.37
IW : Irrigation water WW: Wastewater NA: Not applicable because none detected
107

Table 3. Soil Microbiological Analysis before and after Irrigation with Wastewater
Statistics Units C. perfringens Before Alter
Total Coliforms Before Alter
E. coli Before After
No. of samples 12 12 12 8 12 6 Minimum (CFU/g) 33 23 NED 2 NED 4.3 Maximum (CFU/g) 1300 330 NED 120 NED 110 Median (CFU/g) 152 97 NED 15 NED 12.0 Geometric Mean (CFU/g) 321 145 NED 40 NED 42.2 Standard Deviation 392 111 NED 48.31 NED 52.6 NED: Not enough data, because all data were below detection limit (≤3.30 CFU/g)
108
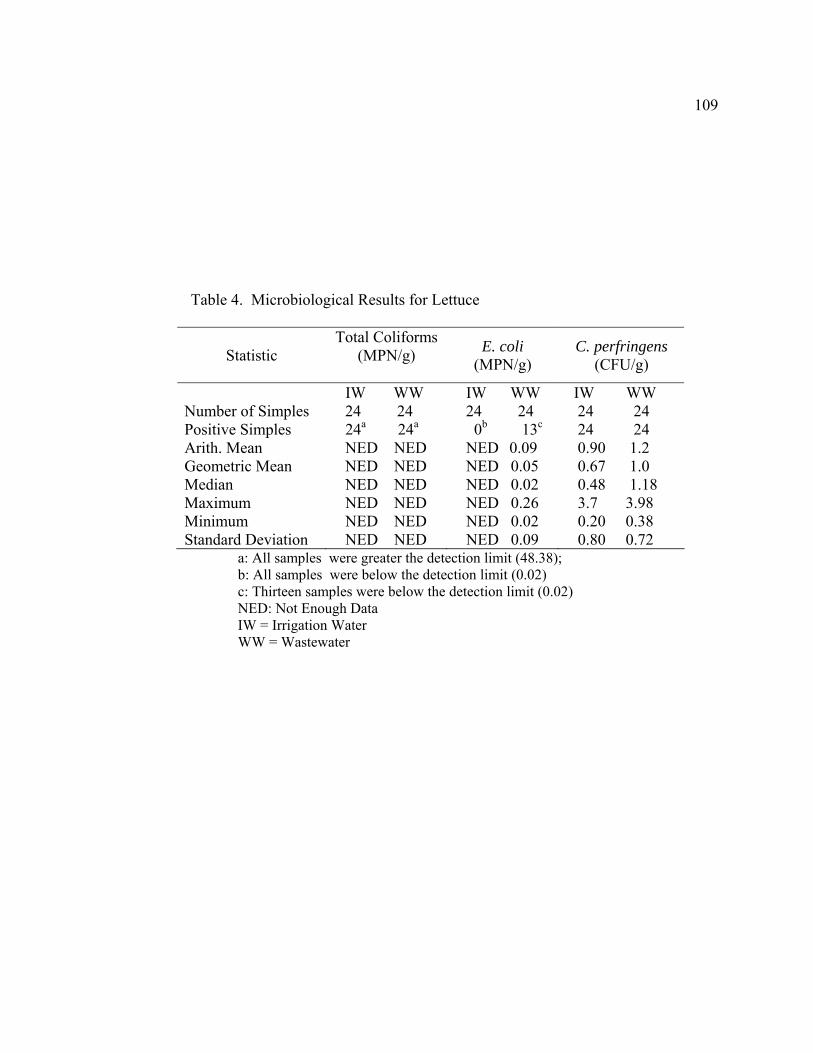
109
Table 4. Microbiological Results for Lettuce
Statistic Total Coliforms
(MPN/g)
E. coli (MPN/g)
C. perfringens (CFU/g)
IW WW IW WW IW WW Number of Simples 24 24 24 24 24 24 Positive Simples 24a 24a 0b 13c 24 24 Arith. Mean NED NED NED 0.09 0.90 1.2 Geometric Mean NED NED NED 0.05 0.67 1.0 Median NED NED NED 0.02 0.48 1.18 Maximum NED NED NED 0.26 3.7 3.98 Minimum NED NED NED 0.02 0.20 0.38 Standard Deviation NED NED NED 0.09 0.80 0.72
a: All samples were greater the detection limit (48.38); b: All samples were below the detection limit (0.02) c: Thirteen samples were below the detection limit (0.02) NED: Not Enough Data IW = Irrigation Water WW = Wastewater
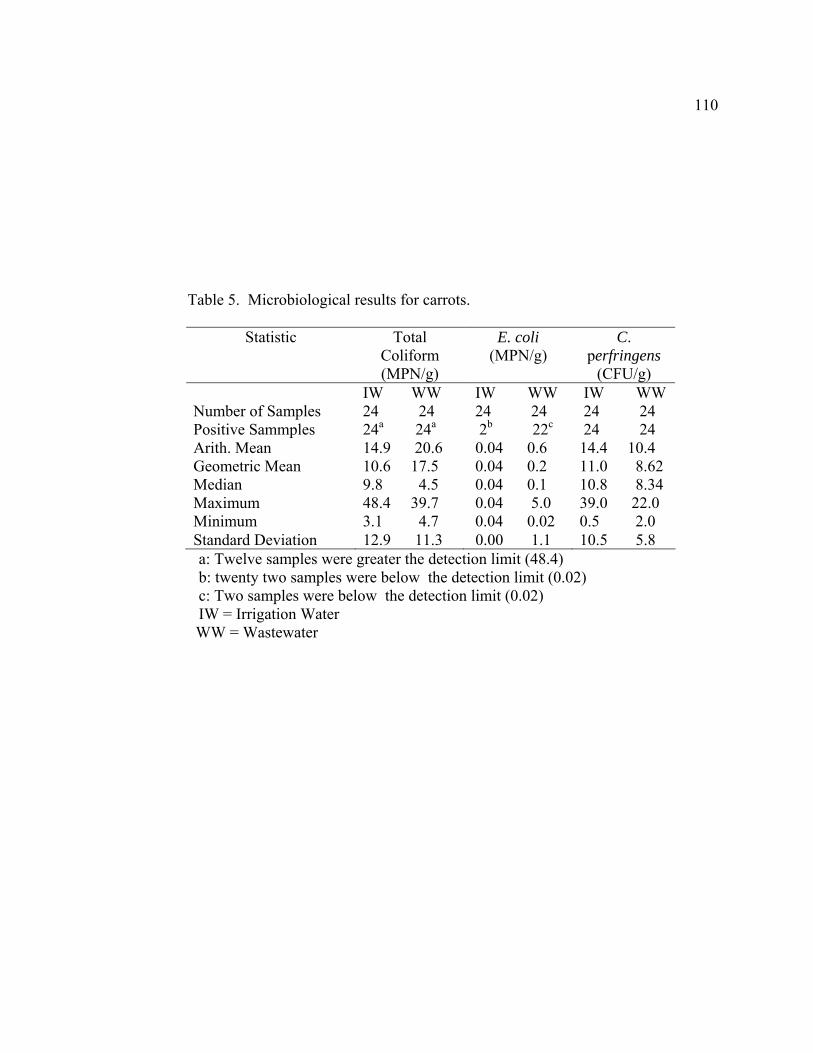
110
Table 5. Microbiological results for carrots.
Statistic Total Coliform (MPN/g)
E. coli (MPN/g)
C. perfringens
(CFU/g) IW WW IW WW IW WW Number of Samples 24 24 24 24 24 24 Positive Sammples 24a 24a 2b 22c 24 24 Arith. Mean 14.9 20.6 0.04 0.6 14.4 10.4 Geometric Mean 10.6 17.5 0.04 0.2 11.0 8.62 Median 9.8 4.5 0.04 0.1 10.8 8.34 Maximum 48.4 39.7 0.04 5.0 39.0 22.0 Minimum 3.1 4.7 0.04 0.02 0.5 2.0 Standard Deviation 12.9 11.3 0.00 1.1 10.5 5.8
a: Twelve samples were greater the detection limit (48.4) b: twenty two samples were below the detection limit (0.02) c: Two samples were below the detection limit (0.02)
IW = Irrigation Water WW = Wastewater
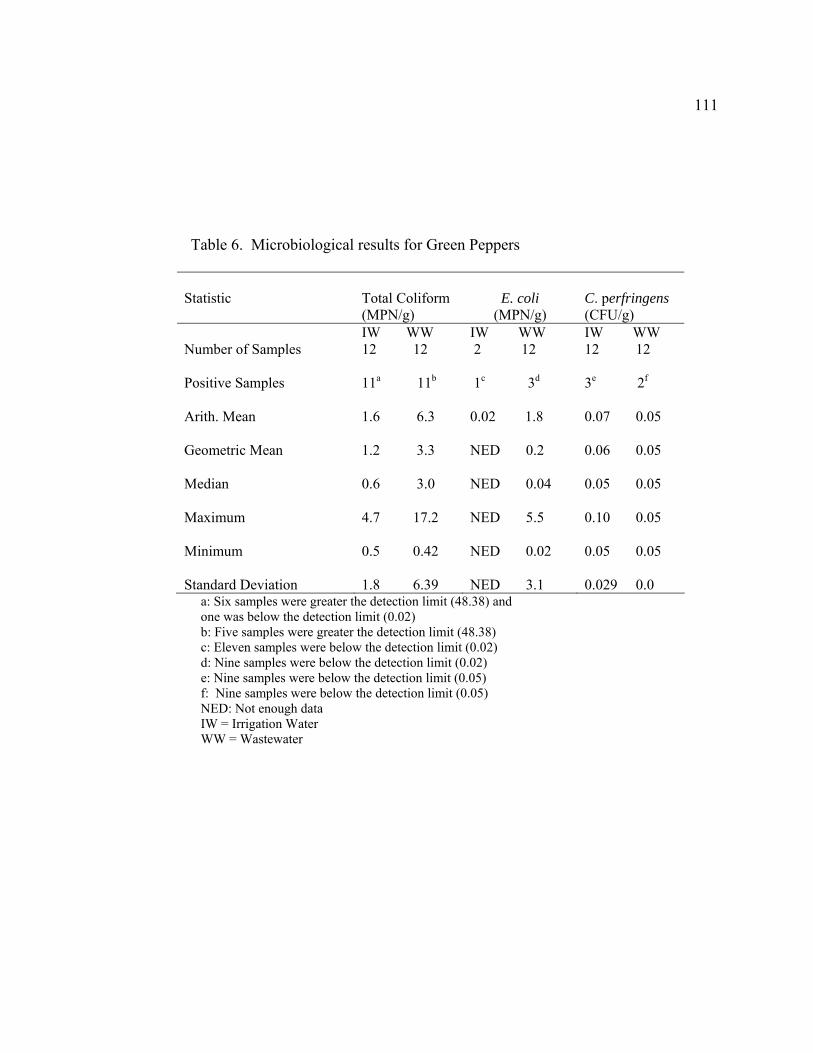
111
Table 6. Microbiological results for Green Peppers
Statistic
Total Coliform (MPN/g)
E. coli
(MPN/g)
C. perfringens (CFU/g)
IW WW IW WW IW WW Number of Samples 12 12 2 12 12 12 Positive Samples
11a 11b
1c 3d
3e 2f
Arith. Mean
1.6 6.3
0.02 1.8
0.07 0.05
Geometric Mean
1.2 3.3
NED 0.2
0.06 0.05
Median
0.6 3.0
NED 0.04
0.05 0.05
Maximum
4.7 17.2
NED 5.5
0.10 0.05
Minimum
0.5 0.42
NED 0.02
0.05 0.05
Standard Deviation
1.8 6.39
NED 3.1
0.029 0.0
a: Six samples were greater the detection limit (48.38) and one was below the detection limit (0.02)
b: Five samples were greater the detection limit (48.38) c: Eleven samples were below the detection limit (0.02) d: Nine samples were below the detection limit (0.02) e: Nine samples were below the detection limit (0.05) f: Nine samples were below the detection limit (0.05) NED: Not enough data IW = Irrigation Water WW = Wastewater


