
GG 711: Advanced Techniques in Geophysics and Materials Science
Pavel Zinin HIGP, University of Hawaii, Honolulu, USA
Nano-Microscopy. Lecture 3.
Microanalysis in Electron Microscopy
(EDS and WDS)
www.soest.hawaii.edu\~zinin

Electron Structure of Atoms and Quantum Numbers
Max Planck in 1900 first began to analyze atomic structure in terms of the then-
developing quantum theory of energy. Plank proposed that an oscillating (ionized)
atom could not have any arbitrary energy, but rather only certain selected energy
values (quanta) were possible. Plank reasoned that if only certain energy levels were
possible, there ought to be a relationship between the energy of an atom undergoing
change and both the energy and wavelength of the radiation emitted during the
process. He suggested that the wavelength of electromagnetic radiation, , its
frequency, , and its energy, E, are related:
where n is a positive integer, h is Plank's constant (6.626×10⁻³⁴Joule·sec), and c is the
speed of light (3.0×10⁸m/s). In x-ray physics, E is measured in electron volts, eV, and is
a unit of energy (1.6021×10⁻¹⁹ J/eV), such that E = hc = 12.397 (eV·Å).
nhcE nhn
l= =
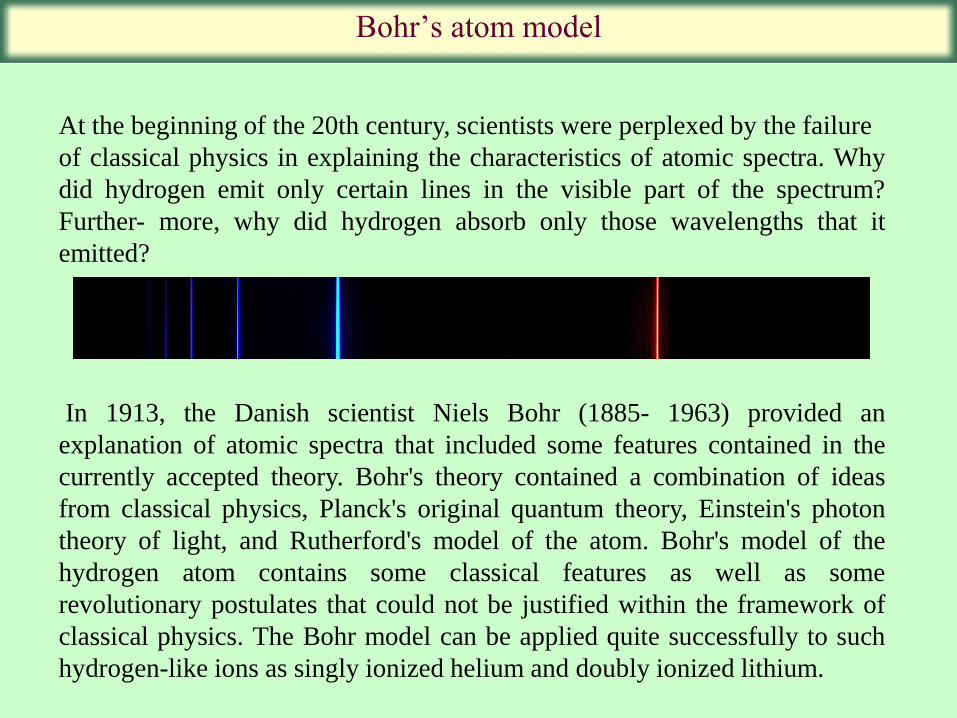
Bohr‘s atom model
At the beginning of the 20th century, scientists were perplexed by the failure
of classical physics in explaining the characteristics of atomic spectra. Why
did hydrogen emit only certain lines in the visible part of the spectrum?
Further- more, why did hydrogen absorb only those wavelengths that it
emitted?
In 1913, the Danish scientist Niels Bohr (1885- 1963) provided an
explanation of atomic spectra that included some features contained in the
currently accepted theory. Bohr's theory contained a combination of ideas
from classical physics, Planck's original quantum theory, Einstein's photon
theory of light, and Rutherford's model of the atom. Bohr's model of the
hydrogen atom contains some classical features as well as some
revolutionary postulates that could not be justified within the framework of
classical physics. The Bohr model can be applied quite successfully to such
hydrogen-like ions as singly ionized helium and doubly ionized lithium.
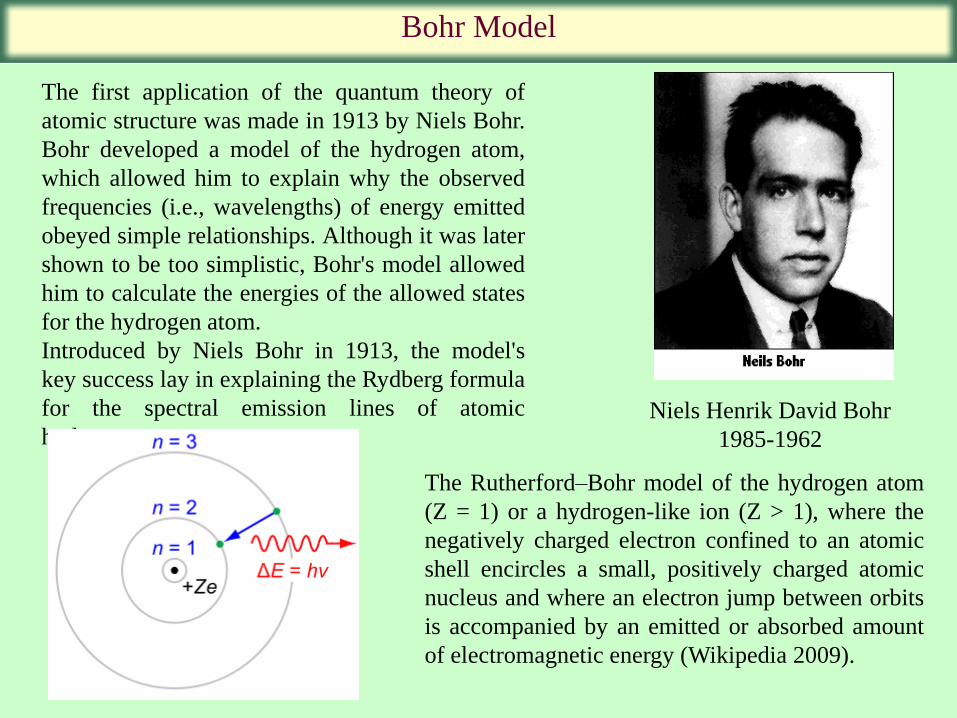
Bohr Model
The first application of the quantum theory of
atomic structure was made in 1913 by Niels Bohr.
Bohr developed a model of the hydrogen atom,
which allowed him to explain why the observed
frequencies (i.e., wavelengths) of energy emitted
obeyed simple relationships. Although it was later
shown to be too simplistic, Bohr's model allowed
him to calculate the energies of the allowed states
for the hydrogen atom.
Introduced by Niels Bohr in 1913, the model's
key success lay in explaining the Rydberg formula
for the spectral emission lines of atomic
hydrogen.
The Rutherford–Bohr model of the hydrogen atom
(Z = 1) or a hydrogen-like ion (Z > 1), where the
negatively charged electron confined to an atomic
shell encircles a small, positively charged atomic
nucleus and where an electron jump between orbits
is accompanied by an emitted or absorbed amount
of electromagnetic energy (Wikipedia 2009).
Niels Henrik David Bohr
1985-1962

Quantum Numbers
1. l. The electron moves in circular orbits about the nucleus (the planetary model
of the atom) under the influence of the Coulomb force of attraction between the
electron and the positively charged nucleus.
2. The electron can exist only in very specific orbits; hence the states are quantized
(Planck's quantum hypothesis). The allowed orbits are those for which the angular
momentum of the electron about the nucleus is an integral multiple of h/2π, where
h is Planck's constant. The angular momentum of the electron is mvr, where m is
the mass of electron, r is radius of the orbit, V is the linear velocity. Applying the
condition that the angular momentum is quantized, we have
mVr=nh/2π
Bohr could determine the energy spacing between levels using rule
3 and come to an exactly correct quantum rule: the angular
momentum L is restricted to be an integer multiple of a fixed unit:
2
hnL
where n = 1, 2, 3, ... is called the principal quantum number. The lowest value of n is 1; this
gives a smallest possible orbital radius of 0.0529 nm known as the Bohr radius. Once an
electron is in this lowest orbit, it can get no closer to the proton.

Quantum Numbers
4. The frequency of the radiation emitted at an orbit of period T is as it would
be in classical mechanics; it is the reciprocal of the classical orbit period:
where n = 1, 2, 3, ... is called the principal quantum
number. The lowest value of n is 1; this gives a smallest
possible orbital radius of 0.0529 nm known as the Bohr
radius. Once an electron is in this lowest orbit, it can get no
closer to the proton.
nhEEE 12
T
1
3. The electrons do not continuously lose energy as they travel. They can only gain and
lose energy by jumping from one allowed orbit to another, absorbing or emitting
electromagnetic radiation with a frequency determined by the energy difference of
the levels according to the Planck relation

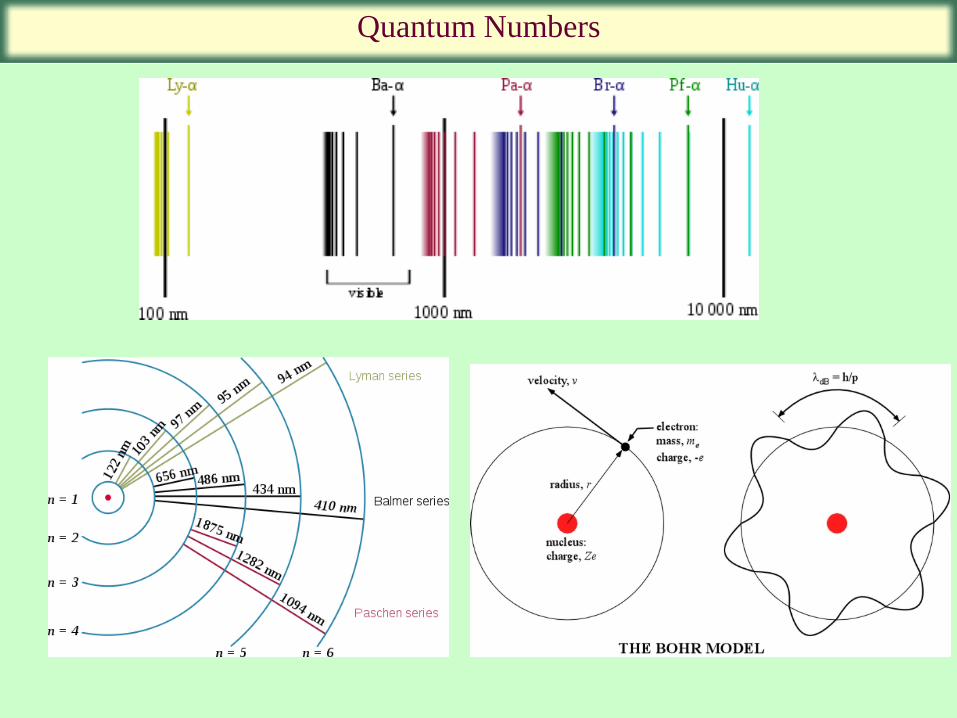
De Broglie Waves and the Hydrogen Atom
(a) Standing wave pattern
for an electron wave in a
stable orbit of hydrogen.
There are three full
wavelengths in this orbit.
(b) Standing wave pattern
for a vibrating stretched
string fixed at its ends.
This pattern has three full
wavelengths
In general, the condition for a de Broglie standing wave in an electron orbit is that the
circumference must contain an integral multiple of electron wavelengths. We can express
this condition as
De Broglie's equation for the wavelength of an electron in terms of its momentum is
This is precisely the quantization of angular momentum condition imposed by Bohr in his
original theory of hydrogen. The electron orbit shown in Figure contains three complete
wavelengths and corresponds to the case where the principal quantum number n equals three.
The orbit with one complete wavelength in its circumference
Quantum Numbers

Quantum Numbers
n principal quantum
number
The principle quantum number (n): The principle quantum number (n) can
include any positive integral value. It determines the major energy level of
an electron. It is designated K, L and M for n = 1, 2 and 3 respectively. The
maximum number of electrons allowed is 2n2.
There are a set of quantum numbers associated with the energy states of the atom. The four quantum
numbers n, l, m, and s specify the complete and unique quantum state of a single electron in an atom
called its wavefunction or orbital. No two electrons belonging to the same atom can have the same four
quantum numbers which is shown in the Pauli exclusion principle.
The bound state energies of the
electron in the hydrogen atom are
given by:
2
13.6
1,2,3,4...
n
eVE
n
n
- ´=
=

Maximum number of electrons in any electron shell = 2n2
n = 1 2(1)2 = 2
n = 2 2(2)2 = 8
n = 3 2(3)2 = 18
Each principal energy level, which is known as a shell, has one or more subshells
NOTE: Electrons generally fill into shells with smallest n first; however, the filling
order gets more complicated after Argon (element 18).
Number of Electrons
For the first 20 electrons:
Shell 1 2 3 4
2e 8e 8e 2e

Quantum Numbers
• The azimuthal momentum quantum number (l): The azimuthal or angular momentum
number (or orbital angular momentum quantum number, second quantum number)
symbolized as l, is a quantum number for an atomic orbital that determines its orbital
angular momentum and describes the shape of the orbital. Higher values of l correspond
to greater angular momentum. L may assume integer values from 0 to n-1. The orbitals
are s, p, d and f for l = 0, 1, 2 and 3 respectively. The orbitals have distinctive shapes. The
maximum number of electrons allowed is: s = 2, p = 6, d = 10 and f = 14.
The d-orbitals The s-orbitals
The magnetic quantum number (m): An
electron with angular momentum generates a
magnetic field. m can assume any integer
from -l to +l.

Quantum Numbers
•The spin quantum number: A small "particle", like an electron, spinning on its own axis
also behaves as a small magnet, hence the electron itself has an intrinsic magnetic
property. We say that the electron has a spin and describe it as being either +1/2 or -1/2.
Electron Spin and the Pauli Exclusion
Principle
Since electron spin is quantized, we define
ms = spin quantum number = ½.
Pauli‘s Exclusions Principle: no two
electrons can have the same set of 4
quantum numbers. Therefore, two
electrons in the same orbital must have
opposite spins.
The specific quantum numbers assigned to
the electrons are determined by
thermodynamic considerations that require
the occupation of states having the lowest
energies first, and the Pauli Exclusion
Principle.

Interaction of electrons with matter in an electron microscope
•Back scatter electrons – compositional
•Secondary electrons – topography
• X-rays – chemistry

History of X-rays and EDS
• 1912, von Laue, Friedrich and Knipping observe X-
ray diffraction. Laue demonstrated with the dispersion
of x-rays that their wavelength must be on the order of
atomic dimensions. Subsequently, the wavelengths of
characteristic x-ray radiation were measured to be in
the range of 10 -8 to 10 -11 meters, and the dimensional
unit angstrom (Å=10 –10 m) was introduced.
•The theory of diffraction of x-rays, originally
proposed by Laue, was conclusively demonstrated by
W.H. Bragg and W.L. Bragg in 1913 by obtaining the
first x-ray diffraction pattern a sodium chloride crystal.
• 1913, Henry G.J. Moseley was researching the
characteristics of x-ray emission from different target
materials. He noticed a systematic progression of x-ray
wavelengths with increasing atomic number of the
material generating the radiation. Based on this
regularity, the previously unknown elements hafnium
and rhodium were discovered with x-ray spectral
analysis. Photographic recording of Kα
and Kβ x-ray emission lines for
a range of elements

History of X-rays
Z
The next year, he was killed in Turkey in WWI. ―In view of what he might still have accomplished
(he was only 27 when he died), his death might well have been the most costly single death of the
war to mankind generally,‖ says Isaac Asimov (Biographical Encyclopedia of Science
&Technology).
Moseley found that
wavelength of characteristic
X-rays varied systematically
(inversely) with atomic
number
where: f is the frequency of the main or K x-
ray emission line k1 and k2 are constants that
depend on the type of line. For example, the
values for k1 and k2 are the same for all K lines,
so the formula can be rewritten thus:
f = (2.47 × 10¹⁵ (Z - 1)2 Hz
21 kZkf
Henry G. J. Moseley
(1887-1915)

EM Spectrum Lines Produced by Electron Shell Ionization
Number Name Permitted
Values
Defines
n Principal (1, 2, 3, …) Electron shell
(1=K, 2=L, 3=M
…)
l Azimuthal 0 to n-1 Electron cloud
shape
m Magnetic -l to +l Electron shell
orientation in a
magnetic field
s Spin ±½ Electron spin
direction
j Inner precession l±½
But j≠-½
Total angular
momentum

Inner-shell ionization:
Production of X-ray
(Goldstein et al, 1992, p 120)
Incident electron knocks inner
shell (K here) electron out of its
orbit (time=1). This is an
unstable configuration, and an
electron from a higher energy
orbital (L here) ‗falls in‘ to fill
the void (time=2). There is an
excess of energy present and
this is released internally as a
photon. The photon has 2 ways
to exit the atom (time=3), either
by ejecting another outer shell
electron as an Auger electron
(L here, thus a KLL transition),
or as X-ray (KL transition).
K shell
L shell
(=photoelectron)
Blue Lines indicate
subsequent times: 1
to 2, then 3 where
there are 2 alternate
outcomes
Time
1
2
3

History of the Electron Microprobe Microscopy
In order to return the atom to its
normal state, an electron from
an outer atomic shell ―drops‖
into the vacancy in the inner
shell. This drop results in the
loss of a specific amount of
energy, namely, the difference
in energy between the vacant
shell and the shell contributing
the electron. This energy is
given up in the form of
electromagnetic radiation x-
rays. Since energy levels in all
elements are different, element-
specific, or characteristic, x-
rays are generated.

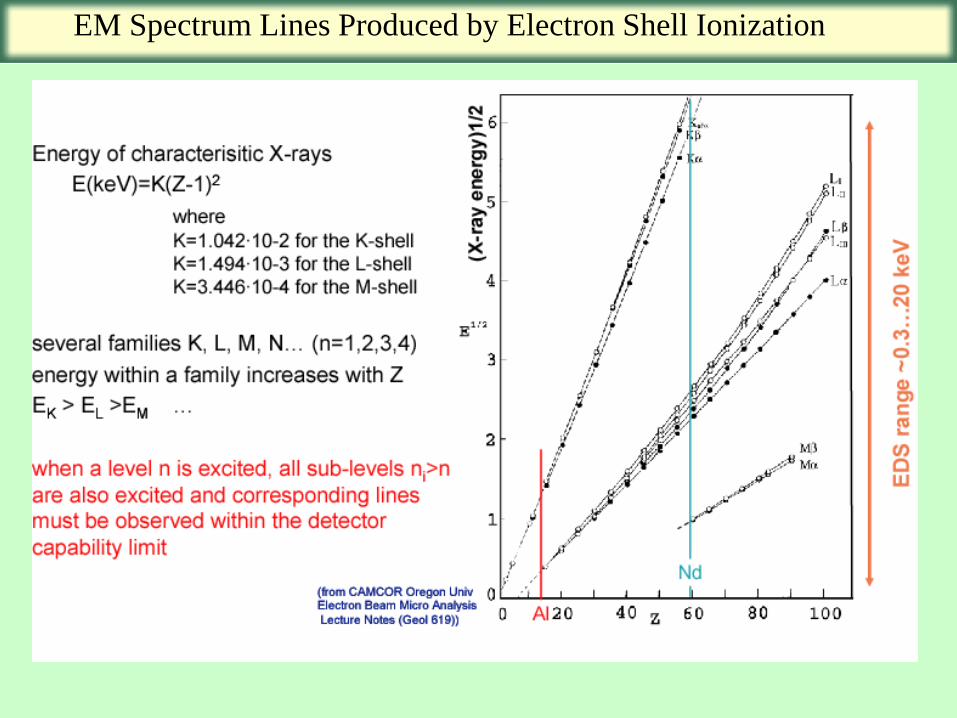
EM Spectrum Lines Produced by Electron Shell Ionization
K X-ray is produced due to removal of K shell electron, with L shell electron taking its place.
K occurs in the case where K shell electron is replaced by electron from the M shell.
L X-ray is produced due to removal of L shell electron, replaced by M shell electron.
M X-ray is produced due to removal of M shell electron, replaced by N shell electron.
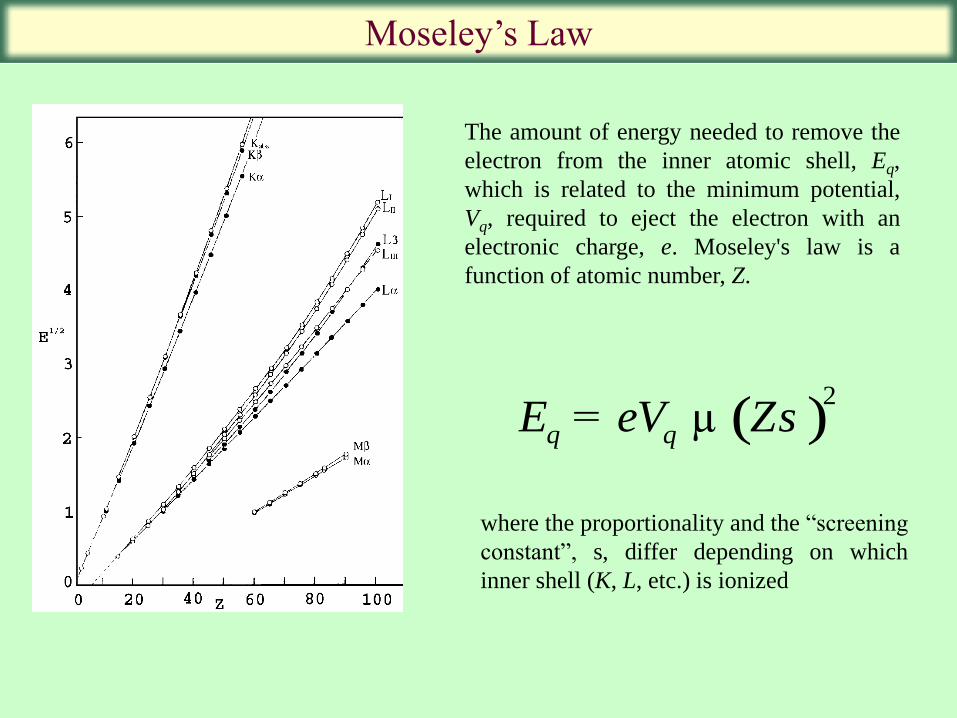
Moseley‘s Law
( )2
q qE eV Zs= µ
The amount of energy needed to remove the
electron from the inner atomic shell, Eq,
which is related to the minimum potential,
Vq, required to eject the electron with an
electronic charge, e. Moseley's law is a
function of atomic number, Z.
where the proportionality and the ―screening
constant‖, s, differ depending on which
inner shell (K, L, etc.) is ionized
EM Spectrum Lines Produced by Electron Shell Ionization

X-ray spectroscopy in SEM
X-ray spectrometers are of two kinds.
(a) The energy-dispersive (ED) type records X-rays
of all energies effectively simultaneously and
produces an output in the form of a plot of
intensity versus X-ray photon energy. The
detector consists of one of several types of
device producing output pulses proportional in
height to the photon energy.
(b) The wavelength-dispersive (WD) type makes
use of Bragg reflection by a crystal, and operates
in 'serial' mode, the spectrometer being 'tuned' to
only one wavelength at a time. Several crystals
of different interplanar spacings are needed in
order to cover the required wavelength range.
Spectral resolution is better than for the ED type,
but the latter is faster and more convenient to
use. X-ray spectrometers attached to SEMs are
usually of the ED type, though sometimes a
single multi-crystal WD spectrometer is fitted.

SEM with EDS
EDS detector
SEM combined with Energy
dispersive spectrometer (EDS)
and Wavelength Dispersive
Spectrometer (WDS).
WDS
spectrometers

•The central component of an EDS system is a solid-state detector, consisting of a
semiconductor. As each X-ray photon hits the detector, a very small current is produced by
knocking out electrons from the semi-conductor.
•How the EDS Detector Works: The EDS detector converts the energy of each individual
X-ray into a voltage signal of proportional size. This is achieved through a three stage
process. Firstly the X-ray is converted into a charge by the ionization of atoms in the
semiconductor crystal. Secondly this charge is converted into the voltage signal by the field
effect transistor (FET) preamplifier. Finally the voltage signal is input into the pulse
processor for measurement. The output from the preamplifier is a voltage ‗ramp‘ where
each X-ray appears as a voltage step on the ramp.
•How the crystal converts X-ray energy into charge: When an incident X-ray strikes the
detector crystal its energy is absorbed by a series of ionizations within the semiconductor to
create a number of electron-hole pairs. The electrons are raised into the conduction band of
the semiconductor and are free to move within the crystal lattice. When an electron is raised
into the conduction band it leaves behind a ‗hole‘, which behaves like a free positive charge
within the crystal. A high bias voltage, applied between electrical contacts on the front face
and back of the crystal, then sweeps the electrons and holes to these opposite electrodes,
producing a charge signal, the size of which is directly proportional to the energy of the
incident X-ray.
•The charge is converted to a voltage signal by the FET preamplifier.
How the EDS Detector Works

There are several types of solid state EDS
detectors, the most common (cheapest) being the
Si-Li detector. Components: thin window (Be, C,
B); SiLi crystal, FET (field effect transistor: initial
amp), vacuum, cold finger, preamp, amp and MDA
electronics (―multi channel analyzer‖).
EDS assemblage
Goldstein et al fig 5.21

EM Spectrum Lines Produced by Electron Shell Ionization

EM Spectrum Lines Produced by Electron Shell Ionization

Synthesis of BCx diamonds
SEM image of the
post-heated BC3
sample recovered
from 50 GPa and
2033 K and with
the NaCl layer
being removed.
Marker is 10 m.
200 400 600 800 1000 1200 1400 1600 180010000
15000
20000
25000
30000
35000
Wavenumber/cm-1
Ram
an I
nte
nsi
ty/C
ounts
(a)
C-K map
B-K map
Raman spectrum of
the BC3 sample
after laser heating
(50 GPa, 2033 ±
241 K)

Synthesis of cubic C3N4 diamonds
(a) SEM image of the recovered C3N4
sample after heating to 2000 K at 33
GPa. Marker is 100 m. (b) map of the
nitrogen distribution; (c) map of the
carbon distribution.
(a)

Generic EMPA/SEM WDS
Each element produces a unique set of characteristic X-
rays when bombarded with electrons. Each X-ray will
have a specific energy and wavelength. Energy
dispersive spectrometers (EDS) sort the X-rays based
on their energy; while wavelength dispersive
spectrometers (WDS) sort the X-rays based on their
wavelengths. WDS systems use X-ray diffraction as the
means by which they separate X-rays of different
wavelengths. The spectrometer consists of an analyzing
crystal and a detector. Those X-rays that hit the crystal
and diffract will enter the detector. Whether an X-ray
photon will diffract depends on its wavelength, the
orientation of the crystal, and the crystal‘s lattice
spacing. Only X-rays of a given wavelength will enter
the detector at any one time. To measure X-rays of
another wave length, the crystal and detector are moved
to a new position. Since a specific WO spectrometer
can measure only one X-ray wavelength at a time, it is
important that a WDS system has an array of
spectrometers in order to work efficiently. Electron
micro- probes typically have up to five WO
spectrometers, allowing them to measure five elements
simultaneously.

The most convenient wave to write down introduce equation describing a plane wave is
to use complex exponent ei
exp cos sin : cos sin ;i kx ti i Ae A kx t iA kx t
X-ray as a plane wave

E
The two x-ray beams travel at different distances. This difference is related to the
distance between parallel planes. We connect the two beams with perpendicular lines
(CD and CF) and obtain two equivalent right triangles. CE = d (interplanar distance)
d
D F
C
EFDEdd
DE sin;sin
m
k
mlength path in differenceDEEFd sin2
• The angle of incidence of the x-rays
is
• The angle at which the x-rays are
diffracted is equal to
• the angle of incidence,
• The angle of diffraction is the sum
of these two angles, 2
Deriving Bragg‘s equation
Reflection (signal) only occurs when conditions for constructive interference between
the beams are met. These conditions are met when the difference in path length equals an
integral number of wavelengths, m. The final equation is the BRAGG‘S LAW
mk
mDEEFd sin2

WDS
The fact that characteristic x-ray photons are described by either their energy or their
wavelength enables us to isolate and count x-rays for a desired element either by
discrimination baseed on energy or by wavelength. This fact produces two principal
types of x-ray detection systems:
WDS: wavelength dispersive detection system in which x-rays from different
elements are recognized and separated from one another by their wavelength using
Bragg diffraction. WDS systems use X-ray diffraction as the means by which they
separate X-rays of different wavelengths. The spectrometer consists of an analyzing
crystal and a detector. Those X-rays that hit the crystal and diff ract will enter the
detector. Whether an X-ray photon will diffract depends on its wavelength, the
orientation of the crystal, and the crystal‘s lattice spacing. Only X-rays of a given
wavelength will enter the detector at any one time. To measure X-rays of another
wave length, the crystal and detector are moved to a new position. Since a specific
WO spectrometer can measure only one X-ray wavelength at a time, it is important
that a WDS system has an array of spec trometers in order to work efficiently.
Electron micro- probes typically have up to five WO spectrometers, allowing them to
measure five elements simultane ously. Each spectrometer typically has between two
and four analyzing crystals, each with a different lattice spacing, because each type
of crystal can diffract only a given range of wavelengths
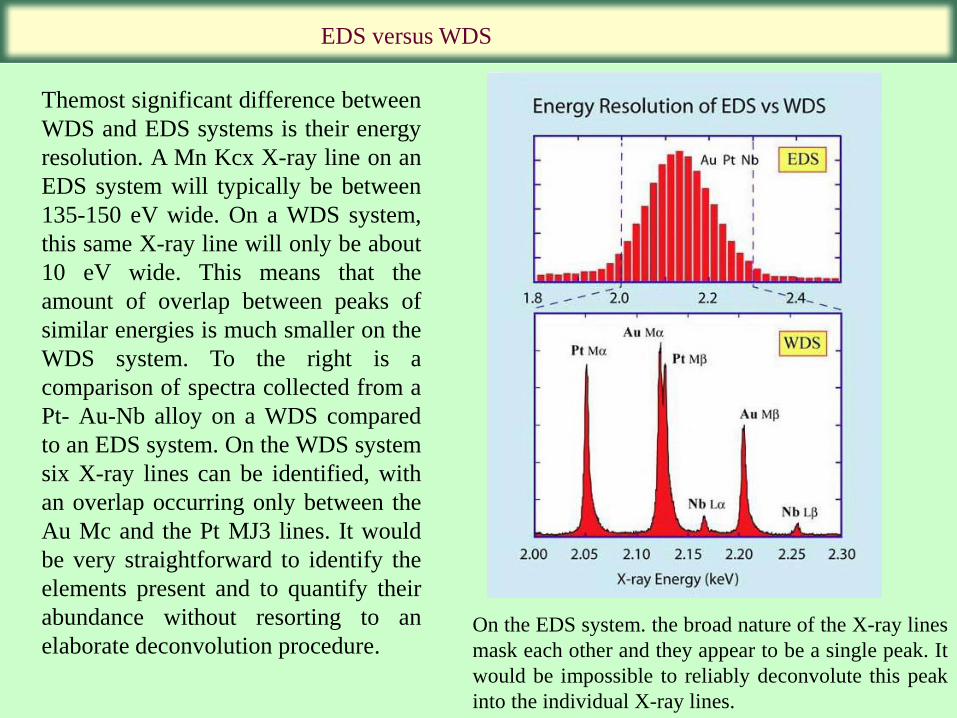
Themost significant difference between
WDS and EDS systems is their energy
resolution. A Mn Kcx X-ray line on an
EDS system will typically be between
135-150 eV wide. On a WDS system,
this same X-ray line will only be about
10 eV wide. This means that the
amount of overlap between peaks of
similar energies is much smaller on the
WDS system. To the right is a
comparison of spectra collected from a
Pt- Au-Nb alloy on a WDS compared
to an EDS system. On the WDS system
six X-ray lines can be identified, with
an overlap occurring only between the
Au Mc and the Pt MJ3 lines. It would
be very straightforward to identify the
elements present and to quantify their
abundance without resorting to an
elaborate deconvolution procedure. On the EDS system. the broad nature of the X-ray lines
mask each other and they appear to be a single peak. It
would be impossible to reliably deconvolute this peak
into the individual X-ray lines.
EDS versus WDS

EDS versus WDS
•The second major problem with EDS
systems is their low count rates and poor
reproducibility. Typically a WDS system
will have a count rate about l0x that of an
EDS system. There are some EDS
systems that can collect at a higher count
rate, but they sacrifice even more on the
energy resolution — their peaks are even
wider.
•To the left is a comparison of the
reproducibility of an EDS system and a
WDS system. The data were collected
simultanlously, so the conditions under
which they were collected were identical,
The plots show that the EDS data had
almost 8x the scatter of the WOS data.
For serious quantitative analyses, the
EDS data would not be acceptable. The
spread on the EDS data could be reduced
by counting longer, but that would also
improve the WDS data.

EDS versus WDS
•Intensities of Kα line for pure
elements (Z is atomic number)
as recordered by an EDS
spectrometer and a WD
spectrometer with different
crystals (S.J. B. Reed . Electron
Microprobe Analysis).

The picture on the [LEFT] shows a large piece of the Murchison meteorite courtesy of
the Natural History Museum, London. [RIGHT] This image is known as a 'combined X-
ray elemental map.' It was created by combining X-ray intensities due to magnesium
(red), calcium (green) and aluminum (blue) from a thin slice of the Murchison
meteorite, courtesy of Alexander Krot, a meteorite researcher at the University of
Hawai‗i. The x-rays were made by bombarding the sample with a beam of electrons in
an electron microprobe.
Mapping Elements - WDS

Mapping Elements - WDS
Combined x-ray map composed of Mg K (red), Ca K (green), and Al K (blue) of a
polished section of the Efremovka meteorite containing Ca, Al-rich inclusion E104, and
amoeboid olivine aggregate E1. The calcium-aluminum-rich inclusion (CAI) consists of
spinel ( purple), Al-diopside (dark green), anorthite (light blue), and melilite (light green). It
is surrounded by a multilayered Wark-Lovering rim and a thick forsterite-rich rim (red).
(Krot et al., Science 295 2002).
Home Work
1. Derive Bagg‘s law (SO).
2. Describe Moseley's law (KK).
3. Describe principles EDS (KK).
4. Describe principles WDS (SO).
5. Provide definition of the atomic numbers (KK).


