Download - Metallized Thermoplastic Composite
Metallized Thermoplastic Composites
EDINBURGH NAPIER UNIVERSITY
B.ENG POLYMER ENGINEERING
3RD YEAR
FINAL REPORT ON
METALLIZED THERMOPLASTIC
COMPOSITES
METRICULATION NUMBER-40081777
NAME: RAHUL R AHUJA
EMAIL ADDRESS: [email protected]
Supervisor name: Dr. Mike Barker
1

Metallized Thermoplastic Composites
Acknowledgement
I would want to like acknowledge my deepest appreciation to Dr. Mike Barker, who has attitude
and the substance of a genius; he encouraged and conveyed a spirit of adventure in regards to
research, and an excitement in regard to teaching. Without his guidance and persistence this
project wouldn’t have been possible.
I also would like to thank MS Lynn for supporting in all the testing laboratory work and showing
how to measure and follow the rules of safety for taking precautions while testing. All the testing
work was demonstrated to me and was shown properly so that I can perform all the laboratory
tests accurately.
I would like to show my sincere thanks to all the faculty members of the department of Polymer
Engineering Department. I am also thankful to my parents for their constant encouragement and
support. I am also grateful to many people who have, directly or indirectly, have lent their helping
hand in this project.
2

Metallized Thermoplastic Composites
Abstract
Polymer composites were prepared from linear low density polyethylene as the base material and
utilizing 75 % graphite coated nickel metallic fillers by melt processing technique using a
Brabender mixer at 170 C and 30 RPM spindle speed. Sample sheets were formed by pressing
into 2 mm thick plates, from which samples were taken for physical, mechanical and electrical
characteristics measurements. Composite with metallic powders concentrations ranging between 0
and 50% by weight have been prepared. Samples were utilized for tensile, electrical and
mechanical testing was prepared from hydraulic press, at 160 C for 2 minutes and then cooling into
cold press for 2 minutes. Metal filled thermoplastics composite showed average mechanical
properties degradation and they showed less conductive properties.
3

Metallized Thermoplastic Composites
Table of contents
1. Introduction………………………………………………………………………………...5
1.1 The aims and objectives………………………………………………………5
2. Literature Review…………………………………………………………………………..6
2.1 How is LLDPE made and why LLDPE? ………………………………….…..6
2.2 Applications of conductive polymers……………………………………….….6
2.3 Limitations of conductive polymers……………………………………………8
2.4 Filler concentration for electro conductive polymer composites…………..9
2.5 Effect of temperature and Dielectric breakdown………………………...….10
2.6 Dissipation factor (dielectric loss tangent)…………………………..……….11
2.7 Dispersion and distribution..................................................................…...12
2.8 Polarization and Dielectric Constant ………..……………………………….13
3. Experimental Procedure …………………………………………………………………16
3.1 Processes performed for forming plaques and mixing …………………….16
3.2 Information for Brabender Mixing and its process…………………………..17
3.3 COMPRESSION MOULDING OF THERMOPLASTIC FILLED
WITH METAL FILLERS…………………………………………….………………18
3.4 PROCESS FOR TENSILE TESTING OF PLASTICS………………………19
3.5 3 Point Bend test………………………………………………………………...20
3.6 Process for CHARPY IMPACT TESTING…………………………………….20
3.7 Electrical testing of polymers………………………………..………………….21
4. Results …………………………………………………………….…………………………..22
5. Discussion………………………………………………………….………………………….41
6. Conclusion………………………………………………………….………………………….42
7. References …………………………………………………………………………………….43
8. Appendix ……………………………………………………….………………………………44
4

Metallized Thermoplastic Composites
Introduction
Thermoplastics are polymers which soften without any chemical change and harden when cooled,
and may be remoulded many times till they degrade (Katchy, 2000). They are increasingly
replacing many materials such as metal, glass, wood and paper in many applications (Obasi,
2007). The broad spectrum of properties which are offered by variety of thermoplastics together
with the techniques of compounding them with other materials has been effective and vital tool for
achieving specific balanced combination of physical properties and processing
characteristics(Obasi,2007).Combination of thermoplastic polymers and metallic fillers are new and
interesting class of materials that when combined offer wide applications in many fields e.g.
discharging static electricity, heat conduction, gas storage, electromagnetic shielding, batteries,
solders etc. Commodity thermoplastics exhibit good mechanical and electrical properties when
filled with metallic powders. Polymer composites which contain the dispersed conductive fillers it
depends on various factors like their spatial distribution inside the polymer matrix, shape and size
of the filler particles, the filler surface and its interaction with the polymer matrix, and adjacent
particles and its contact with each other. These factors can determine one particle to another
transporting charge from each other. Polymers are long chain molecules and are widely useful for
producing products like films, coatings and adhesives. Generally polymers are naturally obtained
but they mostly are synthesised. The properties can be changed to reach the end use application
of the customer.
Combination of 75% Nickel coated Graphite with L.L.D.P.E (ICORENE 3560) to produce range of
compression moulded plaques. These plaques were used for variety of mechanical and electrical
tests. The sheets are about 2mm thick and from there these standard specimens were cut out for
mechanical tests as well as electrical tests. After adding the metallic powders with different
formulations and after performing the tests we compared it with the base material that is L.L.D.P.E
keeping it as a reference. We noticed some good results and we got to know how the metal
powder affected the plastic and what changes it made to its properties.
The aims and objectives
5

Metallized Thermoplastic Composites
1. Formulation of a range of thermoplastics containing electrically conductive additives.
2. Prepare mechanical and electrical test samples from the newly compounded materials.
3. Conduct a range of mechanical and electrical tests on the conductive materials in order to
characterise their performance for specific applications.
4. Compare the results with alternative materials.
Literature Review
2.1 How is LLDPE made and why LLDPE?
Polyethylene is obtained from crude oil into gasoline or it is modified from natural gas. It is obtained
out directly from a refinery to a separate polymerization plant. In a commercial polyethylene,
number of repeat units ranges from 1000 to 10 000 .Polyethylene is a thermoplastic polymer and it
consists of long hydrocarbon chains. The melting point for average low-density polyethylene is 105
to 115 °C .Most polyethylene’s have good chemical resistivity, meaning they are not attacked by
strong acids and bases. Polyethylene generally burns slowly having a blue flame which has a
yellow tip and has an odor of paraffin. Polyethylene can be generalized in different categories but it
is mainly classified on density and branching. With regard to many polymers, the main types of
polyethylene grades are HDPE, LDPE and LLDPE.
LLDPE is defined by its density range of 0.915 – 0.925 g/ cm3. LLDPE has significant amount of
short branches which are linearly arranged, commonly made by copolymerization of ethylene with
short chain alpha olefins. LLDPE has very good tensile strength as it is linearly arranged and it also
exhibits higher impact and puncture resistance than LDPE.LLDPE IS used in packaging,
particularly films or bags and sheets. Cable covering, toys, lids, buckets, containers and pipe.
LLDPE is used predominantly in film applications due to its toughness, flexibility and transparency.
LLDPE has established itself in almost all the markets for polyethylene. Linear low density differs
from low density polyethylene structurally due to absence of long chain branching. There is a
different manufacturing process for LLDPE and LDPE. The copolymerisation process produces an
LLDPE polymer which has a narrower molecular weight distribution than conventional LDPE.
Linear low-density polyethylene (LLDPE), due to its cheap price and wide ranging properties, has
been widely used instead of other polyethylene family. LLDPE has unique rheological and melt
flow properties. LLDPE has less shear because it has narrower molecular weight distribution and
shorter chain branching.
2.2 Applications of conductive polymers.
There are various applications for conductive polymers which are as follows,
6
Metallized Thermoplastic Composites
Static suppression. Electrostatic discharge has been a very critical problem in the electronic
industry, as low volts like 50 volts can even damage sensitive electronic components, this amount
of volts are very common in this kind of electronic equipment’s. The protection is commonly made
by a plastic material which have been somewhat conductive with the help of weaved metal or
carbon fibres. As these plastic materials are inherently non-conductive they need to be tested
before put out on use. So that it can be assured that they continue to have conductive properties.
These types of polymers have been used to supress static on computer screens, on films, and in
windows.
Batteries: in the coming future there is a need of gigantic portability for electronics, it is very
important to have improved batteries. Now a days society seems to be continuously on the move
and they generally carry electronics with them. Hence, there has been a massive growth in laptop
computers, mobile phones, and PDA’s. Electronics have come out in all the places with which we
might spend our time with. So the portability of it plays a major role. Therefore, replacing heavy
metal components with light weight polymers which are highly desirable.
Electrodes of general batteries are made of metals.( Car batteries are made of lead,
nickel/cadmium is used for flashlight batteries, lithium is used for button cells.) In place of these
kind of metals if we use conductive polymers, the following advantages are shown, lower weight,
lower cost, more charge/discharge cycles, lower toxicity, and improved recyclability. Hence,
replacing these metals with conductive polymers is highly desirable and has also been successful
commercially. We obtain metals from the mines which far more costly and harming our
environment than obtaining of raw polymer materials from natural gas, deep oil wells, or from
residual plant materials.
Light – emitting diodes: the old backlit LCD displays have been replaced by the conductive
polymers named LED’s. These devices are having sandwich- type structure where the active
polymeric film layer lies between a semi-transparent anode and a back row cathode. The entire
device is having uniform light emitted from the device. These devices have already found
applications in cellular telephones, displays for home appliances, PDAs, and numerous industrial
devices needing a readout display.
Micro tools: The conductive polymers have a good property that they swell when they conduct, so
that means the electrical signals are modified to mechanical energy, which is similar to
piezoelectric materials. But in contrast to piezoelectric films. These conductive polymer films work
well at low voltages, thus it expands the area which is used of applicability for devices.
7
Metallized Thermoplastic Composites
Solder: Solder is massively used in the electronics industry to attach the electronic devices
physically and electrically which are printing wiring boards which connect them together. Tin and
lead mixture is used for soldering the devices. And this has been used extensively in the industry
for 13 decades. But there has been concern regarding the landfills because lead in these
electronic products is dumped there after its application, where it can leach into the water supply.
There has been much progress in finding other metal compounds for using it instead of lead for
avoiding landfills and it has also a reached a small niche which has been to use conductive
adhesives for a solder replacement. Conductive filler material loaded with epoxies are used for
making up conductive adhesives. The biggest disadvantages of these conductive adhesives is that
they are made of thermosets and then cannot be reused or remoulded for using it again and all
has to be dumped.
Generally conductive adhesives which are entering in the market are generally made of
thermoplastics; they have good potential of making a change in the old trend which has been
followed.
Printed Circuit Boards: Almost all the electronics which are in the market are attached to a “printed”
circuit boards. They are made of a composite of epoxy and fiberglass, a very thin layer made of
copper is etched to form an appropriate pattern to conduct. This process uses a costly
photographic equipment, with which various equipment are used for different types of hazardous
materials. The product which is obtained is cheap and inexpensive but there has been many recent
developments for these type of circuit boards.
2.3 Limitations of conductive polymers
The available conductive polymers in the market do not possess precision in conductance and
different applications for electronics. Whereas silicon chips are far superior in conducting electricity
with speed than the conductive polymers in the market. Hence these polymers are limited when
question of gross changes arises. So conductive polymers cannot be seen as a competitive type
but rather as a complimentary type.
Conductive polymers have some advantages when it comes to moldability and elongation but then
the polymers are weaker in mechanical strength when it comes to comparison with metals but they
are still somewhat better than devices which are silicon based.
Plastics are generally soft and so they are more susceptible to get damaged by scratching and
fracture when it comes to comparison with metals. Moreover, these devices are kept in a case
made of glass for avoiding scratches and physical damage made by the environment.
There is one more factor which affects conductivity in polymers is that these polymers are
generally conductive in two dimension or in a single dimension but metal are fully conductive in
8

Metallized Thermoplastic Composites
three dimensions. The polymers have dimensional restriction and that is because they have a fixed
structure like linear or planar so the delocalized electrons follow the network which polymer has
formed.
There have been many researchers which have reached a stage where they have discovered new
methods for casing the electronic information. This has a very bright future for having fast storage
and retrieval devices. The conductive polymers are seen as devices which detect light which can
be used for various commercial and military applications.
As these conductive polymers are a very exciting development and as they become more common
they may enter into the market at a whole new level such as fiberglass composite products which
are presently manufactured. Labels can be made which have an electronic display or the boat can
change its colour if the veil is made of conductive plastics.
Packing Density
Efficiency of continuous network formation for a particulate material is inversely related to how densely it packs. Those that pack densely are inefficient network formers, while those that pack loosely are efficient network formers.
2.4 Filler concentration for electro conductive polymer composites
Almost all polymers are insulating thermally and electrically. Many technological applications have
emerged to make polymers having dispersed fillers to make it conductive. Various methods of
manufacturing composites has emerged for improving the processing which can reduce the cost by
decreasing the ratio of conductive filler is used but effective.
The filler concentration and conductivity are not directly proportional to each other since there is a
narrow range of filler concentration where composite changes from insulator to conductor. As the
amount of filler added to the material is increased the resistivity of the composite stays constant up
to a certain filler concentration level known as the critical concentration. At the critical
concentration resistivity drops sharply however further increase in the filler concentration causes
reduction in resistivity at a much lower rate. The transition from resistor to insulator takes place due
to network formation amongst the conducting filler particles. In this network the filler particles need
not be in physical contact. The path includes large gaps between filler particles.
The composite resistivity is determined by insulating polymer matrix material. At the critical
concentration, dependent on filler morphology and other factors, the number of interparticle
9

Metallized Thermoplastic Composites
contacts increases sharply over a narrow range of filler concentration. The conductive path now
consists of a network of filler particles that either are touching or are separated by very small gaps
and the resistivity falls sharply as a result. Once an extensive conductive network has formed,
further increases in filler concentration increase the average cross section of the conductive
network by increasing the number of parallel pathways and the volume resistivity gradually falls
accordingly.
In the percolation process the network formation is very important. In the percolation model the
continuous formation is necessary through the lattice for taking in account of the concentrations for
both the materials which are compromised in the network. For the conductive filler, the critical
concentration is very sensitive to its aspect ratio, which is defined as the ratio of the long
dimension to the short dimension of the filler particles.
The resistivity versus filler concentration relationship remains about the same as the aspect ratio
changes. Network formation begins at lower filler concentrations as the aspect ratio increases.
The polymers conductivity does not increase continuously as we increase the conductive filler
contents, rather the relationship in nonlinear. The percolation threshold is at which conductivity
increases in order of magnitude from insulating range to semi conductive or conductive ranges.
There is a need to monitor the homogeneity and a composite, which determines the morphology,
remained unchanged and the filler dispersion should be uniform. The void level has to be verified
which also influences electro conductivity, within the samples. The density of the samples is to be
measured with weight in water and in air using proper balancing equipment.
2.5 Effect of temperature and Dielectric breakdown
Dielectric constant is affected by temperature change, higher the temperature the polymer chain
gets broken which enhances the thermal agitation. The change in electric field polar group will be
affected and will get free to orient. Polymers are long chained structures so when the temperature
goes low, the chains get frozen and it reduces the dielectric constant. Even at very high
temperature dielectric constant is affected due to high motion in chains that leads to disturbance in
orientation of dipoles. Though the measured frequency and temperature, electronic and atomic
polarization is spontaneous, kinetic energy is a necessity to induce segmental movement. The
dielectric loss can be seen more with respect to relaxation mechanism and temperature when it is
high.
Electrical breakdown occurs when the dielectric strength which is the maximum electric field
applicable on dielectric material is exceeded and may lead to catastrophic failure like short circuit.
It occurs only when heat generated by applied voltage is lower than the heat by losses and thus
10
Metallized Thermoplastic Composites
dielectric is unable to reach a state of internal thermal equilibrium. This failure happens due to
large thickness of dielectric, high temperature of surrounding and dielectric, continuous application
of high voltage. Even high humidity in air can affect dielectric breakdown through electrolytic
process.
2.6 Dissipation factor (dielectric loss tangent)
The apparent power consumed in the material to the real power consumed is known as dissipation
factor. When voltage i applied to dielectric current that flows at 90° out of phase with voltage.
When the current to voltage is leading less than 90° the reason can be because of imperfect
insulating material and degree of polarization. Polarization involves movement of charged particles
which oscillate in an external field where the particles which carry the charge move between the
two configurations, and for that they dissipate the energy.
Charges generally oscillate back and forth in their alternative configurations. In an electric field if there
were no losses the charge motion would be 90 o out of phase in regards with the voltage. In dielectrics
energy is dissipated just like a current in resistor which gives a small phase shift .The loss tangent,
, also called the dissipation factor, .
The Loss Factor L is the most useful which is the loss tangent times the dielectric constant:
It shows us how much energy is dissipated in an oscillating field by a dielectric. If the material has
to be found out to minimize or maximize dielectric loss, L is needed to be found out.
So as the dielectric material is inserted in a electric field which is cyclic then amplitude and
frequency P power is dissipated
The dielectric constant is for the material and for loss tangent it is tan .Throughout the material
power dissipates it in the form of heat energy and it is uniform as well. So the greater we have the
11
Metallized Thermoplastic Composites
loss factor the frequency increases and so there is heat loss. Dielectric loss is manipulated
in processing e.g. radio frequency welding for polymers .
The displacement of charge or of molecules carries a dipole
moment when a material is in the electric field. An alternating field
makes the charge swash back and forth: It shows the
displacements in the shown direction A) when the polarity gets
reversed, the negative ions displaced upwards and positive ions
travel upwards. B) When there is an oscillating field the ions
oscillate in that. If these oscillations oscillate exactly in the same
phase then no energy would be lost but often there is a
considerable phase shift.
Materials which have considerable dielectric loss they usually
then have awkwardly shaped molecules and they possess a
dipole moment. They generally respond in an oscillating field in
which they rotate, because of the shape they interact with each
other and heat energy is dissipated like microwave heating. As
the equation suggests that when energy is dissipated it is directly
dependent on its frequency so higher the power is dissipated. Michael F. Ashby, 2009)
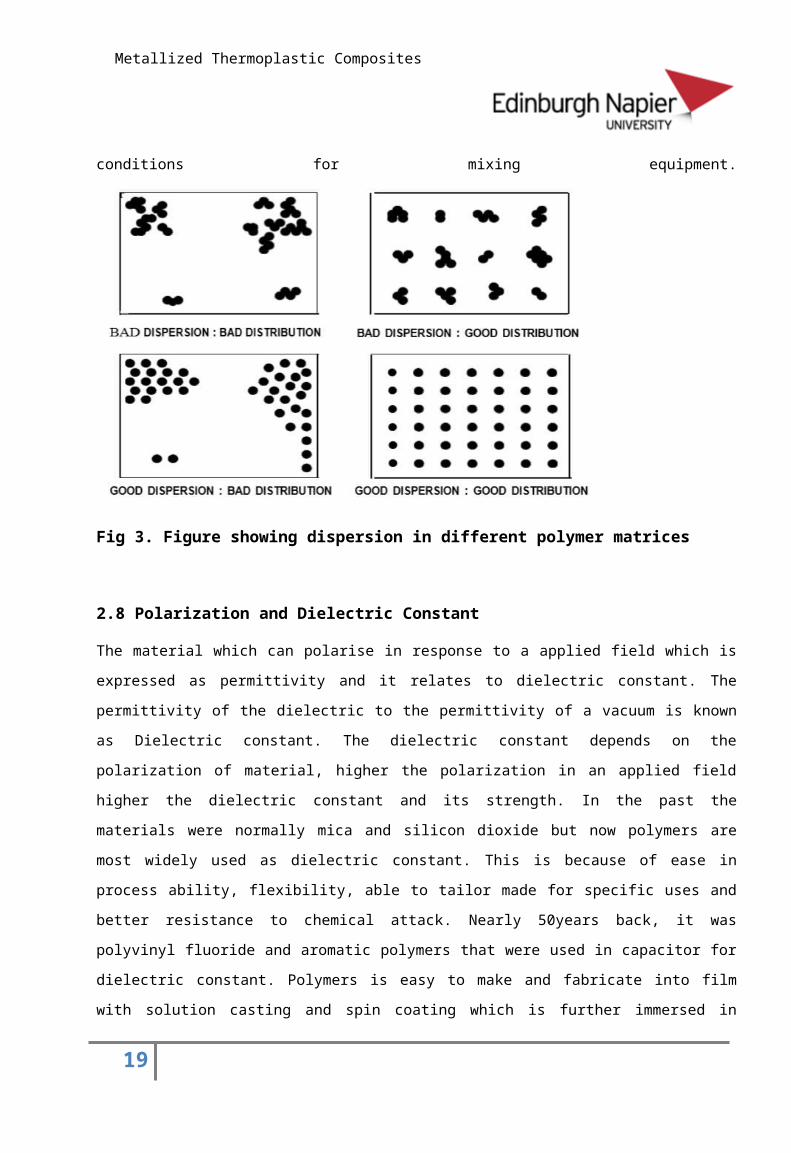
2.7 Dispersion and distribution
In Processing of polymers the mixing is a very important operation which affects the material
properties to combine the properties with other plastics and enhance the physical characteristics.
To impart some specific properties to the material polymers are mixed with some enhanced
additives to improve its mechanical properties. There is dispersive mixing and non-dispersive
mixing and they are very much different from each other. The identification of these mechanisms is
very important for enhancing its process characteristics. When multiphase system is concerned,
dispersion mixing shows decrease in size of the cohesive minor component and because of it
these clusters of particles are generally solid or in form of liquid droplets.To have a good spatial
distribution the minor component has to be spread out throughout the matrix that is called
distributive mixing, which is shown in the figure below. Mixing in any mechanism can occur either
stepwise or simultaneously. The stage at which this dispersive mixing is achieved the balance is
determined by the cohesive forces which hold the agglomerates together and the disruptive
hydrodynamic forces. For droplet size distribution the applied stresses have a crucial role. When
the mixing equipment is being used the flow geometry shows a field pattern which shows a
superposition for flow raging from a pure rotation to pure elongation.
12

Metallized Thermoplastic Composites
A distribution of stress for elongation flow gives us only a global perspective on mixing efficiency in
various types of equipment’s. For having accurate mixing and to check its efficiency we need to
track the elements in the minor phase during their entire residence time in the equipment and will
have to follow the dynamics of the break up. However, its global perspective is generalized by
using the efficiency of mixing provides one means to discriminate between various designs and
processing conditions for mixing equipment.
Fig 3. Figure showing dispersion in different polymer matrices
2.8 Polarization and Dielectric Constant
The material which can polarise in response to a applied field which is expressed as permittivity
and it relates to dielectric constant. The permittivity of the dielectric to the permittivity of a vacuum
is known as Dielectric constant. The dielectric constant depends on the polarization of material,
higher the polarization in an applied field higher the dielectric constant and its strength. In the past
the materials were normally mica and silicon dioxide but now polymers are most widely used as
dielectric constant. This is because of ease in process ability, flexibility, able to tailor made for
specific uses and better resistance to chemical attack. Nearly 50years back, it was polyvinyl
fluoride and aromatic polymers that were used in capacitor for dielectric constant. Polymers is easy
to make and fabricate into film with solution casting and spin coating which is further immersed in
organic substrate, electron, UV or glow discharge methods. It is possible mainly due to its low Tg
and Tm. Ceramics can also be used as dielectric constant but they have high thermal properties
and high processing costs whereas polymers are cheap, have good thermal properties and is easy
13

Metallized Thermoplastic Composites
to process even at high or low temperatures. The ceramic materials have a large coefficient of
thermal expansion which makes it susceptible to degradation in atmosphere.
Electric field consisting a dielectric material which has arrangement of a free space management of
electric dipoles and they are made of charges which are positive and negative and their centres do
not coincide. These charges cannot contribute to the conduction as they are not free. Rather these
charges are bound in a place by atomic and molecular forces and they only shift positions in
external fields. Hence these charges are known as bound charges. (A. Orliukas, 1993)
The effect of an externally applied electric field on a dielectric material is twofold:- first, the
formation of electric dipoles in the material as a result of the finite separation of bound charges and
tendency of these induced dipoles to orient themselves in the direction of the field; second, the
orientation, if possible, of dipoles already existing in the material. This total effect is referred to as
polarization. The polarization P in a solid is defined as the dipole moment per unit volume. It has
the same units as the surface charge density and is, in fact, equivalent to the surface charge
density.
In view of the above, a dielectric may be defined as a material that can be polarized. A
characteristic common to all dielectric materials whether they are solid, liquid, gas, crystalline or
amorphous, is their ability to store electric energy. This electric energy storage characteristic is the
result of the polarization of a dielectric material in the presence of an externally applied electric
field. Fig 4. illustrates the concepts involved when a material is assumed to be placed between two
charged metallic plates. When the intervening space is free of matter, equal and opposite free
surface charge densities, +σ and –σ, are present on the plates. The electric intensity, Eo, is
uniform and is given by σ/εo (εo is the vacuum dielectric constant) (D. H. Tamboulian, 1965)
14

Metallized Thermoplastic Composites
Fig 4.A figure showing representation of distribution of charges between the two plates
a) Vacuum Filled Space b) Dielectric filled space c) applied electronic filed d) electronic flux density
(D. H. Tamboulian, 1965)
15

Metallized Thermoplastic Composites
3. Experimental Procedure
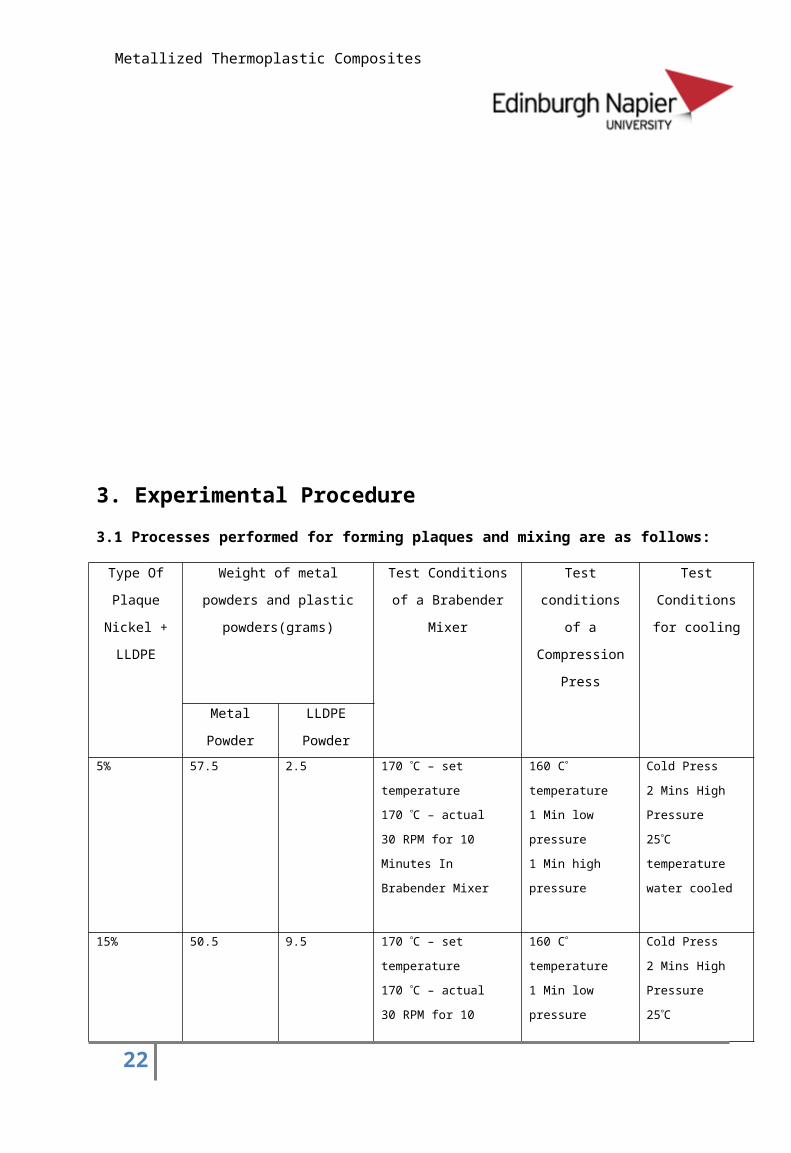
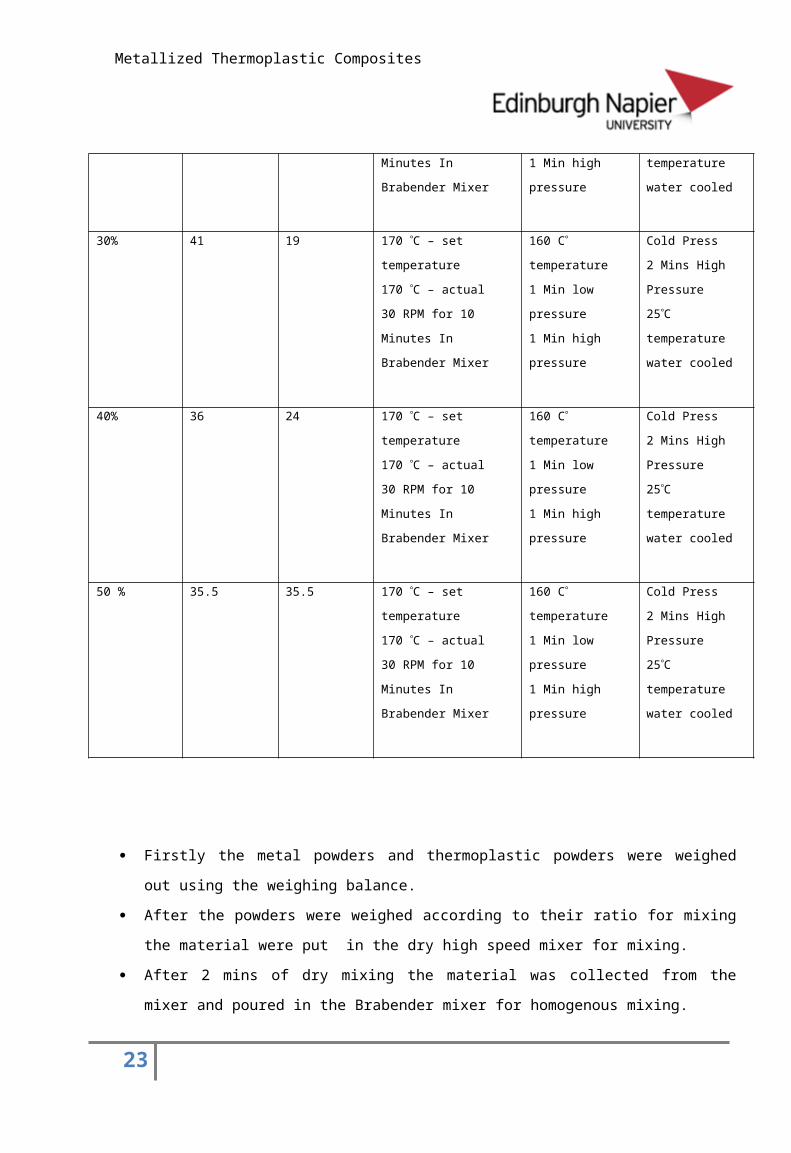
3.1 Processes performed for forming plaques and mixing are as follows:
Type Of
Plaque
Nickel +
LLDPE
Weight of metal powders and
plastic powders(grams)
Test Conditions of a
Brabender Mixer
Test conditions
of a
Compression
Press
Test Conditions
for cooling
Metal
Powder
LLDPE
Powder
5% 57.5 2.5 170 C – set temperature
170 C – actual
30 RPM for 10 Minutes
In Brabender Mixer
160 C
temperature
1 Min low pressure
1 Min high
pressure
Cold Press
2 Mins High
Pressure
25C temperature
water cooled
15% 50.5 9.5 170 C – set temperature
170 C – actual
30 RPM for 10 Minutes
In Brabender Mixer
160 C
temperature
1 Min low pressure
1 Min high
pressure
Cold Press
2 Mins High
Pressure
25C temperature
water cooled
30% 41 19 170 C – set temperature
170 C – actual
30 RPM for 10 Minutes
In Brabender Mixer
160 C
temperature
1 Min low pressure
1 Min high
pressure
Cold Press
2 Mins High
Pressure
25C temperature
water cooled
40% 36 24 170 C – set temperature
170 C – actual
30 RPM for 10 Minutes
In Brabender Mixer
160 C
temperature
1 Min low pressure
1 Min high
pressure
Cold Press
2 Mins High
Pressure
25C temperature
water cooled
50 % 35.5 35.5 170 C – set temperature
170 C – actual
30 RPM for 10 Minutes
In Brabender Mixer
160 C
temperature
1 Min low pressure
1 Min high
pressure
Cold Press
2 Mins High
Pressure
25C temperature
water cooled
16

Metallized Thermoplastic Composites
Firstly the metal powders and thermoplastic powders were weighed out using the weighing
balance.
After the powders were weighed according to their ratio for mixing the material were put in
the dry high speed mixer for mixing.
After 2 mins of dry mixing the material was collected from the mixer and poured in the
Brabender mixer for homogenous mixing.
Then little amount of the material was poured into the brabender mixer for checking its
mixing and homogeneity of the melt.
After melting is achieved more material is allowed to be poured for homogenous melt and
filled up till its capacity and pressed with the seal.
The brabender mixer is allowed to mix the material for 10 Mins at 30 RPM.
Then the material is taken out from the brabender mixer and manually pressed for
collecting and storing it together.
Then taking the material after homogenous mixing it is taken to the compression press for
making 2mm thick plaques.
The hot plates are taken out from the compression press and kept in the cold press for 2
mins for cooling the plates.
After cooling the plates it is ejected from the frame and weighed for performing certain
mechanical and electrical tests.
3.2 Information for Brabender Mixing and its process
Equipment
Plasticorders PL2000 using electical heating with mixer type W50 (volume 55cc)
Brabender mixer was used for shear mixing and for homogenous melt. Brabender mixer has
interchangeable measuring heads which shear the plastic with certain temperature and shear of
the screw at specific rpm. The mixer is cost effective, reliable and little expenditure of time and
material. The mixer consists of as mixer back stand with gear unit and a mixer bowl. For safety
system they have a connection with a drive unit through a shear pin coupling protecting both mixer
and drive unit from damage due to overload. The blades are generally made of stainless steel. For
excellent compounding and for good shear the blade rotates in counter rotation. Heating or cooling
17

Metallized Thermoplastic Composites
is done either through a cold circulation thermostat or electrically. The measuring principle is based
on creating the visible resistance in which the material opposes to the rotating blades. The
dynamometer moves out of its zero position because of the corresponding torque.
Method for using Brabender Mixer
For initial mixing cycle the sample weight was weighed out to fill the chamber. Then mixer
temperature should be achieved to melt the sample sufficiently. Then speed of rotor was verified to
have melt properly homogenised. Then the material was poured inside at 170 C with slow rotor
speed of 10 RPM. The slow speed is kept so that the material starts getting in molten form. As the
material is being poured and filled the pressure ram is used to load the sample gradually into the
mixer by pressurizing it down to the chamber. This
is continued till all the weighed out sample is
loaded then keeps the pressure ram in position to
close mixing chamber and weight of 20 kg is
placed on the lever arm. Then rotor speed was
increased to 30 RPM for 10 minutes. After mixing
time completes rotor was switched off and
chamber was opened to remove the sample. Then
the chambers and rotors were cleaned with brass
brush/ Knife.
(Fig5 BRABENDER MIXER AND ITS PARTS
REF: www.brabender.com)
3.3 COMPRESSION MOULDING OF THERMOPLASTIC FILLED WITH METAL FILLERS:
Equipment’s used
2 Steel plates, 2 Aluminium plates – optional (to be placed each side of template),
Templates, Heat Resistant Gloves
Procedure
Different percentage of 5, 10, 15, 30, 40, and 50 of 75% Nickel coated graphite with LLDPE. The
temperature required was set for hot press at 160 C for the LLDPE mixed with metal fillers. To
open press pull black handle forward. Wear heat resistant gloves provided to remove plates from
press onto table and open plates. Plates and templates were kept in heated press filled with the
18
Metallized Thermoplastic Composites
material; hydraulic pump is switched on and is closely pressed. Stop when top plate is in contact
with press top platen for low pressure of 0-4 tons for 1 minute. Then the templates are kept for 1
minute at full pressure of 20 tons. Switch off. After approximately 1 minute, turn red handle to
unlock, pull black handle forwards to open press. Place the hot plates in adjacent cold press and
apply full pressure (15 Tons).Turn on cooling water. When plates are cool enough, remove plates
from press and remove thermoplastic plaque. Replace plates in hot press and close press for next
plaque.
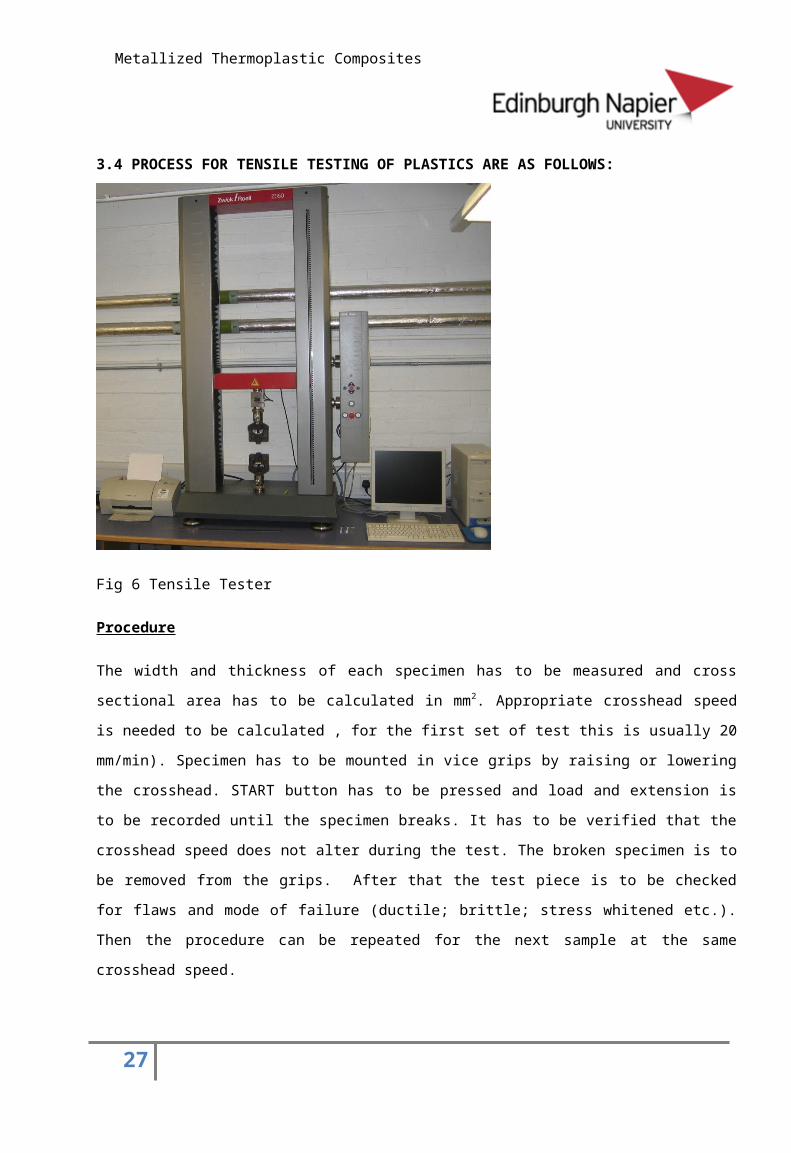
3.4 PROCESS FOR TENSILE TESTING OF PLASTICS ARE AS FOLLOWS:
Fig 6 Tensile Tester
Procedure
The width and thickness of each specimen has to be measured and cross sectional area has to be
calculated in mm2. Appropriate crosshead speed is needed to be calculated , for the first set of test
this is usually 20 mm/min). Specimen has to be mounted in vice grips by raising or lowering the
crosshead. START button has to be pressed and load and extension is to be recorded until the
specimen breaks. It has to be verified that the crosshead speed does not alter during the test. The
broken specimen is to be removed from the grips. After that the test piece is to be checked for
flaws and mode of failure (ductile; brittle; stress whitened etc.). Then the procedure can be
repeated for the next sample at the same crosshead speed.
19

Metallized Thermoplastic Composites
3.5 PROCESS FOR 3-POINT BEND TEST ARE AS FOLLOWS:
Fig 7 Sketch of 3 Point Bend Test
Procedure
First the Tensile Tester was set up with the 3 point bend attachment. Dimensions b, h and L
are needed to be measured.Lay test bar symmetrically across supports. Set up PC, with Lloyd
Nexygen software and open console. Raise cross-head so that test bar is almost touching
centre bar.Zero load and extension. Start test and record load deflection curve until sample
breaks or selected % strain is reached.
3.6 Process for CHARPY IMPACT TESTING
Fig 8 Impact Tester
20

Metallized Thermoplastic Composites
We require Rectangular section injection moulded bars – unnotched and notched.
Nominal dimensions:
Height (h)=6 mm
Dimensions perpendicular to the direction of the notch (minus the notch depth)
Breadth (b)=6 mm
Specimen dimensions parallel to the direction of the notch
Length (L)=50 mm
The test specimen is to be notched for checking its impact at which it breaks. After that test specimen is to be placed between the base in which notch should be in the centre, facing away from the pendulum. The arm of the pendulum is to be raised till it sticks into its position. The arrest knobs are to be released simultaneously, which releases the pendulum. Once the specimen has broken the movement is to be stopped by the brake.
3.7 Electrical testing of polymers are as follows
Experimental procedure
Find the capacitance of air gap using the capacitance meter. Insert one of the plastic discs into the
gap between the plates, and find the capacitance for each sample. Then measurement is carried
out several times and average is taken. For each material calculate the relative permittivity where,
Relative permittivity= Cmean/c0
Find the cross sectional area of the metal plates, using the micrometer. Find the average value of
capacitance for each sample, by inserting the sample into the gap between the plates and using
the meter, as before and taking many measurements. The relative permittivity of each material can
be calculated by using the formula Cmean=(A/d)
21
Metallized Thermoplastic Composites
Results
Mechanical Tests
Tensile test
Tensile test was performed on the test specimens for measuring its properties with respect
to the 100% LLDPE test specimen and comparing it with the metal powder incorporated
test specimens.
Key
Emod = Elastic modulus
Fy = Yield load
Fmax =Maximum Load
m= Maximum load/tensile strength
dL at Fmax= strain at maximum load
FBreak =load at break/ rupture load
B =stress at break
dL at break = strain at break/ extension
22
Metallized Thermoplastic Composites
S0 = Cross sectional area
For 100% LLDPE without 75% Nickel coated graphite the results are as follows:
Parameter table:
E-Modulus speed : 200 mm/min
Test speed : 200 mm/min
Results table:
EMod FY Fmax M dL at Fmax FBreak B dL at break S0
No. MPa N N MPa % N MPa % mm²
1 209 114 126 19.52 1043.6 121 18.62 1061.4 6.48
2 206 112 112 17.51 20.1 79.7 12.46 823.2 6.40
3 187 112 131 20.40 1023.0 118 18.40 1046.7 6.44
23
Metallized Thermoplastic Composites
Curve graph:
For 5 % of 75% Nickel coated graphite with LLDPE the results are as follows:
Parameter table:
E-Modulus speed : 200 mm/min
Test speed : 200 mm/min
Results table:
EMod FY Fmax M dL at Fmax FBreak B dL at break S0
Nr MPa N N MPa % N MPa % mm²
1 137 97.6 97.6 17.65 20.9 58.5 10.57 927.7 5.53
2 114 105 106 19.21 1042.1 90.4 16.35 1061.0 5.53
3 120 106 106 16.38 21.7 81.9 12.65 886.8 6.48
24

Metallized Thermoplastic Composites
Statistics table:
Series EMod FY Fmax M dL at Fmax FBreak B dL at break S0
n = 3 MPa N N MPa % N MPa % mm²
x 124 101 103 17.75 361.6 76.9 13.19 958.5 5.85
s 11.9 4.92 4.94 1.42 589.4 16.6 2.93 91.1 0.55
9.64 4.87 4.78 7.99 163.00 21.52 22.20 9.50 9.38
Curve graph:
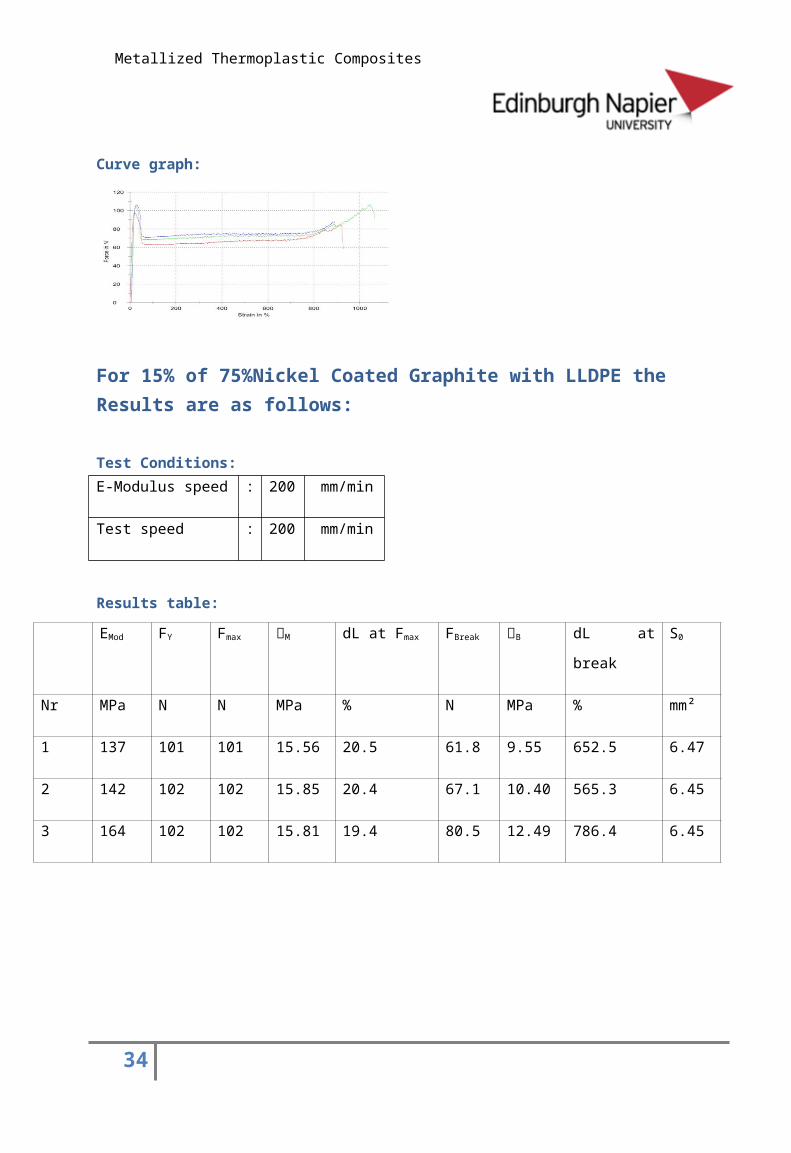
For 15% of 75%Nickel Coated Graphite with LLDPE the Results are as follows:
Test Conditions:E-Modulus speed : 200 mm/min
Test speed : 200 mm/min
Results table:
EMod FY Fmax M dL at Fmax FBreak B dL at break S0
Nr MPa N N MPa % N MPa % mm²
1 137 101 101 15.56 20.5 61.8 9.55 652.5 6.47
2 142 102 102 15.85 20.4 67.1 10.40 565.3 6.45
3 164 102 102 15.81 19.4 80.5 12.49 786.4 6.45
25

Metallized Thermoplastic Composites
Statistics table:
Series EMod FY Fmax M dL at
Fmax
FBreak B dL at
break
S0
n = 3 MPa N N MPa % N MPa % mm²
x 148 102 102 15.74 20.1 69.8 10.81 668.1 6.46
s 14.0 0.172 0.793 0.16 0.6 9.67 1.51 111.4 0.01
9.48 0.17 0.78 1.00 3.03 13.86 13.99 16.67 0.18
Curve graph:
For 30 % 0f 75 %Nickel coated Graphite with LLDPE the results are as follows:
Test Conditions:
E-Modulus speed : 200 mm/min
Test speed : 200 mm/min
26
Metallized Thermoplastic Composites
Results table:
EMod FY Fmax M dL at Fmax FBreak B dL at
break
S0
Nr MPa N N MPa % N MPa % mm²
1 123 93.9 93.9 14.52 20.1 36.9 5.71 120.7 6.46
2 160 95.4 95.4 14.75 19.0 57.6 8.90 167.7 6.46
3 141 94.7 94.7 14.64 19.1 58.9 9.11 42.4 6.46
Statistics table:
Serie
s
EMod FY Fmax M dL at Fmax FBreak B dL at
break
S0
n = 3 MPa N N MPa % N MPa % mm
²
x 141 94.6 94.6 14.6
4
19.4 51.1 7.91 110.3 6.46
s 18.1 0.746 0.746 0.12 0.6 12.3 1.91 63.3 0.00
12.85 0.79 0.79 0.79 3.14 24.0
6
24.1
0
57.40 0.00
Curve graph:
27

Metallized Thermoplastic Composites
For 40 % of 75% Nickel coated graphite with LLDPE the results are as follows:
Parameter table:
E-Modulus speed : 200 mm/min
Test speed : 200 mm/min
Results table:
EMod FY Fmax M dL at Fmax FBreak B dL at break S0
Nr MPa N N MPa % N MPa % mm²
1 100 85.8 85.8 12.97 21.1 59.6 9.01 245.5 6.61
2 109 86.6 86.6 13.17 20.7 60.4 9.19 170.2 6.58
3 110 86.7 86.7 13.19 20.2 60.9 9.32 179.6 6.67
Statistics table:
Serie
s
EMod FY Fmax M dL at
Fmax
FBreak B dL at
break
S0
n = 2 MPa N N MPa % N MPa % mm²
x 105 86.6 86.2 13.07 20.9 60.0 9.10 207.9 6.60
s 6.23 0.58 0.587 0.14 0.3 0.618 0.13 53.2 0.02
5.96 0.68 0.68 1.08 1.35 1.03 1.40 25.62 0.32
Curve graph:
28

Metallized Thermoplastic Composites
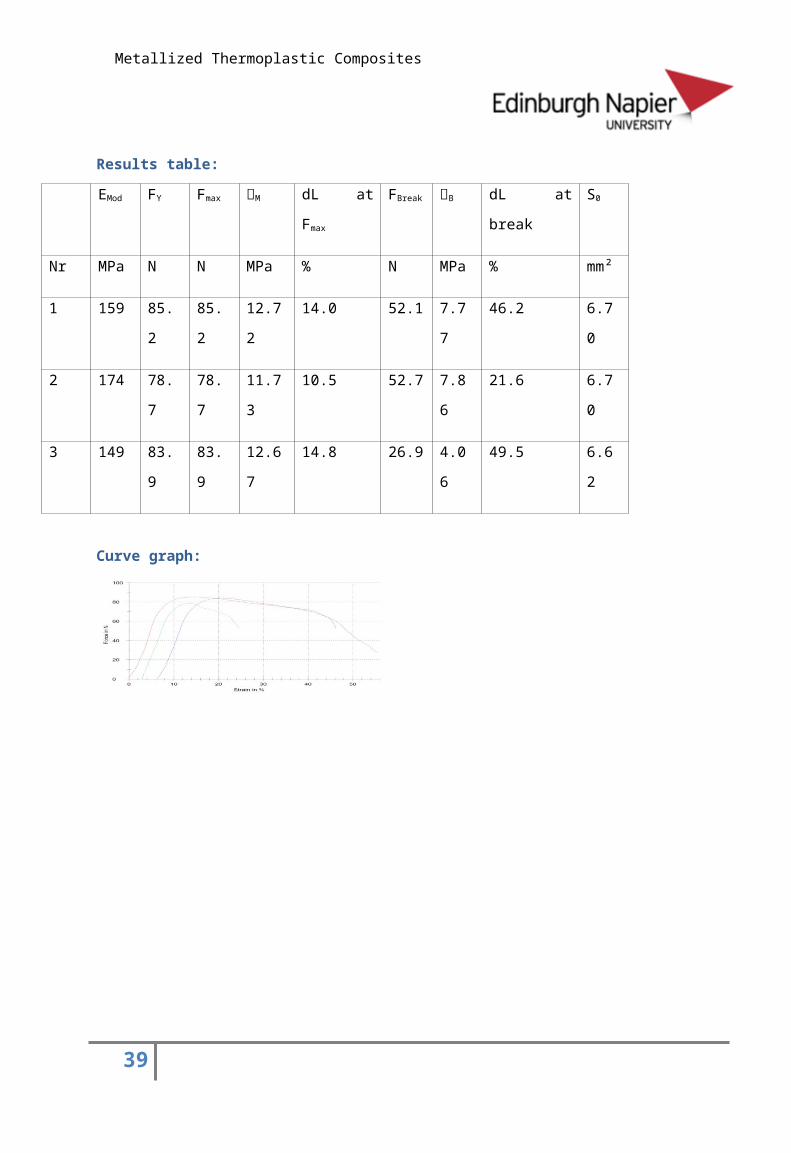
50 % of 75% Nickel coated Graphite with LLDPE.
Test Conditions:
E-Modulus speed : 200 mm/min
Test speed : 200 mm/min
Results table:
EMod FY Fmax M dL at Fmax FBreak B dL at break S0
Nr MPa N N MPa % N MPa % mm²
1 159 85.2 85.2 12.72 14.0 52.1 7.77 46.2 6.70
2 174 78.7 78.7 11.73 10.5 52.7 7.86 21.6 6.70
3 149 83.9 83.9 12.67 14.8 26.9 4.06 49.5 6.62
Curve graph:
29

Metallized Thermoplastic Composites
Statistics table:
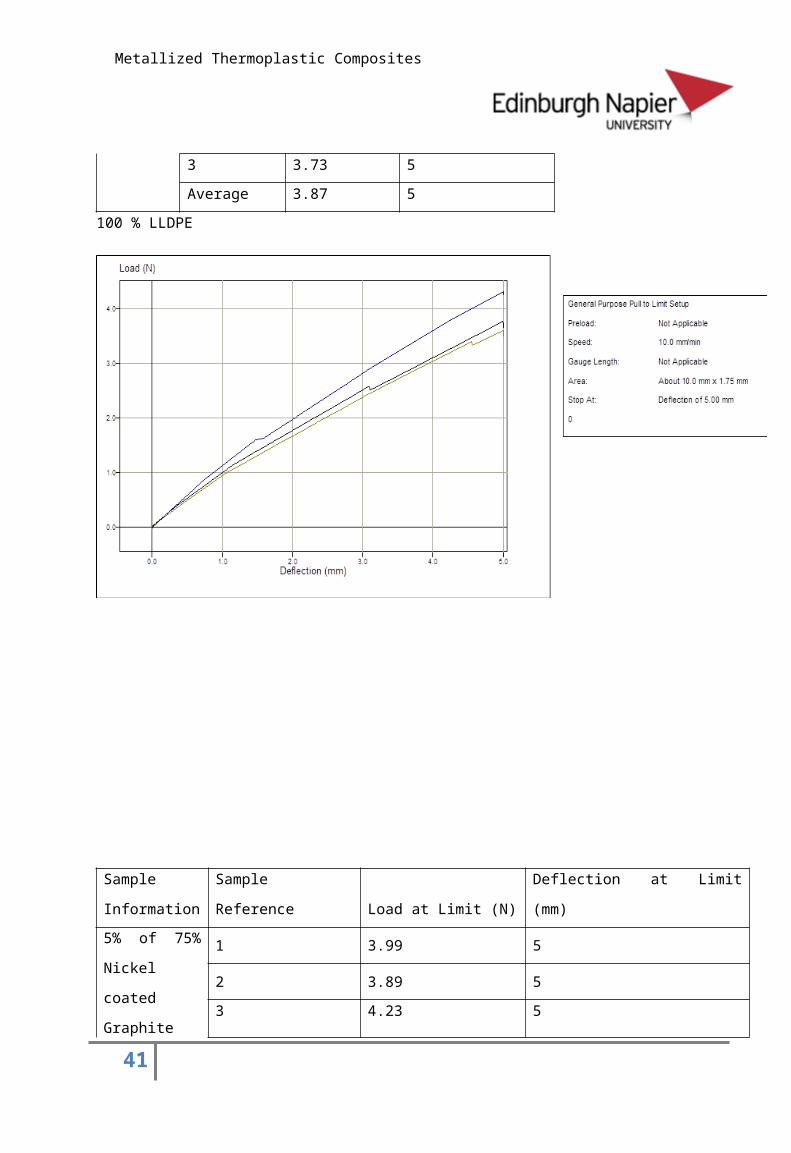
Bend Test
Bend test was performed on the test specimen for comparing the material
stiffness when the metal powders were incorporated with comparison to the
100% LLDPE. There were 3 test specimens for each plaque and the average
was then taken for maintaining accuracy in the results.
Sample
Informatio
n
Sample
Reference
Load at Limit
(N)
Deflection at Limit
(mm)
100%
LLDPE 1 3.59 5
2 4.30 5
3 3.73 5
Average 3.87 5
100 % LLDPE
30
Serie
s
EMod FY Fmax M dL at Fmax FBreak B dL at break S0
n = 3 MPa N N MPa % N MPa % mm²
x 161 82.6 82.6 12.37 13.1 43.9 6.56 39.1 6.67
s 12.3 3.49 3.49 0.56 2.3 14.7 2.17 15.2 0.05
7.67 4.22 4.22 4.51 17.46 33.54 33.04 38.99 0.69

Metallized Thermoplastic Composites
Sample
Information Sample Reference Load at Limit (N) Deflection at Limit (mm)
5% of 75%
Nickel coated
Graphite with
LLDPE
1 3.99 5
2 3.89 5
3 4.23 5
Average 4.03
5% of 75% Graphite coated Nickel with LLDPE
31

Metallized Thermoplastic Composites
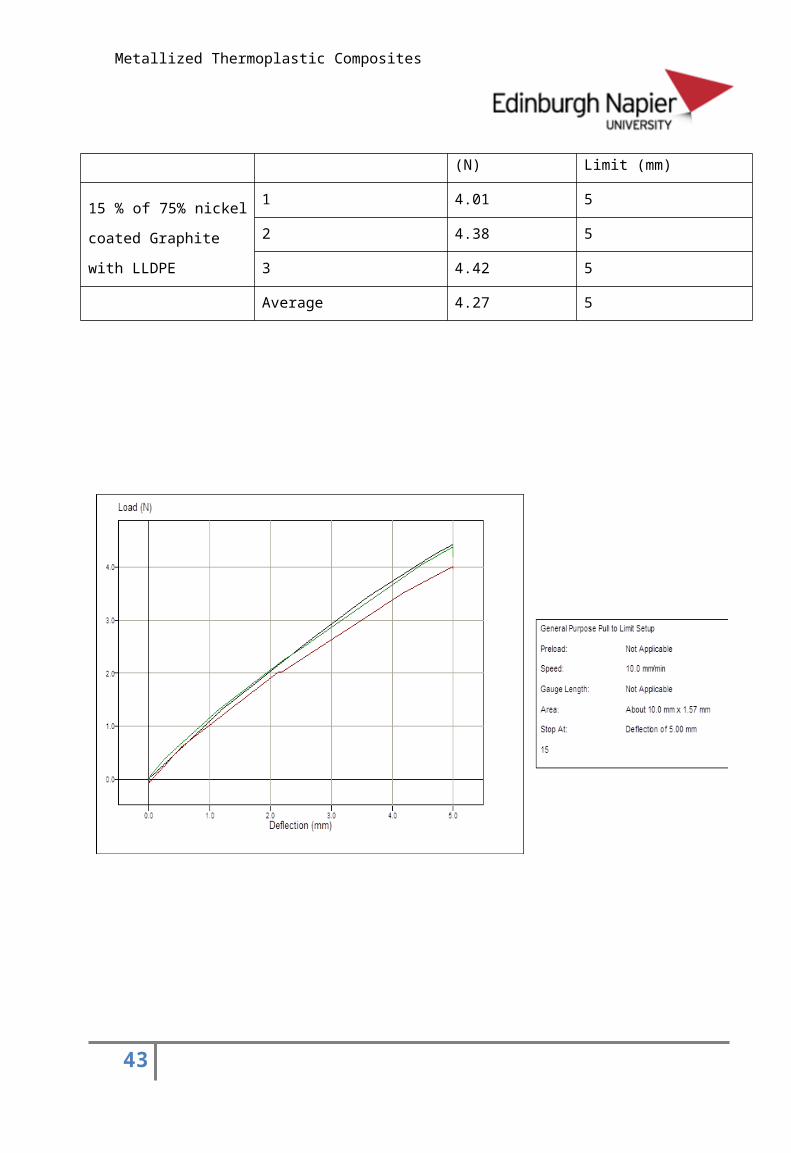
Sample Information Sample Reference Load at Limit (N) Deflection at Limit (mm)
15 % of 75% nickel
coated Graphite
with LLDPE
1 4.01 5
2 4.38 5
3 4.42 5
Average 4.27 5
32

Metallized Thermoplastic Composites
Sample
Information Sample Reference Load at Limit (N) Deflection at Limit (mm)
30 % of 75 %
75% Nickel
coated Graphite
with LLDPE
1 4.97 5
2 5.25 5
3 4.85 5
Average 5.02 5
33
Metallized Thermoplastic Composites
34
Sample
Information
Sample
Reference Load at Limit (N) Deflection at Limit (mm)
40% of 75% of
Nickel coated
Graphite
With LLDPE
1 6.22 5
2 7.09 5
3 6.34 5
Average 6.55 5

Metallized Thermoplastic Composites
35
Sample
Information
Sample
Reference Load at Limit (N) Deflection at Limit (mm)
50% of 75 Nickel
coated Graphite
With LLDPE
1 8.09 5
2 7.31 5
3 8.27 5
Average 7.89 5

Metallized Thermoplastic Composites
100% LLDPE
5% Metal Filler
15% Metal filler
30 % Metalfiller
40% Metal filler
50% Metal filler
Load (N) 3.87 4.03 4.27 5.02 6.55 7.89
Length(mm) 65.8 65.2 65.9 65.7 65.6 65.8
Breadth(mm) 25.89 25.4 25.8 25.3 25.2 25.9
Depth (mm) 1.75 1.55 1.57 1.62 1.7 1.66
Deflection(mm)
5 5 5 5 5 5
Gradient(L/D)
0.774 0.806 0.854 1.004 1.31 1.57
Flexural stress (MPa)
4.81 6.45 6.637 7.451 8.850 10.91
Flexural strain 0.012 0.011 0.011 0.011 0.012 0.012
Flexural modulus(MPa)
397.24
590.45 611.97 661.766 746.750 948.63
36

Metallized Thermoplastic Composites
Impact test
Impact test was carried out to compare the metal incorporated plaques with
the 100% LLDPE for knowing how it is affected with respect to the plastic
plaque. The results are as follows:
0% of 75% Nickel
coated Graphite with
LLDPE
Notched(1) Notched(2) Notched(3)
Width(W) 3.45 3.24 3.79
Thick(T) 7.22 7.33 7.79
Impact Strength 30.18Kj/m2 29.85 Kj/m2 32.36 Kj/m2
Average 30.79 KJ/m2
5% of 75% Nickel
coated Graphite with
LLDPE
Notched(1) Notched(2) Notched(3)
Width(W) 3.44 3.29 3.77
Thick(T) 7.50 7.80 7.55
Impact Strength 18.8Kj/m2 13.9 Kj/m2 23.3 Kj/m2
Average 18.6 Kj/m2
15% of 75% Nickel
coated Graphite with
LLDPE
Notched(1) Notched(2) Notched(3)
Width(W) 3.42 3.67 3.78
Thick(T) 7.77 7.78 7.72
Impact Strength 11.6 Kj/m2 12.7 Kj/m2 12.3 Kj/m2
Average 12.2 Kj/m2
37

Metallized Thermoplastic Composites
30% of 75% Nickel
coated Graphite with
LLDPE
Notched(1) Notched(2) Notched(3)
Width(W) 3.67 3.62 3.73
Thick(T) 7.74 7.72 7.68
Impact Strength 10.5 Kj/m2 11.2 Kj/m2 11.3 Kj/m2
Average 11 Kj/m2
50% of 75% Nickel
coated Graphite with
LLDPE
Notched(1) Notched(2) Notched(3)
Width(W) 3.87 3.79 3.94
Thick(T) 7.70 7.78 7.64
Impact Strength 9.7 Kj/m2 9.4 Kj/m2 8.7 Kj/m2
Average 9.2 Kj/m2
100% LLDPE 5% metal filler
15 % metal filler
30 % metal filler
40% metal filler
50% metal filler
0
5
10
15
20
25
30
35
30.79
18.6
12.2 11 119.2
impact strength
impact strength
75 % Nickel Coated Graphite with LLDPE Powder
Impa
ct st
rent
in k
J/m
2
38
40% of 75% Nickel
coated Graphite with
LLDPE
Notched(1) Notched(2) Notched(3)
Width(W) 3.92 3.54 3.67
Thick(T) 7.77 7.62 7.74
Impact Strength 11.0 Kj/m2 10.2 Kj/m2 11.8 Kj/m2
Average 11 Kj/m2
Metallized Thermoplastic Composites
Electrical Test
1. 5% of 75% Nickel coated Graphite
Frequency 20Hz
Material inside - Capacitance 20.9 pF
Material out- Capacitance 17.2 pF
Capacitance = Material IN/Material OUT = 1.21 pF
Frequency 300Hz
Material inside – Capacitance 35.5 pF
Material outside – Capacitance 31.85 pF
Capacitance = Material IN/Material OUT = 1.14 pF
2. 15% of 75% Nickel coated Graphite
Frequency 20Hz
Material inside – Capacitance 22.7 pF
Material outside – Capacitance 17.5 pF
Capacitance = Material IN/Material OUT = 1.29 pF
Frequency 300Hz
Material inside - Capacitance 35.70 pF
Material out- Capacitance 30.65 pF
Capacitance = Material IN/Material OUT = 1.16 pF
3. 30% of 75% Nickel coated Graphite
Frequency 20Hz
Material inside - Capacitance 24.8 pF
Material out- Capacitance 17.5 pF
Capacitance = Material IN/Material OUT = 1.41 pF
39

Metallized Thermoplastic Composites
Frequency 300Hz
Material inside – Capacitance 38 pF
Material outside – Capacitance 30.8 pF
Capacitance = Material IN/Material OUT = 1.23 pF
4. 40% of 75% Nickel coated Graphite
Frequency 20Hz
Material inside – Capacitance 26.5 pF
Material out- Capacitance 17.2 pF
Capacitance = Material IN/Material OUT = 1.54 pF
Frequency 300Hz
Material inside – Capacitance 35.5 pF
Material outside – Capacitance 31.85 pF
Capacitance = Material IN/Material OUT = 1.14 pF
5. 50% of 75% Nickel coated Graphite
Frequency 20Hz
Material inside - Capacitance 20.9 pF
Material out- Capacitance 17.2 pF
Capacitance = Material IN/Material OUT = 1.21 pF
Frequency 300Hz
Material inside – Capacitance 35.5 pF
Material outside – Capacitance 31.85 pF
Capacitance = Material IN/Material OUT = 1.14 pF
40
Metallized Thermoplastic Composites
Discussion
The above work shows that there has been some degradation in the mechanical properties of the
plaques which were made in the laboratory. The thermoplastic material which was weighed out
and mixed with the Nickel coated graphite metal powder made the weight of the plack increase as
we increased the ratio of metal powders. So accuracy was maintained while mixing but the
brabender mixer had a limit of material which was poured. Moreover the LLDPE material was very
sticky when we mixed in the Brabender as it stuck on the surface when it was being removed for
further process. As the ratio of metal powder was increased it became less sticky on the surface
and was easily removed from the brabender mixer. The color also changed as we increased the
ratio of metal powders in LLDPE powders.
The tensile strength of 100 % LLDPE was 19.11 Mpa but as we mix 5 % of metal powder its tensile
strength comes down to 17.74 Mpa, for 15 % metal filler its tensile is 15.78 Mpa, for 30 % metal
41

Metallized Thermoplastic Composites
filler it is 14.69 Mpa, 40 % metal filled has tensile strength of 13.06Mpa , 50 % metal filled has
tensile strength 11.9 Mpa. So as the ratio of metal powder was increased the plack became stiffer
and brittle. As the percentage of metal powder increases from 5% to 50% the load at limit in bend
test increased from 3.78 N to 7.89 N which indicates that metal powder makes the product more
stiff and brittle to fracture. The plaques were before made of 2mm thin sheets from which specimen
was cut out for impact test but we noticed that the sheet was too thin for having accurate results as
the specimen used to come out from the impact tester. So new sheets of 4 mm were made for
having accuracy and the specimen did not move out of its place. These specimens were then also
used for electrical testing. There was no significant conductance with increase in metal powders
rather there was degradation in mechanical properties of the plack.
Conclusion
Thus report can be concluded by mentioning that there was no significant change in the
thermoplastic by adding the metal fillers. The material became more brittle and it was more
susceptible to fracture. The dispersion and distribution of the metal filler was not proper and that
resulted into less conductivity. The Brabender mixer couldn’t allow proper dispersive mixing and
that made the polymer having clusters of metal particles at one end and so there was not enough
distance between two atoms to transfer the charge which did not allow the current to conduct from
one end to the other. So this caused clusters of thermoplastic polymers and hence conductivity
wasn’t found which also resulted in less mechanical properties because it made bonding between
atoms weak.
42
Metallized Thermoplastic Composites
Reference
Literature review
1. http://www.ceresana.com/en/market-studies/plastics/polyethylene-lldpe//
[Accessed March 3,2013]
2. Obasi, H. O. B. (2007). Studies on the mechanical and Transport Properties of natural
Rubber / Linear Low Density polyethylene Blends. M. Sc Thesis, FUTO, Nigeria.
3. Katchy, E. M. (2000). Principles of polymer Science, EL’DEMAK Ltd, Nigeria.
5. Yaukey, John, USA Today, August 15, 2000.
(D. H. Tamboulian, Electric and Magnetic Fields, Harcourt, Brace and World Inc.,
43

Metallized Thermoplastic Composites
New York, USA (1965))
7. http://www.brabender.com/fileadmin/dateien/gb/download/kunststoff/download/broschueren/kneter/25061_E_Measuring_Mixer.pdf[Accessed April4,2013]
8. Kaner, Richard B. and Alan G. MacDiarmid, “Plastics That Conduct Electricity,” Scientific
American, p. 106, 1988.
9. De Gaspari, John, “New alternatives In Conductive Plastics,” Plastics Technology, p. 13-
15,November 1997.
10. “Conductive Polymers Spark New Ideas,” Technology Edge, p.13, April 1993.
11. “Electrically Conductive Polyimide Films,” NASA Tech Briefs, p. 57, August 1993.
12. Shirakawa, Hideki, et al, J.C.S. Chem. Comm., 1977.
Budinski, K.G. and Budinski, M.K. (2009) Engineering Materials: Properties and Selection,
9th edition, Prentice Hall, Upper Saddle River, New Jersey, USA. ISBN-10: 0137128428,
ISBN-13: 9780137128426
13. http://www.rheology.org/sor/publications/rheology_b/jan97/mixing.pdf
[Accessed April 24, 2013]
14. http://www.kfm.p.lodz.pl/projekty/Yevgen%20Mamunya%20-%20lecture1.pdf
[Accessed march 21,2013]
15. http://www.sciencedirect.com/science/article/pii/B9780750681490000064
[Accessed April 17,2013]
16.
http://www.sciencedirect.com/science/article/pii/095522199390127D (Relaxation dispersion of ionic conductivity in a Zr0·85Ca0·15O1·85single crystal)[Accessed April 24,2013]
44


