Member FINRA/SIPC
Energy & Power Industry UpdateFebruary 2011
HW&CO. |
©2011. Investment banking services are provided by Harris Williams LLC, a registered broker-dealer and member of FINRA and SIPC, and Harris Williams & Co. Ltd, an Appointed Representative of Sturgeon Ventures LLP, which is Authorised and Regulated by the Financial Services Authority or FSA. Harris Williams & Co. is a trade name under which Harris Williams LLC and Harris Williams & Co. Ltd conduct business in the US and Europe, respectively.
Read more about select transactions at www.harriswilliams.com/connect
CON N EC T I V I T Y
At Harris Williams & Co., we’re not just in the Middle Market, we’re in the middle of making connections. We are the conduit through which clients connect their present to their future. In 2010, we closed nearly 65 transactions, selling approximately 50% of our client companies to strategic acquirers spanning North America, Europe, Asia, and Australia. It’s a new year. Let’s connect.
2010 Select Transactions
Everything connects in the Middle.
has been acquired byhas been acquired by
has been acquired by has been acquired byhas been acquired by has been acquired by
has been acquired by
has secured a growth equity commitment from
has been acquired by
has been acquired byhas been acquired byhas been acquired by
has been acquired by
has been acquired byhas been acquired byhas been acquired by
has been acquired byhas been acquired byhas been recapitalized byhas been acquired by
has been acquired by
has been acquired by
has completed a balance sheet restructuring and
recapitalization transaction
has been acquired by
has been acquired by
has been acquired by has partnered withhas received a minority
investment from
has been acquired by
has been acquired by has been acquired by
has been acquired by
has been acquired by
has been acquired by
has been acquired by
has been acquired by
a subsidiary of Centene Corporation
a subsidiary of Elgin National Industries
11-HAR-215 CONNECT-EOY-Buy8.eps 1 1/24/2011 1:09:10 PM
Energy & Power Industry UpdateFebruary 2011
What We’ve Been Reading
page 1
• GigaOm and Greentech Media provide two different anecdotal data points on utility
companies’ transition towards the “smart grid” and an increasingly digital business model.
GigaOm’s Katie Fehrenbach features an interview with Reliant Energy President Jason Few
at this year’s Consumer Electronics Show (“CES”) in Las Vegas where Apple, Google, and
Microsoft generated the majority of headlines. Regarding Reliance’s presence at CES, Few
offered a new, different view on the utility and its business model. “We are in the energy
sector, but we see ourselves as a consumer services company,” remarked Few. This
forward-looking perspective contrasts with Greentech Media’s “Want to Learn About the
Smart Grid? Don’t Call Your Utility,” which highlights a recent thesis from a Purdue
University undergraduate student who called more than 100 utilities regarding their smart
grid technology deployments to find a dearth of available knowledge and understanding of
the industry’s pending transition. Read the respective articles here and here.
• As noted in our Transmission and Distribution Infrastructure White Paper, the connection
of renewable resources to the power grid is projected to be a major driver of U.S. T&D
infrastructure investment. However, utilities continue to encounter NIMBY-ism for new
transmission projects. The New York Times highlights the issue in “Lack of Transmission
Lines Is Restricting Wind Power,” which highlights the CREZ project in Texas, one of the
largest U.S. transmission projects in decades aimed at incorporating newly installed wind
generation resources in West Texas. During particularly windy periods, wind turbines now
have to be shut down because there is not enough transmission capacity to transport the
power. While CREZ continues to move forward, the article highlights what will continue
to be an issue for utility transmission projects and, as a result, the incorporation of
renewable energy resources in the grid. Read the article here.
• The Wall Street Journal highlights Exxon’s latest release of its Outlook for Energy: A View
to 2030, which projects an increasingly prominent role for natural gas in meeting the
world’s energy needs. In the new forecast, Exxon raised its 2030 natural gas consumption
forecast from 2009 by 7 quadrillion Btu, which raises natural gas share of global energy
consumption to 26%, above coal but below oil, which, at 32% of 2030 global consumption,
Exxon predicts will remain the world’s primary energy source. Read the WSJ summary
here.
• In his State of the Union address, President Obama set an aggressive (and broadly defined)
goal for the U.S. to get 80% of its energy from “clean” sources by 2035. For those
familiar with penetration rates of renewable energy sources like wind and solar, the target
could only make sense within the context of his follow up statement, “Some folks want
wind and solar. Others want nuclear, clean coal, and natural gas. To meet this goal, we
will need them all.” With the inclusion of coal, nuclear, and natural gas, the impact of the
President’s plan on cleantech is less clear, which Greentech Media examines here.

Energy & Power Industry UpdateFebruary 2011
LTM EBITDA Multiples1
Industry Observations
LTM Indexed Stock Performance1
Indexed LTM EBITDA Multiples1
• The Infrastructure and Industrial Services stock index has experienced a resurgence from its
twelve-month low in August 2010, though it continues to trade at a relatively low valuation.
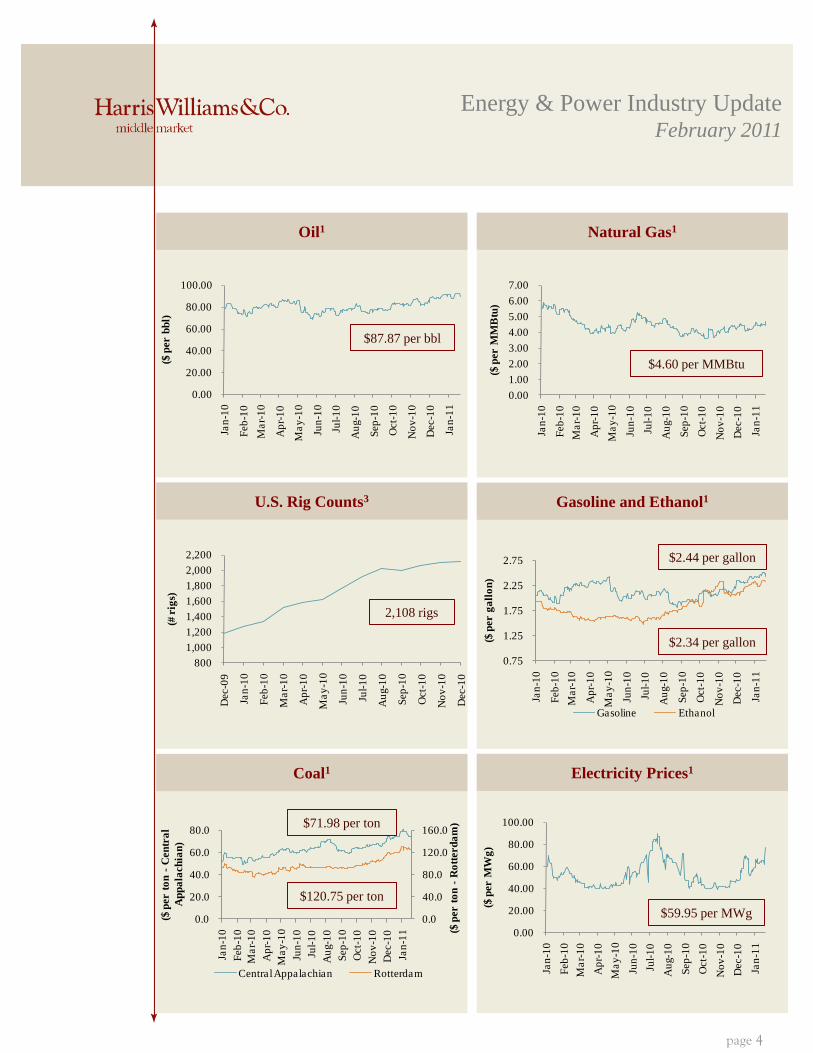
• Commodity prices have rebounded as the economic recovery fuels demand.
– The North American Rotary Rig Count climbed to 2,108 rigs in December, an 80% year-
over-year increase.
– Electricity continues to demonstrate seasonality and currently trades at $59.95 MWg,
representing a 55.7% increase from its one-year low in January 2010 but a 33.1%
decrease off its year one-year high in July 2010.
60
70
80
90
100
110
120
130
140
Jan-10 Feb-10 Mar-10 Apr-10 May-10 Jun-10 Jul-10 Aug-10 Sep-10 Oct-10 Nov-10 Dec-10 Jan-11
S&P 500 Energy Power Industrial & Infrastructure Services
Index
%
Change
S&P 18.22
Energy 21.32
Power 18.94
I & IS 29.95
Index
%
Change
Energy 9.59
Power (12.76)
I & IS (41.36)
0
20
40
60
80
100
120
140
Jan-08 Apr-08 Jul-08 Oct-08 Jan-09 Apr-09 Jul-09 Oct-09 Jan-10 Apr-10 Jul-10 Oct-10
Energy Power Industrial & Infrastructure Services
page 2
Energy & Power Industry UpdateFebruary 2011
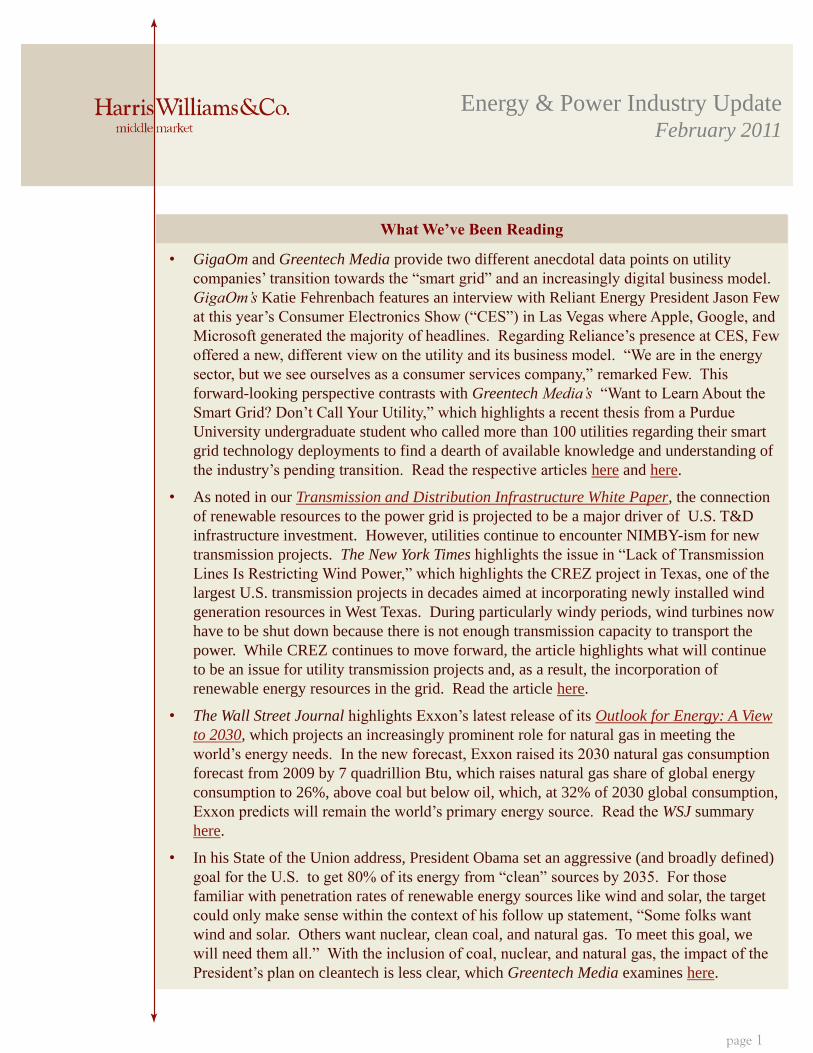
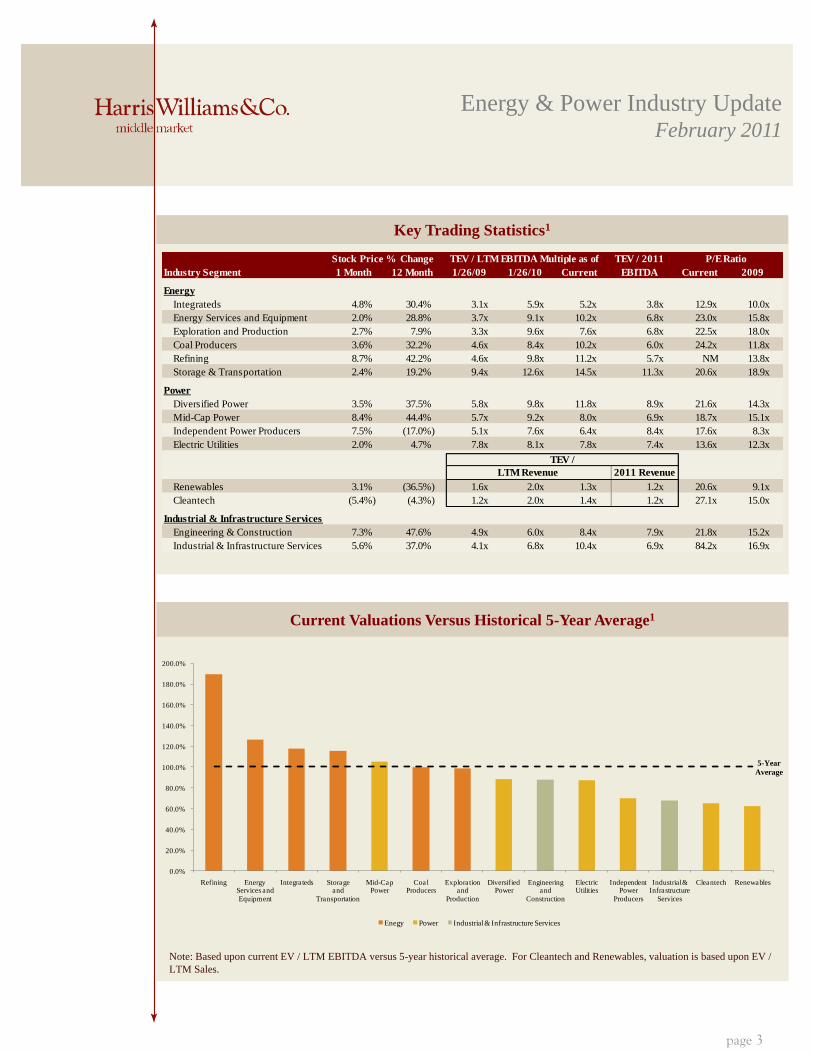
Key Trading Statistics1
Current Valuations Versus Historical 5-Year Average1
Note: Based upon current EV / LTM EBITDA versus 5-year historical average. For Cleantech and Renewables, valuation is based upon EV /
LTM Sales.
5-Year
Average
0.0%
20.0%
40.0%
60.0%
80.0%
100.0%
120.0%
140.0%
160.0%
180.0%
200.0%
Refining Energy Services and
Equipment
Integrateds Storage and
Transportation
Mid-Cap Power
Coal Producers
Exploration and
Production
Diversified Power
Engineering and
Construction
Electric Utilities
Independent Power
Producers
Industrial & Infrastructure
Services
Cleantech Renewables
page 3
0.0%
20.0%
40.0%
60.0%
80.0%
100.0%
120.0%
140.0%
160.0%
180.0%
200.0%
Enegy Power Industrial & Infrastructure Services
Enegy Power Industrial & Infrastructure Services
Stock Price % Change TEV / 2011 P/E Ratio
Industry Segment 1 Month 12 Month 1/26/09 1/26/10 Current EBITDA Current 2009
Energy
Integrateds 4.8% 30.4% 3.1x 5.9x 5.2x 3.8x 12.9x 10.0x
Energy Services and Equipment 2.0% 28.8% 3.7x 9.1x 10.2x 6.8x 23.0x 15.8x
Exploration and Production 2.7% 7.9% 3.3x 9.6x 7.6x 6.8x 22.5x 18.0x
Coal Producers 3.6% 32.2% 4.6x 8.4x 10.2x 6.0x 24.2x 11.8x
Refining 8.7% 42.2% 4.6x 9.8x 11.2x 5.7x NM 13.8x
Storage & Transportation 2.4% 19.2% 9.4x 12.6x 14.5x 11.3x 20.6x 18.9x
Power
Diversified Power 3.5% 37.5% 5.8x 9.8x 11.8x 8.9x 21.6x 14.3x
Mid-Cap Power 8.4% 44.4% 5.7x 9.2x 8.0x 6.9x 18.7x 15.1x
Independent Power Producers 7.5% (17.0%) 5.1x 7.6x 6.4x 8.4x 17.6x 8.3x
Electric Utilities 2.0% 4.7% 7.8x 8.1x 7.8x 7.4x 13.6x 12.3x
Renewables 3.1% (36.5%) 1.6x 2.0x 1.3x 1.2x 20.6x 9.1x
Cleantech (5.4%) (4.3%) 1.2x 2.0x 1.4x 1.2x 27.1x 15.0x
Industrial & Infrastructure Services
Engineering & Construction 7.3% 47.6% 4.9x 6.0x 8.4x 7.9x 21.8x 15.2x
Industrial & Infrastructure Services 5.6% 37.0% 4.1x 6.8x 10.4x 6.9x 84.2x 16.9x
2011 Revenue
TEV /
TEV / LTM EBITDA Multiple as of
LTM Revenue
Energy & Power Industry UpdateFebruary 2011
Gasoline and Ethanol1
Oil1 Natural Gas1
U.S. Rig Counts3
Electricity Prices1Coal1
0.00
20.00
40.00
60.00
80.00
100.00
Jan
-10
Feb
-10
Ma
r-1
0
Ap
r-1
0
Ma
y-1
0
Jun
-10
Jul-
10
Au
g-1
0
Sep
-10
Oct-
10
No
v-1
0
Dec-1
0
Jan
-11
($ p
er b
bl)
0.00
1.00
2.00
3.00
4.00
5.00
6.00
7.00
Jan
-10
Feb
-10
Ma
r-1
0
Ap
r-1
0
Ma
y-1
0
Jun
-10
Jul-
10
Au
g-1
0
Sep
-10
Oct-
10
No
v-1
0
Dec-1
0
Jan
-11
($ p
er M
MB
tu)
0.75
1.25
1.75
2.25
2.75
Jan
-10
Feb
-10
Ma
r-1
0
Ap
r-1
0
Ma
y-1
0
Jun
-10
Jul-
10
Au
g-1
0
Sep
-10
Oct-
10
No
v-1
0
Dec-1
0
Jan
-11
($ p
er g
all
on
)
Gasoline Ethanol
800
1,000
1,200
1,400
1,600
1,800
2,000
2,200
Dec-0
9
Jan
-10
Feb
-10
Ma
r-1
0
Ap
r-1
0
Ma
y-1
0
Jun
-10
Jul-
10
Au
g-1
0
Sep
-10
Oct-
10
No
v-1
0
Dec-1
0
(# r
igs)
0.0
40.0
80.0
120.0
160.0
0.0
20.0
40.0
60.0
80.0
Jan
-10
Feb
-10
Ma
r-1
0
Ap
r-1
0
Ma
y-1
0
Jun
-10
Jul-
10
Au
g-1
0
Sep
-10
Oct-
10
No
v-1
0
Dec-1
0
Jan
-11 ($
per t
on
-R
ott
erd
am
)
($ p
er t
on
-C
en
tra
l
Ap
pa
lach
ian
)
Central Appalachian Rotterdam
0.00
20.00
40.00
60.00
80.00
100.00
Jan
-10
Feb
-10
Ma
r-1
0
Ap
r-1
0
Ma
y-1
0
Jun
-10
Jul-
10
Au
g-1
0
Sep
-10
Oct-
10
No
v-1
0
Dec-1
0
Jan
-11
($ p
er M
Wg
)
$87.87 per bbl
$59.95 per MWg
page 4
$4.60 per MMBtu
$2.34 per gallon
$2.44 per gallon
$71.98 per ton
$120.75 per ton
2,108 rigs

Energy & Power Industry UpdateFebruary 2011
Quarterly United States E&P M&A Activity1
Select Recently Announced Energy & Power Transactions1,2
page 5
0
10
20
30
40
50
60
70
Q1 2008 Q2 2008 Q3 2008 Q4 2008 Q1 2009 Q2 2009 Q3 2009 Q4 2009 Q1 2010 Q2 2010 Q3 2010 Q4 2010 Q1 2011
Nu
mb
er o
f T
ran
sact
ion
s
Date Target Business Description Acquiror
01/27/2011 Building Knowledge Networks US based real-time building energy management
services provider
Advantage IQ, Inc.
01/26/2011 M2M Communications Corp. US based provider of wireless technology solutions for
energy management with a focus on agricultural DR
EnerNOC, Inc.
01/25/2011 Turbine Control Service Associates,
Inc.
US based provider of generator excitation control
systems for power plants
Emerson Electric Co.
01/18/2011 Energy Contractors, LLC US based provider of drilling and production services
to the oil and gas industry
Nabors Well Services
01/13/2011 Lineage Power Corporation US based power conversion products manufacturer to
communications and data networking companies
General Electric Company
01/11/2011 Empire Holdings, Inc. US based provider of scaffold rental, erection and
dismantlement services
Ashtead Group PLC
01/11/2011 MicroSeismic. Inc. US based provider of microseismic monitoring and
imaging for the exploration of hydrocarbon resources
Madrone Capital Partners, TA
Associates
01/11/2011 Remote Energy Monitoring UK based energy monitoring company allowing
consumers and utilities to manage their energy usage
General Electric Company
01/07/2011 O-Tex Pumping US based pumping service company specializing in
cementing operations and pump down services
White Deer Energy
01/06/2011 Mountain Express Oil Company US based operator of stores for the distribution of
petroleum and petroleum products
Empire Petroleum Holdings, LLC
01/05/2011 Obvient Strategies, Inc. US based provider of packaged business intelligence
for the distributed asset industry
ABB Ltd.
01/03/2011 Amega West Energy Services US based manufacturer of oilfield tools for directional
drilling
Carpenter Technology
01/03/2011 Harbison Fisher Mfg. Co. US based manufacturer of oil well pumping equipment Dover Corporation
12/21/2010 Aker Solutions (Process &
Construction business)
Norway based provider of engineering and
construction services
Jacobs Engineering Group Inc
Member FINRA/SIPC
Energy & Power Industry UpdateFebruary 2011
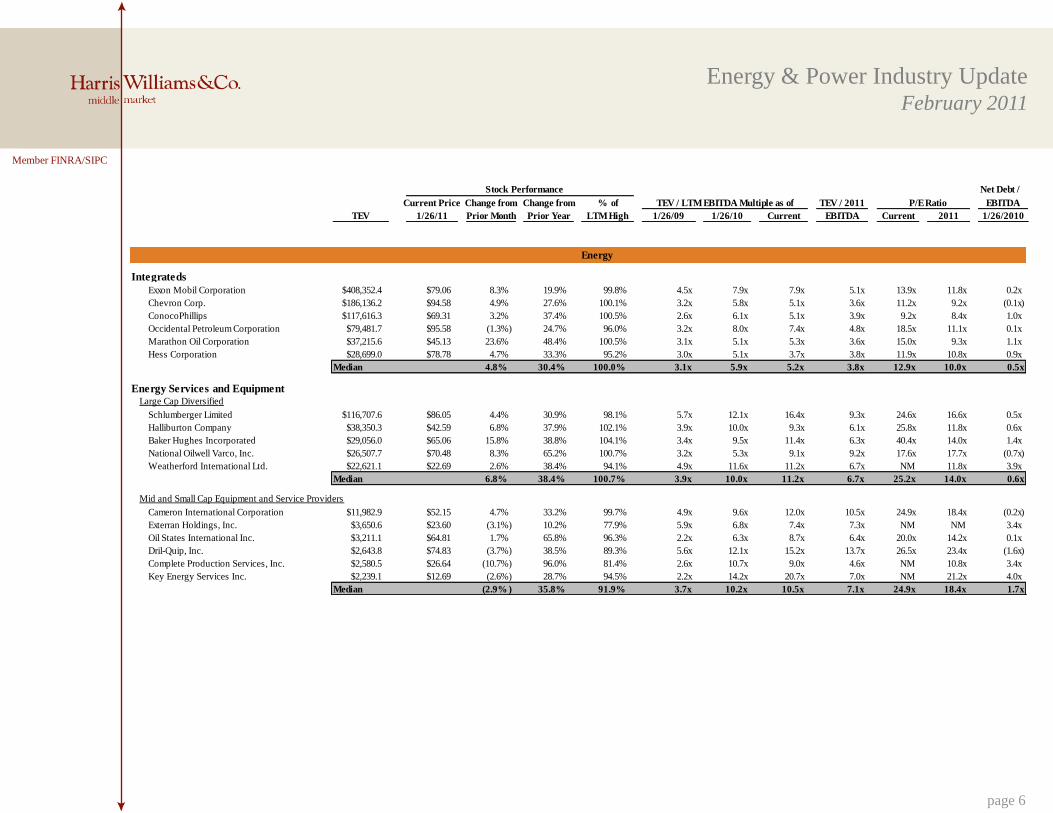
Energy
Integrateds
Exxon Mobil Corporation $408,352.4 $79.06 8.3% 19.9% 99.8% 4.5x 7.9x 7.9x 5.1x 13.9x 11.8x 0.2x
Chevron Corp. $186,136.2 $94.58 4.9% 27.6% 100.1% 3.2x 5.8x 5.1x 3.6x 11.2x 9.2x (0.1x)
ConocoPhillips $117,616.3 $69.31 3.2% 37.4% 100.5% 2.6x 6.1x 5.1x 3.9x 9.2x 8.4x 1.0x
Occidental Petroleum Corporation $79,481.7 $95.58 (1.3%) 24.7% 96.0% 3.2x 8.0x 7.4x 4.8x 18.5x 11.1x 0.1x
Marathon Oil Corporation $37,215.6 $45.13 23.6% 48.4% 100.5% 3.1x 5.1x 5.3x 3.6x 15.0x 9.3x 1.1x
Hess Corporation $28,699.0 $78.78 4.7% 33.3% 95.2% 3.0x 5.1x 3.7x 3.8x 11.9x 10.8x 0.9x
Median 4.8% 30.4% 100.0% 3.1x 5.9x 5.2x 3.8x 12.9x 10.0x 0.5x
Energy Services and EquipmentLarge Cap Diversified
Schlumberger Limited $116,707.6 $86.05 4.4% 30.9% 98.1% 5.7x 12.1x 16.4x 9.3x 24.6x 16.6x 0.5x
Halliburton Company $38,350.3 $42.59 6.8% 37.9% 102.1% 3.9x 10.0x 9.3x 6.1x 25.8x 11.8x 0.6x
Baker Hughes Incorporated $29,056.0 $65.06 15.8% 38.8% 104.1% 3.4x 9.5x 11.4x 6.3x 40.4x 14.0x 1.4x
National Oilwell Varco, Inc. $26,507.7 $70.48 8.3% 65.2% 100.7% 3.2x 5.3x 9.1x 9.2x 17.6x 17.7x (0.7x)
Weatherford International Ltd. $22,621.1 $22.69 2.6% 38.4% 94.1% 4.9x 11.6x 11.2x 6.7x NM 11.8x 3.9x
Median 6.8% 38.4% 100.7% 3.9x 10.0x 11.2x 6.7x 25.2x 14.0x 0.6x
Mid and Small Cap Equipment and Service ProvidersMid and Small Cap Equipment and Service Providers
Cameron International Corporation $11,982.9 $52.15 4.7% 33.2% 99.7% 4.9x 9.6x 12.0x 10.5x 24.9x 18.4x (0.2x)
Exterran Holdings, Inc. $3,650.6 $23.60 (3.1%) 10.2% 77.9% 5.9x 6.8x 7.4x 7.3x NM NM 3.4x
Oil States International Inc. $3,211.1 $64.81 1.7% 65.8% 96.3% 2.2x 6.3x 8.7x 6.4x 20.0x 14.2x 0.1x
Dril-Quip, Inc. $2,643.8 $74.83 (3.7%) 38.5% 89.3% 5.6x 12.1x 15.2x 13.7x 26.5x 23.4x (1.6x)
Complete Production Services, Inc. $2,580.5 $26.64 (10.7%) 96.0% 81.4% 2.6x 10.7x 9.0x 4.6x NM 10.8x 3.4x
Key Energy Services Inc. $2,239.1 $12.69 (2.6%) 28.7% 94.5% 2.2x 14.2x 20.7x 7.0x NM 21.2x 4.0x
Median (2.9% ) 35.8% 91.9% 3.7x 10.2x 10.5x 7.1x 24.9x 18.4x 1.7x
page 6
Stock Performance Net Debt /
Current Price Change from Change from % of TEV / 2011 P/E Ratio EBITDA
TEV 1/26/11 Prior Month Prior Year LTM High 1/26/09 1/26/10 Current EBITDA Current 2011 1/26/2010
TEV / LTM EBITDA Multiple as of
Member FINRA/SIPC
Energy & Power Industry UpdateFebruary 2011
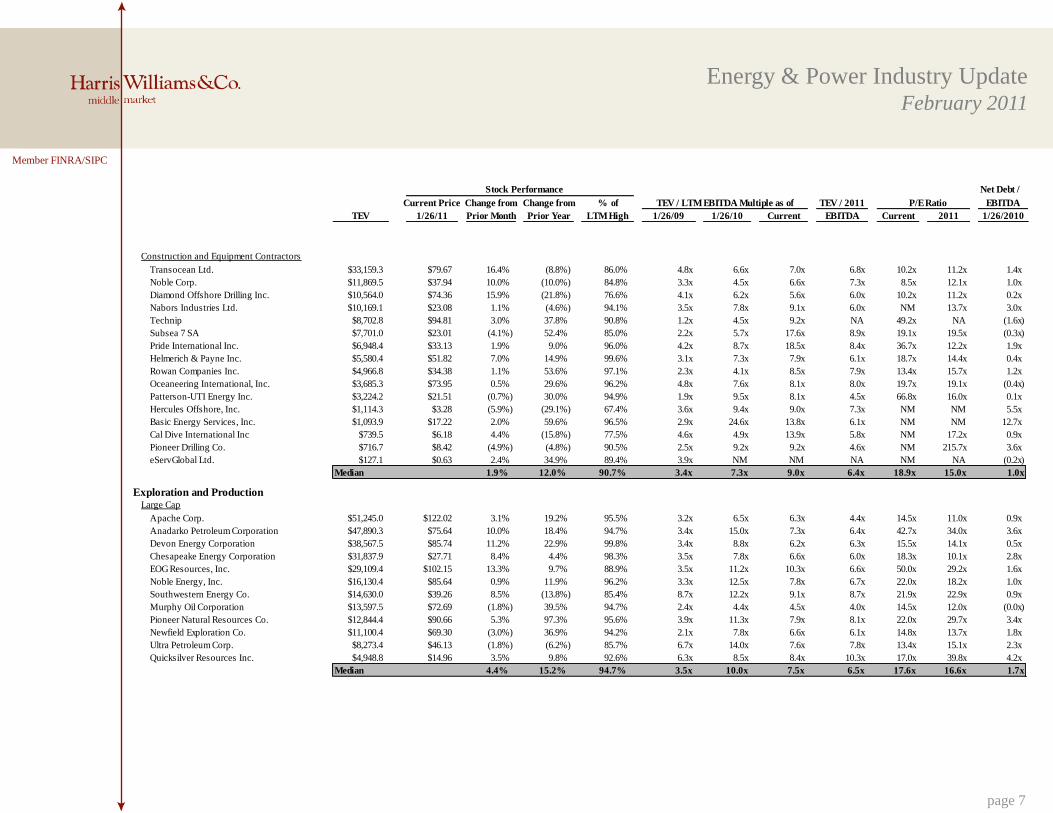
Construction and Equipment ContractorsConstruction and Equipment Contractors
Transocean Ltd. $33,159.3 $79.67 16.4% (8.8%) 86.0% 4.8x 6.6x 7.0x 6.8x 10.2x 11.2x 1.4x
Noble Corp. $11,869.5 $37.94 10.0% (10.0%) 84.8% 3.3x 4.5x 6.6x 7.3x 8.5x 12.1x 1.0x
Diamond Offshore Drilling Inc. $10,564.0 $74.36 15.9% (21.8%) 76.6% 4.1x 6.2x 5.6x 6.0x 10.2x 11.2x 0.2x
Nabors Industries Ltd. $10,169.1 $23.08 1.1% (4.6%) 94.1% 3.5x 7.8x 9.1x 6.0x NM 13.7x 3.0x
Technip $8,702.8 $94.81 3.0% 37.8% 90.8% 1.2x 4.5x 9.2x NA 49.2x NA (1.6x)
Subsea 7 SA $7,701.0 $23.01 (4.1%) 52.4% 85.0% 2.2x 5.7x 17.6x 8.9x 19.1x 19.5x (0.3x)
Pride International Inc. $6,948.4 $33.13 1.9% 9.0% 96.0% 4.2x 8.7x 18.5x 8.4x 36.7x 12.2x 1.9x
Helmerich & Payne Inc. $5,580.4 $51.82 7.0% 14.9% 99.6% 3.1x 7.3x 7.9x 6.1x 18.7x 14.4x 0.4x
Rowan Companies Inc. $4,966.8 $34.38 1.1% 53.6% 97.1% 2.3x 4.1x 8.5x 7.9x 13.4x 15.7x 1.2x
Oceaneering International, Inc. $3,685.3 $73.95 0.5% 29.6% 96.2% 4.8x 7.6x 8.1x 8.0x 19.7x 19.1x (0.4x)
Patterson-UTI Energy Inc. $3,224.2 $21.51 (0.7%) 30.0% 94.9% 1.9x 9.5x 8.1x 4.5x 66.8x 16.0x 0.1x
Hercules Offshore, Inc. $1,114.3 $3.28 (5.9%) (29.1%) 67.4% 3.6x 9.4x 9.0x 7.3x NM NM 5.5x
Basic Energy Services, Inc. $1,093.9 $17.22 2.0% 59.6% 96.5% 2.9x 24.6x 13.8x 6.1x NM NM 12.7x
Cal Dive International Inc $739.5 $6.18 4.4% (15.8%) 77.5% 4.6x 4.9x 13.9x 5.8x NM 17.2x 0.9x
Pioneer Drilling Co. $716.7 $8.42 (4.9%) (4.8%) 90.5% 2.5x 9.2x 9.2x 4.6x NM 215.7x 3.6x
eServGlobal Ltd. $127.1 $0.63 2.4% 34.9% 89.4% 3.9x NM NM NA NM NA (0.2x)
Median 1.9% 12.0% 90.7% 3.4x 7.3x 9.0x 6.4x 18.9x 15.0x 1.0x
Exploration and ProductionLarge Cap
Apache Corp. $51,245.0 $122.02 3.1% 19.2% 95.5% 3.2x 6.5x 6.3x 4.4x 14.5x 11.0x 0.9x
Anadarko Petroleum Corporation $47,890.3 $75.64 10.0% 18.4% 94.7% 3.4x 15.0x 7.3x 6.4x 42.7x 34.0x 3.6x
Devon Energy Corporation $38,567.5 $85.74 11.2% 22.9% 99.8% 3.4x 8.8x 6.2x 6.3x 15.5x 14.1x 0.5x
Chesapeake Energy Corporation $31,837.9 $27.71 8.4% 4.4% 98.3% 3.5x 7.8x 6.6x 6.0x 18.3x 10.1x 2.8x
EOG Resources, Inc. $29,109.4 $102.15 13.3% 9.7% 88.9% 3.5x 11.2x 10.3x 6.6x 50.0x 29.2x 1.6x
Noble Energy, Inc. $16,130.4 $85.64 0.9% 11.9% 96.2% 3.3x 12.5x 7.8x 6.7x 22.0x 18.2x 1.0x
Southwestern Energy Co. $14,630.0 $39.26 8.5% (13.8%) 85.4% 8.7x 12.2x 9.1x 8.7x 21.9x 22.9x 0.9x
Murphy Oil Corporation $13,597.5 $72.69 (1.8%) 39.5% 94.7% 2.4x 4.4x 4.5x 4.0x 14.5x 12.0x (0.0x)
Pioneer Natural Resources Co. $12,844.4 $90.66 5.3% 97.3% 95.6% 3.9x 11.3x 7.9x 8.1x 22.0x 29.7x 3.4x
Newfield Exploration Co. $11,100.4 $69.30 (3.0%) 36.9% 94.2% 2.1x 7.8x 6.6x 6.1x 14.8x 13.7x 1.8x
Ultra Petroleum Corp. $8,273.4 $46.13 (1.8%) (6.2%) 85.7% 6.7x 14.0x 7.6x 7.8x 13.4x 15.1x 2.3x
Quicksilver Resources Inc. $4,948.8 $14.96 3.5% 9.8% 92.6% 6.3x 8.5x 8.4x 10.3x 17.0x 39.8x 4.2x
Median 4.4% 15.2% 94.7% 3.5x 10.0x 7.5x 6.5x 17.6x 16.6x 1.7x
Stock Performance Net Debt /
Current Price Change from Change from % of TEV / 2011 P/E Ratio EBITDA
TEV 1/26/11 Prior Month Prior Year LTM High 1/26/09 1/26/10 Current EBITDA Current 2011 1/26/2010
TEV / LTM EBITDA Multiple as of
page 7
Member FINRA/SIPC
Energy & Power Industry UpdateFebruary 2011
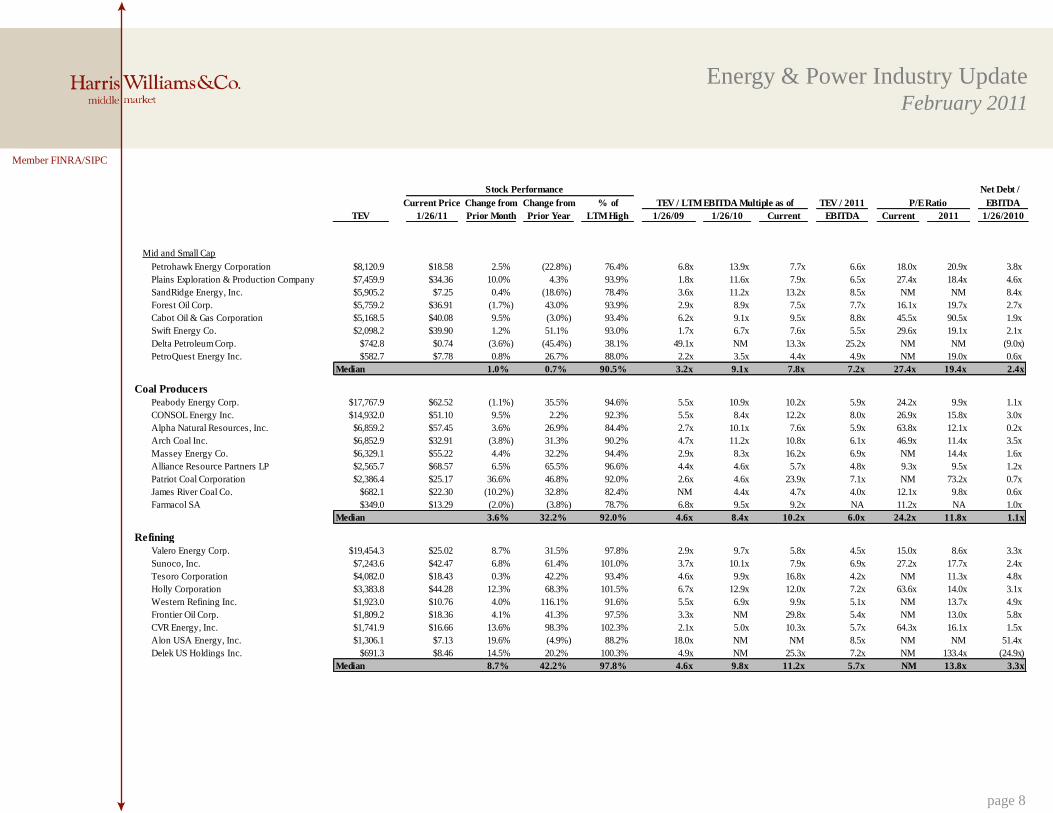
Mid and Small Cap
Petrohawk Energy Corporation $8,120.9 $18.58 2.5% (22.8%) 76.4% 6.8x 13.9x 7.7x 6.6x 18.0x 20.9x 3.8x
Plains Exploration & Production Company $7,459.9 $34.36 10.0% 4.3% 93.9% 1.8x 11.6x 7.9x 6.5x 27.4x 18.4x 4.6x
SandRidge Energy, Inc. $5,905.2 $7.25 0.4% (18.6%) 78.4% 3.6x 11.2x 13.2x 8.5x NM NM 8.4x
Forest Oil Corp. $5,759.2 $36.91 (1.7%) 43.0% 93.9% 2.9x 8.9x 7.5x 7.7x 16.1x 19.7x 2.7x
Cabot Oil & Gas Corporation $5,168.5 $40.08 9.5% (3.0%) 93.4% 6.2x 9.1x 9.5x 8.8x 45.5x 90.5x 1.9x
Swift Energy Co. $2,098.2 $39.90 1.2% 51.1% 93.0% 1.7x 6.7x 7.6x 5.5x 29.6x 19.1x 2.1x
Delta Petroleum Corp. $742.8 $0.74 (3.6%) (45.4%) 38.1% 49.1x NM 13.3x 25.2x NM NM (9.0x)
PetroQuest Energy Inc. $582.7 $7.78 0.8% 26.7% 88.0% 2.2x 3.5x 4.4x 4.9x NM 19.0x 0.6x
Median 1.0% 0.7% 90.5% 3.2x 9.1x 7.8x 7.2x 27.4x 19.4x 2.4x
Coal Producers
Peabody Energy Corp. $17,767.9 $62.52 (1.1%) 35.5% 94.6% 5.5x 10.9x 10.2x 5.9x 24.2x 9.9x 1.1x
CONSOL Energy Inc. $14,932.0 $51.10 9.5% 2.2% 92.3% 5.5x 8.4x 12.2x 8.0x 26.9x 15.8x 3.0x
Alpha Natural Resources, Inc. $6,859.2 $57.45 3.6% 26.9% 84.4% 2.7x 10.1x 7.6x 5.9x 63.8x 12.1x 0.2x
Arch Coal Inc. $6,852.9 $32.91 (3.8%) 31.3% 90.2% 4.7x 11.2x 10.8x 6.1x 46.9x 11.4x 3.5x
Massey Energy Co. $6,329.1 $55.22 4.4% 32.2% 94.4% 2.9x 8.3x 16.2x 6.9x NM 14.4x 1.6x
Alliance Resource Partners LP $2,565.7 $68.57 6.5% 65.5% 96.6% 4.4x 4.6x 5.7x 4.8x 9.3x 9.5x 1.2x
Patriot Coal Corporation $2,386.4 $25.17 36.6% 46.8% 92.0% 2.6x 4.6x 23.9x 7.1x NM 73.2x 0.7x
James River Coal Co. $682.1 $22.30 (10.2%) 32.8% 82.4% NM 4.4x 4.7x 4.0x 12.1x 9.8x 0.6x
Farmacol SA $349.0 $13.29 (2.0%) (3.8%) 78.7% 6.8x 9.5x 9.2x NA 11.2x NA 1.0x
Median 3.6% 32.2% 92.0% 4.6x 8.4x 10.2x 6.0x 24.2x 11.8x 1.1x
Refining
Valero Energy Corp. $19,454.3 $25.02 8.7% 31.5% 97.8% 2.9x 9.7x 5.8x 4.5x 15.0x 8.6x 3.3x
Sunoco, Inc. $7,243.6 $42.47 6.8% 61.4% 101.0% 3.7x 10.1x 7.9x 6.9x 27.2x 17.7x 2.4x
Tesoro Corporation $4,082.0 $18.43 0.3% 42.2% 93.4% 4.6x 9.9x 16.8x 4.2x NM 11.3x 4.8x
Holly Corporation $3,383.8 $44.28 12.3% 68.3% 101.5% 6.7x 12.9x 12.0x 7.2x 63.6x 14.0x 3.1x
Western Refining Inc. $1,923.0 $10.76 4.0% 116.1% 91.6% 5.5x 6.9x 9.9x 5.1x NM 13.7x 4.9x
Frontier Oil Corp. $1,809.2 $18.36 4.1% 41.3% 97.5% 3.3x NM 29.8x 5.4x NM 13.0x 5.8x
CVR Energy, Inc. $1,741.9 $16.66 13.6% 98.3% 102.3% 2.1x 5.0x 10.3x 5.7x 64.3x 16.1x 1.5x
Alon USA Energy, Inc. $1,306.1 $7.13 19.6% (4.9%) 88.2% 18.0x NM NM 8.5x NM NM 51.4x
Delek US Holdings Inc. $691.3 $8.46 14.5% 20.2% 100.3% 4.9x NM 25.3x 7.2x NM 133.4x (24.9x)
Median 8.7% 42.2% 97.8% 4.6x 9.8x 11.2x 5.7x NM 13.8x 3.3x
Stock Performance Net Debt /
Current Price Change from Change from % of TEV / 2011 P/E Ratio EBITDA
TEV 1/26/11 Prior Month Prior Year LTM High 1/26/09 1/26/10 Current EBITDA Current 2011 1/26/2010
TEV / LTM EBITDA Multiple as of
page 8
Member FINRA/SIPC
Energy & Power Industry UpdateFebruary 2011
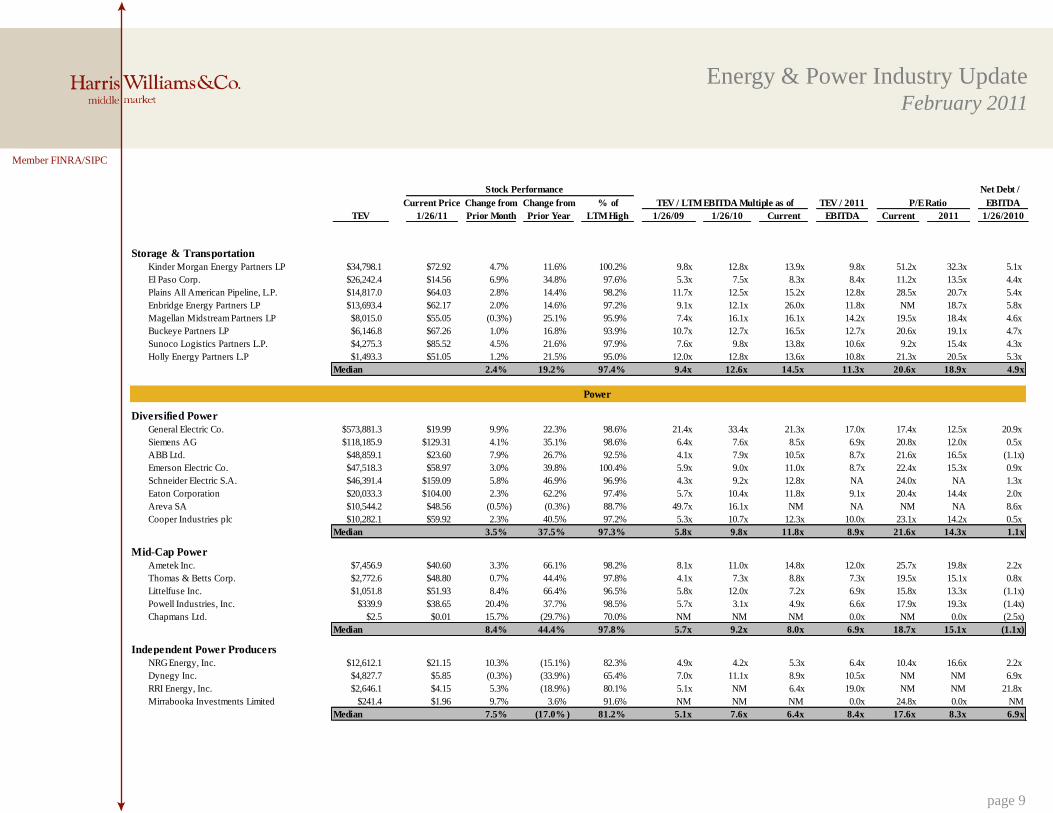
Storage & Transportation
Kinder Morgan Energy Partners LP $34,798.1 $72.92 4.7% 11.6% 100.2% 9.8x 12.8x 13.9x 9.8x 51.2x 32.3x 5.1x
El Paso Corp. $26,242.4 $14.56 6.9% 34.8% 97.6% 5.3x 7.5x 8.3x 8.4x 11.2x 13.5x 4.4x
Plains All American Pipeline, L.P. $14,817.0 $64.03 2.8% 14.4% 98.2% 11.7x 12.5x 15.2x 12.8x 28.5x 20.7x 5.4x
Enbridge Energy Partners LP $13,693.4 $62.17 2.0% 14.6% 97.2% 9.1x 12.1x 26.0x 11.8x NM 18.7x 5.8x
Magellan Midstream Partners LP $8,015.0 $55.05 (0.3%) 25.1% 95.9% 7.4x 16.1x 16.1x 14.2x 19.5x 18.4x 4.6x
Buckeye Partners LP $6,146.8 $67.26 1.0% 16.8% 93.9% 10.7x 12.7x 16.5x 12.7x 20.6x 19.1x 4.7x
Sunoco Logistics Partners L.P. $4,275.3 $85.52 4.5% 21.6% 97.9% 7.6x 9.8x 13.8x 10.6x 9.2x 15.4x 4.3x
Holly Energy Partners L.P $1,493.3 $51.05 1.2% 21.5% 95.0% 12.0x 12.8x 13.6x 10.8x 21.3x 20.5x 5.3x
Median 2.4% 19.2% 97.4% 9.4x 12.6x 14.5x 11.3x 20.6x 18.9x 4.9x
Power
Diversified Power
General Electric Co. $573,881.3 $19.99 9.9% 22.3% 98.6% 21.4x 33.4x 21.3x 17.0x 17.4x 12.5x 20.9x
Siemens AG $118,185.9 $129.31 4.1% 35.1% 98.6% 6.4x 7.6x 8.5x 6.9x 20.8x 12.0x 0.5x
ABB Ltd. $48,859.1 $23.60 7.9% 26.7% 92.5% 4.1x 7.9x 10.5x 8.7x 21.6x 16.5x (1.1x)
Emerson Electric Co. $47,518.3 $58.97 3.0% 39.8% 100.4% 5.9x 9.0x 11.0x 8.7x 22.4x 15.3x 0.9x
Schneider Electric S.A. $46,391.4 $159.09 5.8% 46.9% 96.9% 4.3x 9.2x 12.8x NA 24.0x NA 1.3x
Eaton Corporation $20,033.3 $104.00 2.3% 62.2% 97.4% 5.7x 10.4x 11.8x 9.1x 20.4x 14.4x 2.0x
Areva SA $10,544.2 $48.56 (0.5%) (0.3%) 88.7% 49.7x 16.1x NM NA NM NA 8.6x
Cooper Industries plc $10,282.1 $59.92 2.3% 40.5% 97.2% 5.3x 10.7x 12.3x 10.0x 23.1x 14.2x 0.5x
Median 3.5% 37.5% 97.3% 5.8x 9.8x 11.8x 8.9x 21.6x 14.3x 1.1x
Mid-Cap Power
Ametek Inc. $7,456.9 $40.60 3.3% 66.1% 98.2% 8.1x 11.0x 14.8x 12.0x 25.7x 19.8x 2.2x
Thomas & Betts Corp. $2,772.6 $48.80 0.7% 44.4% 97.8% 4.1x 7.3x 8.8x 7.3x 19.5x 15.1x 0.8x
Littelfuse Inc. $1,051.8 $51.93 8.4% 66.4% 96.5% 5.8x 12.0x 7.2x 6.9x 15.8x 13.3x (1.1x)
Powell Industries, Inc. $339.9 $38.65 20.4% 37.7% 98.5% 5.7x 3.1x 4.9x 6.6x 17.9x 19.3x (1.4x)
Chapmans Ltd. $2.5 $0.01 15.7% (29.7%) 70.0% NM NM NM 0.0x NM 0.0x (2.5x)
Median 8.4% 44.4% 97.8% 5.7x 9.2x 8.0x 6.9x 18.7x 15.1x (1.1x)
Independent Power Producers
NRG Energy, Inc. $12,612.1 $21.15 10.3% (15.1%) 82.3% 4.9x 4.2x 5.3x 6.4x 10.4x 16.6x 2.2x
Dynegy Inc. $4,827.7 $5.85 (0.3%) (33.9%) 65.4% 7.0x 11.1x 8.9x 10.5x NM NM 6.9x
RRI Energy, Inc. $2,646.1 $4.15 5.3% (18.9%) 80.1% 5.1x NM 6.4x 19.0x NM NM 21.8x
Mirrabooka Investments Limited $241.4 $1.96 9.7% 3.6% 91.6% NM NM NM 0.0x 24.8x 0.0x NM
Median 7.5% (17.0% ) 81.2% 5.1x 7.6x 6.4x 8.4x 17.6x 8.3x 6.9x
Stock Performance Net Debt /
Current Price Change from Change from % of TEV / 2011 P/E Ratio EBITDA
TEV 1/26/11 Prior Month Prior Year LTM High 1/26/09 1/26/10 Current EBITDA Current 2011 1/26/2010
TEV / LTM EBITDA Multiple as of
page 9
Member FINRA/SIPC
Energy & Power Industry UpdateFebruary 2011
Stock Performance Net Debt /
Current Price Change from Change from % of TEV / 2011 P/E Ratio EBITDA
TEV 1/26/11 Prior Month Prior Year LTM High 1/26/09 1/26/10 Current EBITDA Current 2011 1/26/2010
TEV / LTM EBITDA Multiple as of
page 10
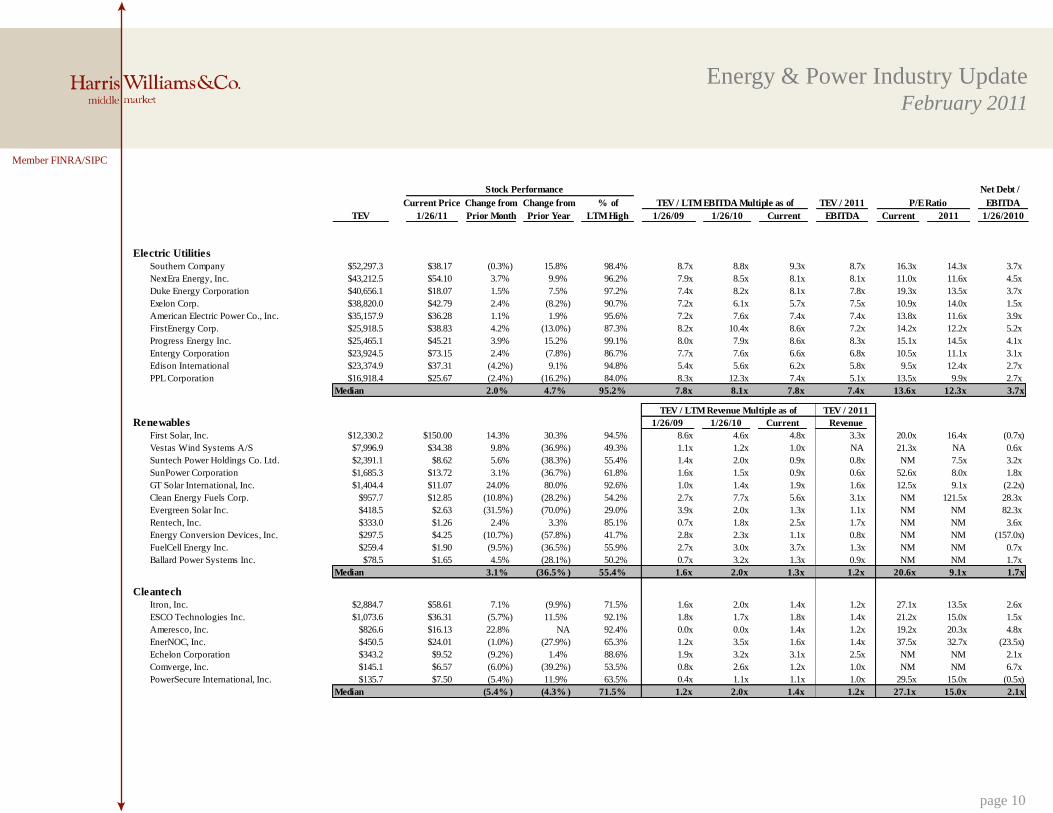
Electric Utilities
Southern Company $52,297.3 $38.17 (0.3%) 15.8% 98.4% 8.7x 8.8x 9.3x 8.7x 16.3x 14.3x 3.7x
NextEra Energy, Inc. $43,212.5 $54.10 3.7% 9.9% 96.2% 7.9x 8.5x 8.1x 8.1x 11.0x 11.6x 4.5x
Duke Energy Corporation $40,656.1 $18.07 1.5% 7.5% 97.2% 7.4x 8.2x 8.1x 7.8x 19.3x 13.5x 3.7x
Exelon Corp. $38,820.0 $42.79 2.4% (8.2%) 90.7% 7.2x 6.1x 5.7x 7.5x 10.9x 14.0x 1.5x
American Electric Power Co., Inc. $35,157.9 $36.28 1.1% 1.9% 95.6% 7.2x 7.6x 7.4x 7.4x 13.8x 11.6x 3.9x
FirstEnergy Corp. $25,918.5 $38.83 4.2% (13.0%) 87.3% 8.2x 10.4x 8.6x 7.2x 14.2x 12.2x 5.2x
Progress Energy Inc. $25,465.1 $45.21 3.9% 15.2% 99.1% 8.0x 7.9x 8.6x 8.3x 15.1x 14.5x 4.1x
Entergy Corporation $23,924.5 $73.15 2.4% (7.8%) 86.7% 7.7x 7.6x 6.6x 6.8x 10.5x 11.1x 3.1x
Edison International $23,374.9 $37.31 (4.2%) 9.1% 94.8% 5.4x 5.6x 6.2x 5.8x 9.5x 12.4x 2.7x
PPL Corporation $16,918.4 $25.67 (2.4%) (16.2%) 84.0% 8.3x 12.3x 7.4x 5.1x 13.5x 9.9x 2.7x
Median 2.0% 4.7% 95.2% 7.8x 8.1x 7.8x 7.4x 13.6x 12.3x 3.7x
Renewables 1/26/09 1/26/10 Current
First Solar, Inc. $12,330.2 $150.00 14.3% 30.3% 94.5% 8.6x 4.6x 4.8x 3.3x 20.0x 16.4x (0.7x)
Vestas Wind Systems A/S $7,996.9 $34.38 9.8% (36.9%) 49.3% 1.1x 1.2x 1.0x NA 21.3x NA 0.6x
Suntech Power Holdings Co. Ltd. $2,391.1 $8.62 5.6% (38.3%) 55.4% 1.4x 2.0x 0.9x 0.8x NM 7.5x 3.2x
SunPower Corporation $1,685.3 $13.72 3.1% (36.7%) 61.8% 1.6x 1.5x 0.9x 0.6x 52.6x 8.0x 1.8x
GT Solar International, Inc. $1,404.4 $11.07 24.0% 80.0% 92.6% 1.0x 1.4x 1.9x 1.6x 12.5x 9.1x (2.2x)
Clean Energy Fuels Corp. $957.7 $12.85 (10.8%) (28.2%) 54.2% 2.7x 7.7x 5.6x 3.1x NM 121.5x 28.3x
Evergreen Solar Inc. $418.5 $2.63 (31.5%) (70.0%) 29.0% 3.9x 2.0x 1.3x 1.1x NM NM 82.3x
Rentech, Inc. $333.0 $1.26 2.4% 3.3% 85.1% 0.7x 1.8x 2.5x 1.7x NM NM 3.6x
Energy Conversion Devices, Inc. $297.5 $4.25 (10.7%) (57.8%) 41.7% 2.8x 2.3x 1.1x 0.8x NM NM (157.0x)
FuelCell Energy Inc. $259.4 $1.90 (9.5%) (36.5%) 55.9% 2.7x 3.0x 3.7x 1.3x NM NM 0.7x
Ballard Power Systems Inc. $78.5 $1.65 4.5% (28.1%) 50.2% 0.7x 3.2x 1.3x 0.9x NM NM 1.7x
Median 3.1% (36.5% ) 55.4% 1.6x 2.0x 1.3x 1.2x 20.6x 9.1x 1.7x
Cleantech
Itron, Inc. $2,884.7 $58.61 7.1% (9.9%) 71.5% 1.6x 2.0x 1.4x 1.2x 27.1x 13.5x 2.6x
ESCO Technologies Inc. $1,073.6 $36.31 (5.7%) 11.5% 92.1% 1.8x 1.7x 1.8x 1.4x 21.2x 15.0x 1.5x
Ameresco, Inc. $826.6 $16.13 22.8% NA 92.4% 0.0x 0.0x 1.4x 1.2x 19.2x 20.3x 4.8x
EnerNOC, Inc. $450.5 $24.01 (1.0%) (27.9%) 65.3% 1.2x 3.5x 1.6x 1.4x 37.5x 32.7x (23.5x)
Echelon Corporation $343.2 $9.52 (9.2%) 1.4% 88.6% 1.9x 3.2x 3.1x 2.5x NM NM 2.1x
Comverge, Inc. $145.1 $6.57 (6.0%) (39.2%) 53.5% 0.8x 2.6x 1.2x 1.0x NM NM 6.7x
PowerSecure International, Inc. $135.7 $7.50 (5.4%) 11.9% 63.5% 0.4x 1.1x 1.1x 1.0x 29.5x 15.0x (0.5x)
Median (5.4% ) (4.3% ) 71.5% 1.2x 2.0x 1.4x 1.2x 27.1x 15.0x 2.1x
Revenue
TEV / LTM Revenue Multiple as of TEV / 2011

Member FINRA/SIPC
Energy & Power Industry UpdateFebruary 2011
Stock Performance Net Debt /
Current Price Change from Change from % of TEV / 2011 P/E Ratio EBITDA
TEV 1/26/11 Prior Month Prior Year LTM High 1/26/09 1/26/10 Current EBITDA Current 2011 1/26/2010
TEV / LTM EBITDA Multiple as of
page 11
Industrial & Infrastructure Services
Engineering & Construction
Fluor Corporation $10,578.4 $71.48 7.3% 52.9% 98.2% 4.6x 5.0x 11.1x 9.3x 32.8x 21.2x (1.6x)
Jacobs Engineering Group Inc. $5,390.1 $52.99 15.7% 36.1% 95.1% 5.9x 6.0x 10.0x 8.0x 25.3x 16.7x (1.3x)
McDermott International Inc. $4,068.1 $20.05 (1.0%) (13.0%) 69.2% 2.3x 6.9x 5.6x 8.4x 10.4x 15.2x (0.9x)
URS Corporation $3,976.4 $44.44 6.1% (2.2%) 83.5% 7.4x 7.6x 6.5x 5.5x 13.7x 11.9x 0.4x
KBR, Inc. $3,772.2 $32.39 9.8% 67.3% 97.8% 2.5x 3.7x 6.7x 5.9x 16.0x 14.7x (1.9x)
Dresser-Rand Group Inc. $3,586.6 $45.14 6.0% 47.6% 100.8% 4.9x 6.6x 10.8x 10.1x 26.5x 20.4x 0.1x
Chicago Bridge & Iron Company N.V. $3,091.8 $33.89 3.8% 58.0% 92.8% 14.6x 5.8x 8.9x 7.3x 18.3x 14.3x (0.7x)
Shaw Group Inc. $2,621.7 $38.45 11.0% 27.3% 95.0% 6.9x 5.3x 7.8x 5.9x 33.5x 14.3x (2.0x)
ENGlobal Corp. $131.4 $4.79 27.1% 54.5% 106.4% 3.3x 12.3x NM 7.9x NM 15.4x 1.6x
Median 7.3% 47.6% 95.1% 4.9x 6.0x 8.4x 7.9x 21.8x 15.2x (0.9x)
Industrial & Infrastructure Services
EMCOR Group Inc. $1,457.5 $30.12 0.8% 24.3% 100.0% 3.5x 3.5x 5.5x 5.2x NM 14.0x (1.5x)
Cape plc $988.7 $7.04 14.3% 95.1% 93.9% 2.9x 4.8x 7.1x NA NM NA 1.1x
Team Inc. $554.0 $25.97 10.4% 49.7% 97.4% 8.1x 9.9x 11.9x 8.3x 28.7x 16.9x 1.6x
Pike Electric Corporation $396.5 $8.83 (2.9%) 5.1% 79.9% 5.5x 6.4x 12.4x 6.9x NM 30.1x 1.8x
Furmanite Corporation $271.9 $7.90 14.7% 150.8% 97.8% 4.7x 15.0x 15.6x 9.0x 187.5x 17.4x (1.3x)
Matrix Service Co. $247.7 $11.25 (8.0%) 7.8% 89.3% 2.1x 7.3x 9.0x 4.3x 84.2x 10.7x NM
Median 5.6% 37.0% 95.7% 4.1x 6.8x 10.4x 6.9x 84.2x 16.9x 1.1x
Energy & Power Industry UpdateFebruary 2011
page 12
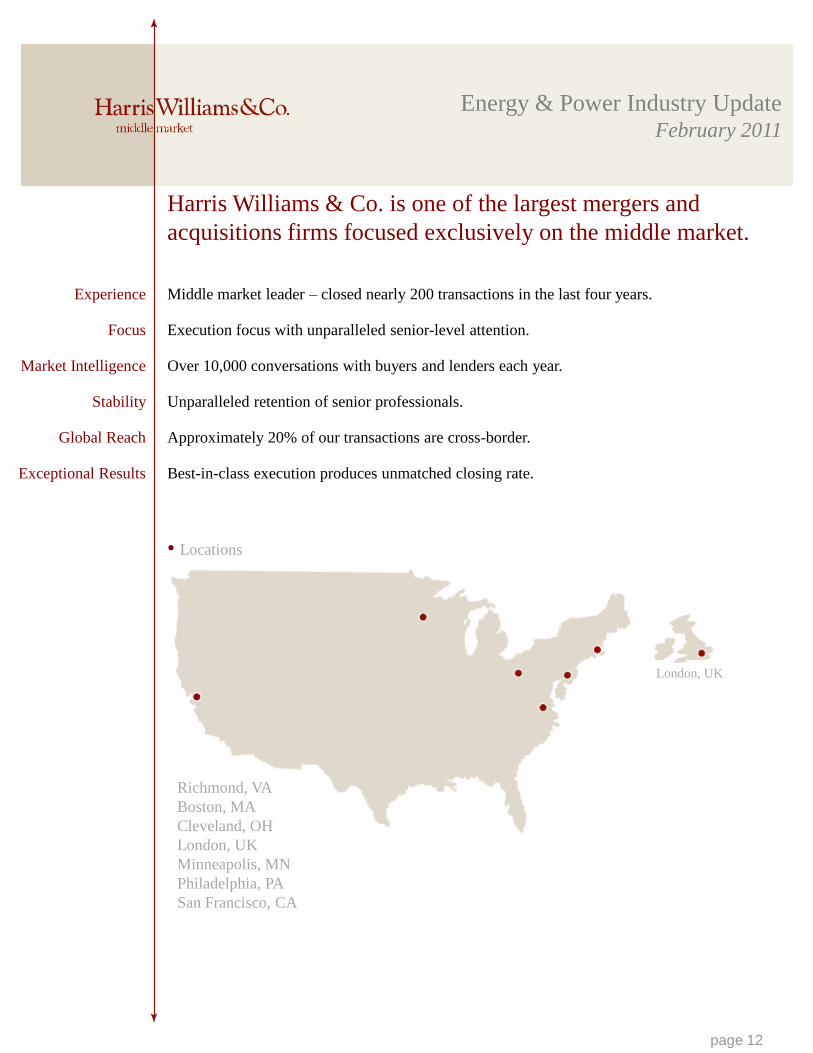
Harris Williams & Co. is one of the largest mergers and
acquisitions firms focused exclusively on the middle market.
Experience
Focus
Market Intelligence
Stability
Global Reach
Exceptional Results
Middle market leader – closed nearly 200 transactions in the last four years.
Execution focus with unparalleled senior-level attention.
Over 10,000 conversations with buyers and lenders each year.
Unparalleled retention of senior professionals.
Approximately 20% of our transactions are cross-border.
Best-in-class execution produces unmatched closing rate.
• Locations
London, UK
Richmond, VA
Boston, MA
Cleveland, OH
London, UK
Minneapolis, MN
Philadelphia, PA
San Francisco, CA
Energy & Power Industry UpdateFebruary 2011
page 13
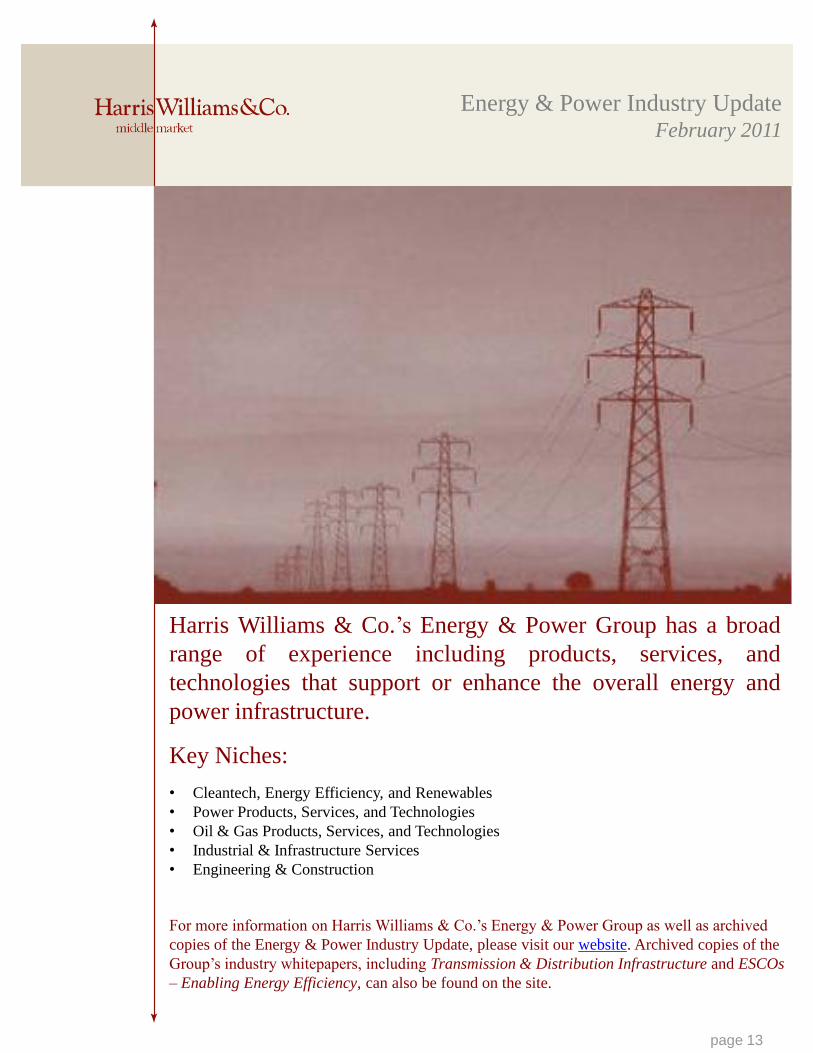
Harris Williams & Co.’s Energy & Power Group has a broad
range of experience including products, services, and
technologies that support or enhance the overall energy and
power infrastructure.
Key Niches:
• Cleantech, Energy Efficiency, and Renewables
• Power Products, Services, and Technologies
• Oil & Gas Products, Services, and Technologies
• Industrial & Infrastructure Services
• Engineering & Construction
For more information on Harris Williams & Co.’s Energy & Power Group as well as archived
copies of the Energy & Power Industry Update, please visit our website. Archived copies of the
Group’s industry whitepapers, including Transmission & Distribution Infrastructure and ESCOs
– Enabling Energy Efficiency, can also be found on the site.
Energy & Power Industry UpdateFebruary 2011
page 14
Mr. Armstrong co-leads the Energy & Power Group and was Harris Williams & Co.’s second employee, joining the
firm in 1993. In 1999, Mr. Armstrong founded the San Francisco office and has over 19 years of transactional
experience focused in middle market mergers and acquisitions assignments. Having directed over 125 mergers and
acquisitions transactions during his career, Mr. Armstrong has worked across industries including energy and power,
consumer products, building products, business services, distribution, retailing, specialty chemicals, and technology.
As Co-Head of the Energy & Power Group, Mr. Armstrong specializes on the Power segment. Prior to joining Harris
Williams & Co., Mr. Armstrong was with Wheat First Butcher Singer (now Wells Fargo). He earned a B.S. with a
concentration in Finance from the University of Virginia's McIntire School of Commerce and is also a Chartered
Financial Analyst. Mr. Armstrong was past president and director of the San Francisco Chapter of ACG and is
currently a director of the Greater Richmond YMCA.
Mr. Spitzer founded and co-leads the Energy & Power Group at Harris Williams & Co. Over his investment banking
career, Mr. Spitzer has advised clients on a variety of merger and acquisition and strategic advisory assignments, as
well as corporate financings. Mr. Spitzer has advised a diverse range of manufacturing and service businesses in the
energy and power industries. Key niche focus areas have included demand response solutions, power quality
equipment, infrastructure and industrial services, and oilfield products and services. Prior to focusing on energy and
power companies, Mr. Spitzer developed experience in numerous industries including industrial manufacturing,
chemicals, automotive, aerospace and defense, business services, and consumer products. Prior to joining Harris
Williams & Co., Mr. Spitzer worked in the General Industrial Group at Banc of America Securities, LLC and in the
Investment Banking Group at Goldman Sachs & Co. Mr. Spitzer earned an M.B.A. with Honors from Columbia
Business School, where he served as the Caplan Fellow. Mr. Spitzer earned a B.A. in Economics from the University
of Virginia.
Mr. Lucas re-joined Harris Williams & Co. following the completion of an M.B.A. from The Wharton School at the
University of Pennsylvania. Prior to business school, Mr. Lucas served as an Associate with Harris Williams & Co.,
working on mergers and acquisitions transactions in a broad range of industries, including general industrial,
consumer products, plastics, and waste equipment/services. Before re-joining Harris Williams & Co., Mr. Lucas
worked as an Associate with Graham Partners, a private equity group in Philadelphia. Previous experience also
includes work as an Investment Banking Analyst with JP Morgan. Mr. Lucas earned a B.S. in Commerce, with a
concentration in Finance from The McIntire School of Commerce at the University of Virginia.
Prior to joining Harris Williams & Co., Mr. White worked as an Associate in the Equity Capital Markets Group at
SunTrust Robinson Humphrey. Previous experience also includes work in the Capital Finance Group at Wachovia
Securities (now Wells Fargo) where he focused on acquisition financing, growth capital, and workout situations. Mr.
White earned an M.B.A. from the Goizueta Business School at Emory University and a B.S. in Business
Administration from the University of North Carolina at Chapel Hill.
Tiff B. Armstrong
Managing [email protected]
(804) 648-0072
Andrew G. Spitzer
Managing [email protected]
(804) 915-0174
Brian S. Lucas
Vice [email protected]
(804) 932-1323
Matthew G. White
Vice [email protected]
(804) 915-0131
Energy & Power Industry UpdateFebruary 2011
page 15
Sources:
1. Capital IQ.
2. MergerMarket.
3. Baker Hughes.
Harris Williams & Co. (www.harriswilliams.com), a member of The PNC Financial Services Group, Inc.
(NYSE:PNC), is the premier middle market advisor with a two decade legacy of sell side excellence serving
clients worldwide. The firm is focused exclusively on the middle market providing sell side and acquisition
advisory, restructuring advisory, board advisory, private placements and capital markets advisory services.
Cobblestone | Harris Williams (www.cobblestonehw.com) is a specialty group of Harris Williams & Co.
Cobblestone provides trustworthy advice and superior execution on private company sales, corporate
divestitures, acquisitions, recapitalizations, restructurings and complex valuations for lower-middle market
transactions. Cobblestone’s professionals have advised on M&A and financing transactions representing more
than $4 billion in value since 1998, making it one of the nation's most experienced and successful advisors
dedicated solely to the lower-middle market.
Investment banking services are provided by Harris Williams LLC, a registered broker-dealer and member of
FINRA and SIPC, and Harris Williams & Co. Ltd, an Appointed Representative of Sturgeon Ventures LLP,
which is Authorised and Regulated by the Financial Services Authority. Harris Williams & Co. is a trade name
under which Harris Williams LLC and Harris Williams & Co. Ltd conduct business in the U.S. and Europe,
respectively.
THIS REPORT MAY CONTAIN REFERENCES TO REGISTERED TRADEMARKS, SERVICE
MARKS AND COPYRIGHTS OWNED BY THIRD-PARTY INFORMATION PROVIDERS. NONE
OF THE THIRD-PARTY INFORMATION PROVIDERS IS ENDORSING THE OFFERING OF, AND
SHALL NOT IN ANY WAY BE DEEMED AN ISSUER OR UNDERWRITER OF, THE SECURITIES,
FINANCIAL INSTRUMENTS OR OTHER INVESTMENTS DISCUSSED IN THIS REPORT, AND
SHALL NOT HAVE ANY LIABILITY OR RESPONSIBILITY FOR ANY STATEMENTS MADE IN
THE REPORT OR FOR ANY FINANCIAL STATEMENTS, FINANCIAL PROJECTIONS OR
OTHER FINANCIAL INFORMATION CONTAINED OR ATTACHED AS AN EXHIBIT TO THE
REPORT. FOR MORE INFORMATION ABOUT THE MATERIALS PROVIDED BY SUCH THIRD
PARTIES, PLEASE CONTACT US AT THE BELOW ADDRESSES OR NUMBER.
The information and views contained in this report were prepared by Harris Williams & Co. (“Harris Williams”).
It is not a research report, as such term is defined by applicable law and regulations, and is provided for
informational purposes only. It is not to be construed as an offer to buy or sell or a solicitation of an offer to buy
or sell any financial instruments or to participate in any particular trading strategy. The information contained
herein is believed by Harris Williams to be reliable, but Harris Williams makes no representation as to the
accuracy or completeness of such information. Harris Williams and/or its affiliates may be market makers or
specialists in, act as advisers or lenders to, have positions in and effect transactions in securities of companies
mentioned herein and also may provide, may have provided, or may seek to provide investment banking services
for those companies. In addition, Harris Williams and/or its affiliates or their respective officers, directors and
employees may hold long or short positions in the securities, options thereon or other related financial products
of companies discussed herein. Opinions, estimates and projections in this report constitute Harris Williams’
judgment and are subject to change without notice. The financial instruments discussed in this report may not be
suitable for all investors, and investors must make their own investment decisions using their own independent
advisors as they believe necessary and based upon their specific financial situations and investment objectives.
Also, past performance is not necessarily indicative of future results. No part of this material may be copied or
duplicated in any form or by any means, or redistributed, without Harris Williams’ prior written consent.
Copyright© 2011 Harris Williams & Co., all rights reserved.
Energy & Power Industry UpdateFebruary 2011
1001 Haxall Point
9th Floor
Richmond, VA 23219
P: (804) 648-0072
F: (804) 648-0073
www.harriswilliams.com
Two International Place
24th Floor
Boston, MA 02110
Phone: (617) 482-7501
Fax: (617) 482-7503
1900 East 9th Street
20th Floor
Cleveland, OH 44114
Phone: (216) 689-2400
Fax: (216) 689-2401
63 Brook Street
London, W1K 4HS
Phone: +44 20 7518 8900
Fax: +44 20 7526 2187
222 South Ninth Street
Suite 3350
Minneapolis, MN 55402
Phone: (612) 359-2700
Fax: (612) 359-2701
1600 Market Street
21st Floor
Philadelphia, PA 19103
Phone: (267) 675-5900
Fax: (267) 675-5901
575 Market Street
31st Floor
San Francisco, CA 94105
Phone: (415) 288-4260
Fax: (415) 288-4269
© 2011. Investment banking services are provided by Harris Williams LLC, a registered broker-dealer and member of FINRA and SIPC, and Harris Williams
& Co. Ltd, an Appointed Representative of Sturgeon Ventures LLP, which is authorised and regulated by the FSA. Harris Williams & Co. is a trade name
under which Harris Williams LLC and Harris Williams & Co. Ltd conduct business in the U.S. and Europe, respectively.
page 16


