
Medium-sized industrial companiesin North-West Italy (2010)
Emanuela Salerno, Mediobanca Research Department
Genova, 24 may 2010
1


3
In 2007
• 1,867 medium-sized companies
(1,826 including groups)
• 23 medium-sized companies in
Genova
• 50-499 employees
• € 13-290m turnover
• Limited companies
Source: Unioncamere Research Centre
Territory Section I

4
Large groups8,4
Large, non Italian, groups
13,0
Medium-large10,3
Medium-sized18,3
Small businesses50,0
Italian manufacturing: VA by limited companies, 2007
Territory Section I
Fourth capitalism
Without allied industries
With allied industries
25-30%
Medium-sized
companies in North-
West Italy = 7,9%
Estimates based on Mediobanca and Unioncamere data
5
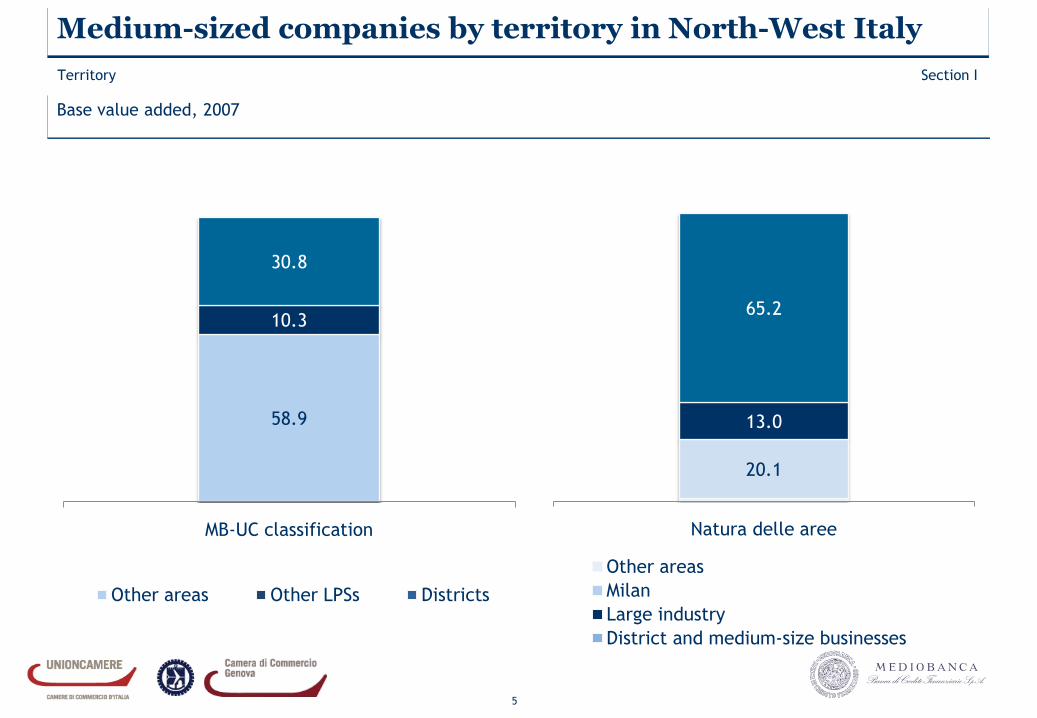
20.1
13.0
65.2
Natura delle aree
Other areas
Milan
Large industry
District and medium-size businesses
Medium-sized companies by territory in North-West Italy
Base value added, 2007
Territory Section I
58.9
10.3
30.8
MB-UC classification
Other areas Other LPSs Districts


7
What do firms do in North-West Italy
Trends Section II
283
556
913
917
1,405
2,471
4,270
148
335
426
693
1,036
721
3,222
Others
Iron and steel
Paper and printing
Chemicals
Food and drink
Personal and household goods
Mechanical goods
In 1996 Change, 1996-2007
Made in Italy 55,4%; non-domestic sales 38,7% of total Italian medium-sized businesses
Value added in €m, 1996-2007 - universe
Genova
Mechanical goods 44.1%
Chemicals 24.8%
Food and drink 13.1%
Paper and printing 12.6%
Personal and household goods 2.9%
Others 2.6%
Made in Italy 43.0%

8
72181
57 29 -14 60 48130 104
-27 -21 -21 -7 -8 -31 -13 -30 -21
1999 2000 2001 2002 2003 2004 2005 2006 2007 2008 2009
From small companies To large companies Turnover ratio
Growth in North-West Italy
Trends Section II
Genova
• 1998: 18
• 2007: 23
• Chg.: +5667
Net changes, 1998-2007: 488 companies
Which companies in large industry are growing? Machinery and equipment, iron and steel, chemical
and metal treatment
179

9
Growth in VA from 1998 to 2007
Trends Section II
Medium-sized enterprises in North-West Italy
Total, Italian medium-sized enterprises
+43.4
+46.7
Liguria
Lombardia
Piemonte e Valle d’Aosta
Genova
Italian manufacturing industry
+60.8
+46.9
+30.3
+48.0
+22.4
% chg. – manufacturing, closed group, current prices

10
MSEs in North-West Italy: turnover and value added
Trends Section II
119,7122,1
130,5
136,2
151,3
165,2
167,8
145,8
100,0
115,4117,4
123,9126,7
135,0
145,6
146,3
127,1
1998 1999 2000 2001 2002 2003 2004 2005 2006 2007 2008 2009
MSEs in North-West Italy - turnover Italian MSEs - turnover
MSEs in North-West Italy - value added Italian MSEs - value added
Index 1998=100 – closed set – MB-UC estimates for 2008-09

11
MSEs in North-West Italy: staff and operating margins
Trends Section II
100.0104.2
114.3 113.3 109.7 107.5114.5 114.3
124.5
139.3136.7
129.0
101.6 104.1 105.6 106.6 108.2 109.0 109.9 111.0 113.1
113.4
80
90
100
110
120
130
140
150
1998 1999 2000 2001 2002 2003 2004 2005 2006 2007 2008 2009
MSEs in North-West Italy - EBITDA index Italian MSEs - EBIDTA index
MSEs in North-West Italy - Staff index
Index 1998=100 – closed set- MB estimates for 2008-09

12
Exports, 1998-2009
Trends Section II
100,0100,6
115,6
122,0124,9
127,5
140,5 152,0
172,6
196,1 202,3
179,7
180,3
204,1
154,7
1998 1999 2000 2001 2002 2003 2004 2005 2006 2007 2008 2009
MSEs in North-West Italy Total, Italian MSEs
MSEs in North-West Italy - mechanical engineering MSEs in North-West Italy - personal and household goods
Index 1998=100 – universe (chained values), MB and MB-UC estimates for 2008-09

13
MSEs in North-West Italy and large enterprises, 1998-2008
Trends Section II
101.6113.8 118.7 119.7 122.1
130.5136.2
151.3165.2 167.8
100.0
104.0111.9
114.1 115.4 117.4 123.9 126.7135.0 145.6 146.3
169.8145.5
182.5
109.6
1998 1999 2000 2001 2002 2003 2004 2005 2006 2007 2008
MSEs in North-West Italy - turnover MSEs in North-West Italy - value added
Italian MSEs - turnover Italian MSEs - value added
Larger groups - global consolidated turnover Larger groups - value added in Italy
Index 1998=100, closed sets – MB and MB-UC data, MB estimates for 2008

14
Net per capita value added at 1998 prices
Trends Section II
100.0 103.5100.7
99.1 99.097.5
100.4 100.8
104.0
108.1
103.0
100.198.4
97,796.3
99.6 100.2
103.1
107.8
95
98
100
103
105
108
110
113
115
118
1998 1999 2000 2001 2002 2003 2004 2005 2006 2007
Base Index1998 = 100
All MSEs MSEs, NW Italy Italian GDP
Expansion
Transformation
Expansion
Closed sets, 1998-2002 and 2002-2007 (3/5 of MSEs)

15
Net per capita value added at 1998 prices in North-West Italy
Trends Section II
103.0
96.3
107.8
100.0100.5 96.8
119.2
102.8 102.1
110.8
9598
100103105108110113115118120
1998 1999 2000 2001 2002 2003 2004 2005 2006 2007
Base Index1998 = 100
MSEs, NW Italy MSEs, mechanical engineering MSEs, personal and household goods
Expansion Transformation
Expansion
Closed sets 1998-2002 e 2002-2007 (3/5 of MSEs)


17
Financial structure
Finance Section III
-35.3 -32.3 -31.1 -28.1 -19.8 -21.8
-22.7 -23.5 -17.6 -30.2 -38.8 -41.0
-42.0 -44.2 -51.3 -41.7 -41.4 -37.2
63.6 65.9 60.3 46.5 42.9 38.1
36.4 34.1 39.7 53.5 57.1 61.9
Italian MSEsMSEs in
North-West Italy
MSEs in Genova Medium-large companies in North-West
Italy
Large Italian groups
European multinationals
Short-term debt M/L term debt Net capital Current assets Fixed assets
% of tangible capital invested – universe data for 2007

18
Financial strenght in North-West Italy in 2007
Finance Section III
NTC = Net tangible capital
B = Borrowings
MSEs, North-West Italy MSEs, Genova
NTC /
Net fixed
assets
B (short-
term)/ net
working
capital
NTC /
Net fixed
assets
B (short-
term)/ net
working
capital
Average ratio 129.6% 49.1% 129.1% 51.7%
No. of companies
With ratio > 90%
From 75% a 90%
From 50% a 75%
From 25% a 50%
< 25%
1013
85
171
166
391
336
154
377
357
602
13
0
4
3
2
4
1
5
4
8
Total companies
Share, 2 strongest categories
Share, 2 weakest categories
1,826
60%
31%
1,826
53%
27%
22
59%
23%
22
55%
23%
Data, MB-UC universe

19
MSEs that have become large enterprises: where are they now?
North-West – 221 companies Italy - 564 companies
Finance Section III
Independent36.9%
Default7.5%
Bought by Italian groups37.9%
Bought by non-Italian
groups17.7%
Independent33.9%
Default7.9%
Bought by Italian groups41.6%Bought by
non-Italian groups18.6%
Annual average default rate in North-West Italy:
0.7% (0.2% of MSEs in North-West)
Annual average default rate in Italy:
0.8% (0.2% of MSEs in Italy)
20
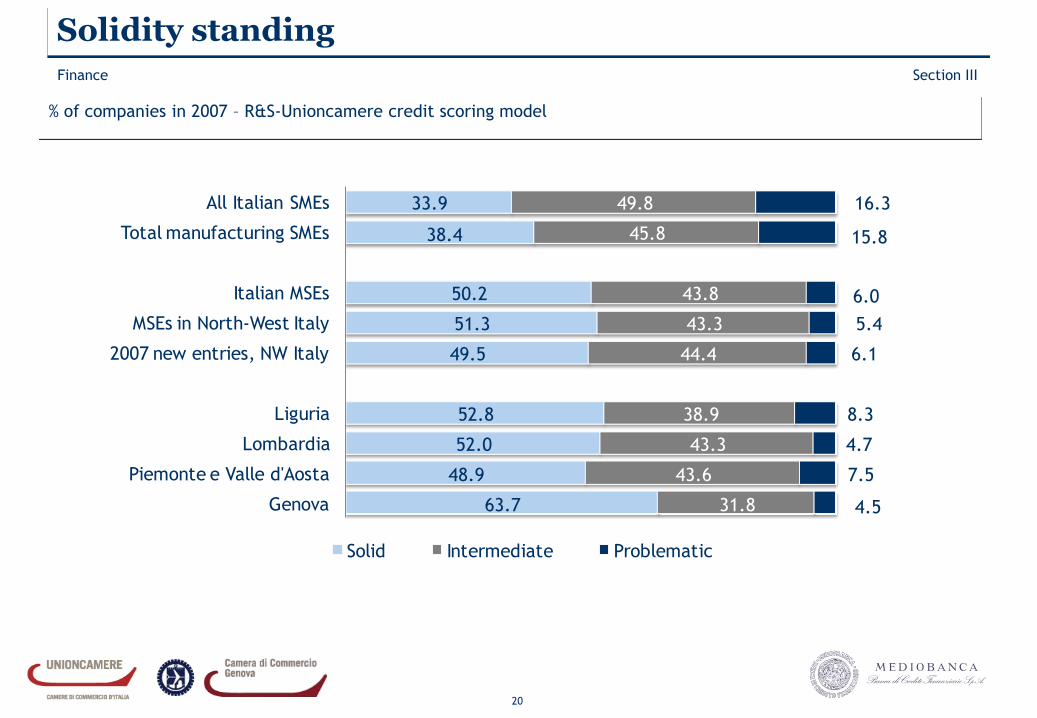
Solidity standing
Finance Section III
63.7
48.9
52.0
52.8
49.5
51.3
50.2
38.4
33.9
31.8
43.6
43.3
38.9
44.4
43.3
43.8
45.8
49.8
4.5
7.5
4.7
8.3
6.1
5.4
6.0
15.8
16.3
Genova
Piemonte e Valle d'Aosta
Lombardia
Liguria
2007 new entries, NW Italy
MSEs in North-West Italy
Italian MSEs
Total manufacturing SMEs
All Italian SMEs
Solid Intermediate Problematic
% of companies in 2007 – R&S-Unioncamere credit scoring model

Mediobanca Research Department
Piazzetta M. Bossi 1, Milan, ItalyWebsite: www.mbres.it


