
Maryland’s Forest Conservation Act and the Impact on Residential Development and
Forest Cover Change
David NewburnDepartment of Agricultural and Resource Economics
University of Maryland

Forest Conservation Act (FCA) and development
• Research question– How did the 1993 Forest Conservation Act (FCA) in Maryland affect residential
development and forest cover change decisions?
• Study area and data– Rural area in Baltimore County (Outside UGB)– Parcel-level residential development from tax assessment records– Forest cover data in 1984-2004 from North American Forest Dynamics Project
• Panel Heckman selection model – First stage: Panel probit model on residential development
• Develop or remain developable in 1985-2000• Subdivisions before FCA (1985-1992) and after FCA (1993-2000)
– Second stage: Forest cover change, conditional on development– Explanatory variables
• Existing forest cover, zoning, accessibility, land quality, surrounding land uses

Source: Don Outen (DEPS)

Baltimore City
90% of year 2000 population lived inside
the urban growth boundary (UGB) on
1/3 of the land
LEGENDForestFields/GrassImperviousWater
Urban-Rural Demarcation Line (URDL)
Baltimore County Urban Growth Boundary
Long-Term Results
Source: Don Outen (EPS)

Residential density

Groundwater wells and septic
Source: Josh Cole (UMBC)

Subdivisions
MD Property View parcel data to reconstruct historic subdivisionsMD Property View parcel data to reconstruct historic subdivisions:MD Property View parcel data to reconstruct historic subdivisions⎯
MD Property View parcel data to reconstruct historic subdivisionsMD Property View parcel data to reconstruct historic subdivisions⎯ Identify polygons in MDPV parcel layer within same subdivision⎯
Identify polygons in MDPV parcel layer within same subdivision⎯ Dissolve individual parcels into original parent parcel⎯
Dissolve individual parcels into original parent parcel⎯ Record year start and number of lots in subdivision

Subdivision in RC4 zoning
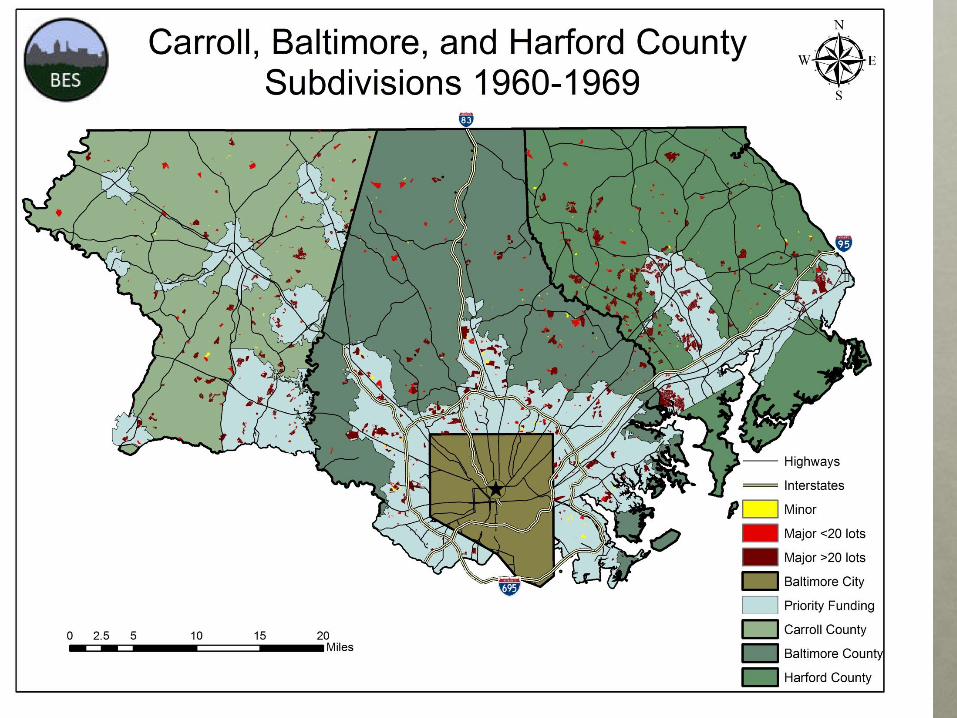


Residential subdivisions in 1985-2000
Forest Conservation Act (FCA) in Maryland
• FCA is a statewide law in Maryland and implemented by county and local governments starting in 1993
• Purpose: Set afforestation and conservation requirements to reduce forest loss and encourage tree planting on subdivisions
• Priority areas for forest protection and restoration – Riparian buffers, 100-year floodplains, wetlands, steep slopes, erodible soils

Afforestation and conservation thresholds
• Afforestation – Afforestation threshold at 20% forest cover for all parcels– Example: Parcels with <20% existing forest cover must plant trees up to the
afforestation threshold even if no trees cleared during development
• Conservation – Conservation threshold at 50% forest cover for agricultural and resource areas
(RC2 & RC4 zoning) and 25% forest cover for medium residential areas (RC5 zoning)
– Example: Parcel in agricultural or resource areas that clears forest below the conservation threshold must replace forest at double the amount

Forest conservation planForest stand delineation map
Forest Conservation Act

Forest Cover Data
• Forest cover data in 1984-2004 for Baltimore-DC corridor
– NASA funded North American Forest Dynamics Project (Goward et al.
2012)
– Forest classification based on Landsat imagery at 30 meter grid cells
– Snapshot on forest cover for 12 time periods: 1984, 1986, 1987, 1988,
1990, 1991, 1994, 1996, 1998, 2000, 2002, 2004
– Accounts for deforestation, reforestation and afforestation
• Existing forest cover
– % existing forest cover calculated as forest area divided by total parcel
area

Forest Cover Change
• Forest cover change (dependent variable in second stage)
– Difference in % forest cover after development and prior to
development
• Difference in % forest cover in 1996 and prior to development for subdivisions in
1985-1992
• Difference in % forest cover in 2004 and prior to development for subdivisions in
1993-2000
– Example: Subdivision event in 1989 would calculate difference for %
forest cover in 1996 and % forest cover in 1988 prior to development

North American Forest Dynamics Project (55 Sites) under of the North American Carbon Program
Source: NACP

Forest Cover in 1984

Forest Cover in 1990

Forest Cover in 1995
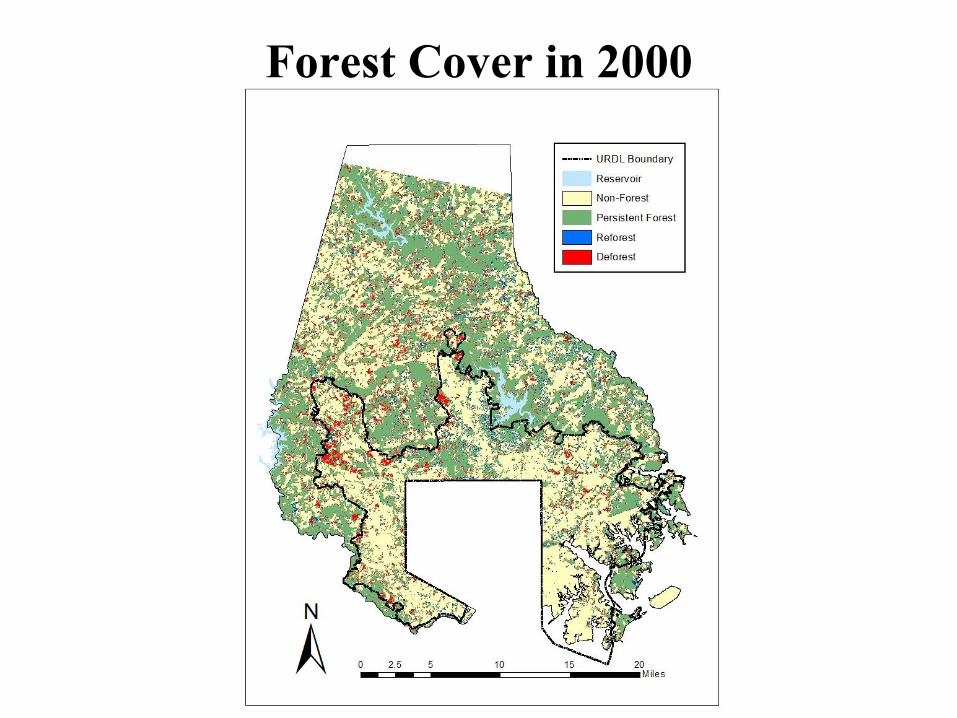
Forest Cover in 2000

Forest Cover in 2004

Forest cover change on subdivisions
before (1985-1992) and after (1993-2000) FCA policy
-10
-50
5
Fore
st C
ov
er C
ha
ng
e (%
)
0 20 40 60 80 100
Existing Forest Area (%)
Subdivisions in 1985-1992 Subdivisions in 1993-2000
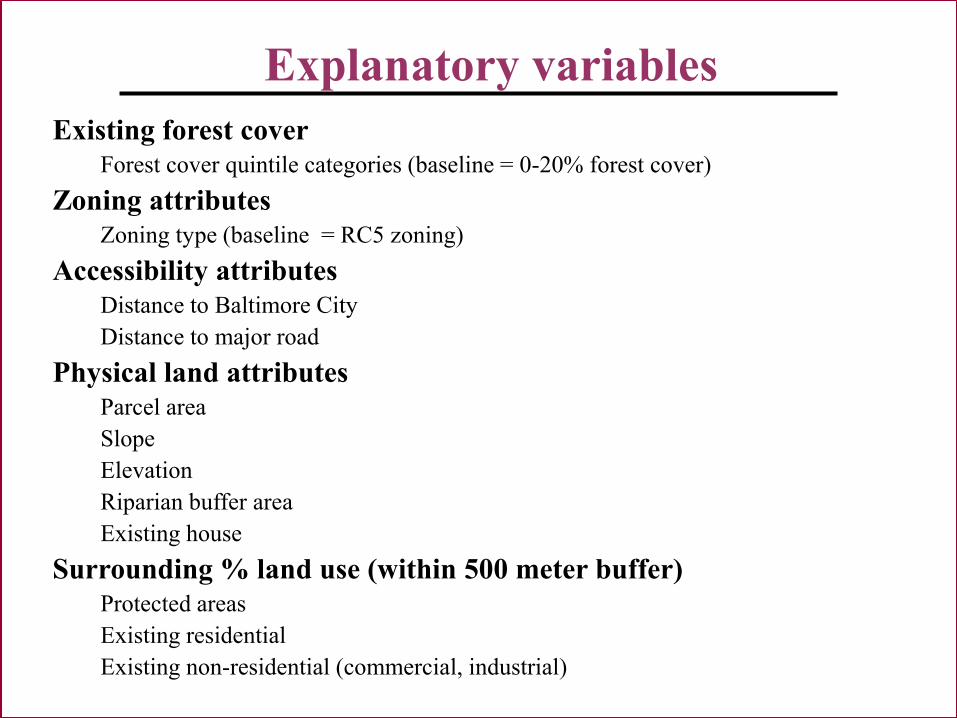
Existing forest cover Forest cover quintile categories (baseline = 0-20% forest cover)
Zoning attributes Zoning type (baseline = RC5 zoning)
Accessibility attributes Distance to Baltimore City Distance to major road
Physical land attributes Parcel areaSlopeElevationRiparian buffer areaExisting house
Surrounding % land use (within 500 meter buffer)Protected areasExisting residentialExisting non-residential (commercial, industrial)
Explanatory variables

Forest Cover Change Conditional on
Development in 1985-1992 and 1993-2000
Forest Cover Quintile
Forest Cover Change
in 1985-1992
Forest Cover Change
in 1993-2000 Difference
Forest cover 0-20% -3.6142 4.9490** 8.5632**
(2.5552) (1.2769) (2.6788)
Forest cover 20-40% -9.0944** 3.1678 12.2621**
(3.037) (1.6712) (3.3536)
Forest cover 40-60% -9.959** 5.7351** 15.6941**
(3.0127) (1.9013) (3.3403)
Forest cover 60-80% -11.204** -4.0878** 7.1158*
(3.8725) (1.227) (3.5958)
Forest cover 80-100% -7.6628** -9.2863** -1.6235
(2.7323) (1.8637) (3.0799)
Robust standard errors in parentheses calculated using delta method.
** p<0.01, * p<0.05

Conclusions
• Before FCA policy– Loss in forest cover across the range of existing forest cover – Prior studies often implicitly assume residential development creates a complete
loss in forest cover
• After FCA policy– Overall 22% increase in forest cover on residential subdivisions relative to the
amount without the FCA policy– Parcels with 0-60% existing forest cover have increase in forest cover– Most intact habitat have continued forest fragmentation (parcels with 80-100% not
affected by FCA policy)
• Opportunities for synergy between FCA and land preservation programs– Target funds from easement programs (or in lieu fees) to protect high priority
forested areas with intact habitat

Future directions:
Modeling interactions for residential
development and conservation programs
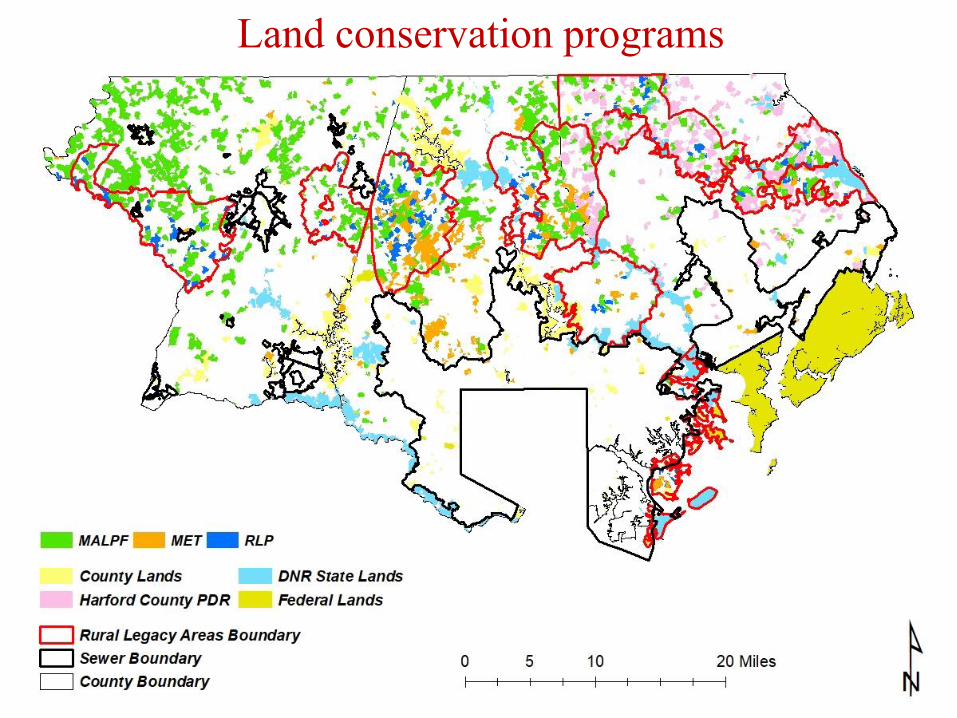
Land conservation programs

Residential subdivisions in 1960-2007

Interactions for conservation and development


