Marine Optical Biogeochemistry: The Chemistry of Ocean Color
Paula G. Coble
College of Marine Science, University of South Florida, 140 7th Avenue South, St. Petersburg, Florida 33701
Received August 28, 2006
Contents1. Introduction 402
1.1. What Is Colored Dissolved Organic Matter(CDOM)?
403
1.2. Why study CDOM? 4031.3. Recent Developments 404
2. The Nature of Colored Dissolved Organic Matter(CDOM)
404
2.1. Optical Properties 4042.1.1. Absorbance 4042.1.2. Fluorescence 4052.1.3. Remote Sensing of CDOM 405
2.2. Chemical Properties 4073. Distribution of CDOM 408
3.1. Sources 4083.2. Sinks 4093.3. Coastal Ocean 4103.4. Open Ocean 411
4. New Insights into the Dynamics of CDOM 4124.1. Increased Spatial and Temporal Resolution 412
4.1.1. Sargasso Sea 4124.1.2. Gulf of Mexico 4124.1.3. Estuaries 414
4.2. Increased Spectral Resolution 4144.3. Improved Data Analysis Techniques 414
5. CDOM versus Dissolved Organic Carbon (DOC) 4156. Unresolved Questions and Future Directions 4167. Acknowledgment 4168. References 416
1. IntroductionThe composition and dynamics of colored dissolved
organic matter (CDOM) in natural waters has been thesubject of study for decades. However, renewed interest inCDOM properties and cycling in the ocean has been sparkedby an increased need for understanding its distribution alongwith technological developments resulting in improvedmeasurements. Early studies to characterize CDOM reliedon extracting the material from water to obtain adequateamounts for chemical analyses, too often resulting inalteration of the natural materials. In the past 10 years,instrumentation and methodologies for assessing both con-centration and chemical properties of CDOM using opticaltechniques without preconcentration have advanced rapidly.Development of instrumentation for continuous, underway,in-situ sampling and improvements in satellite sensors andalgorithms have resulted in advances in our understandingof CDOM by increasing sampling densities and linking
CDOM to other environmental parameters that influence itsdistribution.
CDOM has been the topic of several reviews since 2001.A review of CDOM optical properties, sources, sinks, anddistribution in coastal regions by Blough and Del Vecchio1
updates a previous review of the subject by Blough andGreen2 and includes an extensive compilation of observationsof CDOM optical properties collected worldwide since 1981.A second review in that same volume by Nelson and Siegel3
covers the topic of CDOM in open ocean areas. It includesdiscussion of CDOM chemical properties, methods, andimplications for remote sensing applications, photochemistry,and photobiology. A third review with a focus on remotesensing applications in coastal areas by Del Castillo4 includesan excellent summary of the chemical properties of CDOM,which give rise to its absorption and fluorescence charac-teristics. It also discusses CDOM within the context of oceancolor, ocean optics, and development of empirical algorithmsfor separation of ocean color spectra into discrete compo-nents.
Dr. Paula Coble has been an Associate Professor of ChemicalOceanography at the University of South Florida, College of MarineScience, since 1992. She received a B.S. degree in Biology/Geology fromMt. Holyoke College, an M.S. in Marine Studies from the University ofDelaware, and a Ph.D. in Chemical Oceanography from MIT/WHOI JointProgram. She is an active member of the American Geophysical Unionand is a past secretary for Marine Geochemistry in the Ocean Sciencesection. Paula is also a former Associate Editor for Marine Chemistryand a member of the American Society of Limnologists and Oceanog-raphers, The Oceanography Society, the National Marine EducatorsAssociation, and the National Science Teachers Association. Paula isalso actively involved in science education, serving as a Program Scientistwith NASA Science Mission Directorate in Earth System Science Educationin 2004 and 2005, as well as in numerous education and outreachprograms at the College of Marine Science, including Project Oceanog-raphy (http://www.marine.usf.edu/pjocean), COSEE-FL, OceanographyCamp for Girls, the Teacher Oceanography Workshop, and an NSF GK−12 project.
402 Chem. Rev. 2007, 107, 402−418
10.1021/cr050350+ CCC: $65.00 © 2007 American Chemical SocietyPublished on Web 01/26/2007
This review will provide a general overview of the natureand importance of CDOM in marine waters and an updateon new results regarding CDOM properties and dynamicswith a focus on application to future global biogeochemicalstudies using optical techniques amenable to satellite remotesensing or ocean observing systems. One recent body of workcovered herein is a collection of papers on the role ofphysical, chemical, and biological processes in controllingCDOM distributions in the ocean, which was published in2004.5 This volume was the outcome of a special sessionon the topic at the Ocean Sciences Meeting in Honolulu,Hawaii, in 2002. Many of these papers describe resultscollected during multicruise field studies conducted in theGulf of Mexico.
The reader is referred to other articles in this issue thatcover complementary topics related to CDOM in sediments(Burdige), cycling of organic carbon in the ocean (Mopperet al.), and spectroscopic studies of inorganic componentsof seawater (Johnsonet al.).
1.1. What Is Colored Dissolved Organic Matter(CDOM)?
CDOM, also known as gelbstoff,6 gilvin,7 yellow sub-stance, and chromophoric dissolved organic matter, isoperationally defined as that component of total DOM thatabsorbs light over a broad range of visible and UVwavelengths. In order to best understand the interest in thestudy of CDOM, we need to consider separately the terms“color,” “dissolved,” and “organic matter”. Beginning withthe last of these, organic matter means that the materialcontains both carbon and hydrogen and is of biologicalorigin. The term covers thousands of compounds but is usedgenerically to indicate the entire pool of material or whencomposition of the sample has not been sufficiently char-acterized as to be named by specific compounds or com-pound classes. The chemical composition, origin, anddynamics of CDOM in aquatic systems are still poorlyunderstood. This is not to say that these parameters areunknown but rather that the number and complexity ofcomponents that comprise organic matter in the ocean is largeand diverse, as is the biological, physical, and chemicalenvironment in which it is produced, transported, andtransformed.
Next we examine “dissolved.” While one might easilyunderstand that this means the opposite of “particulate” orthat the compounds are present as solutes in water, in actualpractice “dissolved” is defined operationally by mechanicalseparation of water samples using filtration, centrifugation,or other techniques to remove particles larger than someminimal diameter. It is important to understand that particu-late matter in the ocean is a continuum of sizes and thatboth organic matter and CDOM have some distributionacross this continuum between truly dissolved and trulyparticulate.
Last, there is “colored”. This refers to the optical propertiesof CDOM, which include a yellowish color (absorption ofblue light) and blue fluorescence. It is the absorption of bluelight that makes CDOM of interest to satellite remote sensingand ocean optics researchers and also provides an easilymeasured property for determining CDOM concentrationsin the environment. The chemical characteristics responsiblefor the optical properties also impart high photochemicalreactivity.
1.2. Why study CDOM?In the past 10 years, the primary driver for the study of
CDOM has been Satellite Oceanography. The launch of theCoastal Zone Color Scanner (CZCS) in 1978 ushered in anew era of oceanographic research. CZCS was primarilyconceived of as a means for assessing global oceanic plantbiomass. The several ocean color sensors that have followedCZCS have had added capabilities that permit estimates notonly of temporal and spatial distributions of chlorophyllpigments but also of suspended sediments, dissolved andparticulate organic carbon, and primary productivity.
As satellite ocean color sensors and data interpretation oftheir signals have improved, it has become increasinglyimportant to understand distribution and dynamics of CDOMin order to make more accurate estimates of the other oceancolor components. Ocean color signatures and derivation ofchlorophyll concentrations are based on upwelling radianceof sunlight that has traveled through the atmosphere andthrough the water column and is reflected back to thesatellite. The signal therefore is influenced by the concentra-tions of all absorbing constituents, including water, chloro-phyll, detritus, CDOM, and other absorbing chemical species.The absorbance spectrum of CDOM overlaps that ofchlorophyll and can account for 50% or more of totalabsorption at 443 nm, the wavelength at which chlorophyllconcentrations are most often measured.8 In many coastalareas, CDOM absorption is several times that of chlorophyll.
Estimates of the contribution of CDOM to total dissolvedorganic carbon (DOC) in the ocean have ranged from 20%to 70%,9,10with highest values in coastal regions, where riverinputs are dominant, and values at the lower end of the rangein open ocean areas. CDOM has proven to be a useful tracernot only for carbon but also as a proxy for mixing in a widevariety of environments. In most coastal areas and belowthe euphotic zone elsewhere in the oceans, CDOM displaysconservative behavior on the time scale of physical mixing.Thus, CDOM has been used to trace inputs of rivers,distinguish between source waters of different origin, trackdistribution of river-borne pollutants,11 and verify exchangeof ballast water in ocean-going vessels.12 It also provides ameans of studying ocean surface circulation features, suchas upwelling and eddies.13 On continental margins, it hasbeen used to refine budgets of both carbon and freshwater.14
Spectral discrimination between natural and anthropogenicCDOM has been exploited to study human sewage,11
agricultural waste, and polycyclic aromatic hydrocarbon(PAH) distribution in rivers and estuaries.15 CDOM largelycontrols penetration of photosynthetically active radiation incoastal areas and is therefore an important parameter incoastal productivity. High levels of CDOM may also beimportant in protecting corals and other light-sensitiveorganisms from UV radiation.16
Last, CDOM plays a very important role in cycling carbon,trace elements, and trace gases of importance to biologicalactivity and global climate. CDOM is highly photoreactiveand is rapidly destroyed upon exposure to sunlight, producingdissolved inorganic carbon, smaller organic carbon com-pounds, hydroxyl radical, superoxide,17 and many otherspecies. CDOM serves as a photosensitizer to stimulatedestruction and transformation of other organic compoundsby sunlight, altering their bioavailability to microorganisms.CDOM also mediates redox reactions of some trace metalsand influences air-sea exchange of trace gases.18-23 Thus,the study of CDOM is truly interdisciplinary, with relevance
Marine Optical Biogeochemistry Chemical Reviews, 2007, Vol. 107, No. 2 403
to ocean circulation; biogeochemistry of carbon, traceelements, and gases; ocean optics and remote sensing;photochemistry and photobiology; phytoplankton ecologyand physiology; harmful algal bloom mitigation; and coralreef ecology.
1.3. Recent Developments
Several new measurement and data analysis techniqueshave contributed to advancing our understanding of marineCDOM. Recent application of principle component analysis(PCA) and parallel factor analysis (PARAFAC) have led tonew insights on the sources and concentrations of fluorophoregroups within bulk CDOM.24,25Improvements have also beenmade in optical sensor techniques and technologies thatpermit separation of an ever-increasing array of seawaterconstituents by virtue of their optical properties.26 This inturn has led to an improved understanding of the effects ofindividual components of ocean color on remote sensingreflectance and development of improved algorithms forquantification of each component. Of particular importanceto remote sensing of CDOM have been improvements inalgorithms to correct for the presence of aerosols, whichabsorb 90% or more of the total water-leaving radiance.27
Further advances in modeling, theory, calibration, spatial andtemporal coverage of the oceans, andin situ instrumentationhave improved accuracy of measurements as well asunderstanding of causal relations among seawater constitu-ents of ocean color.28 New capabilities for hyperspectralmeasurements, those that are made continuously across thevisible portion of the EM spectrum (400-700 nm) with aspectral resolution of 10 nm,29 are now possible not onlyfor absorbance and fluorescence but also for backscatteringmeasurements, with applications for deriving phytoplanktonspecies information and particle composition. Last, there havebeen parallel advances in hyperspectral methods and im-proved ability to couple optical models to ecosystemmodels.30 Inclusion of temporal, spatial, and chemicalvariability of CDOM into these models improves under-standing of CDOM dynamics as well as of ecosystemdynamics.
2. The Nature of Colored Dissolved OrganicMatter (CDOM)
2.1. Optical Properties
The optical properties of CDOM provide information onboth the amount of material present and the chemicalproperties of the bulk sample, which undergo change due tochemical, biological, and physical processes. Parametersderived from optical properties include the spectral slope andfluorescence efficiency, which have proven to be of somevalue in remote sensing applications of ocean color.
2.1.1. Absorbance
Both terrestrial and marine CDOM have absorbancespectra that increase exponentially toward shorter wave-lengths, with no discernible peaks. This lack of features fitsthe explanation that CDOM is a complex mixture ofcompounds that have overlapping absorption spectra, withno single compound dominating. The smoothness of theabsorption spectrum at wavelengths greater than 350 nm mayalso result from intramolecular electronic interactions.31
Bricaudet al.32 first proposed a wavelength-independentformulation of an exponential fit of the spectral dependenceof CDOM absorption, with the intent of establishing thatmeasurements in the UV region could be extrapolated to thevisible with sufficient accuracy to be more reliable for openocean samples. This is the equation now in general use tocalculate CDOM spectral slope,S, which is also widely usedin remote sensing applications. The equation is
wherea(λ) is the absorption coefficient at wavelengthλ, a(λ0)is the absorption coefficient at a reference wavelength, andS is the spectral slope parameter. The absorption coefficientis calculated as 2.303A/l, whereA is the absorbance (logI0/I), l is the path length (in meters), and 2.303 convertsbetween log10 and natural log. The log transformed absorp-tion coefficientVersuswavelength takes on a linear shapefor most natural water samples, especially between 400 and700 nm; however, spectral slope calculations are dependenton the wavelength range used in calculations33,34and whetherlinear or nonlinear fitting methods are used. In a recentcomparison of fitting methods, Twardowskiet al.35 foundthat a hyperbolic model outperformed the single-exponentialmodel. However it is still important to report the spectralrange over whichS is calculated due to loss of signal atlonger wavelengths and increased steepness in the spectrumat shorter wavelengths, which may be accentuated byphotobleaching transformations. A recent compilation ofspectral slope observations, including range of wavelengthsover which calculations were made, can be found in previousreviews.1,35
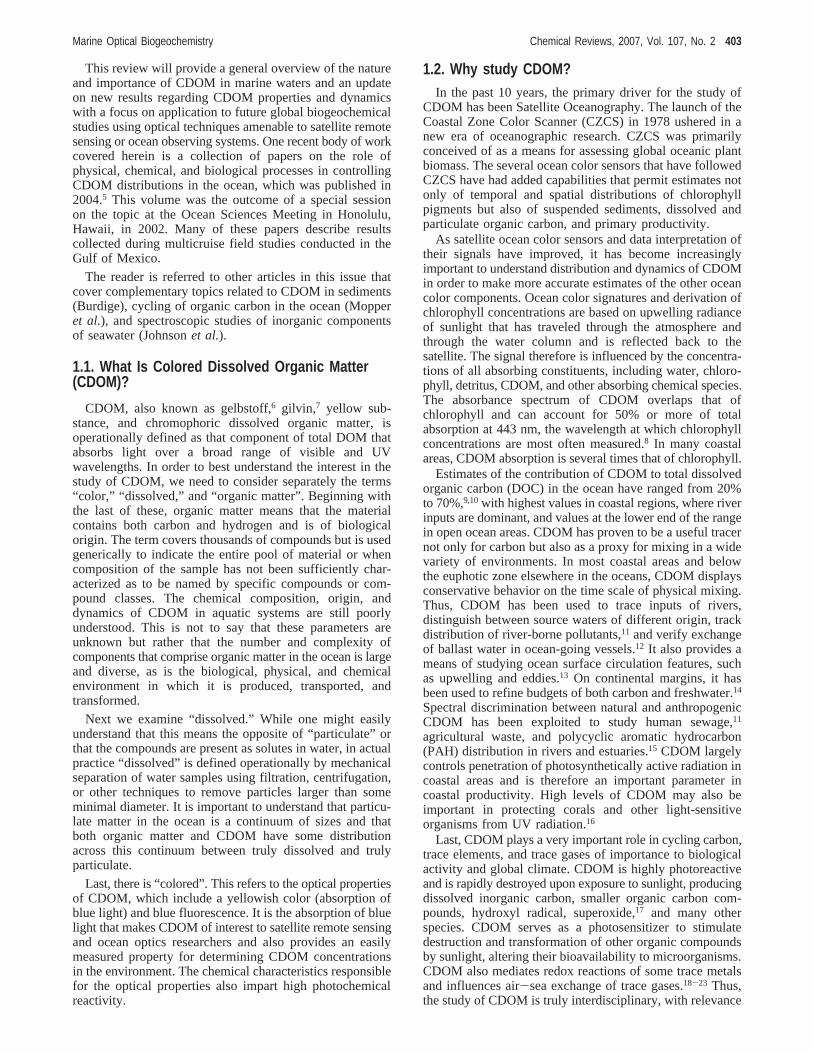
Differences inS have been proposed as indicative ofCDOM origin, with generally lower slopes in freshwater andcoastal environments than in marine environments.1,26Whilesome of this change is likely due to increasing importanceof marine humics and new biological CDOM, much is alsodue to photobleaching.36 Figure 1 shows typical results forchanges in CDOM spectral slope as a result of mixing andphotobleaching in coastal waters.37 Data were collected inthe Gulf of Mexico over the same region during 2 years,one during moderate drought conditions (2001) and oneduring severe drought conditions (2000). Spectral slopes forsalinity less than 25 are low and fairly constant. Even thoughmixing is obviously occurring, the amount of CDOM in thefreshwater is high enough to dominate the optical signature.Slopes increase rapidly at salinities greater than 30, asconcentration of marine humics begins to reach those of thediluted freshwater CDOM. Samples collected during 2000show a sharper increase at intermediate salinities, indicativeof photobleaching caused by low river discharge, higher solarradiation, and increased stratification of the water column.Changes in CDOM emission maxima for this same data setare shown in Figure 1B. The inflection point in this curve isat the same salinity, with the 2000 data again showing asharper increase and inflection at a lower salinity, 27Versus32. Similar relationships have been observed in otherregions;1 however, Figure 1A shows less scatter in the salinitymixing curve becauseSwas calculated over the UVC portionof the spectrum. This region is more sensitive to effects ofphotobleaching and may provide better information regardingchemical composition of CDOM than the longer wavelengthrange typically used in remote sensing algorithms.
The greatest value of usingS is in remote sensingapplications, where sensor bands are finite and CDOM
a(λ) ) a(λ0) e-S(λ-λ0)
404 Chemical Reviews, 2007, Vol. 107, No. 2 Coble
contributes to absorbance in the chlorophyll channel. Greatestaccuracy for CDOM concentration and composition isachieved at the shorter visible wavelength bands (280-400nm), but corrections to chlorophyll algorithms requireconversion to CDOM absorption (aCDOM) at 443 nm. Anunderstanding of howSvaries is thus important in accuratechlorophyll concentration retrievals, but our understandingof processes controllingS is still limited. At this point, themost accurate chlorophyll and CDOM algorithms rely onchoosing the best values ofS based on season, CDOMconcentration, or some other parameter that strongly influ-ences corrections for a given region.4
2.1.2. FluorescenceThe natural fluorescence properties of seawater were
recognized as early as 1949 and attributed to the presenceof CDOM.6 Kalle also was first to recognize the potentialof these properties to trace freshwater inputs in coastalareas.6,38 Fluorescent DOM (FDOM) is colored, but not allCDOM is fluorescent. This is evidenced by the fact thatabsorption spectra show a featureless increase in intensitywith decreasing wavelength between 200 and 700 nm,whereas excitation spectra show one or more discrete peaks,most commonly around 250 and 350 nm. In most cases, the
two pools show a linear relationship,39,40 although globallythere is a 3-fold variation in absorption to fluorescenceratios.1 Variability is much smaller within a given geographi-cal area, and the ratio has been used to derive absorptioncoefficients from more sensitive fluorescence measurements.This ratio is constant on the West Florida Shelf even whenfreshwater endmember sources have widely different CDOMconcentrations; however, interannual differences reflectingvariability in river discharge can be important.37 Freshterrestrial and deep marine waters have the highest fluores-cence efficiencies, with a decrease in values offshore asexposure to photodegradation increases.1
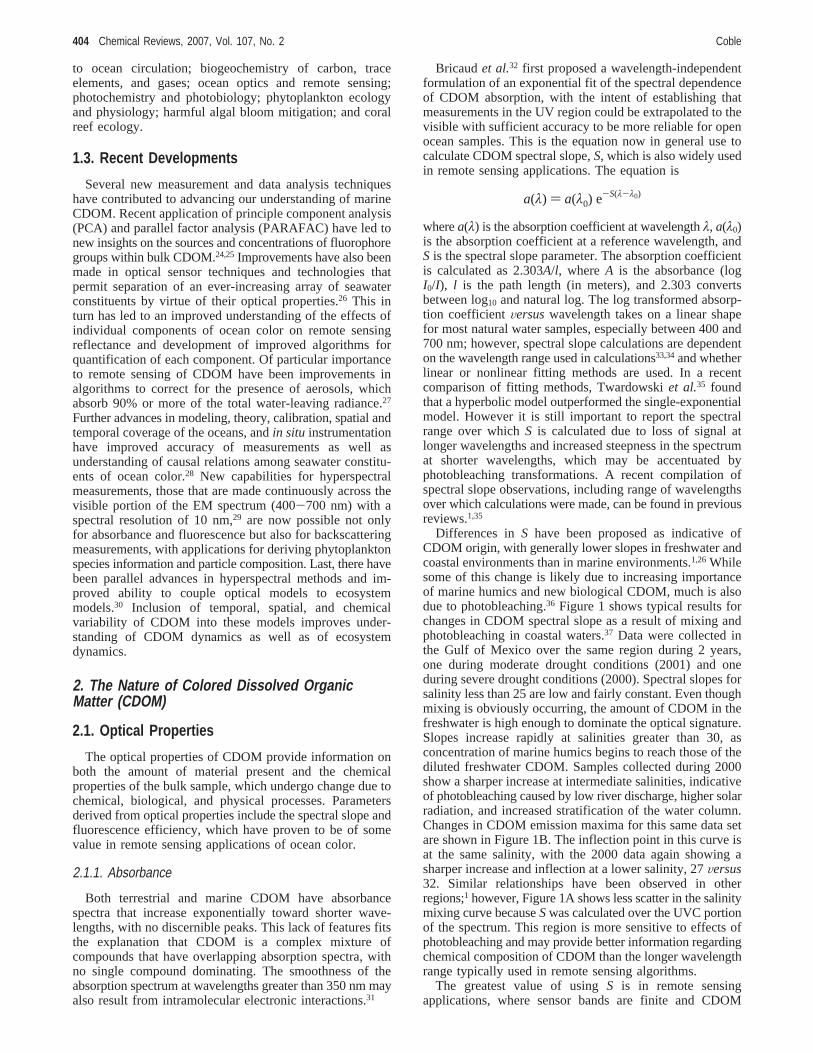
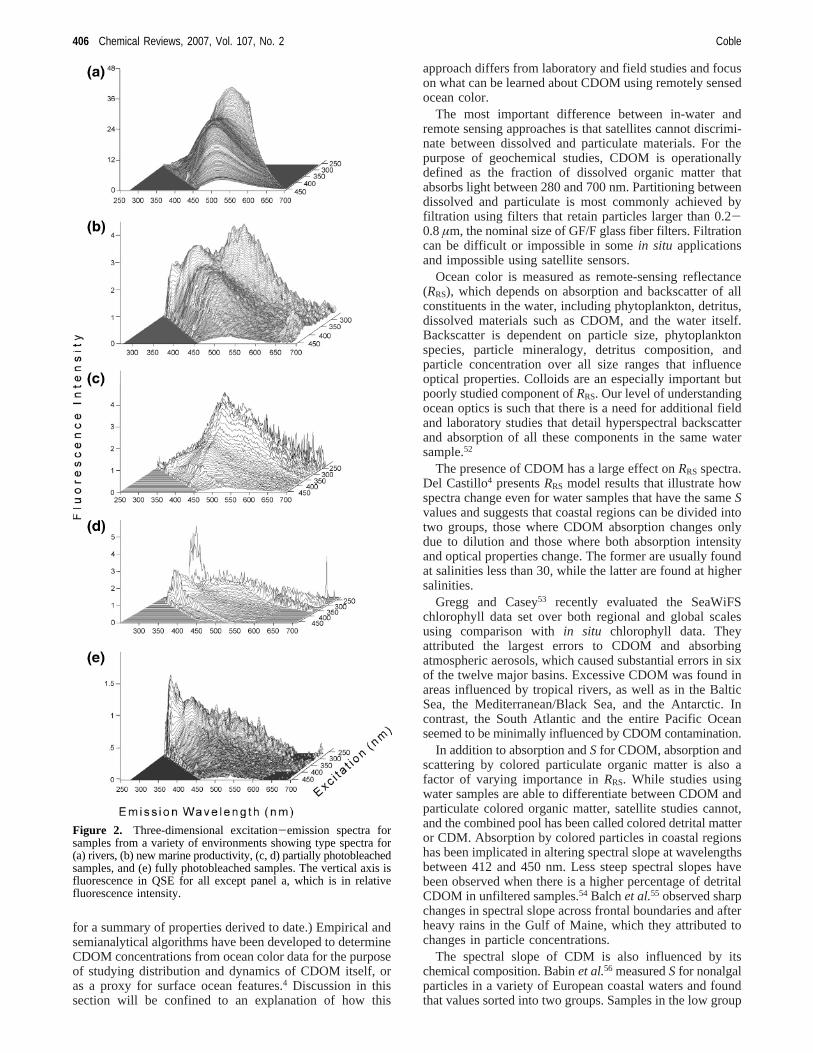
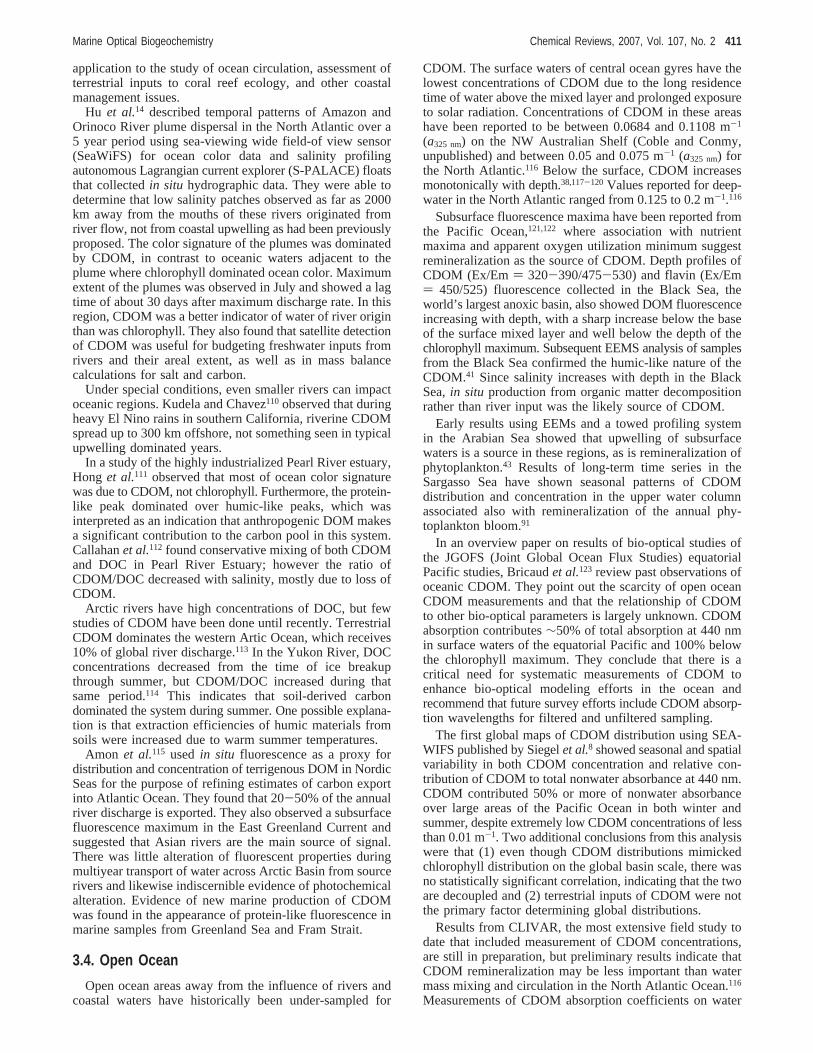
Fluorescence techniques are more sensitive than absorptionspectroscopy and both excitation and emission spectra showgreater detail and provide more information as to chemicalcomposition than do absorbance spectra. Collection ofhyperspectral fluorescence data has been shown to providean enormous benefit over collection of individual spectra,and two techniques have been employed. Excitation-emission matrix spectroscopy (EEMS) involves collectionof multiple emission spectra at a range of excitations, whichare concatenated into a matrix (Figure 2).41 Synchronousscanning (SS) involves increasing both excitation and emis-sion wavelengths simultaneously to produce a single scan.42
Although less time-consuming, SS provides less informationand is more difficult to interpret.
The use of EEMS permits discrimination of CDOMsources based on which fluorophores are present and theirrelative concentrations. Eight general types of fluorescencepeaks have been identified in natural waters.43 These groupsinclude humic-like, protein-like, and pigment-like fluores-cence.43-46 Terrestrial humic-like materials display excitationand emission maxima at longer wavelengths than do marinehumic-like materials, as would be predicted from their morearomatic chemical nature and presumed higher molecularweight. Table 1 summarizes fluorescence properties offluorophores identified to date.25,43,47-49
EEMS also provides information on changes in CDOMresulting from mixing, biological degradation, biologicalproduction, and photobleaching that occur in the environ-ment. Mixing between water masses has the primary effectof dilution, but shifts in excitation and emission maxima canresult when the water masses with different CDOM com-position have comparable concentrations of CDOM.50,51
Thus, at salinities between 30 and 36, CDOM in coastal areasbegins to exhibit a shift toward the shorter wavelengthexcitation and emission maxima (blue-shift) of marinehumics.33,43,45A blue shift in peak position can also be causedby photodegradation.33,43,45 Biological processes can resultin production of new peaks during bloom periods, especiallypeaks T, B, and P. The marine-humic peaks M and N arealso associated with high biological activity.43,45 Several ofthese peaks have also been observed in wastewater and instreams receiving agricultural waste.11
2.1.3. Remote Sensing of CDOM
Remote sensing applications are more concerned withdetermining concentrations of ocean color constituents ac-curately in all areas of the ocean. Historically, these studieswere focused solely on accurate determination of chlorophylla (Chl a) concentrations and non-chlorophyll constituentswere treated as signal “contamination”. However, morerecently the goal has been to derive as many biogeochemicalproperties as possible from optical data. (See Twardowski26
Figure 1. Data from two cruises during the summers of 2000 and2001 to the Gulf of Mexico south of the Mississippi River: (a)spectral slope calculated using linear regression for wavelengthsbetween 280 and 312 nmVersussalinity; (b) position of fluores-cence emission maximumVersussalinity.
Marine Optical Biogeochemistry Chemical Reviews, 2007, Vol. 107, No. 2 405
for a summary of properties derived to date.) Empirical andsemianalytical algorithms have been developed to determineCDOM concentrations from ocean color data for the purposeof studying distribution and dynamics of CDOM itself, oras a proxy for surface ocean features.4 Discussion in thissection will be confined to an explanation of how this
approach differs from laboratory and field studies and focuson what can be learned about CDOM using remotely sensedocean color.
The most important difference between in-water andremote sensing approaches is that satellites cannot discrimi-nate between dissolved and particulate materials. For thepurpose of geochemical studies, CDOM is operationallydefined as the fraction of dissolved organic matter thatabsorbs light between 280 and 700 nm. Partitioning betweendissolved and particulate is most commonly achieved byfiltration using filters that retain particles larger than 0.2-0.8µm, the nominal size of GF/F glass fiber filters. Filtrationcan be difficult or impossible in somein situ applicationsand impossible using satellite sensors.
Ocean color is measured as remote-sensing reflectance(RRS), which depends on absorption and backscatter of allconstituents in the water, including phytoplankton, detritus,dissolved materials such as CDOM, and the water itself.Backscatter is dependent on particle size, phytoplanktonspecies, particle mineralogy, detritus composition, andparticle concentration over all size ranges that influenceoptical properties. Colloids are an especially important butpoorly studied component ofRRS. Our level of understandingocean optics is such that there is a need for additional fieldand laboratory studies that detail hyperspectral backscatterand absorption of all these components in the same watersample.52
The presence of CDOM has a large effect onRRS spectra.Del Castillo4 presentsRRS model results that illustrate howspectra change even for water samples that have the sameSvalues and suggests that coastal regions can be divided intotwo groups, those where CDOM absorption changes onlydue to dilution and those where both absorption intensityand optical properties change. The former are usually foundat salinities less than 30, while the latter are found at highersalinities.
Gregg and Casey53 recently evaluated the SeaWiFSchlorophyll data set over both regional and global scalesusing comparison within situ chlorophyll data. Theyattributed the largest errors to CDOM and absorbingatmospheric aerosols, which caused substantial errors in sixof the twelve major basins. Excessive CDOM was found inareas influenced by tropical rivers, as well as in the BalticSea, the Mediterranean/Black Sea, and the Antarctic. Incontrast, the South Atlantic and the entire Pacific Oceanseemed to be minimally influenced by CDOM contamination.
In addition to absorption andSfor CDOM, absorption andscattering by colored particulate organic matter is also afactor of varying importance inRRS. While studies usingwater samples are able to differentiate between CDOM andparticulate colored organic matter, satellite studies cannot,and the combined pool has been called colored detrital matteror CDM. Absorption by colored particles in coastal regionshas been implicated in altering spectral slope at wavelengthsbetween 412 and 450 nm. Less steep spectral slopes havebeen observed when there is a higher percentage of detritalCDOM in unfiltered samples.54 Balchet al.55 observed sharpchanges in spectral slope across frontal boundaries and afterheavy rains in the Gulf of Maine, which they attributed tochanges in particle concentrations.
The spectral slope of CDM is also influenced by itschemical composition. Babinet al.56 measuredSfor nonalgalparticles in a variety of European coastal waters and foundthat values sorted into two groups. Samples in the low group
Figure 2. Three-dimensional excitation-emission spectra forsamples from a variety of environments showing type spectra for(a) rivers, (b) new marine productivity, (c, d) partially photobleachedsamples, and (e) fully photobleached samples. The vertical axis isfluorescence in QSE for all except panel a, which is in relativefluorescence intensity.
406 Chemical Reviews, 2007, Vol. 107, No. 2 Coble
approached values for pure mineral particles of 0.011 nm-1
previously reported by Bowers and Binding.57 Samples withvalues in the high group, 0.0128 nm-1, were from areaswhere particles had a high organic content.
In a study of the St John’s River in Florida, where CDOMconcentrations are very high (a440 ) 6-30 m-1), a significantCDOM signal was also found in the colloidal pool.58 Fineparticulate absorption increased logarithmically with logCDOM concentration. Overall, the effects of high colloidalCDOM at high CDOM concentrations had greater effect onscattering than on estimates of CDOM by absorbance.
High concentrations of particles also have negligibleimpact on CDOM measured as fluorescence. Belzileet al.59
found that filtration changed FDOM intensities by<4% ina variety of coastal environments but the relationship betweenA370 and fluorescence was unaffected.
In open ocean areas, detrital CDOM is very low; thereforemost of the CDM signal is due to CDOM. However, CDOMin colloidal form (<0.2 µm) may be a major source ofbackscattering in both the open ocean52 and coastal seas. Ithas been estimated that 67% of DOC and CDOM comingout of the Yukon River into the Bering Sea is in the colloidalsize range.60 Data are insufficient at this time to generalizeto other coastal areas.
Separation of backscatter into constituents is still in thevery early stages of understanding, and there are likewisefew studies in which absorbance and scatter are measuredon multiple size classes. There is a clear need for additionof multiple particle types to measurement suites as well asmodels. However, advances in these areas hold promise forimproved understanding of both dissolved and detrital carbondistribution and carbon cycling.
2.2. Chemical PropertiesCDOM has yet to be fully chemically characterized.
Parallels have been drawn between CDOM composition andthe structure of humic and fulvic acids found in soils61-67
and transported via rivers to lakes and oceans as aquatichumic substance. Humic substance ranges from yellow tobrown in color, and therefore this pool, which is defined byextraction procedures, clearly contains part of the pooldefined as CDOM. However, not all humic components arecolored, and not all CDOM is isolated using humic substanceextraction techniques. To the extent that chemical propertiesof humics are consistent with the optical properties of CDOMand Vice Versa, compositional studies can provide insightinto the chemical properties of CDOM.
In coastal areas where terrestrial carbon dominates thedissolved carbon pool, CDOM does contain a large fractionof soil humic substances. However, it is also now well-established that marine CDOM, although still predominantly
humic-like in nature, has a distinctly different origin anddifferent chemical structure.62,64,68,69Marine humics are lessaromatic, have lower C/N ratios, and contain more carboxylicgroups and sugars than do terrestrial humics. This agreeswell with the observations that marine humics have a blue-shifted fluorescence relative to terrestrial humics.
Many compounds, including lignins, phenols, and otherplant degradation products have been proposed to contributeto marine and terrestrial humic substances, and many of theseexhibit CDOM-like absorbance and fluorescence properties.In the past, much debate was focused on humic substanceformation theories, some arguing the material originated withmajor plant biochemicals that proceeded along a degradativepathway to form humics.70 The other school argued thatsugars, amino acids, and other small molecules polymerizedin the ocean to form CDOM, perhaps in the presence of UVradiation.65,71 Recent results suggest that aspects of bothpathways may produce CDOM in the ocean.
Among the nonhumic components of marine CDOM arepigment-like components43 and amino acid or protein-likecomponents.43-46,72 These components are not observed inall samples but rather seem to show some relationship toelevated biological activity. It is also unclear whether theseare truly dissolved or result from disruption of phytoplanktoncells during filtration, but the presence of both protein-likeand pigment-like components in marine CDOM providesevidence for its production in the ocean.
Protein-like fluorescence has been observed in many paststudies; however only recently has a strong link betweenprotein concentrations and protein fluorescence been docu-mented. Tyrosine-like fluorescence was observed at allstations and all depths on transect from Ise Bay, Japan, acrossKuroshio Current into the North Pacific Ocean.73 A trypto-phan-like fluorescence was observed as a distinct peak onlyin surface waters from the bay and coastal regions. Concen-trations of these amino acids and of the amino acid-likefluorophores decreased with distance from the bay and withdepth. Amino acid fluorescence intensities showed strongcorrelation with measured concentrations of the correspond-ing amino acid, as well as with total hydrolyzable aminoacids (THAA) throughout the study area. When data wereseparated by region, no significant correlation was found inthe ocean samples. However, a relationship in the open oceanmay have been concealed by the presence of backgroundfluorescence in these samples. Taken as a whole, these resultssuggest that the THAA are present as small peptides andnot as protein molecules. Observation of discrete fluorescenceof tyrosine, which is not visible in proteins containingtryptophan and is likewise suppressed when complexed withhumic material, suggests that the amino acids and THAAare associated with nonhumic-containing CDOM.
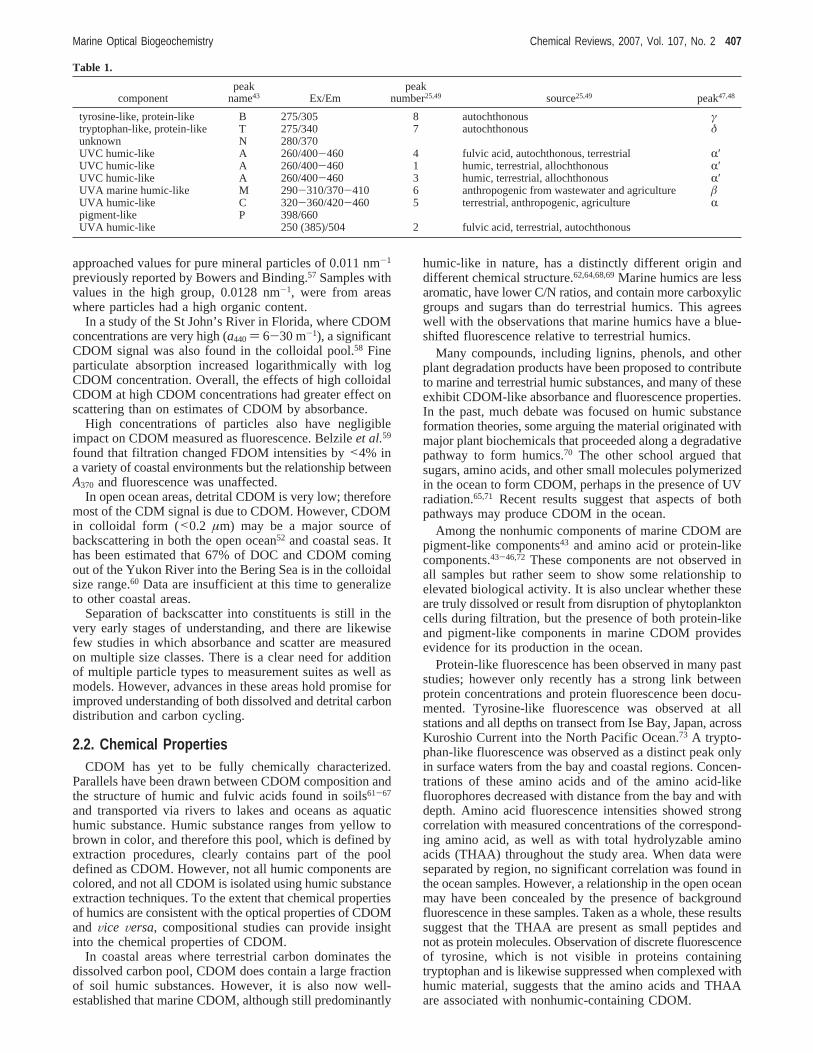
Table 1.
componentpeak
name43 Ex/Empeak
number25,49 source25,49 peak47,48
tyrosine-like, protein-like B 275/305 8 autochthonous γtryptophan-like, protein-like T 275/340 7 autochthonous δunknown N 280/370UVC humic-like A 260/400-460 4 fulvic acid, autochthonous, terrestrial R′UVC humic-like A 260/400-460 1 humic, terrestrial, allochthonous R′UVC humic-like A 260/400-460 3 humic, terrestrial, allochthonous R′UVA marine humic-like M 290-310/370-410 6 anthropogenic from wastewater and agriculture âUVA humic-like C 320-360/420-460 5 terrestrial, anthropogenic, agriculture Rpigment-like P 398/660UVA humic-like 250 (385)/504 2 fulvic acid, terrestrial, autochthonous
Marine Optical Biogeochemistry Chemical Reviews, 2007, Vol. 107, No. 2 407
The possible existence of separate humic and proteinfractions is also suggested by the results of Boehme andWells.74 Their analysis of the colloidal fraction in the estuaryof the Damariscotta River, Maine, shows that the smallestfraction (1-5 µm) has protein-like character, whereas thelarger sizes have humic-like character. Fluorescence of thehumic-like material is increasingly red-shifted in larger sizefractions.
While much of the recent effort regarding CDOM researchhas centered on optical measurement, several recent chemicalstudies have provided new insight regarding CDOM com-position. Parlantiet al.75 combined high-performance liquidchromatography (HPLC) with subsequent excitation-emis-sion matrix spectroscopy (EEMS) and capillary electrophore-sis (CE) analyses to the separation and characterization ofmarine and freshwater CDOM. While they were onlypartially successful in separating chromophore groups, theydid show that CE adds information useful for discriminatingbetween sources.
New insights on the effects of photoirradiation andprotozoan grazers on composition of aquatic fulvic acidswere obtained using electrospray ionization (ESI) combinedwith Fourier transform ion cyclotron resonance mass spec-trometer (FT-ICR MS) analysis.76 Photobleaching of Su-wanee River fulvic acid was not found to produce newcompounds but rather a preferential loss of compounds withhigh double bond equivalent and low oxygen content. It ispossible that new compounds produced by photooxidationwere not detectable using this technique due to low molecularweight or charge properties. Protozoans grazing on bacteriaproduced new compounds and degraded some of thecompounds produced by the bacteria.
In another study employing photooxidation to probeCDOM composition, evidence obtained suggests that theCDOM absorption spectrum arises from a continuum ofcoupled states, which undergo intramolecular charge-transferinteractions between aromatic polymers, rather than from thesummation of multiple individual compound absorptionspectra.77 Species that would be predicted to exhibit theseproperties include lignin, polyphenols, tannins, and melanins.
The last study applied HPLC to analysis of water samplesfrom three marine sites. Samples from the North Pacific werefound to have three major compounds and more than 90minor compounds.78 The major compounds were identifiedas 2,4-dichlorobenzoic acid and several tetrachlorobiphenylcarboxylic acids. Coastal waters from Woods Hole, MA, alsohad high concentrations of tetrachlorobiphenyl carboxylicacids, superimposed on a high background peak fromunresolved humic substances. The sample from Bermuda wasmore like that from the open ocean, but some humics werestill present. Concentrations of these polychlorinated biphenyl(PCB) compounds ranged from 1 to 10µg/L, which wouldaccount for a minimum of 2% of total CDOM absorption.The evidence suggests that these PCBs are most likely naturalproducts rather than anthropogenic, because the estimatedconcentration in the ocean is more than 2 orders of magnitudehigher than the oceanic man-made inventory.
3. Distribution of CDOM
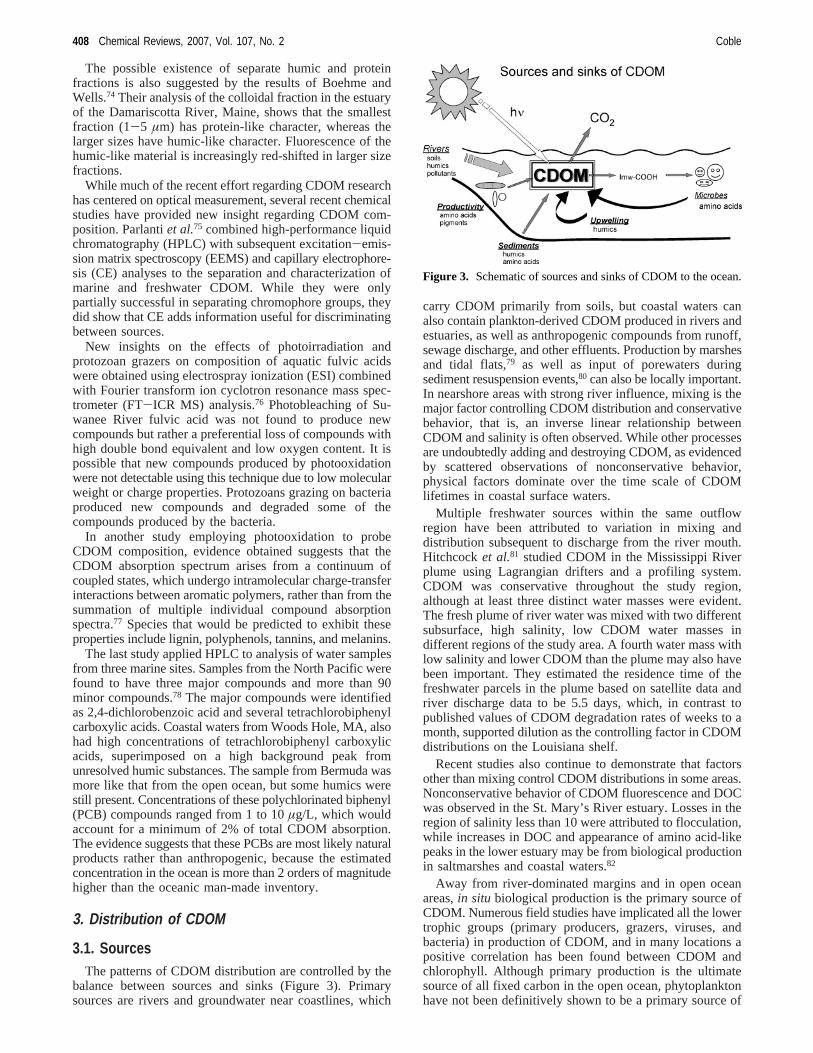
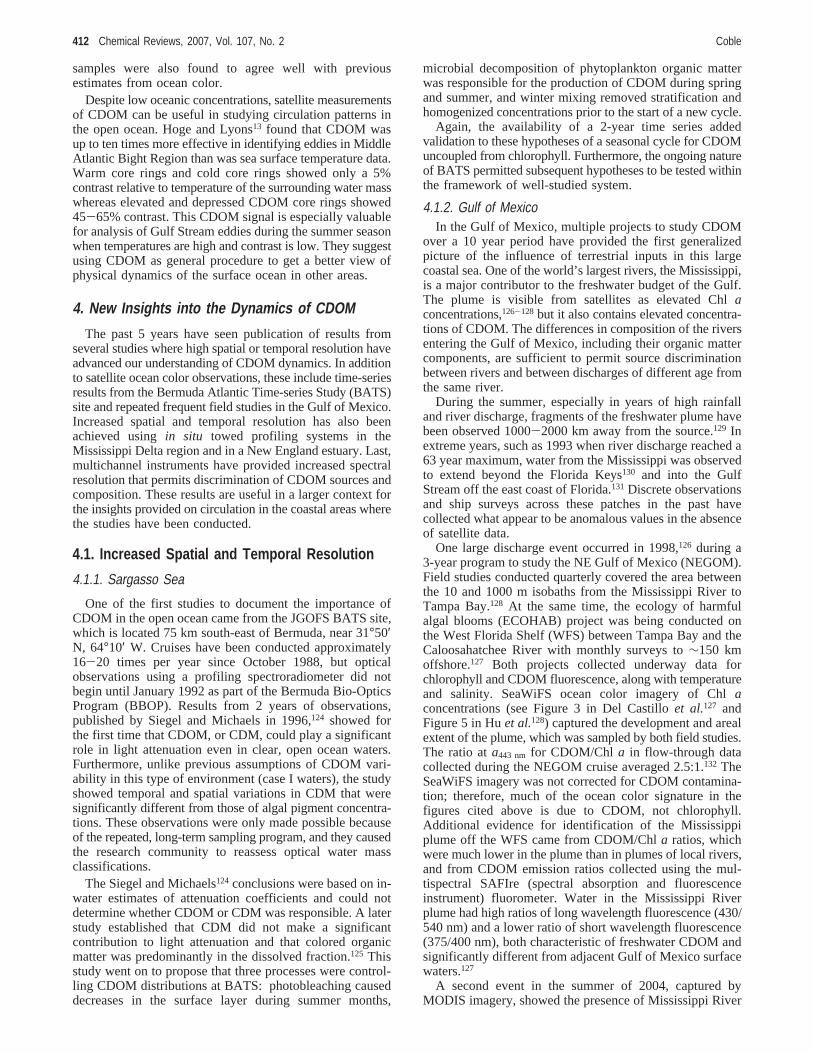
3.1. SourcesThe patterns of CDOM distribution are controlled by the
balance between sources and sinks (Figure 3). Primarysources are rivers and groundwater near coastlines, which
carry CDOM primarily from soils, but coastal waters canalso contain plankton-derived CDOM produced in rivers andestuaries, as well as anthropogenic compounds from runoff,sewage discharge, and other effluents. Production by marshesand tidal flats,79 as well as input of porewaters duringsediment resuspension events,80 can also be locally important.In nearshore areas with strong river influence, mixing is themajor factor controlling CDOM distribution and conservativebehavior, that is, an inverse linear relationship betweenCDOM and salinity is often observed. While other processesare undoubtedly adding and destroying CDOM, as evidencedby scattered observations of nonconservative behavior,physical factors dominate over the time scale of CDOMlifetimes in coastal surface waters.
Multiple freshwater sources within the same outflowregion have been attributed to variation in mixing anddistribution subsequent to discharge from the river mouth.Hitchcocket al.81 studied CDOM in the Mississippi Riverplume using Lagrangian drifters and a profiling system.CDOM was conservative throughout the study region,although at least three distinct water masses were evident.The fresh plume of river water was mixed with two differentsubsurface, high salinity, low CDOM water masses indifferent regions of the study area. A fourth water mass withlow salinity and lower CDOM than the plume may also havebeen important. They estimated the residence time of thefreshwater parcels in the plume based on satellite data andriver discharge data to be 5.5 days, which, in contrast topublished values of CDOM degradation rates of weeks to amonth, supported dilution as the controlling factor in CDOMdistributions on the Louisiana shelf.
Recent studies also continue to demonstrate that factorsother than mixing control CDOM distributions in some areas.Nonconservative behavior of CDOM fluorescence and DOCwas observed in the St. Mary’s River estuary. Losses in theregion of salinity less than 10 were attributed to flocculation,while increases in DOC and appearance of amino acid-likepeaks in the lower estuary may be from biological productionin saltmarshes and coastal waters.82
Away from river-dominated margins and in open oceanareas,in situ biological production is the primary source ofCDOM. Numerous field studies have implicated all the lowertrophic groups (primary producers, grazers, viruses, andbacteria) in production of CDOM, and in many locations apositive correlation has been found between CDOM andchlorophyll. Although primary production is the ultimatesource of all fixed carbon in the open ocean, phytoplanktonhave not been definitively shown to be a primary source of
Figure 3. Schematic of sources and sinks of CDOM to the ocean.
408 Chemical Reviews, 2007, Vol. 107, No. 2 Coble
CDOM. Processes that release or recycle phytoplankton cellcontents, such as sloppy feeding by grazers, viral lysis,excretion of metabolites by bacteria and zooplankton, orexudation of mucus and other extracellular secretions, likelyplay a major role in production of CDOM.
In one of the more comprehensive laboratory studies ofCDOM sources, Rochelle-Newall and Fisher83 concluded thatphytoplankton are not an important direct source of CDOM,as not even sonication of 11 cultures resulted in directproduction. However, bacteria were implicated in productionof CDOM from noncolored algal precursors.
Increased CDOM concentrations have been reported inassociation with harmful algal blooms of the dinoflagellateKarenia breVis84 and the brown tide organismAureococcusanophagefferens.85 In the latter study, there was also anincrease in a protein-like signal in the colloidal (0.2-0.7µm)fraction at the height of the bloom. Since these were fieldstudies, bacteria and zooplankton were undoubtedly present,but their role in CDOM production cannot be assessed.
Steinberget al.86 observed CDOM production by zoo-plankton, protozoans, and a colonial cyanobacterium duringincubation experiments. Excretion was likely the majorprocess responsible for zooplankton CDOM, since incuba-tions were made in filtered seawater and dissolution fromfecal pellets did not produce measurable amounts of CDOM.The absorbance spectra of CDOM produced by each groupof organisms were markedly different. Crustacea (copepods,euphausiids, amphipods) CDOM had an absorbance maxi-mum at 250-275 nm, similar to that of nitrogenous wasteproducts such as amino acids and urea. CDOM from salps(pelagic tunicates) showed a peak at 295-298 nm, possiblyfrom the mucus slime produced by these organisms. Thespectrum of CDOM from a gelatinous polychaete worm(alciopid) showed one peak at 270 nm and a second broaderpeak at 425 nm with a shoulder at 375 nm. These wormsare known to produce a yellow slime, which would beconsistent with this spectrum. Colonial radiolaria alsoproduced CDOM, with an absorbance maximum at 300 nm.
This same study86 also found production of CDOM fromcolonial cyanobacteria species of genusTrichodesmiumwithabsorbance maxima at 325 and 360 nm, similar to spectraof mycosporine-like amino acids (MAAs). Similar absor-bance spectra have previously been reported fromLingulo-dinium polyedrum,87,88 a red-tide-forming dinoflagellate, aswell as from water-solubleTrichodesmiumpigments.89
MAAs are thought to be produced by a variety of marineorganisms to provide UV protection.90
Bacteria, not phytoplankton, may be responsible for newCDOM production in the Sargasso Sea based on (1) lack ofcorrelation between chlorophyll concentrations and CDOMconcentrations, (2) a lag between the main phytoplanktonbloom and peak in CDOM concentration, and (3) correlationbetween depth profiles of CDOM and bacterial abundance.91
Recent incubation experiments with Sargasso seawaterdemonstrated both production and consumption by bacteria.Estimates of bacterial contribution of new CDOM to the totalCDOM pool ranged from 12% in winter to over 50% inautumn.92
A similar lag in CDOM increase after phytoplanktonblooms has also been observed in a coastal region, whereCDOM dominates total water column absorbance exceptduring the spring bloom.93 Again, this would seem to suggestthat remineralization by microbes is responsible for CDOMproduction.
A recent paper by Huet al.94 shows a connection betweenchlorophyll and CDOM based on analyses of 5 years of dailyhigh-resolution sea-viewing wide field-of-view sensor (Sea-WiFS) images of ocean color for the central North AtlanticOcean, including the Sargasso Sea. CDOM maxima wereshown to lag pigment maxima by 2-4 weeks. The synopticcoverage and long time series provide strong evidence thatchlorophyll and CDOM are not correlated but that the sourceof oceanic CDOM is almost certainly the result of phy-toplankton degradation.
Another open ocean environment where autochthonousproduction of CDOM is locally important is coral reefs. Highreef productivity and remineralization in the shallow watersof Bahamas Banks produces new CDOM. Boss and Zan-eveld95 found that near-bottom concentrations of CDOMwere higher over reef sediments than over adjacent sandsediments. The CDOM in the water column is concentratedby evaporation and the resulting high salinity, high CDOMwater mass is carried into adjacent Exuma Sound where itsfate varies diurnally.96 During warm days, solar heating ofthe water mass can be sufficient to cause it to remain at thesurface, where it is observed as high CDOM plumes insatellite ocean color images. During the night when coolerwater temperatures prevail, the high CDOM plume sinks tointermediate depths in the sound, where it can persist as asubsurface maximum at the base of the mixed layer fordistances of tens of kilometers. Intensified input of CDOMto local oligotrophic waters was observed following windevents. This study provides valuable insights into CDOMdistribution in the oceans, specifically the formation ofsubsurface layers where density differences can impartstability and location below the surface imparts protectionfrom photodegradation of chromophores. The CDOM alsomay protect corals from damaging UV radiation.97
CDOM is present in porewaters of other sediment types,and both humic-like and protein-like fluorophores have beendetected using EEMS.45,98-100 Diffusion, bio-irrigation andresuspension from organic-rich sediments may serve as alocally important source of CDOM.80,98-100
3.2. SinksPhotobleaching is the dominant process for CDOM
removal from natural waters,101with microbial decompositionof lesser importance.102,103Destruction of CDOM by exposureto sunlight releases compounds used for growth of organ-isms,104 as well as nitrogen and trace metals, although themajor product is dissolved inorganic carbon (see reviews byMoran and Zepp105 and Mopper and Kieber106).
Significant loss of CDOM due to photobleaching has beenshown for surface waters of the Mid-Atlantic Bight duringsummer stratification, along with an increase inS anddecrease inaCDOM/DOC ratios.31 The study suggests thatautochthonous CDOM is a minor portion of total CDOMand that CDOM sources and sinks are distinct from those ofDOC.
Three recent studies have compared the relative importanceof bacterial Versus photochemical processes on CDOMcomposition and concentration. In a study of long-term fateof CDOM, Vahatalo and Wetzel107 found that 96% of CDOMfrom freshwater was destroyed by solar radiation. Decom-position of CDOM in dark incubations took 70 times longerthan during exposure to sunlight.
Obernosterer and Benner108 compared long-term decom-position of phytoplankton cultures, lake water, and water
Marine Optical Biogeochemistry Chemical Reviews, 2007, Vol. 107, No. 2 409
from a blackwater river from both photomineralization andbacterial mineralization. Both processes decreaseda350 andDOC in the blackwater river and the lake samples, with anincrease in spectral slope as well. Terrigenous DOM wasmore susceptible to photodegradation than biodegradation.The phytoplankton DOM showed a much higher susceptibil-ity to biodegradation than did the other two sources of DOM.The phytoplankton DOM showed decrease ina350 fromphotomineralization, but DOC only decreased in responseto biomineralization. All types of DOM had some componentthat was resistant to both photodegradation and biodegrada-tion, varying from 20% for the terrestrial material to 65%for lake water. This finding may be partially explained bythe constant exposure of surface water in the lake to bothprocesses, allowing destruction of reactive DOM whileresistant DOM slowly accumulates.
Stedmon and Markager109 studied the composition ofCDOM produced by phytoplankton in large bag experiments.They found that microbial activity both produced anddestroyed fresh autochthonous DOM from algae. Norwegianfjord water was enriched with nitrogen and phosphorus tocreate a bloom. Some bags also received silicate to stimulatediatom growth. After 7 days, bags were forced into nutrientlimitation. Seven unique components were produced, all ofwhich were similar to those previously identified in naturalwater samples. Two of the components were protein-like,and five were humic-like. Subsequent photochemical andmicrobial degradation was somewhat dependent on phy-toplankton nutrient status. The five humic fractions wereproduced by microbial degradation of phytoplankton DOMand were readily removed by photodegradation. Two protein-like fractions were produced during exponential growth ofalgae and were degraded both photochemically and micro-bially.
Taken as a whole, these studies suggest that CDOMproduction and degradation is not well-described by bulkoptical properties, but rather the chromophore pools canrespond differentially. Production by different types ofanimals appears to be compound specific and may alsodepend on source of carbon. CDOM source and history ofexposure to sunlight may also influence results from pho-tobleaching studies. More studies of processes on multipleCDOM components will be needed to explain apparentdiscrepancies in results.
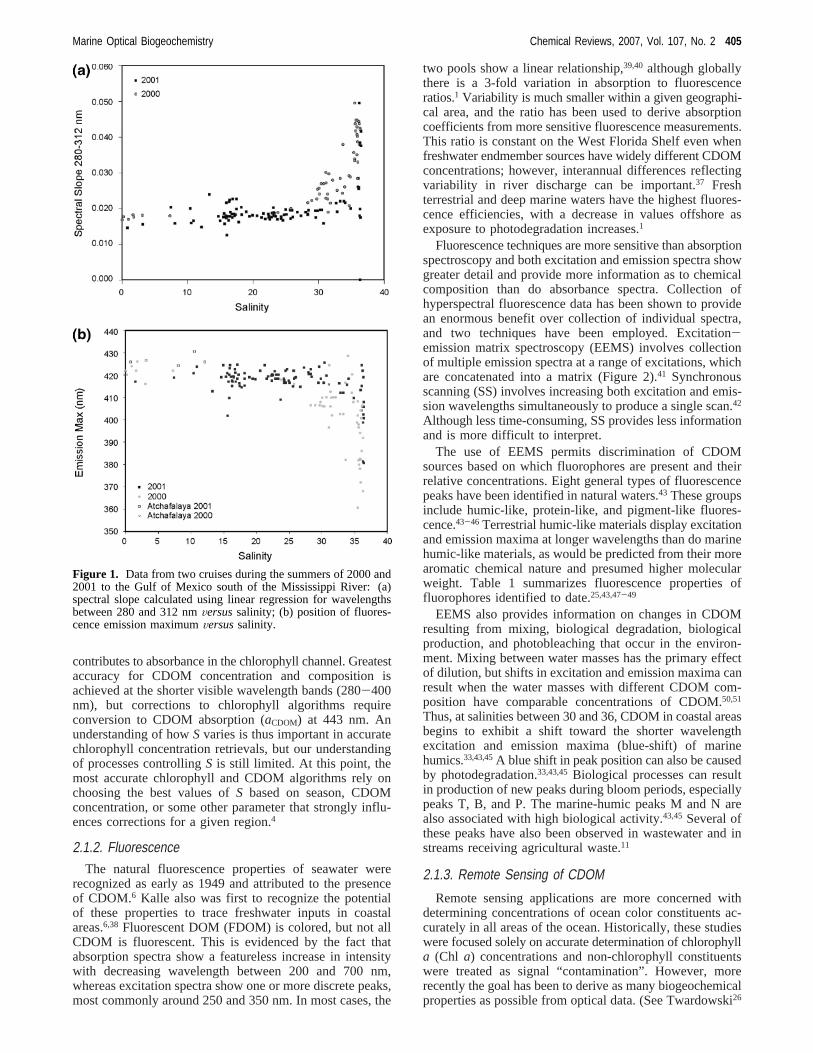
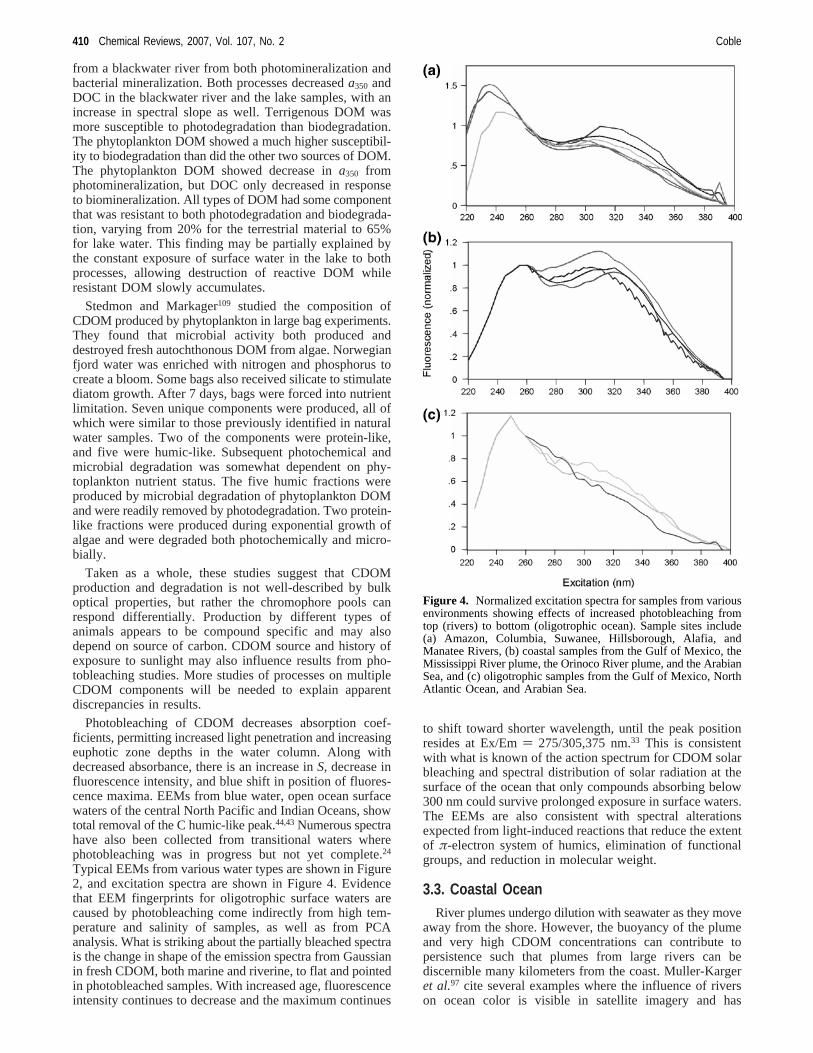
Photobleaching of CDOM decreases absorption coef-ficients, permitting increased light penetration and increasingeuphotic zone depths in the water column. Along withdecreased absorbance, there is an increase inS, decrease influorescence intensity, and blue shift in position of fluores-cence maxima. EEMs from blue water, open ocean surfacewaters of the central North Pacific and Indian Oceans, showtotal removal of the C humic-like peak.44,43Numerous spectrahave also been collected from transitional waters wherephotobleaching was in progress but not yet complete.24
Typical EEMs from various water types are shown in Figure2, and excitation spectra are shown in Figure 4. Evidencethat EEM fingerprints for oligotrophic surface waters arecaused by photobleaching come indirectly from high tem-perature and salinity of samples, as well as from PCAanalysis. What is striking about the partially bleached spectrais the change in shape of the emission spectra from Gaussianin fresh CDOM, both marine and riverine, to flat and pointedin photobleached samples. With increased age, fluorescenceintensity continues to decrease and the maximum continues
to shift toward shorter wavelength, until the peak positionresides at Ex/Em) 275/305,375 nm.33 This is consistentwith what is known of the action spectrum for CDOM solarbleaching and spectral distribution of solar radiation at thesurface of the ocean that only compounds absorbing below300 nm could survive prolonged exposure in surface waters.The EEMs are also consistent with spectral alterationsexpected from light-induced reactions that reduce the extentof π-electron system of humics, elimination of functionalgroups, and reduction in molecular weight.
3.3. Coastal OceanRiver plumes undergo dilution with seawater as they move
away from the shore. However, the buoyancy of the plumeand very high CDOM concentrations can contribute topersistence such that plumes from large rivers can bediscernible many kilometers from the coast. Muller-Kargeret al.97 cite several examples where the influence of riverson ocean color is visible in satellite imagery and has
Figure 4. Normalized excitation spectra for samples from variousenvironments showing effects of increased photobleaching fromtop (rivers) to bottom (oligotrophic ocean). Sample sites include(a) Amazon, Columbia, Suwanee, Hillsborough, Alafia, andManatee Rivers, (b) coastal samples from the Gulf of Mexico, theMississippi River plume, the Orinoco River plume, and the ArabianSea, and (c) oligotrophic samples from the Gulf of Mexico, NorthAtlantic Ocean, and Arabian Sea.
410 Chemical Reviews, 2007, Vol. 107, No. 2 Coble
application to the study of ocean circulation, assessment ofterrestrial inputs to coral reef ecology, and other coastalmanagement issues.
Hu et al.14 described temporal patterns of Amazon andOrinoco River plume dispersal in the North Atlantic over a5 year period using sea-viewing wide field-of view sensor(SeaWiFS) for ocean color data and salinity profilingautonomous Lagrangian current explorer (S-PALACE) floatsthat collectedin situ hydrographic data. They were able todetermine that low salinity patches observed as far as 2000km away from the mouths of these rivers originated fromriver flow, not from coastal upwelling as had been previouslyproposed. The color signature of the plumes was dominatedby CDOM, in contrast to oceanic waters adjacent to theplume where chlorophyll dominated ocean color. Maximumextent of the plumes was observed in July and showed a lagtime of about 30 days after maximum discharge rate. In thisregion, CDOM was a better indicator of water of river originthan was chlorophyll. They also found that satellite detectionof CDOM was useful for budgeting freshwater inputs fromrivers and their areal extent, as well as in mass balancecalculations for salt and carbon.
Under special conditions, even smaller rivers can impactoceanic regions. Kudela and Chavez110 observed that duringheavy El Nino rains in southern California, riverine CDOMspread up to 300 km offshore, not something seen in typicalupwelling dominated years.
In a study of the highly industrialized Pearl River estuary,Hong et al.111 observed that most of ocean color signaturewas due to CDOM, not chlorophyll. Furthermore, the protein-like peak dominated over humic-like peaks, which wasinterpreted as an indication that anthropogenic DOM makesa significant contribution to the carbon pool in this system.Callahanet al.112 found conservative mixing of both CDOMand DOC in Pearl River Estuary; however the ratio ofCDOM/DOC decreased with salinity, mostly due to loss ofCDOM.
Arctic rivers have high concentrations of DOC, but fewstudies of CDOM have been done until recently. TerrestrialCDOM dominates the western Artic Ocean, which receives10% of global river discharge.113 In the Yukon River, DOCconcentrations decreased from the time of ice breakupthrough summer, but CDOM/DOC increased during thatsame period.114 This indicates that soil-derived carbondominated the system during summer. One possible explana-tion is that extraction efficiencies of humic materials fromsoils were increased due to warm summer temperatures.
Amon et al.115 usedin situ fluorescence as a proxy fordistribution and concentration of terrigenous DOM in NordicSeas for the purpose of refining estimates of carbon exportinto Atlantic Ocean. They found that 20-50% of the annualriver discharge is exported. They also observed a subsurfacefluorescence maximum in the East Greenland Current andsuggested that Asian rivers are the main source of signal.There was little alteration of fluorescent properties duringmultiyear transport of water across Arctic Basin from sourcerivers and likewise indiscernible evidence of photochemicalalteration. Evidence of new marine production of CDOMwas found in the appearance of protein-like fluorescence inmarine samples from Greenland Sea and Fram Strait.
3.4. Open Ocean
Open ocean areas away from the influence of rivers andcoastal waters have historically been under-sampled for
CDOM. The surface waters of central ocean gyres have thelowest concentrations of CDOM due to the long residencetime of water above the mixed layer and prolonged exposureto solar radiation. Concentrations of CDOM in these areashave been reported to be between 0.0684 and 0.1108 m-1
(a325 nm) on the NW Australian Shelf (Coble and Conmy,unpublished) and between 0.05 and 0.075 m-1 (a325 nm) forthe North Atlantic.116 Below the surface, CDOM increasesmonotonically with depth.38,117-120 Values reported for deep-water in the North Atlantic ranged from 0.125 to 0.2 m-1.116
Subsurface fluorescence maxima have been reported fromthe Pacific Ocean,121,122 where association with nutrientmaxima and apparent oxygen utilization minimum suggestremineralization as the source of CDOM. Depth profiles ofCDOM (Ex/Em) 320-390/475-530) and flavin (Ex/Em) 450/525) fluorescence collected in the Black Sea, theworld’s largest anoxic basin, also showed DOM fluorescenceincreasing with depth, with a sharp increase below the baseof the surface mixed layer and well below the depth of thechlorophyll maximum. Subsequent EEMS analysis of samplesfrom the Black Sea confirmed the humic-like nature of theCDOM.41 Since salinity increases with depth in the BlackSea,in situ production from organic matter decompositionrather than river input was the likely source of CDOM.
Early results using EEMs and a towed profiling systemin the Arabian Sea showed that upwelling of subsurfacewaters is a source in these regions, as is remineralization ofphytoplankton.43 Results of long-term time series in theSargasso Sea have shown seasonal patterns of CDOMdistribution and concentration in the upper water columnassociated also with remineralization of the annual phy-toplankton bloom.91
In an overview paper on results of bio-optical studies ofthe JGOFS (Joint Global Ocean Flux Studies) equatorialPacific studies, Bricaudet al.123 review past observations ofoceanic CDOM. They point out the scarcity of open oceanCDOM measurements and that the relationship of CDOMto other bio-optical parameters is largely unknown. CDOMabsorption contributes∼50% of total absorption at 440 nmin surface waters of the equatorial Pacific and 100% belowthe chlorophyll maximum. They conclude that there is acritical need for systematic measurements of CDOM toenhance bio-optical modeling efforts in the ocean andrecommend that future survey efforts include CDOM absorp-tion wavelengths for filtered and unfiltered sampling.
The first global maps of CDOM distribution using SEA-WIFS published by Siegelet al.8 showed seasonal and spatialvariability in both CDOM concentration and relative con-tribution of CDOM to total nonwater absorbance at 440 nm.CDOM contributed 50% or more of nonwater absorbanceover large areas of the Pacific Ocean in both winter andsummer, despite extremely low CDOM concentrations of lessthan 0.01 m-1. Two additional conclusions from this analysiswere that (1) even though CDOM distributions mimickedchlorophyll distribution on the global basin scale, there wasno statistically significant correlation, indicating that the twoare decoupled and (2) terrestrial inputs of CDOM were notthe primary factor determining global distributions.
Results from CLIVAR, the most extensive field study todate that included measurement of CDOM concentrations,are still in preparation, but preliminary results indicate thatCDOM remineralization may be less important than watermass mixing and circulation in the North Atlantic Ocean.116
Measurements of CDOM absorption coefficients on water
Marine Optical Biogeochemistry Chemical Reviews, 2007, Vol. 107, No. 2 411
samples were also found to agree well with previousestimates from ocean color.
Despite low oceanic concentrations, satellite measurementsof CDOM can be useful in studying circulation patterns inthe open ocean. Hoge and Lyons13 found that CDOM wasup to ten times more effective in identifying eddies in MiddleAtlantic Bight Region than was sea surface temperature data.Warm core rings and cold core rings showed only a 5%contrast relative to temperature of the surrounding water masswhereas elevated and depressed CDOM core rings showed45-65% contrast. This CDOM signal is especially valuablefor analysis of Gulf Stream eddies during the summer seasonwhen temperatures are high and contrast is low. They suggestusing CDOM as general procedure to get a better view ofphysical dynamics of the surface ocean in other areas.
4. New Insights into the Dynamics of CDOM
The past 5 years have seen publication of results fromseveral studies where high spatial or temporal resolution haveadvanced our understanding of CDOM dynamics. In additionto satellite ocean color observations, these include time-seriesresults from the Bermuda Atlantic Time-series Study (BATS)site and repeated frequent field studies in the Gulf of Mexico.Increased spatial and temporal resolution has also beenachieved usingin situ towed profiling systems in theMississippi Delta region and in a New England estuary. Last,multichannel instruments have provided increased spectralresolution that permits discrimination of CDOM sources andcomposition. These results are useful in a larger context forthe insights provided on circulation in the coastal areas wherethe studies have been conducted.
4.1. Increased Spatial and Temporal Resolution
4.1.1. Sargasso Sea
One of the first studies to document the importance ofCDOM in the open ocean came from the JGOFS BATS site,which is located 75 km south-east of Bermuda, near 31°50′N, 64°10′ W. Cruises have been conducted approximately16-20 times per year since October 1988, but opticalobservations using a profiling spectroradiometer did notbegin until January 1992 as part of the Bermuda Bio-OpticsProgram (BBOP). Results from 2 years of observations,published by Siegel and Michaels in 1996,124 showed forthe first time that CDOM, or CDM, could play a significantrole in light attenuation even in clear, open ocean waters.Furthermore, unlike previous assumptions of CDOM vari-ability in this type of environment (case I waters), the studyshowed temporal and spatial variations in CDM that weresignificantly different from those of algal pigment concentra-tions. These observations were only made possible becauseof the repeated, long-term sampling program, and they causedthe research community to reassess optical water massclassifications.
The Siegel and Michaels124 conclusions were based on in-water estimates of attenuation coefficients and could notdetermine whether CDOM or CDM was responsible. A laterstudy established that CDM did not make a significantcontribution to light attenuation and that colored organicmatter was predominantly in the dissolved fraction.125 Thisstudy went on to propose that three processes were control-ling CDOM distributions at BATS: photobleaching causeddecreases in the surface layer during summer months,
microbial decomposition of phytoplankton organic matterwas responsible for the production of CDOM during springand summer, and winter mixing removed stratification andhomogenized concentrations prior to the start of a new cycle.
Again, the availability of a 2-year time series addedvalidation to these hypotheses of a seasonal cycle for CDOMuncoupled from chlorophyll. Furthermore, the ongoing natureof BATS permitted subsequent hypotheses to be tested withinthe framework of well-studied system.
4.1.2. Gulf of MexicoIn the Gulf of Mexico, multiple projects to study CDOM
over a 10 year period have provided the first generalizedpicture of the influence of terrestrial inputs in this largecoastal sea. One of the world’s largest rivers, the Mississippi,is a major contributor to the freshwater budget of the Gulf.The plume is visible from satellites as elevated Chlaconcentrations,126-128 but it also contains elevated concentra-tions of CDOM. The differences in composition of the riversentering the Gulf of Mexico, including their organic mattercomponents, are sufficient to permit source discriminationbetween rivers and between discharges of different age fromthe same river.
During the summer, especially in years of high rainfalland river discharge, fragments of the freshwater plume havebeen observed 1000-2000 km away from the source.129 Inextreme years, such as 1993 when river discharge reached a63 year maximum, water from the Mississippi was observedto extend beyond the Florida Keys130 and into the GulfStream off the east coast of Florida.131 Discrete observationsand ship surveys across these patches in the past havecollected what appear to be anomalous values in the absenceof satellite data.
One large discharge event occurred in 1998,126 during a3-year program to study the NE Gulf of Mexico (NEGOM).Field studies conducted quarterly covered the area betweenthe 10 and 1000 m isobaths from the Mississippi River toTampa Bay.128 At the same time, the ecology of harmfulalgal blooms (ECOHAB) project was being conducted onthe West Florida Shelf (WFS) between Tampa Bay and theCaloosahatchee River with monthly surveys to∼150 kmoffshore.127 Both projects collected underway data forchlorophyll and CDOM fluorescence, along with temperatureand salinity. SeaWiFS ocean color imagery of Chlaconcentrations (see Figure 3 in Del Castilloet al.127 andFigure 5 in Huet al.128) captured the development and arealextent of the plume, which was sampled by both field studies.The ratio ata443 nm for CDOM/Chl a in flow-through datacollected during the NEGOM cruise averaged 2.5:1.132 TheSeaWiFS imagery was not corrected for CDOM contamina-tion; therefore, much of the ocean color signature in thefigures cited above is due to CDOM, not chlorophyll.Additional evidence for identification of the Mississippiplume off the WFS came from CDOM/Chla ratios, whichwere much lower in the plume than in plumes of local rivers,and from CDOM emission ratios collected using the mul-tispectral SAFIre (spectral absorption and fluorescenceinstrument) fluorometer. Water in the Mississippi Riverplume had high ratios of long wavelength fluorescence (430/540 nm) and a lower ratio of short wavelength fluorescence(375/400 nm), both characteristic of freshwater CDOM andsignificantly different from adjacent Gulf of Mexico surfacewaters.127
A second event in the summer of 2004, captured byMODIS imagery, showed the presence of Mississippi River
412 Chemical Reviews, 2007, Vol. 107, No. 2 Coble
plume water in the South Atlantic Bight off the coast ofGeorgia.129 CDOM concentrations in the plume by the timeit had reached the Florida Straits were less than predictedfrom salinity based on previous observations, and this wasattributed to photobleaching in the estimated 1 month sincethe plume entered the Gulf of Mexico. This study highlightsthe potential longevity of surface manifestation of theMississippi River when entrained in the Loop Current-Florida current-Gulf Stream system, as well as the influenceof the Mississippi River throughout the region.
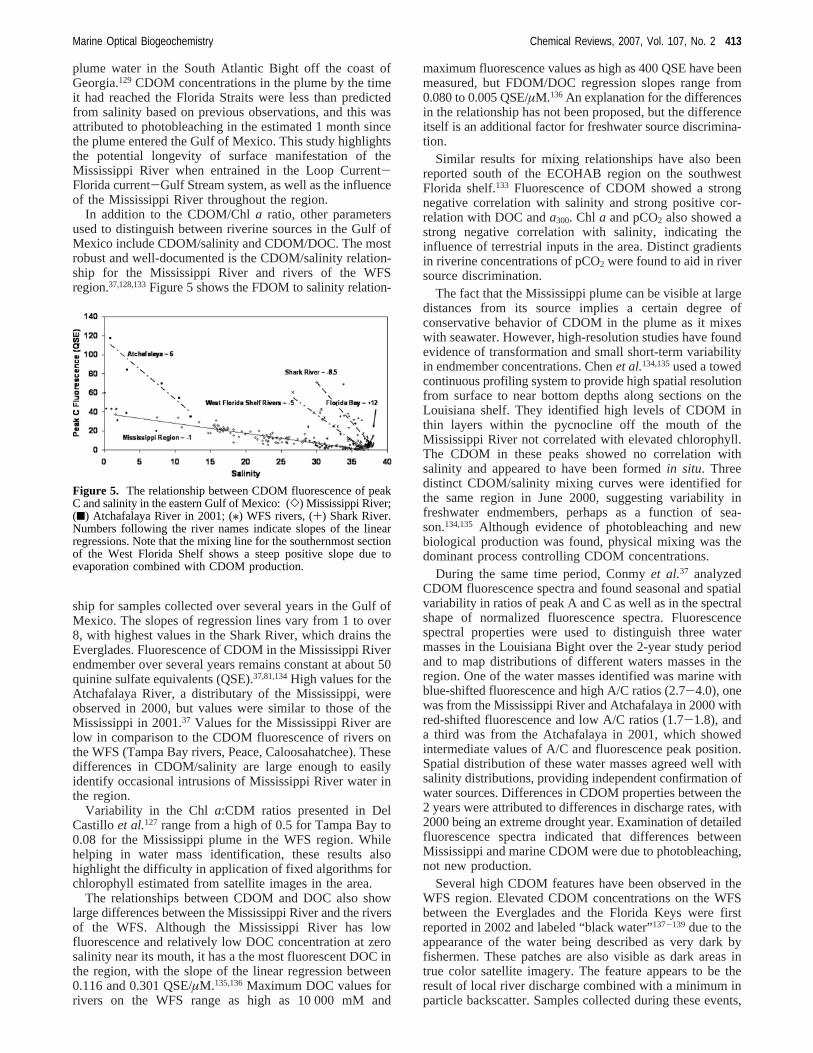
In addition to the CDOM/Chla ratio, other parametersused to distinguish between riverine sources in the Gulf ofMexico include CDOM/salinity and CDOM/DOC. The mostrobust and well-documented is the CDOM/salinity relation-ship for the Mississippi River and rivers of the WFSregion.37,128,133Figure 5 shows the FDOM to salinity relation-
ship for samples collected over several years in the Gulf ofMexico. The slopes of regression lines vary from 1 to over8, with highest values in the Shark River, which drains theEverglades. Fluorescence of CDOM in the Mississippi Riverendmember over several years remains constant at about 50quinine sulfate equivalents (QSE).37,81,134High values for theAtchafalaya River, a distributary of the Mississippi, wereobserved in 2000, but values were similar to those of theMississippi in 2001.37 Values for the Mississippi River arelow in comparison to the CDOM fluorescence of rivers onthe WFS (Tampa Bay rivers, Peace, Caloosahatchee). Thesedifferences in CDOM/salinity are large enough to easilyidentify occasional intrusions of Mississippi River water inthe region.
Variability in the Chl a:CDM ratios presented in DelCastilloet al.127 range from a high of 0.5 for Tampa Bay to0.08 for the Mississippi plume in the WFS region. Whilehelping in water mass identification, these results alsohighlight the difficulty in application of fixed algorithms forchlorophyll estimated from satellite images in the area.
The relationships between CDOM and DOC also showlarge differences between the Mississippi River and the riversof the WFS. Although the Mississippi River has lowfluorescence and relatively low DOC concentration at zerosalinity near its mouth, it has a the most fluorescent DOC inthe region, with the slope of the linear regression between0.116 and 0.301 QSE/µM.135,136Maximum DOC values forrivers on the WFS range as high as 10 000 mM and
maximum fluorescence values as high as 400 QSE have beenmeasured, but FDOM/DOC regression slopes range from0.080 to 0.005 QSE/µM.136An explanation for the differencesin the relationship has not been proposed, but the differenceitself is an additional factor for freshwater source discrimina-tion.
Similar results for mixing relationships have also beenreported south of the ECOHAB region on the southwestFlorida shelf.133 Fluorescence of CDOM showed a strongnegative correlation with salinity and strong positive cor-relation with DOC anda300. Chl a and pCO2 also showed astrong negative correlation with salinity, indicating theinfluence of terrestrial inputs in the area. Distinct gradientsin riverine concentrations of pCO2 were found to aid in riversource discrimination.
The fact that the Mississippi plume can be visible at largedistances from its source implies a certain degree ofconservative behavior of CDOM in the plume as it mixeswith seawater. However, high-resolution studies have foundevidence of transformation and small short-term variabilityin endmember concentrations. Chenet al.134,135used a towedcontinuous profiling system to provide high spatial resolutionfrom surface to near bottom depths along sections on theLouisiana shelf. They identified high levels of CDOM inthin layers within the pycnocline off the mouth of theMississippi River not correlated with elevated chlorophyll.The CDOM in these peaks showed no correlation withsalinity and appeared to have been formedin situ. Threedistinct CDOM/salinity mixing curves were identified forthe same region in June 2000, suggesting variability infreshwater endmembers, perhaps as a function of sea-son.134,135 Although evidence of photobleaching and newbiological production was found, physical mixing was thedominant process controlling CDOM concentrations.
During the same time period, Conmyet al.37 analyzedCDOM fluorescence spectra and found seasonal and spatialvariability in ratios of peak A and C as well as in the spectralshape of normalized fluorescence spectra. Fluorescencespectral properties were used to distinguish three watermasses in the Louisiana Bight over the 2-year study periodand to map distributions of different waters masses in theregion. One of the water masses identified was marine withblue-shifted fluorescence and high A/C ratios (2.7-4.0), onewas from the Mississippi River and Atchafalaya in 2000 withred-shifted fluorescence and low A/C ratios (1.7-1.8), anda third was from the Atchafalaya in 2001, which showedintermediate values of A/C and fluorescence peak position.Spatial distribution of these water masses agreed well withsalinity distributions, providing independent confirmation ofwater sources. Differences in CDOM properties between the2 years were attributed to differences in discharge rates, with2000 being an extreme drought year. Examination of detailedfluorescence spectra indicated that differences betweenMississippi and marine CDOM were due to photobleaching,not new production.
Several high CDOM features have been observed in theWFS region. Elevated CDOM concentrations on the WFSbetween the Everglades and the Florida Keys were firstreported in 2002 and labeled “black water”137-139 due to theappearance of the water being described as very dark byfishermen. These patches are also visible as dark areas intrue color satellite imagery. The feature appears to be theresult of local river discharge combined with a minimum inparticle backscatter. Samples collected during these events,
Figure 5. The relationship between CDOM fluorescence of peakC and salinity in the eastern Gulf of Mexico: (]) Mississippi River;(9) Atchafalaya River in 2001; (/) WFS rivers, (+) Shark River.Numbers following the river names indicate slopes of the linearregressions. Note that the mixing line for the southernmost sectionof the West Florida Shelf shows a steep positive slope due toevaporation combined with CDOM production.
Marine Optical Biogeochemistry Chemical Reviews, 2007, Vol. 107, No. 2 413
which have recurred several times since 2002, fall on thehistorically observed CDOM/salinity mixing line (Figure 5).
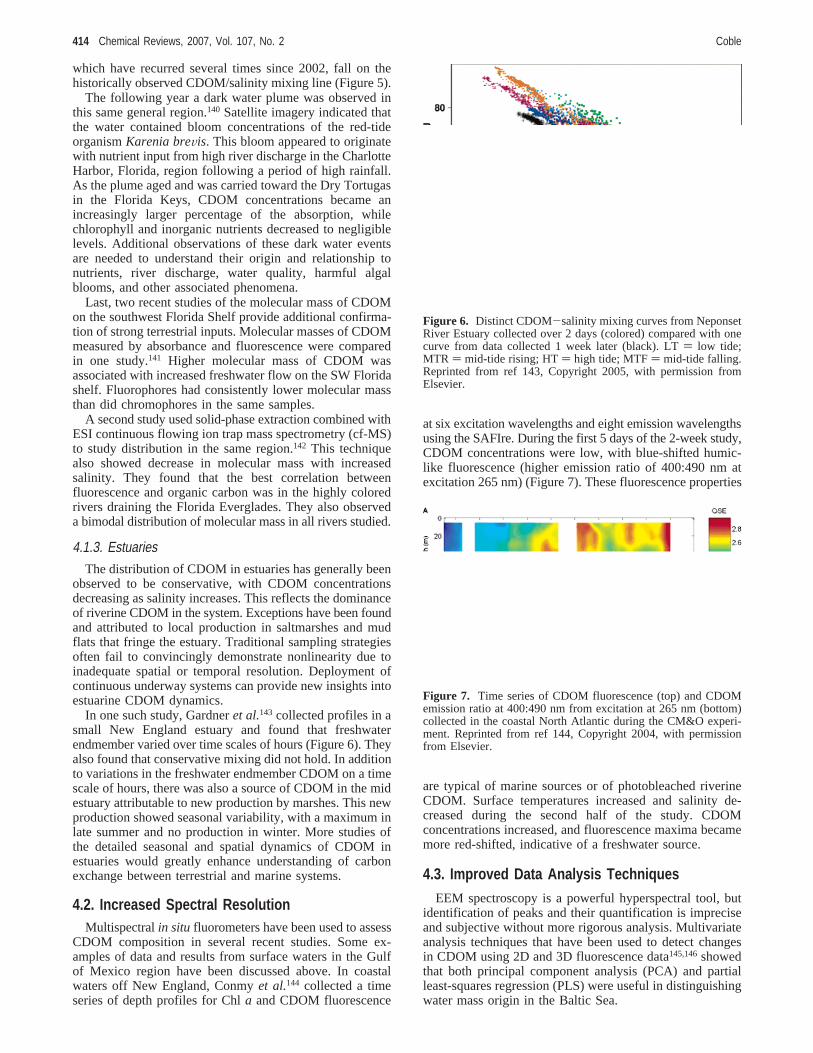
The following year a dark water plume was observed inthis same general region.140 Satellite imagery indicated thatthe water contained bloom concentrations of the red-tideorganismKarenia breVis. This bloom appeared to originatewith nutrient input from high river discharge in the CharlotteHarbor, Florida, region following a period of high rainfall.As the plume aged and was carried toward the Dry Tortugasin the Florida Keys, CDOM concentrations became anincreasingly larger percentage of the absorption, whilechlorophyll and inorganic nutrients decreased to negligiblelevels. Additional observations of these dark water eventsare needed to understand their origin and relationship tonutrients, river discharge, water quality, harmful algalblooms, and other associated phenomena.
Last, two recent studies of the molecular mass of CDOMon the southwest Florida Shelf provide additional confirma-tion of strong terrestrial inputs. Molecular masses of CDOMmeasured by absorbance and fluorescence were comparedin one study.141 Higher molecular mass of CDOM wasassociated with increased freshwater flow on the SW Floridashelf. Fluorophores had consistently lower molecular massthan did chromophores in the same samples.
A second study used solid-phase extraction combined withESI continuous flowing ion trap mass spectrometry (cf-MS)to study distribution in the same region.142 This techniquealso showed decrease in molecular mass with increasedsalinity. They found that the best correlation betweenfluorescence and organic carbon was in the highly coloredrivers draining the Florida Everglades. They also observeda bimodal distribution of molecular mass in all rivers studied.
4.1.3. EstuariesThe distribution of CDOM in estuaries has generally been
observed to be conservative, with CDOM concentrationsdecreasing as salinity increases. This reflects the dominanceof riverine CDOM in the system. Exceptions have been foundand attributed to local production in saltmarshes and mudflats that fringe the estuary. Traditional sampling strategiesoften fail to convincingly demonstrate nonlinearity due toinadequate spatial or temporal resolution. Deployment ofcontinuous underway systems can provide new insights intoestuarine CDOM dynamics.
In one such study, Gardneret al.143 collected profiles in asmall New England estuary and found that freshwaterendmember varied over time scales of hours (Figure 6). Theyalso found that conservative mixing did not hold. In additionto variations in the freshwater endmember CDOM on a timescale of hours, there was also a source of CDOM in the midestuary attributable to new production by marshes. This newproduction showed seasonal variability, with a maximum inlate summer and no production in winter. More studies ofthe detailed seasonal and spatial dynamics of CDOM inestuaries would greatly enhance understanding of carbonexchange between terrestrial and marine systems.
4.2. Increased Spectral ResolutionMultispectralin situ fluorometers have been used to assess
CDOM composition in several recent studies. Some ex-amples of data and results from surface waters in the Gulfof Mexico region have been discussed above. In coastalwaters off New England, Conmyet al.144 collected a timeseries of depth profiles for Chla and CDOM fluorescence
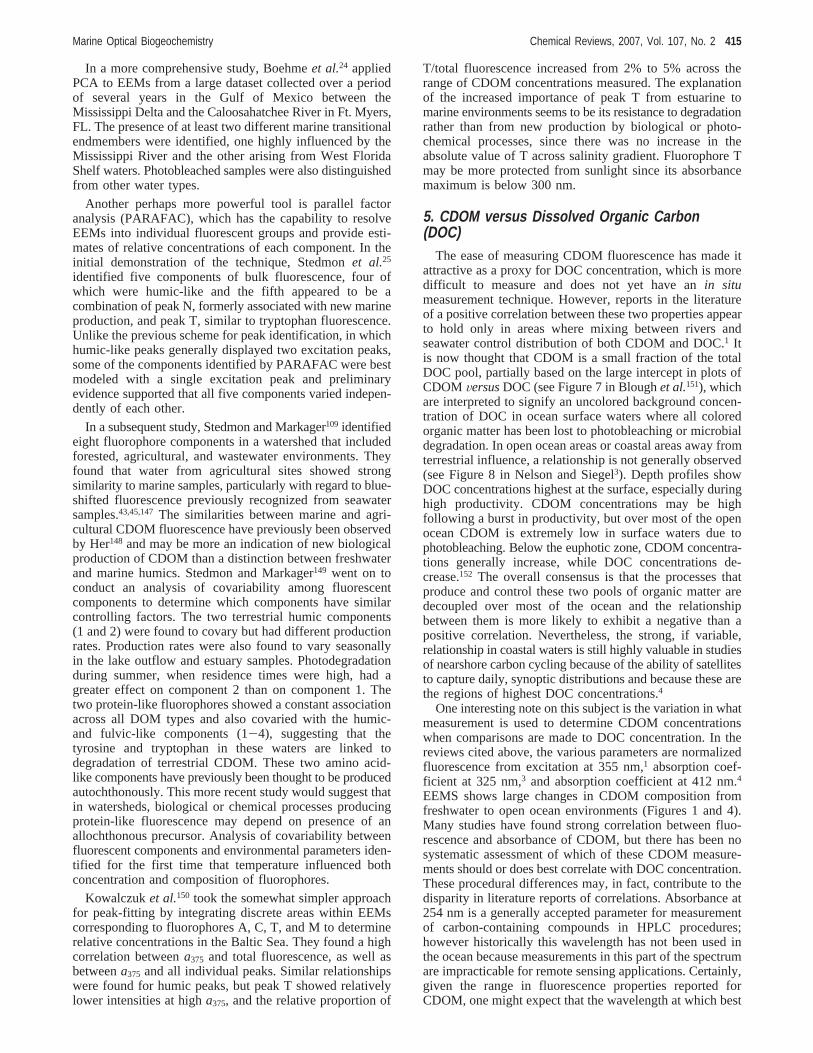
at six excitation wavelengths and eight emission wavelengthsusing the SAFIre. During the first 5 days of the 2-week study,CDOM concentrations were low, with blue-shifted humic-like fluorescence (higher emission ratio of 400:490 nm atexcitation 265 nm) (Figure 7). These fluorescence properties
are typical of marine sources or of photobleached riverineCDOM. Surface temperatures increased and salinity de-creased during the second half of the study. CDOMconcentrations increased, and fluorescence maxima becamemore red-shifted, indicative of a freshwater source.
4.3. Improved Data Analysis TechniquesEEM spectroscopy is a powerful hyperspectral tool, but
identification of peaks and their quantification is impreciseand subjective without more rigorous analysis. Multivariateanalysis techniques that have been used to detect changesin CDOM using 2D and 3D fluorescence data145,146showedthat both principal component analysis (PCA) and partialleast-squares regression (PLS) were useful in distinguishingwater mass origin in the Baltic Sea.
Figure 6. Distinct CDOM-salinity mixing curves from NeponsetRiver Estuary collected over 2 days (colored) compared with onecurve from data collected 1 week later (black). LT) low tide;MTR ) mid-tide rising; HT) high tide; MTF) mid-tide falling.Reprinted from ref 143, Copyright 2005, with permission fromElsevier.
Figure 7. Time series of CDOM fluorescence (top) and CDOMemission ratio at 400:490 nm from excitation at 265 nm (bottom)collected in the coastal North Atlantic during the CM&O experi-ment. Reprinted from ref 144, Copyright 2004, with permissionfrom Elsevier.
414 Chemical Reviews, 2007, Vol. 107, No. 2 Coble
In a more comprehensive study, Boehmeet al.24 appliedPCA to EEMs from a large dataset collected over a periodof several years in the Gulf of Mexico between theMississippi Delta and the Caloosahatchee River in Ft. Myers,FL. The presence of at least two different marine transitionalendmembers were identified, one highly influenced by theMississippi River and the other arising from West FloridaShelf waters. Photobleached samples were also distinguishedfrom other water types.
Another perhaps more powerful tool is parallel factoranalysis (PARAFAC), which has the capability to resolveEEMs into individual fluorescent groups and provide esti-mates of relative concentrations of each component. In theinitial demonstration of the technique, Stedmonet al.25
identified five components of bulk fluorescence, four ofwhich were humic-like and the fifth appeared to be acombination of peak N, formerly associated with new marineproduction, and peak T, similar to tryptophan fluorescence.Unlike the previous scheme for peak identification, in whichhumic-like peaks generally displayed two excitation peaks,some of the components identified by PARAFAC were bestmodeled with a single excitation peak and preliminaryevidence supported that all five components varied indepen-dently of each other.
In a subsequent study, Stedmon and Markager109 identifiedeight fluorophore components in a watershed that includedforested, agricultural, and wastewater environments. Theyfound that water from agricultural sites showed strongsimilarity to marine samples, particularly with regard to blue-shifted fluorescence previously recognized from seawatersamples.43,45,147 The similarities between marine and agri-cultural CDOM fluorescence have previously been observedby Her148 and may be more an indication of new biologicalproduction of CDOM than a distinction between freshwaterand marine humics. Stedmon and Markager149 went on toconduct an analysis of covariability among fluorescentcomponents to determine which components have similarcontrolling factors. The two terrestrial humic components(1 and 2) were found to covary but had different productionrates. Production rates were also found to vary seasonallyin the lake outflow and estuary samples. Photodegradationduring summer, when residence times were high, had agreater effect on component 2 than on component 1. Thetwo protein-like fluorophores showed a constant associationacross all DOM types and also covaried with the humic-and fulvic-like components (1-4), suggesting that thetyrosine and tryptophan in these waters are linked todegradation of terrestrial CDOM. These two amino acid-like components have previously been thought to be producedautochthonously. This more recent study would suggest thatin watersheds, biological or chemical processes producingprotein-like fluorescence may depend on presence of anallochthonous precursor. Analysis of covariability betweenfluorescent components and environmental parameters iden-tified for the first time that temperature influenced bothconcentration and composition of fluorophores.
Kowalczuket al.150 took the somewhat simpler approachfor peak-fitting by integrating discrete areas within EEMscorresponding to fluorophores A, C, T, and M to determinerelative concentrations in the Baltic Sea. They found a highcorrelation betweena375 and total fluorescence, as well asbetweena375 and all individual peaks. Similar relationshipswere found for humic peaks, but peak T showed relativelylower intensities at higha375, and the relative proportion of
T/total fluorescence increased from 2% to 5% across therange of CDOM concentrations measured. The explanationof the increased importance of peak T from estuarine tomarine environments seems to be its resistance to degradationrather than from new production by biological or photo-chemical processes, since there was no increase in theabsolute value of T across salinity gradient. Fluorophore Tmay be more protected from sunlight since its absorbancemaximum is below 300 nm.
5. CDOM versus Dissolved Organic Carbon(DOC)
The ease of measuring CDOM fluorescence has made itattractive as a proxy for DOC concentration, which is moredifficult to measure and does not yet have anin situmeasurement technique. However, reports in the literatureof a positive correlation between these two properties appearto hold only in areas where mixing between rivers andseawater control distribution of both CDOM and DOC.1 Itis now thought that CDOM is a small fraction of the totalDOC pool, partially based on the large intercept in plots ofCDOM VersusDOC (see Figure 7 in Bloughet al.151), whichare interpreted to signify an uncolored background concen-tration of DOC in ocean surface waters where all coloredorganic matter has been lost to photobleaching or microbialdegradation. In open ocean areas or coastal areas away fromterrestrial influence, a relationship is not generally observed(see Figure 8 in Nelson and Siegel3). Depth profiles showDOC concentrations highest at the surface, especially duringhigh productivity. CDOM concentrations may be highfollowing a burst in productivity, but over most of the openocean CDOM is extremely low in surface waters due tophotobleaching. Below the euphotic zone, CDOM concentra-tions generally increase, while DOC concentrations de-crease.152 The overall consensus is that the processes thatproduce and control these two pools of organic matter aredecoupled over most of the ocean and the relationshipbetween them is more likely to exhibit a negative than apositive correlation. Nevertheless, the strong, if variable,relationship in coastal waters is still highly valuable in studiesof nearshore carbon cycling because of the ability of satellitesto capture daily, synoptic distributions and because these arethe regions of highest DOC concentrations.4
One interesting note on this subject is the variation in whatmeasurement is used to determine CDOM concentrationswhen comparisons are made to DOC concentration. In thereviews cited above, the various parameters are normalizedfluorescence from excitation at 355 nm,1 absorption coef-ficient at 325 nm,3 and absorption coefficient at 412 nm.4
EEMS shows large changes in CDOM composition fromfreshwater to open ocean environments (Figures 1 and 4).Many studies have found strong correlation between fluo-rescence and absorbance of CDOM, but there has been nosystematic assessment of which of these CDOM measure-ments should or does best correlate with DOC concentration.These procedural differences may, in fact, contribute to thedisparity in literature reports of correlations. Absorbance at254 nm is a generally accepted parameter for measurementof carbon-containing compounds in HPLC procedures;however historically this wavelength has not been used inthe ocean because measurements in this part of the spectrumare impracticable for remote sensing applications. Certainly,given the range in fluorescence properties reported forCDOM, one might expect that the wavelength at which best
Marine Optical Biogeochemistry Chemical Reviews, 2007, Vol. 107, No. 2 415
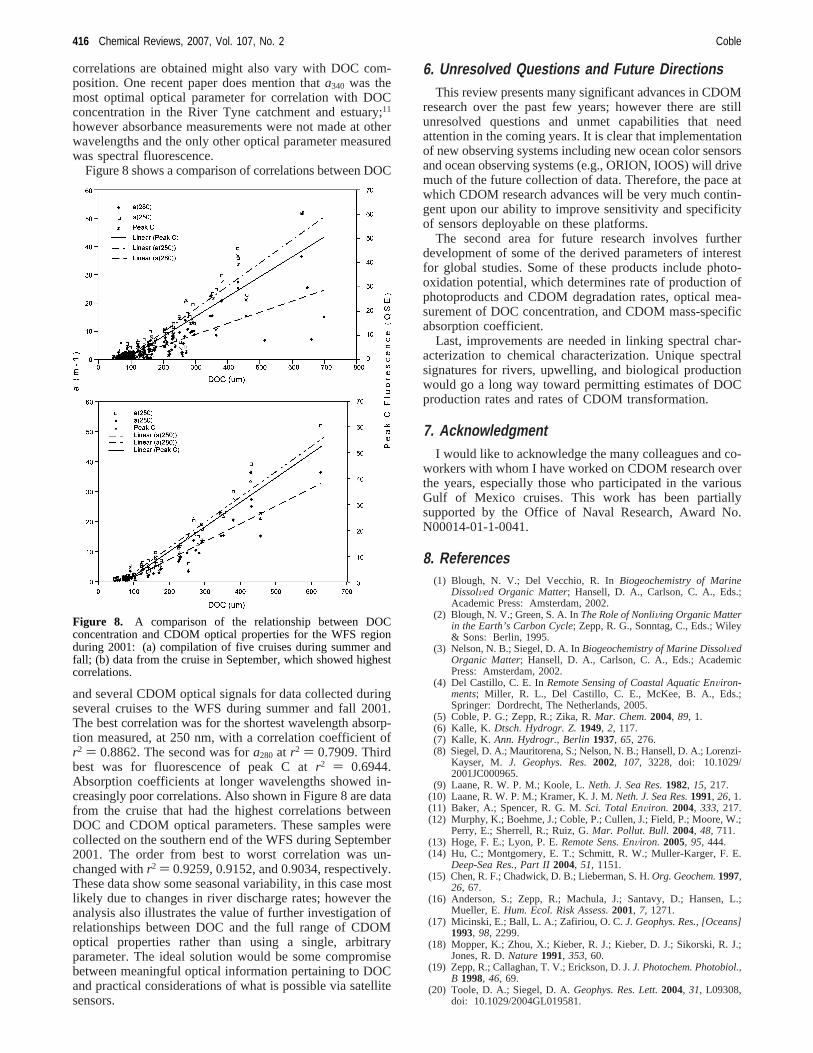
correlations are obtained might also vary with DOC com-position. One recent paper does mention thata340 was themost optimal optical parameter for correlation with DOCconcentration in the River Tyne catchment and estuary;11
however absorbance measurements were not made at otherwavelengths and the only other optical parameter measuredwas spectral fluorescence.
Figure 8 shows a comparison of correlations between DOC
and several CDOM optical signals for data collected duringseveral cruises to the WFS during summer and fall 2001.The best correlation was for the shortest wavelength absorp-tion measured, at 250 nm, with a correlation coefficient ofr2 ) 0.8862. The second was fora280 at r2 ) 0.7909. Thirdbest was for fluorescence of peak C atr2 ) 0.6944.Absorption coefficients at longer wavelengths showed in-creasingly poor correlations. Also shown in Figure 8 are datafrom the cruise that had the highest correlations betweenDOC and CDOM optical parameters. These samples werecollected on the southern end of the WFS during September2001. The order from best to worst correlation was un-changed withr2 ) 0.9259, 0.9152, and 0.9034, respectively.These data show some seasonal variability, in this case mostlikely due to changes in river discharge rates; however theanalysis also illustrates the value of further investigation ofrelationships between DOC and the full range of CDOMoptical properties rather than using a single, arbitraryparameter. The ideal solution would be some compromisebetween meaningful optical information pertaining to DOCand practical considerations of what is possible via satellitesensors.
6. Unresolved Questions and Future DirectionsThis review presents many significant advances in CDOM
research over the past few years; however there are stillunresolved questions and unmet capabilities that needattention in the coming years. It is clear that implementationof new observing systems including new ocean color sensorsand ocean observing systems (e.g., ORION, IOOS) will drivemuch of the future collection of data. Therefore, the pace atwhich CDOM research advances will be very much contin-gent upon our ability to improve sensitivity and specificityof sensors deployable on these platforms.
The second area for future research involves furtherdevelopment of some of the derived parameters of interestfor global studies. Some of these products include photo-oxidation potential, which determines rate of production ofphotoproducts and CDOM degradation rates, optical mea-surement of DOC concentration, and CDOM mass-specificabsorption coefficient.
Last, improvements are needed in linking spectral char-acterization to chemical characterization. Unique spectralsignatures for rivers, upwelling, and biological productionwould go a long way toward permitting estimates of DOCproduction rates and rates of CDOM transformation.
7. AcknowledgmentI would like to acknowledge the many colleagues and co-
workers with whom I have worked on CDOM research overthe years, especially those who participated in the variousGulf of Mexico cruises. This work has been partiallysupported by the Office of Naval Research, Award No.N00014-01-1-0041.
8. References(1) Blough, N. V.; Del Vecchio, R. InBiogeochemistry of Marine
DissolVed Organic Matter; Hansell, D. A., Carlson, C. A., Eds.;Academic Press: Amsterdam, 2002.
(2) Blough, N. V.; Green, S. A. InThe Role of NonliVing Organic Matterin the Earth’s Carbon Cycle; Zepp, R. G., Sonntag, C., Eds.; Wiley& Sons: Berlin, 1995.
(3) Nelson, N. B.; Siegel, D. A. InBiogeochemistry of Marine DissolVedOrganic Matter; Hansell, D. A., Carlson, C. A., Eds.; AcademicPress: Amsterdam, 2002.
(4) Del Castillo, C. E. InRemote Sensing of Coastal Aquatic EnViron-ments; Miller, R. L., Del Castillo, C. E., McKee, B. A., Eds.;Springer: Dordrecht, The Netherlands, 2005.
(5) Coble, P. G.; Zepp, R.; Zika, R.Mar. Chem.2004, 89, 1.(6) Kalle, K. Dtsch. Hydrogr. Z.1949, 2, 117.(7) Kalle, K. Ann. Hydrogr., Berlin1937, 65, 276.(8) Siegel, D. A.; Mauritorena, S.; Nelson, N. B.; Hansell, D. A.; Lorenzi-
Kayser, M. J. Geophys. Res.2002, 107, 3228, doi: 10.1029/2001JC000965.
(9) Laane, R. W. P. M.; Koole, L.Neth. J. Sea Res.1982, 15, 217.(10) Laane, R. W. P. M.; Kramer, K. J. M.Neth. J. Sea Res.1991, 26, 1.(11) Baker, A.; Spencer, R. G. M.Sci. Total EnViron. 2004, 333, 217.(12) Murphy, K.; Boehme, J.; Coble, P.; Cullen, J.; Field, P.; Moore, W.;
Perry, E.; Sherrell, R.; Ruiz, G.Mar. Pollut. Bull. 2004, 48, 711.(13) Hoge, F. E.; Lyon, P. E.Remote Sens. EnViron. 2005, 95, 444.(14) Hu, C.; Montgomery, E. T.; Schmitt, R. W.; Muller-Karger, F. E.
Deep-Sea Res., Part II2004, 51, 1151.(15) Chen, R. F.; Chadwick, D. B.; Lieberman, S. H.Org. Geochem.1997,
26, 67.(16) Anderson, S.; Zepp, R.; Machula, J.; Santavy, D.; Hansen, L.;
Mueller, E.Hum. Ecol. Risk Assess.2001, 7, 1271.(17) Micinski, E.; Ball, L. A.; Zafiriou, O. C.J. Geophys. Res., [Oceans]
1993, 98, 2299.(18) Mopper, K.; Zhou, X.; Kieber, R. J.; Kieber, D. J.; Sikorski, R. J.;
Jones, R. D.Nature1991, 353, 60.(19) Zepp, R.; Callaghan, T. V.; Erickson, D. J.J. Photochem. Photobiol.,
B 1998, 46, 69.(20) Toole, D. A.; Siegel, D. A.Geophys. Res. Lett.2004, 31, L09308,
doi: 10.1029/2004GL019581.
Figure 8. A comparison of the relationship between DOCconcentration and CDOM optical properties for the WFS regionduring 2001: (a) compilation of five cruises during summer andfall; (b) data from the cruise in September, which showed highestcorrelations.
416 Chemical Reviews, 2007, Vol. 107, No. 2 Coble
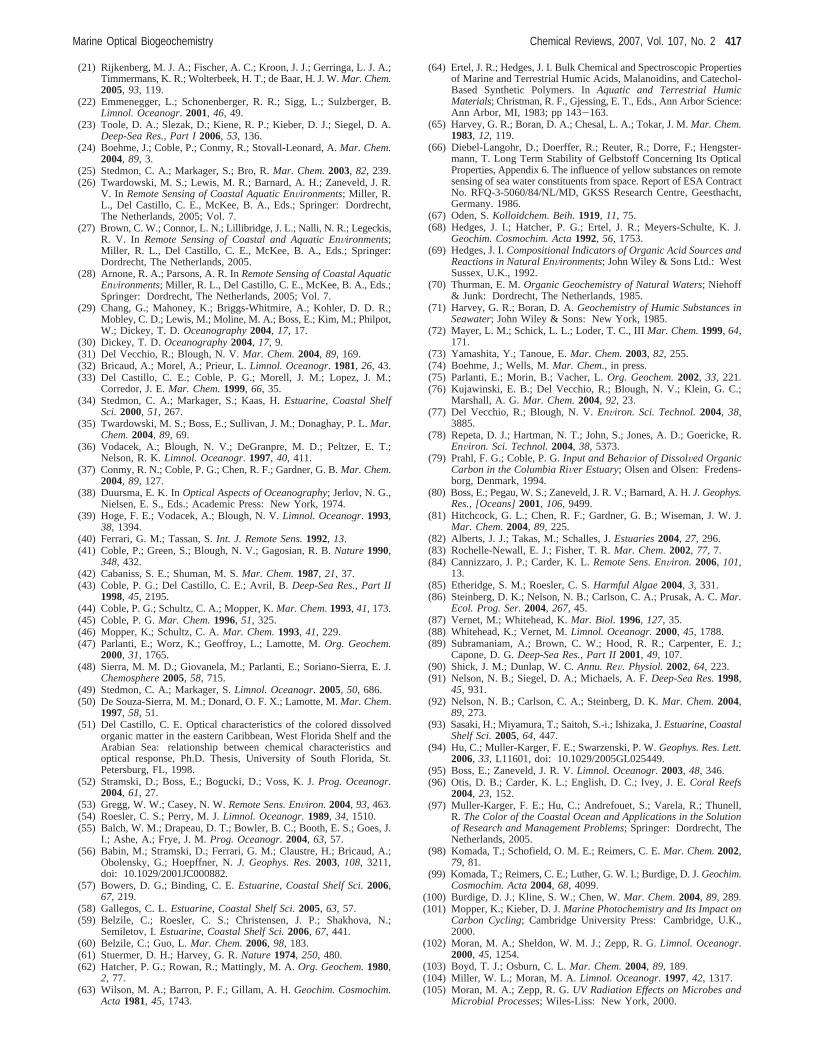
(21) Rijkenberg, M. J. A.; Fischer, A. C.; Kroon, J. J.; Gerringa, L. J. A.;Timmermans, K. R.; Wolterbeek, H. T.; de Baar, H. J. W.Mar. Chem.2005, 93, 119.
(22) Emmenegger, L.; Schonenberger, R. R.; Sigg, L.; Sulzberger, B.Limnol. Oceanogr. 2001, 46, 49.
(23) Toole, D. A.; Slezak, D.; Kiene, R. P.; Kieber, D. J.; Siegel, D. A.Deep-Sea Res., Part I2006, 53, 136.
(24) Boehme, J.; Coble, P.; Conmy, R.; Stovall-Leonard, A.Mar. Chem.2004, 89, 3.
(25) Stedmon, C. A.; Markager, S.; Bro, R.Mar. Chem.2003, 82, 239.(26) Twardowski, M. S.; Lewis, M. R.; Barnard, A. H.; Zaneveld, J. R.
V. In Remote Sensing of Coastal Aquatic EnVironments; Miller, R.L., Del Castillo, C. E., McKee, B. A., Eds.; Springer: Dordrecht,The Netherlands, 2005; Vol. 7.
(27) Brown, C. W.; Connor, L. N.; Lillibridge, J. L.; Nalli, N. R.; Legeckis,R. V. In Remote Sensing of Coastal and Aquatic EnVironments;Miller, R. L., Del Castillo, C. E., McKee, B. A., Eds.; Springer:Dordrecht, The Netherlands, 2005.
(28) Arnone, R. A.; Parsons, A. R. InRemote Sensing of Coastal AquaticEnVironments; Miller, R. L., Del Castillo, C. E., McKee, B. A., Eds.;Springer: Dordrecht, The Netherlands, 2005; Vol. 7.
(29) Chang, G.; Mahoney, K.; Briggs-Whitmire, A.; Kohler, D. D. R.;Mobley, C. D.; Lewis, M.; Moline, M. A.; Boss, E.; Kim, M.; Philpot,W.; Dickey, T. D.Oceanography2004, 17, 17.
(30) Dickey, T. D.Oceanography2004, 17, 9.(31) Del Vecchio, R.; Blough, N. V.Mar. Chem.2004, 89, 169.(32) Bricaud, A.; Morel, A.; Prieur, L.Limnol. Oceanogr. 1981, 26, 43.(33) Del Castillo, C. E.; Coble, P. G.; Morell, J. M.; Lopez, J. M.;
Corredor, J. E.Mar. Chem.1999, 66, 35.(34) Stedmon, C. A.; Markager, S.; Kaas, H.Estuarine, Coastal Shelf
Sci.2000, 51, 267.(35) Twardowski, M. S.; Boss, E.; Sullivan, J. M.; Donaghay, P. L.Mar.
Chem.2004, 89, 69.(36) Vodacek, A.; Blough, N. V.; DeGranpre, M. D.; Peltzer, E. T.;
Nelson, R. K.Limnol. Oceanogr. 1997, 40, 411.(37) Conmy, R. N.; Coble, P. G.; Chen, R. F.; Gardner, G. B.Mar. Chem.
2004, 89, 127.(38) Duursma, E. K. InOptical Aspects of Oceanography; Jerlov, N. G.,
Nielsen, E. S., Eds.; Academic Press: New York, 1974.(39) Hoge, F. E.; Vodacek, A.; Blough, N. V.Limnol. Oceanogr. 1993,
38, 1394.(40) Ferrari, G. M.; Tassan, S.Int. J. Remote Sens.1992, 13.(41) Coble, P.; Green, S.; Blough, N. V.; Gagosian, R. B.Nature1990,
348, 432.(42) Cabaniss, S. E.; Shuman, M. S.Mar. Chem.1987, 21, 37.(43) Coble, P. G.; Del Castillo, C. E.; Avril, B.Deep-Sea Res., Part II
1998, 45, 2195.(44) Coble, P. G.; Schultz, C. A.; Mopper, K.Mar. Chem.1993, 41, 173.(45) Coble, P. G.Mar. Chem.1996, 51, 325.(46) Mopper, K.; Schultz, C. A.Mar. Chem.1993, 41, 229.(47) Parlanti, E.; Worz, K.; Geoffroy, L.; Lamotte, M.Org. Geochem.
2000, 31, 1765.(48) Sierra, M. M. D.; Giovanela, M.; Parlanti, E.; Soriano-Sierra, E. J.
Chemosphere2005, 58, 715.(49) Stedmon, C. A.; Markager, S.Limnol. Oceanogr. 2005, 50, 686.(50) De Souza-Sierra, M. M.; Donard, O. F. X.; Lamotte, M.Mar. Chem.
1997, 58, 51.(51) Del Castillo, C. E. Optical characteristics of the colored dissolved
organic matter in the eastern Caribbean, West Florida Shelf and theArabian Sea: relationship between chemical characteristics andoptical response, Ph.D. Thesis, University of South Florida, St.Petersburg, FL, 1998.
(52) Stramski, D.; Boss, E.; Bogucki, D.; Voss, K. J.Prog. Oceanogr.2004, 61, 27.
(53) Gregg, W. W.; Casey, N. W.Remote Sens. EnViron. 2004, 93, 463.(54) Roesler, C. S.; Perry, M. J.Limnol. Oceanogr.1989, 34, 1510.(55) Balch, W. M.; Drapeau, D. T.; Bowler, B. C.; Booth, E. S.; Goes, J.
I.; Ashe, A.; Frye, J. M.Prog. Oceanogr.2004, 63, 57.(56) Babin, M.; Stramski, D.; Ferrari, G. M.; Claustre, H.; Bricaud, A.;
Obolensky, G.; Hoepffner, N.J. Geophys. Res.2003, 108, 3211,doi: 10.1029/2001JC000882.
(57) Bowers, D. G.; Binding, C. E.Estuarine, Coastal Shelf Sci.2006,67, 219.
(58) Gallegos, C. L.Estuarine, Coastal Shelf Sci.2005, 63, 57.(59) Belzile, C.; Roesler, C. S.; Christensen, J. P.; Shakhova, N.;
Semiletov, I.Estuarine, Coastal Shelf Sci.2006, 67, 441.(60) Belzile, C.; Guo, L.Mar. Chem.2006, 98, 183.(61) Stuermer, D. H.; Harvey, G. R.Nature1974, 250, 480.(62) Hatcher, P. G.; Rowan, R.; Mattingly, M. A.Org. Geochem.1980,
2, 77.(63) Wilson, M. A.; Barron, P. F.; Gillam, A. H.Geochim. Cosmochim.
Acta 1981, 45, 1743.
(64) Ertel, J. R.; Hedges, J. I. Bulk Chemical and Spectroscopic Propertiesof Marine and Terrestrial Humic Acids, Malanoidins, and Catechol-Based Synthetic Polymers. InAquatic and Terrestrial HumicMaterials; Christman, R. F., Gjessing, E. T., Eds., Ann Arbor Science:Ann Arbor, MI, 1983; pp 143-163.
(65) Harvey, G. R.; Boran, D. A.; Chesal, L. A.; Tokar, J. M.Mar. Chem.1983, 12, 119.
(66) Diebel-Langohr, D.; Doerffer, R.; Reuter, R.; Dorre, F.; Hengster-mann, T. Long Term Stability of Gelbstoff Concerning Its OpticalProperties, Appendix 6. The influence of yellow substances on remotesensing of sea water constituents from space. Report of ESA ContractNo. RFQ-3-5060/84/NL/MD, GKSS Research Centre, Geesthacht,Germany. 1986.
(67) Oden, S.Kolloidchem. Beih.1919, 11, 75.(68) Hedges, J. I.; Hatcher, P. G.; Ertel, J. R.; Meyers-Schulte, K. J.
Geochim. Cosmochim. Acta1992, 56, 1753.(69) Hedges, J. I.Compositional Indicators of Organic Acid Sources and
Reactions in Natural EnVironments; John Wiley & Sons Ltd.: WestSussex, U.K., 1992.
(70) Thurman, E. M.Organic Geochemistry of Natural Waters; Niehoff& Junk: Dordrecht, The Netherlands, 1985.
(71) Harvey, G. R.; Boran, D. A.Geochemistry of Humic Substances inSeawater; John Wiley & Sons: New York, 1985.
(72) Mayer, L. M.; Schick, L. L.; Loder, T. C., IIIMar. Chem.1999, 64,171.
(73) Yamashita, Y.; Tanoue, E.Mar. Chem.2003, 82, 255.(74) Boehme, J.; Wells, M.Mar. Chem., in press.(75) Parlanti, E.; Morin, B.; Vacher, L.Org. Geochem.2002, 33, 221.(76) Kujawinski, E. B.; Del Vecchio, R.; Blough, N. V.; Klein, G. C.;
Marshall, A. G.Mar. Chem.2004, 92, 23.(77) Del Vecchio, R.; Blough, N. V.EnViron. Sci. Technol.2004, 38,
3885.(78) Repeta, D. J.; Hartman, N. T.; John, S.; Jones, A. D.; Goericke, R.
EnViron. Sci. Technol.2004, 38, 5373.(79) Prahl, F. G.; Coble, P. G.Input and BehaVior of DissolVed Organic
Carbon in the Columbia RiVer Estuary; Olsen and Olsen: Fredens-borg, Denmark, 1994.
(80) Boss, E.; Pegau, W. S.; Zaneveld, J. R. V.; Barnard, A. H.J. Geophys.Res., [Oceans]2001, 106, 9499.
(81) Hitchcock, G. L.; Chen, R. F.; Gardner, G. B.; Wiseman, J. W. J.Mar. Chem.2004, 89, 225.
(82) Alberts, J. J.; Takas, M.; Schalles, J.Estuaries2004, 27, 296.(83) Rochelle-Newall, E. J.; Fisher, T. R.Mar. Chem.2002, 77, 7.(84) Cannizzaro, J. P.; Carder, K. L.Remote Sens. EnViron. 2006, 101,
13.(85) Etheridge, S. M.; Roesler, C. S.Harmful Algae2004, 3, 331.(86) Steinberg, D. K.; Nelson, N. B.; Carlson, C. A.; Prusak, A. C.Mar.
Ecol. Prog. Ser.2004, 267, 45.(87) Vernet, M.; Whitehead, K.Mar. Biol. 1996, 127, 35.(88) Whitehead, K.; Vernet, M.Limnol. Oceanogr.2000, 45, 1788.(89) Subramaniam, A.; Brown, C. W.; Hood, R. R.; Carpenter, E. J.;
Capone, D. G.Deep-Sea Res., Part II2001, 49, 107.(90) Shick, J. M.; Dunlap, W. C.Annu. ReV. Physiol.2002, 64, 223.(91) Nelson, N. B.; Siegel, D. A.; Michaels, A. F.Deep-Sea Res.1998,
45, 931.(92) Nelson, N. B.; Carlson, C. A.; Steinberg, D. K.Mar. Chem.2004,
89, 273.(93) Sasaki, H.; Miyamura, T.; Saitoh, S.-i.; Ishizaka, J.Estuarine, Coastal
Shelf Sci.2005, 64, 447.(94) Hu, C.; Muller-Karger, F. E.; Swarzenski, P. W.Geophys. Res. Lett.
2006, 33, L11601, doi: 10.1029/2005GL025449.(95) Boss, E.; Zaneveld, J. R. V.Limnol. Oceanogr.2003, 48, 346.(96) Otis, D. B.; Carder, K. L.; English, D. C.; Ivey, J. E.Coral Reefs
2004, 23, 152.(97) Muller-Karger, F. E.; Hu, C.; Andrefouet, S.; Varela, R.; Thunell,
R. The Color of the Coastal Ocean and Applications in the Solutionof Research and Management Problems; Springer: Dordrecht, TheNetherlands, 2005.
(98) Komada, T.; Schofield, O. M. E.; Reimers, C. E.Mar. Chem.2002,79, 81.
(99) Komada, T.; Reimers, C. E.; Luther, G. W. I.; Burdige, D. J.Geochim.Cosmochim. Acta2004, 68, 4099.
(100) Burdige, D. J.; Kline, S. W.; Chen, W.Mar. Chem.2004, 89, 289.(101) Mopper, K.; Kieber, D. J.Marine Photochemistry and Its Impact on
Carbon Cycling; Cambridge University Press: Cambridge, U.K.,2000.
(102) Moran, M. A.; Sheldon, W. M. J.; Zepp, R. G.Limnol. Oceanogr.2000, 45, 1254.
(103) Boyd, T. J.; Osburn, C. L.Mar. Chem.2004, 89, 189.(104) Miller, W. L.; Moran, M. A.Limnol. Oceanogr. 1997, 42, 1317.(105) Moran, M. A.; Zepp, R. G.UV Radiation Effects on Microbes and
Microbial Processes; Wiles-Liss: New York, 2000.
Marine Optical Biogeochemistry Chemical Reviews, 2007, Vol. 107, No. 2 417
(106) Mopper, K.; Kieber, D. J.Photochemistry and the Cycling of Carbon,Sulfur, Nitrogen and Phosphorous; Academic Press: San Diego, CA,2002.
(107) Vahatalo, A. V.; Wetzel, R. G.Mar. Chem.2004, 89, 313.(108) Obernosterer, I.; Benner, R.Limnol. Oceanogr. 2004, 49, 117.(109) Stedmon, C. A.; Markager, S.Limnol. Oceanogr.2005, 50, 1415.(110) Kudela, R. M.; Chavez, F. P.Deep-Sea Res., Part II2004, 51, 1173.(111) Hong, H.; Wu, J.; Shang, S.; Hu, C.Mar. Chem.2005, 97, 78.(112) Callahan, J.; Dai, M.; Chen, R. F.; Li, X.; Lu, Z.; Huang, W.Mar.
Chem.2004, 89, 211.(113) Gueguen, C.; Guo, L.; Tanaka, N.Cont. Shelf Res.2005, 25, 1195.(114) Gueguen, C.; Guo, L.; Wang, D.; Tanaka, N.; Hung, C.-C.Bio-
geochemistry2006, 77, 139.(115) Amon, R. M. W.; Budeus, G.; Meon, B.J. Geophys. Res.2003, 108,
3221, doi: 10.1029/2002JC001594.(116) Nelson, N. B.; Siegel, D. A.; Carlson, C. A.; Swan, C.; W. M.
Smethie, J. manuscript in preparation, 2006.(117) Hayase, K.; Tsubota, H.; Sunada, I.Mar. Chem.1988, 25, 373.(118) Hayase, K.; Yamamoto, M.; Tsubota, H.Mar. Chem.1987, 20, 265.(119) Ivanoff, M. A.C. R. Acad. Sci. (Paris)1962, 254, 4190.(120) Chen, R. F.; Bada, J. L.Geophys. Res. Lett.1989, 16, 687.(121) Chen, R. F.; Bada, J. L.Mar. Chem.1992, 37, 191.(122) Hayase, K.; Shinozuka, N.Mar. Chem.1995, 48, 283.(123) Bricaud, A.; Roesler, C. S.; Parslow, J. S.; Ishizaka, J.Deep-Sea
Res., Part II2002, 49, 2583.(124) Siegel, D. A.; Michaels, A. F.Deep-Sea Res., Part II1996, 43, 321.(125) Nelson, N. B.; Siegel, D. A.; Michaels, A. F.Deep-Sea Res., Part I
1998, 45, 931.(126) Muller-Karger, F. E.Gulf of Mexico Sci.2000, 18, 55.(127) Del Castillo, C. E.; Coble, P. G.; Conmy, R. N.; Muller-Karger, F.
E.; Vanderbloemen, L.; Vargo, G. A.Limnol. Oceanogr.2001, 46,1836.
(128) Hu, C.; Muller-Karger, F. E.; Biggs, D. C.; Carder, K. L.; Nababan,B.; Nadeau, D.; Vanderbloemen, J.Int. J. Remote Sens.2003, 24,2597.
(129) Hu, C.; Nelson, J. R.; Johns, E.; Chen, Z.; Weisberg, R. H.; Muller-Karger, F. E.Geophys. Res. Lett.2005, 32, L14606, doi: 10.1029/2005GL022942.
(130) Walker, N. D.; Fargion, G. S.; Rouse, L. J.; Biggs., D. C.EOS Trans.Am. Geophys. Union1994, 75, 409.
(131) Ortner, P. B.; Lee, T. N.; Milne, P. J.; Zika, R. G.; Clarke, E.; Podesta,G.; Swart, P. K.; Tester, P. A.; Atkinson, L. P.; Johnson, W. R.J.Geophys. Res.1995, 100, 13.
(132) Hu, C. Personal communication.(133) Clark, C. D.; Hiscock, W. T.; Millero, F. J.; Hitchcock, G.; Brand,
L.; Miller, W. L.; Ziolkowski, L.; Chen, R. F.; Zika, R. G.Mar.Chem.2004, 89, 145.
(134) Chen, R. F.; Gardner, G. B.Mar. Chem.2004, 89, 103.(135) Chen, R. F.; Bissett, P.; Coble, P.; Conmy, R.; Gardner, G. B.; Moran,
M. A.; Wang, X.; Wells, M. L.; Whelan, P.; Zepp, R. G.Mar. Chem.2004, 89, 257.
(136) Stovall-Leonard, A. Characterization of CDOM for the Study ofCarbon Cycling in Aquatic Systems. M.S. Thesis, University of SouthFlorida, St. Petersburg. 2003.
(137) Coble, P.; Hu, C.; Gould, R. W. J.; Chang, G.; Wood, A. M.Oceanography2004, 17, 50.
(138) Hu, C.; Hackett, K. E.; Callahan, M. K.; Andrefouet, S.; Wheaton,J. L.; Porter, J. W.; Muller-Karger, F. E.Geophys. Res. Lett.2003,30, 1151, doi: 10.1029/2002GL016479.
(139) SWFDOGEOS Trans. AGU2002, 83, 281.(140) Hu, C.; Muller-Karger, F. E.; Taylor, C.; Carder, K. L.; Kelble, C.;
Johns, E.; Heil, C. A.Remote Sens. EnViron. 2005, 97, 311.(141) Zanardi-Lamardo, E.; Moore, C. A.; Zika, R. G.Mar. Chem.2004,
89, 37.(142) Stabenau, E. R.; Zika, R. G.Mar. Chem.2004, 89, 55.(143) Gardner, G. B.; Chen, R. F.; Berry, A.Mar. Chem.2005, 96, 137.(144) Conmy, R. N.; Coble, P. G.; Castillo, C. E. D.Cont. Shelf Res.2004,
24, 431.(145) Machado, A. A. S. C.; Silva, J. C. G. E. d.Chemom. Intell. Lab.
Syst.1993, 19, 155.(146) Persson, T.; Wedborg, M.Anal. Chim. Acta2001, 434, 179.(147) Sierra, M. M. D.; Donard, O. F. X.; Lamotte, M.; Belin, C.; Ewald,
M. Mar. Chem.1994, 47, 127.(148) Her, N.; Amy, G.; McKnight, D.; Sohn, J.; Yoon, Y.Water Res.
2003, 37, 4295.(149) Stedmon, C. A.; Markager, Limnol, S.Oceanogr.2005, 50, 686.(150) Kowalczuk, P.; Ston-Egiert, J.; Cooper, W. J.; Whitehead, R. F.;
Durako, M. J.Mar. Chem.2005, 96, 273.(151) Blough, N. V.; Zafiriou, O. C.; Bonilla, J.J. Geophys. Res., [Oceans]
1993, 98, 2271.(152) Hansell, D. A. InBiogeochemistry of Marine DissolVed Organic
Matter; Hansell, D. A., Carlson, C. A., Eds.; Academic Press:Amsterdam, 2002.
CR050350+
418 Chemical Reviews, 2007, Vol. 107, No. 2 Coble


