
University of Nebraska - LincolnDigitalCommons@University of Nebraska - Lincoln
Library Philosophy and Practice (e-journal) Libraries at University of Nebraska-Lincoln
Summer 4-15-2019
Mapping of Research Productivity onNanotechnology in Canada: A ScientometricProfileChandran VelmuruganResearch Scholar, Periyar University, Salem, [email protected]
Follow this and additional works at: https://digitalcommons.unl.edu/libphilprac
Part of the Library and Information Science Commons
Velmurugan, Chandran, "Mapping of Research Productivity on Nanotechnology in Canada: A Scientometric Profile" (2019). LibraryPhilosophy and Practice (e-journal). 2450.https://digitalcommons.unl.edu/libphilprac/2450

Mapping of Research Productivity on Nanotechnology in Canada: A
Scientometric Profile
Dr. Chandran Velmurugan*
*Researcher
Department of Library and Information Science, Periyar University,
Salem- 636 011, Tamilnadu, India
Email: [email protected]
Abstract
A scientometric assessment of the scientific publications has been considered in this
analysis by examining annual growth rate of publications, collaborative countries and
territories, preferred subject areas and research work, prolific organizations and institutions
and top ranked journals and highly productive papers etc. This paper focus on the literature
growth and development in Nanotechnology in Canada as reflected in web of science data
database. During the period between 1994 and 2014, a total 576 scientific research papers
along with cited references are 34955 were published in the field in Canada. The average
number of literature output were published per year was 33.88 and the greatest number of
publications were published in 2013 and 2014 respectively a total number of authors 2213 were
identified and the maximum number of authors i.e. 364 and the mean value of 4.77 were in the
year 2014. Out of 15804 citations, the greatest number of 2791 citations in the year 2008 (52
papers, 23 h-index) and highest average citation per paper were 60.74 in the year 2007. From
this study, researchers, scientists, subject specialists, students, administrators, policy makers,
academicians, Library and Information Science professionals and faculty members will be
benefited due to the scientific and effective investigation.
Keywords: Nanotechnology, publication analysis, bibliometrics, citation analysis, RGR, DT,
DC, collaborative research, Canadian research.
Introduction
Nanotechnology is an emerging thrust area in the research world and it is a growing
interdisciplinary technology. Nanotechnology is progressively enticing universal attention on
account of its wide range of end-uses. In the last two decades, the publication analysis has been
drastically expanded as researchers and eminent scholars have experienced with significant
growth and development of nanotechnology research in Canada. A number of studies have been
carried out by scientists and identified that Canada is listed one of the top ranked countries
publishing nanotechnology peer-reviewed journal articles (Rosei, 2008; Yegul; Yavuz & Guild
2008; Beaudry & Schiffauerova 2011).
This study tries to investigate the growth pattern of publication in terms of articles,
review, editorial material, proceedings paper, meeting abstract, review as book chapter, letter,
and article as book chapter, book review and note etc. in other words, it also analyses the various
factors such as authors and co- authorship pattern, collaborative research trends, single authors as
well as joint authors relationship, citation based analysis, institution and geographical wise
production, subject wise and research area based study and funding agency. This present study is
aimed to explore the research gap by mapping the scientific publications in the developing field
of nanotechnology in Canada. It is anticipated that this study will support and help to user
community to understand the amount of technology transfer between Canada and other countries
in the discipline of nanotechnology.
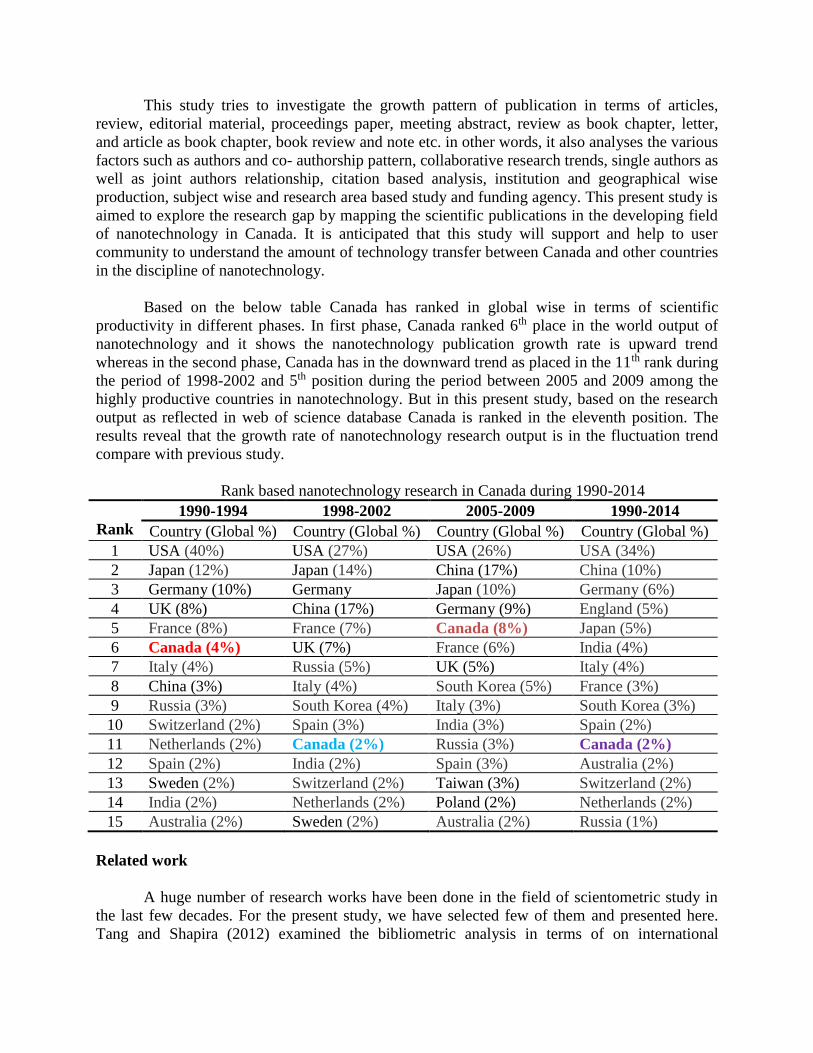
Based on the below table Canada has ranked in global wise in terms of scientific
productivity in different phases. In first phase, Canada ranked 6th place in the world output of
nanotechnology and it shows the nanotechnology publication growth rate is upward trend
whereas in the second phase, Canada has in the downward trend as placed in the 11th rank during
the period of 1998-2002 and 5th position during the period between 2005 and 2009 among the
highly productive countries in nanotechnology. But in this present study, based on the research
output as reflected in web of science database Canada is ranked in the eleventh position. The
results reveal that the growth rate of nanotechnology research output is in the fluctuation trend
compare with previous study.
Rank based nanotechnology research in Canada during 1990-2014
Rank
1990-1994 1998-2002 2005-2009 1990-2014
Country (Global %) Country (Global %) Country (Global %) Country (Global %)
1 USA (40%) USA (27%) USA (26%) USA (34%)
2 Japan (12%) Japan (14%) China (17%) China (10%)
3 Germany (10%) Germany Japan (10%) Germany (6%)
4 UK (8%) China (17%) Germany (9%) England (5%)
5 France (8%) France (7%) Canada (8%) Japan (5%)
6 Canada (4%) UK (7%) France (6%) India (4%)
7 Italy (4%) Russia (5%) UK (5%) Italy (4%)
8 China (3%) Italy (4%) South Korea (5%) France (3%)
9 Russia (3%) South Korea (4%) Italy (3%) South Korea (3%)
10 Switzerland (2%) Spain (3%) India (3%) Spain (2%)
11 Netherlands (2%) Canada (2%) Russia (3%) Canada (2%)
12 Spain (2%) India (2%) Spain (3%) Australia (2%)
13 Sweden (2%) Switzerland (2%) Taiwan (3%) Switzerland (2%)
14 India (2%) Netherlands (2%) Poland (2%) Netherlands (2%)
15 Australia (2%) Sweden (2%) Australia (2%) Russia (1%)
Related work
A huge number of research works have been done in the field of scientometric study in
the last few decades. For the present study, we have selected few of them and presented here.
Tang and Shapira (2012) examined the bibliometric analysis in terms of on international
collaboration and knowledge moderation on China’s nanotechnology, Heinze, et al (2007)
carried out and identified the research results on nanotechnology and human genetics, Kostoff, et
al (2006) found the structure and infrastructure of the global nanotechnology research output,
Lee (2006) investigated the nanotechnology patent and followed by Youtie; Shapira and Porter
(2008) analyzed the research papers and citations on nanotechnology. Aytac (2010) studied with
G7 countries such as franc, Germany, Italy, Japan, UK, USA, and Canada and the results show
that based on the scientific collaboration in terms of scientific publications the co-authorship
relationship growth rate was progressively increased during the period of 1990-2006. Hu; Carley
& Tang (2012) described the study based on the publication activity on nanotechnology during
1990-2009. Garousi & Varma (2012) have identified the top ranked institutions such as
University of Waterloo by two metrics and Queen’s University’s by one metric on Canadian
Electrical and Computer Engineering Institutions based on IEEE Journal Publications during the
period 1996 -2006.
To add strength of this paper, we have taken into account few of the authors’ previous
studies in various discipline as well as individual journal of scientometric analysis in different
period of study for the present analysis such as Research analysis on Biotechnology by
Velmurugan and Radhakrishnan (2015), Journal of Information Literacy by Velmurugan and
Radhakrishnan (2015), Quantitative Analysis of Scientific Publications Output on Engineering
Journal by Velmurugan and Radhakrishnan (2015), Literature output of Supply Chain
Management by Velmurugan and Radhakrishnan (2015), Authorship trends and collaborative
research work on Library Herald by Velmurugan and Radhakrishnan (2015), Scientometric
Analysis of Research Papers on Pharmacognosy as reflected in the Web of Science by
Velmurugan and Radhakrishnan (2015), Journal of Intellectual Property rights by Velmurugan
(2013, 2014), Annals of Library and Information Studies for the year 2007-2012 by Velmurugan
(2013) Indian Journal of Pure and Applied Physics for the Year 2009 – 2012 by Velmurugan
(2014), Technical Review Journal by Velmurugan (2014).
Objectives
The main purpose of the scientometric analysis on nanotechnology in Canada is to evaluate
the growth pattern of Nanotechnology in terms of year wise, citation wise and author wise
publications with mean value and the other objectives are as follows:
• To know different types of document during the period
• To identify the highly cited Institutions with h-index
• To trace the country wise highly cited production
• To depict the highly cited papers and rank based cited references
• To illustrate the top ranked authors with h-index
• To examine the top ranked research areas, subject and source wise distribution
• To measure the degree of collaboration (DC), relative growth rate (RGR) and doubling
time (DT) in nanotechnology research
Materials and Methods
To retrieve the appropriate source data, given a select keyword i.e. nanotechnology, and
then the documents were identified in Science Citation Index- Expanded, social science Citation
Index, Arts & Humanities Citation Index and ESCI by dint of Web of Science. The research has
limited by searching the term ‘Nanotechnology’ as the topic and refined by countries /territories
as Canada via WoS. A total number of 576 scientific publications with 245 total local citation
score and 15804 total global citation score for the period between 1989 and 2014. The data
include articles, review, editorial material, proceedings paper, meeting abstract, and review as
book chapter, letter, and article as book chapter, book review and note. This scientometric study
is carried out in the month of November 2015. The download data was transferred to Excel
spreadsheet for further statistical analysis and also used the vos viewer visualization software to
screenshot the publication. Further, to evaluate the research output, the relative growth rate and
the doubling time and K. Subramanyam’s degree of collaboration have been used to determine
and extent the growth of publication trend during the study period.
Relative growth rate (RGR)
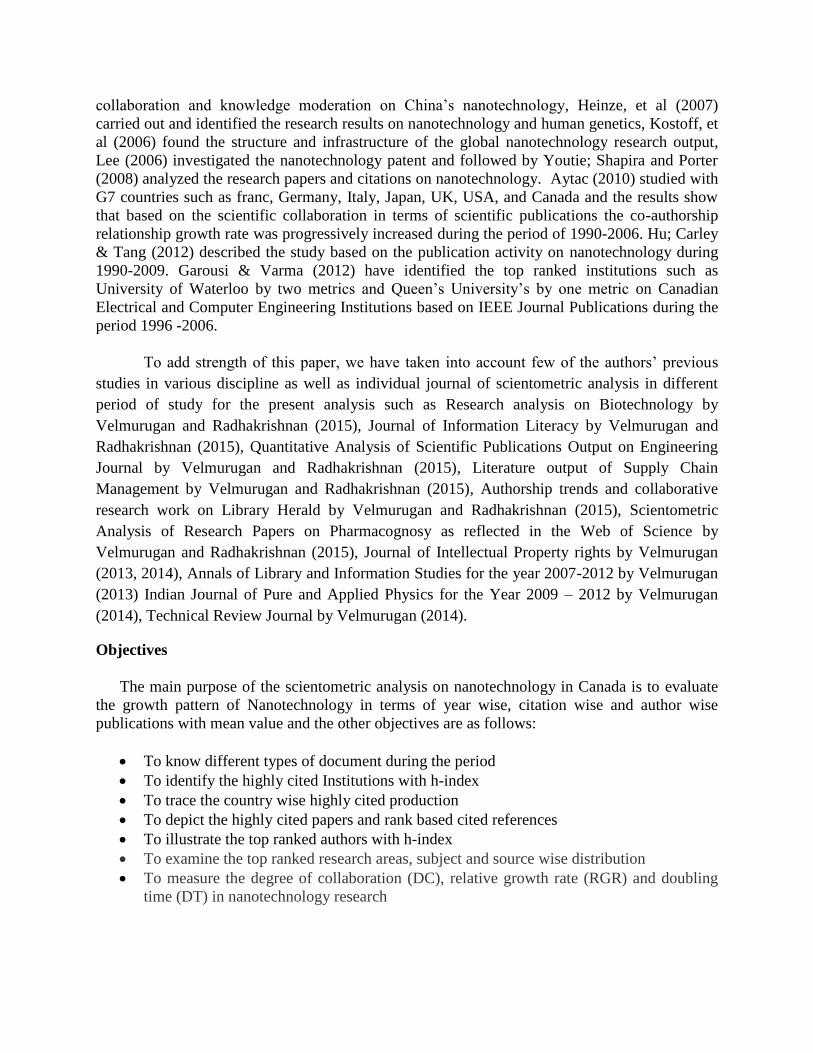
The relative growth rate (RGR) is the increase in the number of research
publications/pages per unit of time. The relative growth rate and the doubling time models have
developed by Garg and Padhi in the year 1999 to measure the publications. The growth rate of
total research output published by faculty members from Periyar University has been evaluated
as per the following equation.
Where, R (a) = Relative Growth Rate over the specific period of interval, w1= logw1
(Natural log of initial number of publications), w2= log w2 (Natural log of final number of
publications), T2- T1 = Unit difference between the initial and final time R (a) = per unit of
publications per unit of time (Year).
Doubling Time (DT)
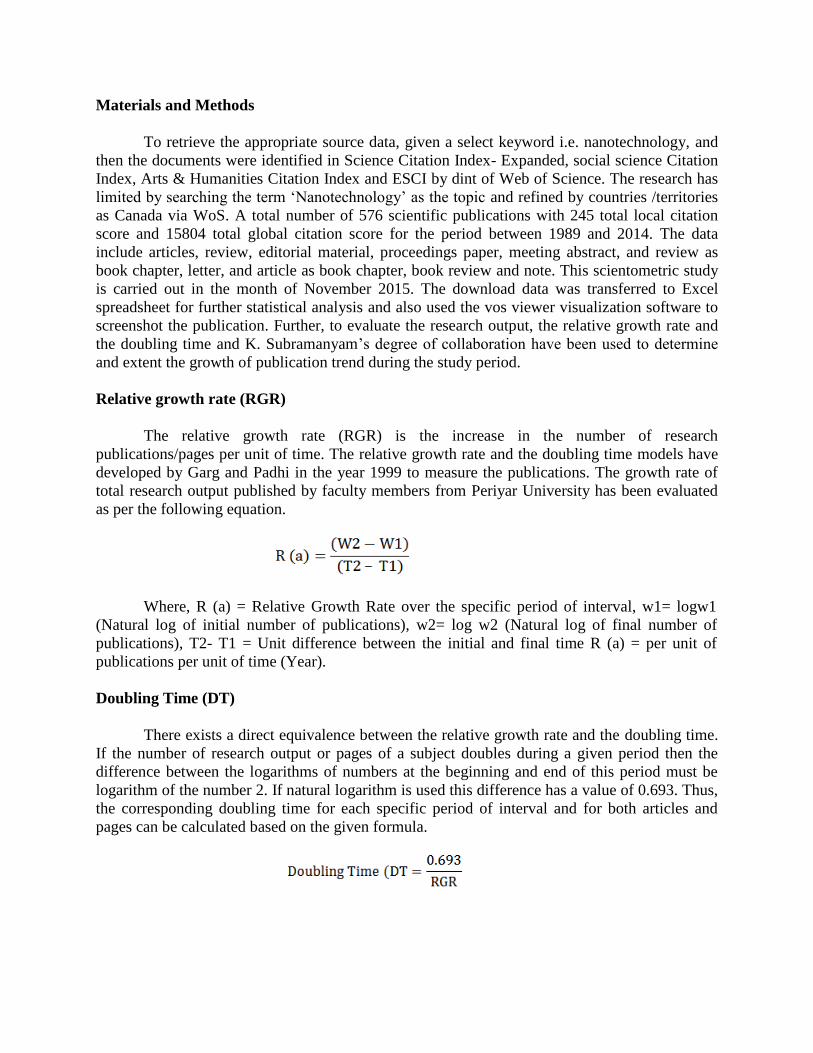
There exists a direct equivalence between the relative growth rate and the doubling time.
If the number of research output or pages of a subject doubles during a given period then the
difference between the logarithms of numbers at the beginning and end of this period must be
logarithm of the number 2. If natural logarithm is used this difference has a value of 0.693. Thus,
the corresponding doubling time for each specific period of interval and for both articles and
pages can be calculated based on the given formula.
K. Subramanyam’s degree of collaboration
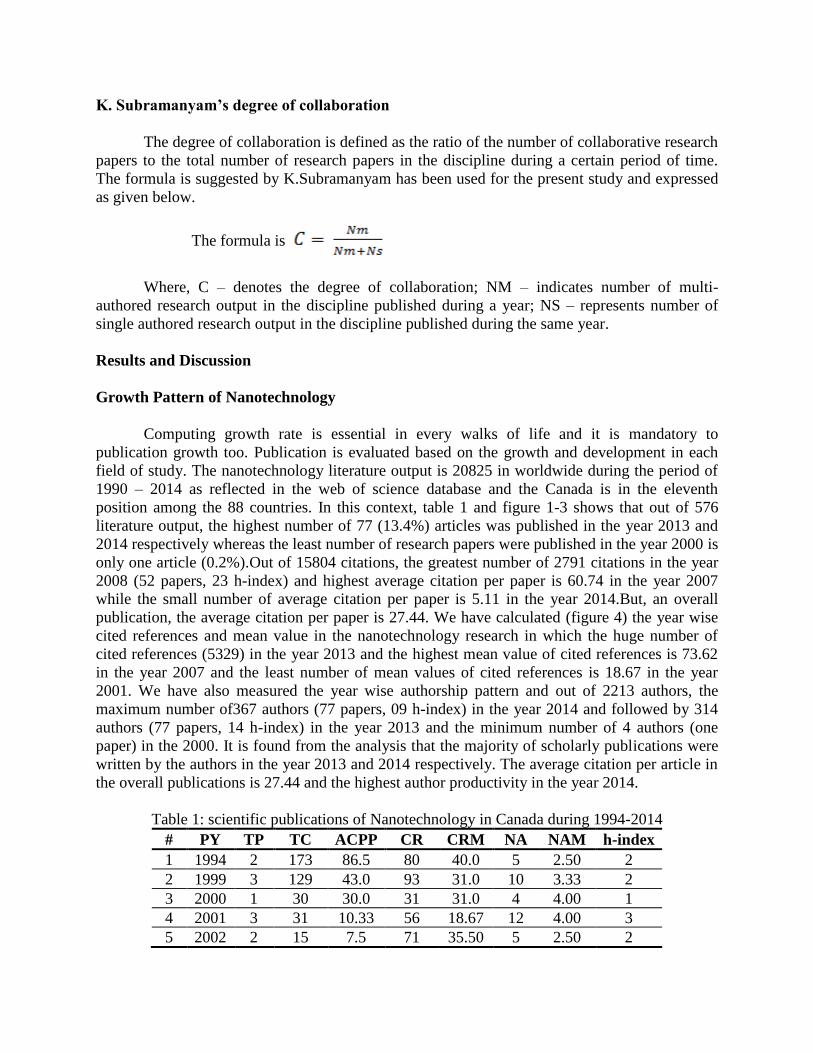
The degree of collaboration is defined as the ratio of the number of collaborative research
papers to the total number of research papers in the discipline during a certain period of time.
The formula is suggested by K.Subramanyam has been used for the present study and expressed
as given below.
The formula is
Where, C – denotes the degree of collaboration; NM – indicates number of multi-
authored research output in the discipline published during a year; NS – represents number of
single authored research output in the discipline published during the same year.
Results and Discussion
Growth Pattern of Nanotechnology
Computing growth rate is essential in every walks of life and it is mandatory to
publication growth too. Publication is evaluated based on the growth and development in each
field of study. The nanotechnology literature output is 20825 in worldwide during the period of
1990 – 2014 as reflected in the web of science database and the Canada is in the eleventh
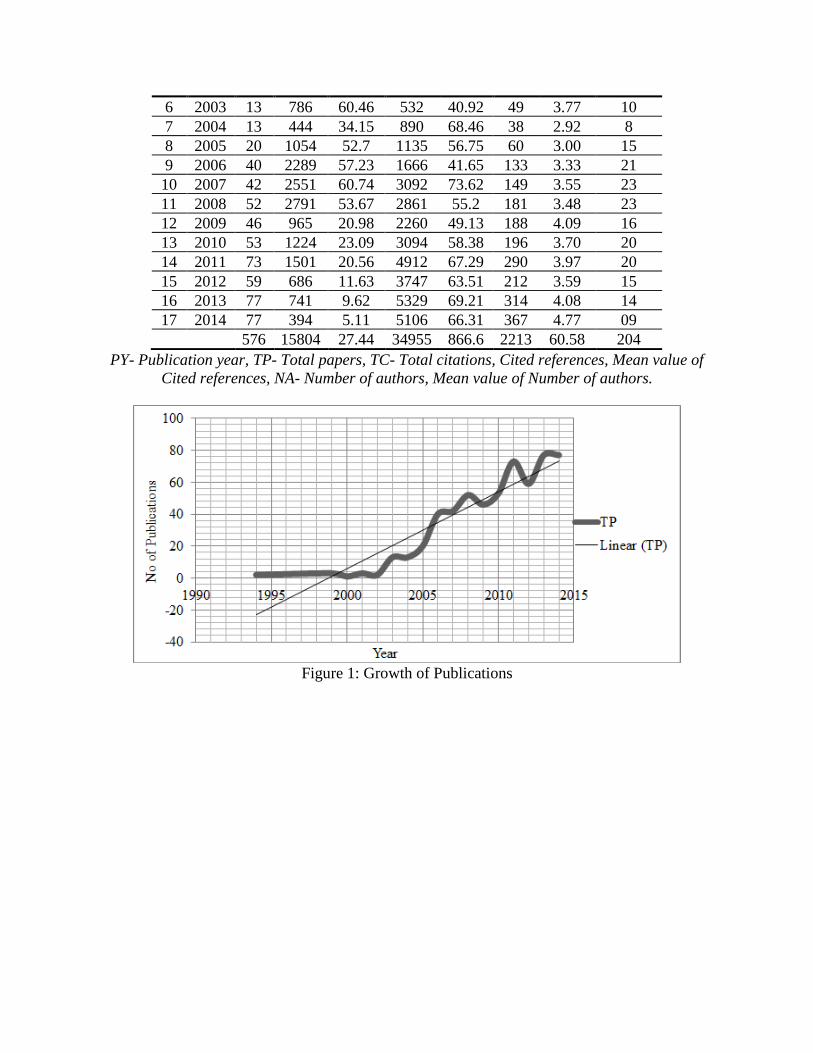
position among the 88 countries. In this context, table 1 and figure 1-3 shows that out of 576
literature output, the highest number of 77 (13.4%) articles was published in the year 2013 and
2014 respectively whereas the least number of research papers were published in the year 2000 is
only one article (0.2%).Out of 15804 citations, the greatest number of 2791 citations in the year
2008 (52 papers, 23 h-index) and highest average citation per paper is 60.74 in the year 2007
while the small number of average citation per paper is 5.11 in the year 2014.But, an overall
publication, the average citation per paper is 27.44. We have calculated (figure 4) the year wise
cited references and mean value in the nanotechnology research in which the huge number of
cited references (5329) in the year 2013 and the highest mean value of cited references is 73.62
in the year 2007 and the least number of mean values of cited references is 18.67 in the year
2001. We have also measured the year wise authorship pattern and out of 2213 authors, the
maximum number of367 authors (77 papers, 09 h-index) in the year 2014 and followed by 314
authors (77 papers, 14 h-index) in the year 2013 and the minimum number of 4 authors (one
paper) in the 2000. It is found from the analysis that the majority of scholarly publications were
written by the authors in the year 2013 and 2014 respectively. The average citation per article in
the overall publications is 27.44 and the highest author productivity in the year 2014.
Table 1: scientific publications of Nanotechnology in Canada during 1994-2014
# PY TP TC ACPP CR CRM NA NAM h-index
1 1994 2 173 86.5 80 40.0 5 2.50 2
2 1999 3 129 43.0 93 31.0 10 3.33 2
3 2000 1 30 30.0 31 31.0 4 4.00 1
4 2001 3 31 10.33 56 18.67 12 4.00 3
5 2002 2 15 7.5 71 35.50 5 2.50 2
6 2003 13 786 60.46 532 40.92 49 3.77 10
7 2004 13 444 34.15 890 68.46 38 2.92 8
8 2005 20 1054 52.7 1135 56.75 60 3.00 15
9 2006 40 2289 57.23 1666 41.65 133 3.33 21
10 2007 42 2551 60.74 3092 73.62 149 3.55 23
11 2008 52 2791 53.67 2861 55.2 181 3.48 23
12 2009 46 965 20.98 2260 49.13 188 4.09 16
13 2010 53 1224 23.09 3094 58.38 196 3.70 20
14 2011 73 1501 20.56 4912 67.29 290 3.97 20
15 2012 59 686 11.63 3747 63.51 212 3.59 15
16 2013 77 741 9.62 5329 69.21 314 4.08 14
17 2014 77 394 5.11 5106 66.31 367 4.77 09
576 15804 27.44 34955 866.6 2213 60.58 204
PY- Publication year, TP- Total papers, TC- Total citations, Cited references, Mean value of
Cited references, NA- Number of authors, Mean value of Number of authors.
Figure 1: Growth of Publications
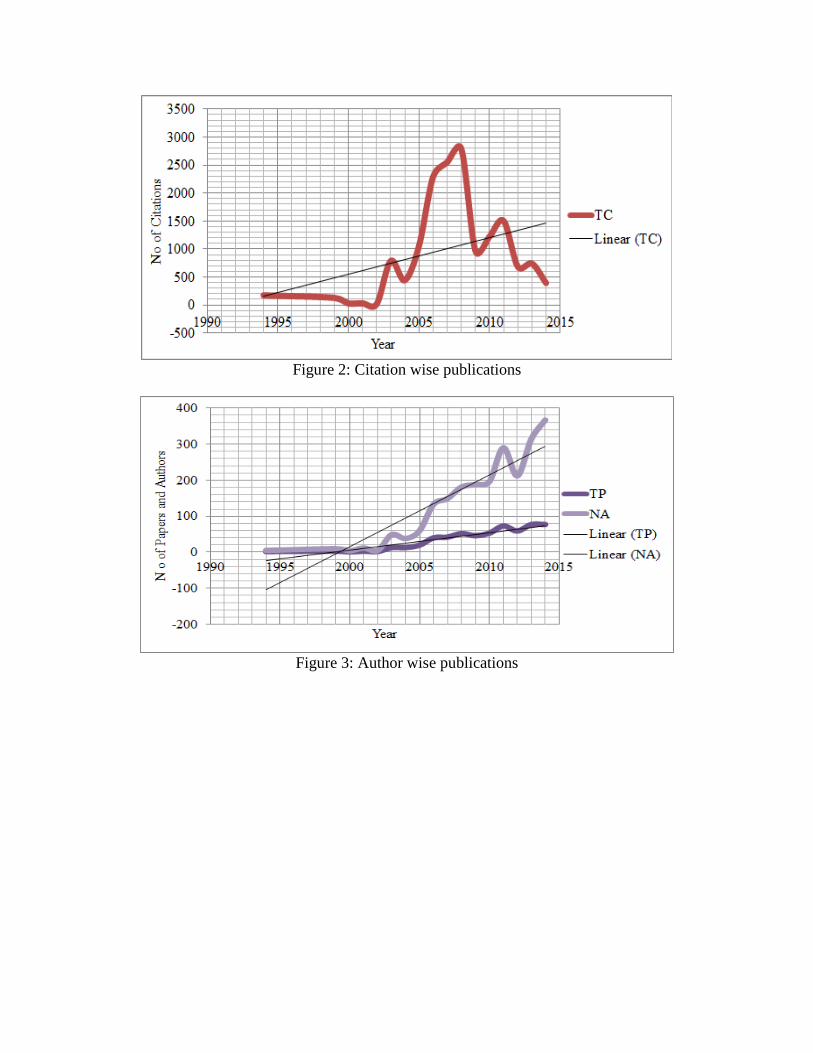
Figure 2: Citation wise publications
Figure 3: Author wise publications

Figure 4: Year wise Cited references
Table 2: RGR and DT on Nanotechnology research in Canada
PY TP Percent CP Percent Log1 Log
2
RGR
Mean
RGR
DT Mean
DT
1994 2 0.3 2 0.3 0.69 - - -
1999 3 0.5 5 0.8 1.098 1.61 0.51 1.36
2000 1 0.2 6 1.00 0 1.79 0 0
2001 3 0.5 9 1.80 1.098 2.19 1.09 0.64
2002 2 0.3 11 2.10 0.69 2.40 1.71 0.41
2003 13 2.3 24 4.40 2.56 3.18 0.62 0.655 0.64 0.51
2004 13 2.3 37 6.70 2.56 3.61 1.05 0.41
2005 20 3.5 57 10.2 2.99 4.04 1.05 0.64
2006 40 6.9 97 17.10 3.69 4.57 0.88 0.41
2007 42 7.3 139 24.4 3.74 4.93 1.19 0.64
2008 52 9.0 191 33.4 3.95 5.25 1.3 0.41
2009 46 8.0 237 41.4 3.82 5.47 1.65 1.187 0.64 0.52
2010 53 9.2 290 50.5 3.97 5.67 1.7 0.41
2011 73 12.7 363 63.3 4.29 5.89 1.6 0.64
2012 59 10.2 422 73.4 4.08 6.04 1.96 0.41
2013 77 13.4 499 86.8 4.34 6.21 1.87 0.64
2014 77 13.4 576 100 4.34 6.36 2.02 1.83 0.41 0.49
Total 576 100 1.224 0.51
PY- Publication year, TP- Total publications, CP- Cumulative publications
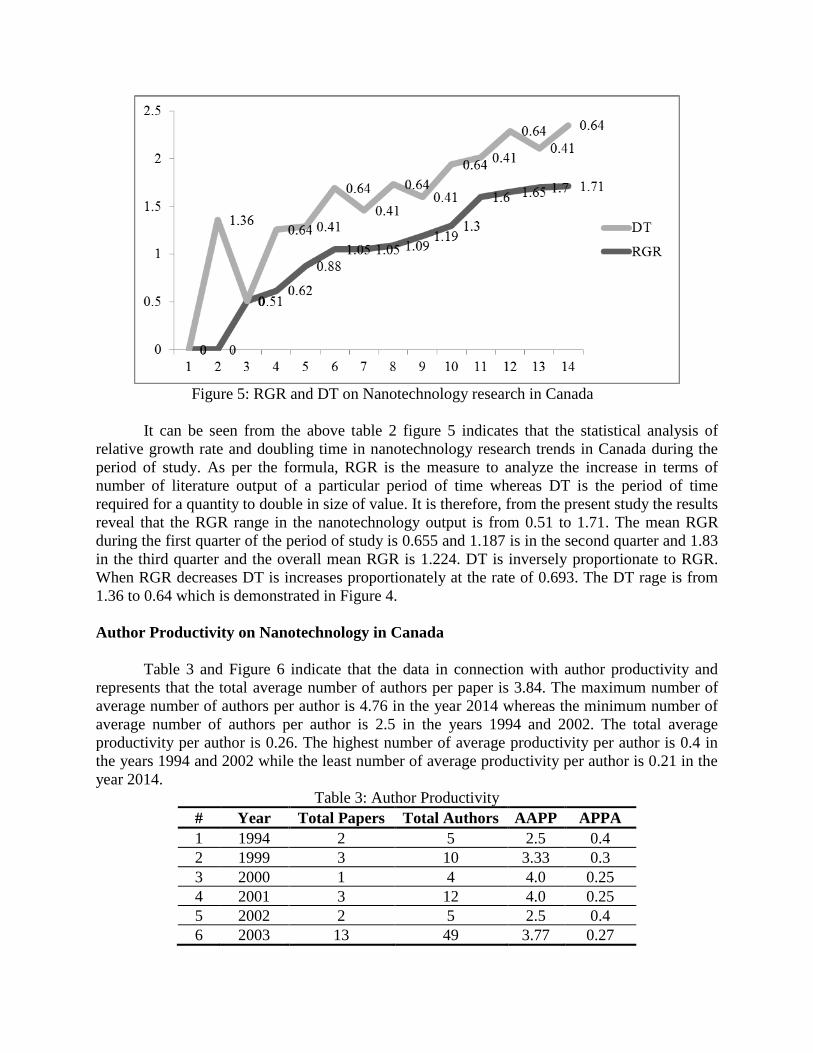
Figure 5: RGR and DT on Nanotechnology research in Canada
It can be seen from the above table 2 figure 5 indicates that the statistical analysis of
relative growth rate and doubling time in nanotechnology research trends in Canada during the
period of study. As per the formula, RGR is the measure to analyze the increase in terms of
number of literature output of a particular period of time whereas DT is the period of time
required for a quantity to double in size of value. It is therefore, from the present study the results
reveal that the RGR range in the nanotechnology output is from 0.51 to 1.71. The mean RGR
during the first quarter of the period of study is 0.655 and 1.187 is in the second quarter and 1.83
in the third quarter and the overall mean RGR is 1.224. DT is inversely proportionate to RGR.
When RGR decreases DT is increases proportionately at the rate of 0.693. The DT rage is from
1.36 to 0.64 which is demonstrated in Figure 4.
Author Productivity on Nanotechnology in Canada
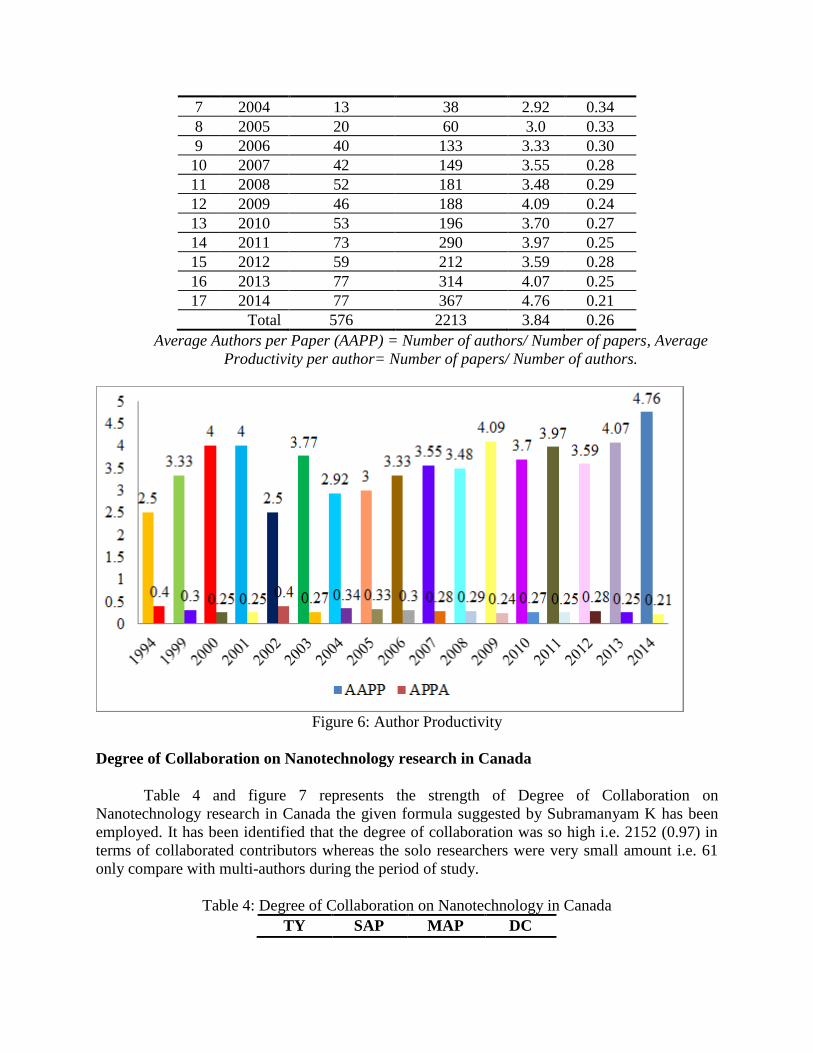
Table 3 and Figure 6 indicate that the data in connection with author productivity and
represents that the total average number of authors per paper is 3.84. The maximum number of
average number of authors per author is 4.76 in the year 2014 whereas the minimum number of
average number of authors per author is 2.5 in the years 1994 and 2002. The total average
productivity per author is 0.26. The highest number of average productivity per author is 0.4 in
the years 1994 and 2002 while the least number of average productivity per author is 0.21 in the
year 2014.
Table 3: Author Productivity
# Year Total Papers Total Authors AAPP APPA
1 1994 2 5 2.5 0.4
2 1999 3 10 3.33 0.3
3 2000 1 4 4.0 0.25
4 2001 3 12 4.0 0.25
5 2002 2 5 2.5 0.4
6 2003 13 49 3.77 0.27
7 2004 13 38 2.92 0.34
8 2005 20 60 3.0 0.33
9 2006 40 133 3.33 0.30
10 2007 42 149 3.55 0.28
11 2008 52 181 3.48 0.29
12 2009 46 188 4.09 0.24
13 2010 53 196 3.70 0.27
14 2011 73 290 3.97 0.25
15 2012 59 212 3.59 0.28
16 2013 77 314 4.07 0.25
17 2014 77 367 4.76 0.21
Total 576 2213 3.84 0.26
Average Authors per Paper (AAPP) = Number of authors/ Number of papers, Average
Productivity per author= Number of papers/ Number of authors.
Figure 6: Author Productivity
Degree of Collaboration on Nanotechnology research in Canada
Table 4 and figure 7 represents the strength of Degree of Collaboration on
Nanotechnology research in Canada the given formula suggested by Subramanyam K has been
employed. It has been identified that the degree of collaboration was so high i.e. 2152 (0.97) in
terms of collaborated contributors whereas the solo researchers were very small amount i.e. 61
only compare with multi-authors during the period of study.
Table 4: Degree of Collaboration on Nanotechnology in Canada
TY SAP MAP DC
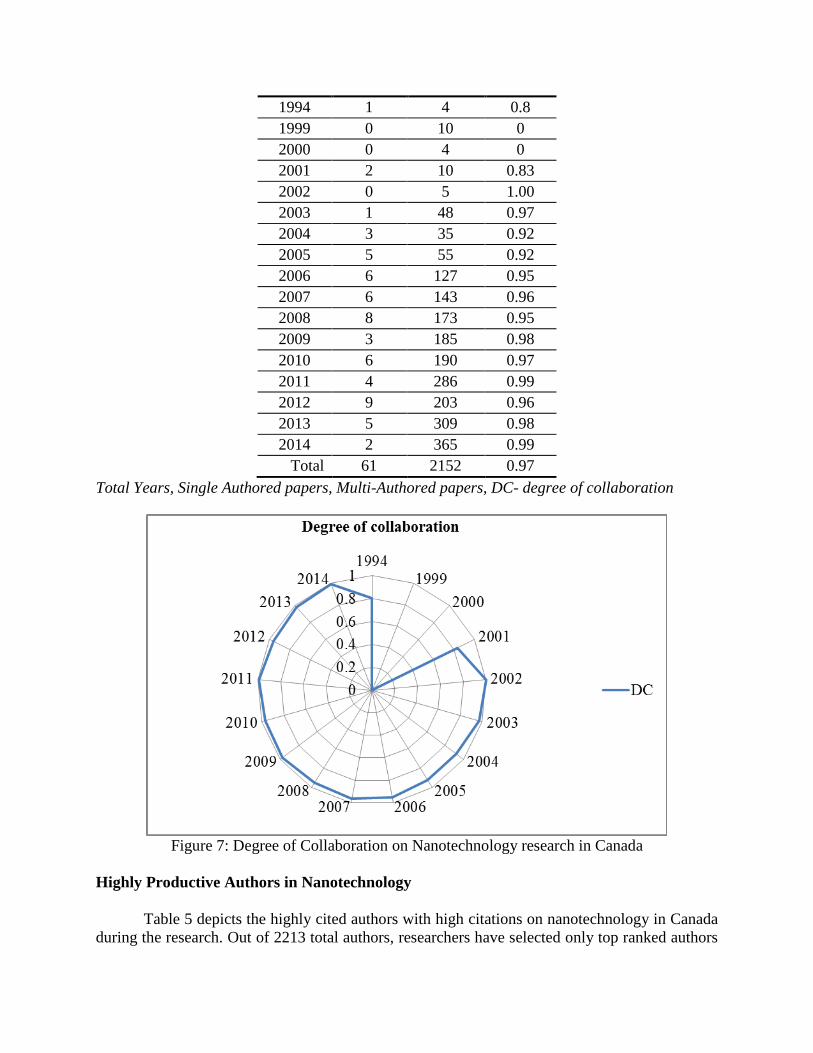
1994 1 4 0.8
1999 0 10 0
2000 0 4 0
2001 2 10 0.83
2002 0 5 1.00
2003 1 48 0.97
2004 3 35 0.92
2005 5 55 0.92
2006 6 127 0.95
2007 6 143 0.96
2008 8 173 0.95
2009 3 185 0.98
2010 6 190 0.97
2011 4 286 0.99
2012 9 203 0.96
2013 5 309 0.98
2014 2 365 0.99
Total 61 2152 0.97
Total Years, Single Authored papers, Multi-Authored papers, DC- degree of collaboration
Figure 7: Degree of Collaboration on Nanotechnology research in Canada
Highly Productive Authors in Nanotechnology
Table 5 depicts the highly cited authors with high citations on nanotechnology in Canada
during the research. Out of 2213 total authors, researchers have selected only top ranked authors

for the present study. Out of top 25authors, ‘Chan WCW’ has placed in the top position with 11
research papers along with 1103 citations with 11 h-index and followed by ‘Sleiman HF’ has
ranked in the second place with 14 scientific papers and 1018 citations with 10 h-index. The
third position has got by ‘Li YF’ with 8 papers with 1004 citations and 8 h-index. The least
number of which is single article published by many authors among the top 25 authors with high
citations during the study.
Table 5: Highly Cited Authors with h-index
S. No Author TP Percent TC h-
index
1 Chan WCW 11 1.9 1103 11
2 Sleiman HF 14 2.4 1018 10
3 Li YF 8 1.4 1004 8
4 Aldaye FA 5 0.9 822 5
5 Brook MA 5 0.9 692 5
6 Fischer HC 3 0.5 676 3
7 Rosei F 7 1.2 606 5
8 Barth JV 2 0.3 595 2
9 Palmer AL 1 0.2 498 1
10 Zhao WA 5 0.9 494 5
11 Buzea C 2 0.3 408 2
12 Gordon R 8 1.4 405 7
13 Pacheco II 1 0.2 396 1
14 Robbie K 1 0.2 396 1
15 Besenbacher F 2 0.3 385 2
16 Zhao W 1 0.2 340 1
17 Ozin GA 7 1.2 308 6
18 Birch D 1 0.2 302 1
19 Czeisler C 1 0.2 302 1
20 Fehlings MG 1 0.2 302 1
21 Kessler JA 1 0.2 302 1
22 Niece KL 1 0.2 302 1
23 Sahni V 1 0.2 302 1
24 Stupp SI 1 0.2 302 1
25 Tysseling-Mattiace VM 1 0.2 302 1
TP- Total Papers, TC- Total Citations
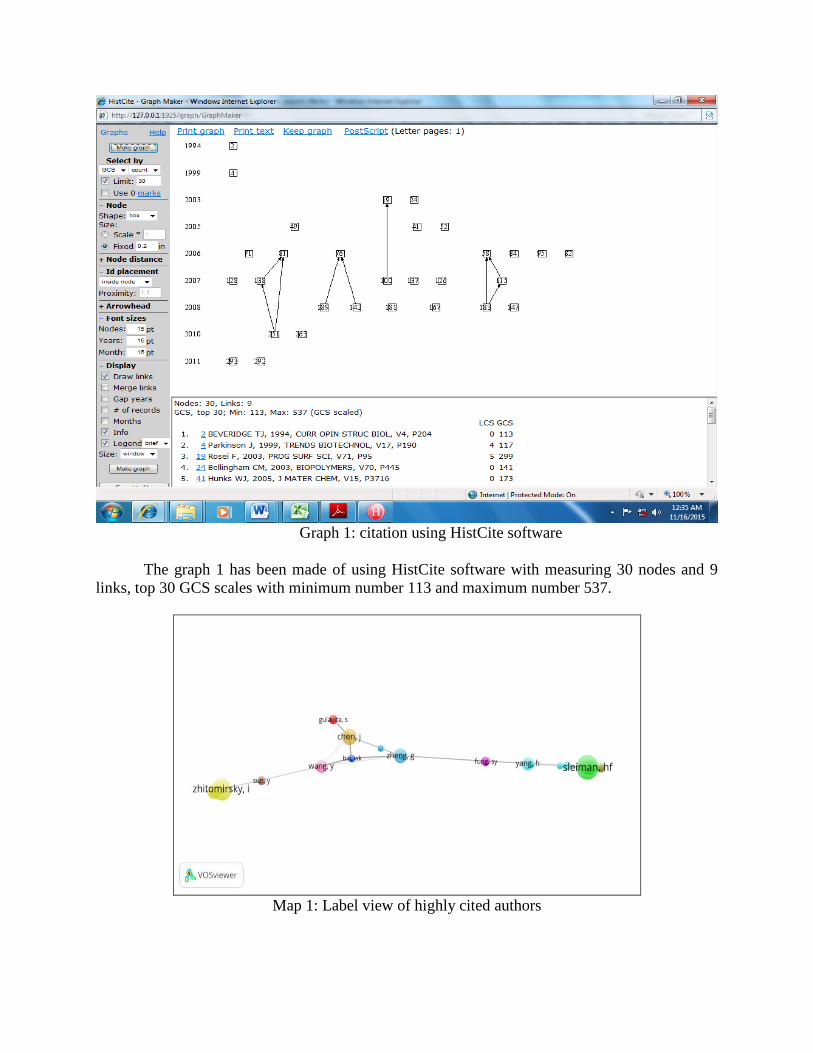
Graph 1: citation using HistCite software
The graph 1 has been made of using HistCite software with measuring 30 nodes and 9
links, top 30 GCS scales with minimum number 113 and maximum number 537.
Map 1: Label view of highly cited authors
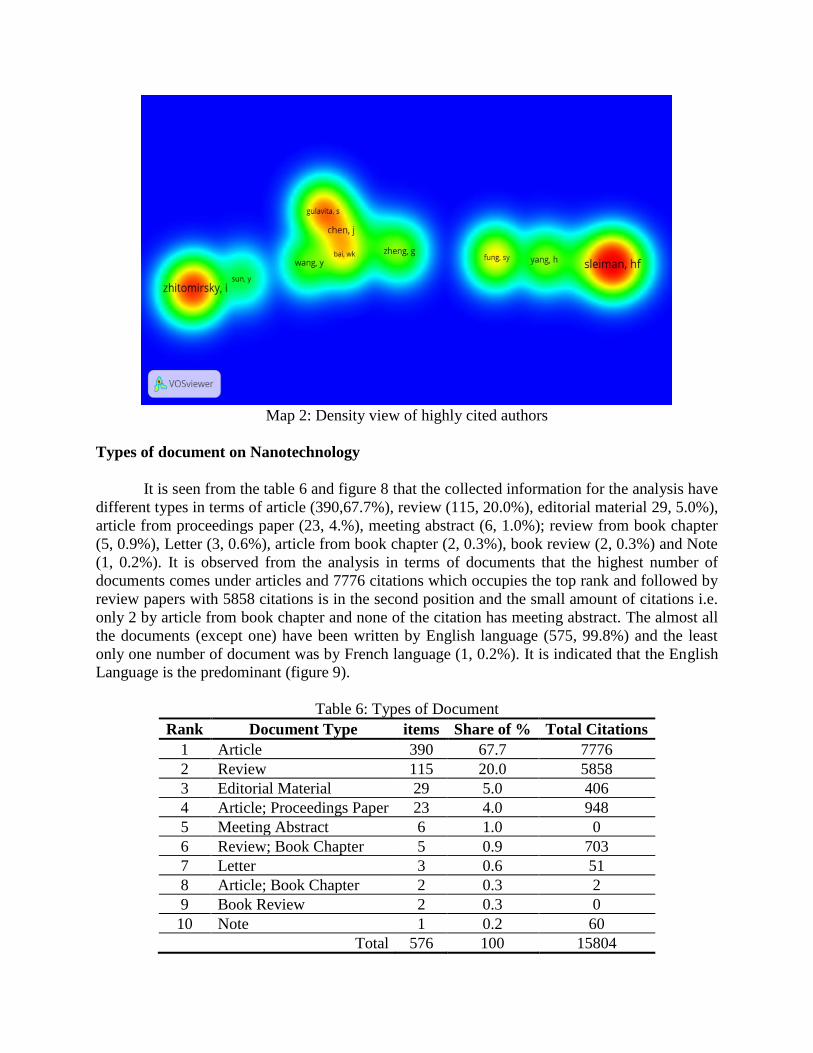
Map 2: Density view of highly cited authors
Types of document on Nanotechnology
It is seen from the table 6 and figure 8 that the collected information for the analysis have
different types in terms of article (390,67.7%), review (115, 20.0%), editorial material 29, 5.0%),
article from proceedings paper (23, 4.%), meeting abstract (6, 1.0%); review from book chapter
(5, 0.9%), Letter (3, 0.6%), article from book chapter (2, 0.3%), book review (2, 0.3%) and Note
(1, 0.2%). It is observed from the analysis in terms of documents that the highest number of
documents comes under articles and 7776 citations which occupies the top rank and followed by
review papers with 5858 citations is in the second position and the small amount of citations i.e.
only 2 by article from book chapter and none of the citation has meeting abstract. The almost all
the documents (except one) have been written by English language (575, 99.8%) and the least
only one number of document was by French language (1, 0.2%). It is indicated that the English
Language is the predominant (figure 9).
Table 6: Types of Document
Rank Document Type items Share of % Total Citations
1 Article 390 67.7 7776
2 Review 115 20.0 5858
3 Editorial Material 29 5.0 406
4 Article; Proceedings Paper 23 4.0 948
5 Meeting Abstract 6 1.0 0
6 Review; Book Chapter 5 0.9 703
7 Letter 3 0.6 51
8 Article; Book Chapter 2 0.3 2
9 Book Review 2 0.3 0
10 Note 1 0.2 60
Total 576 100 15804
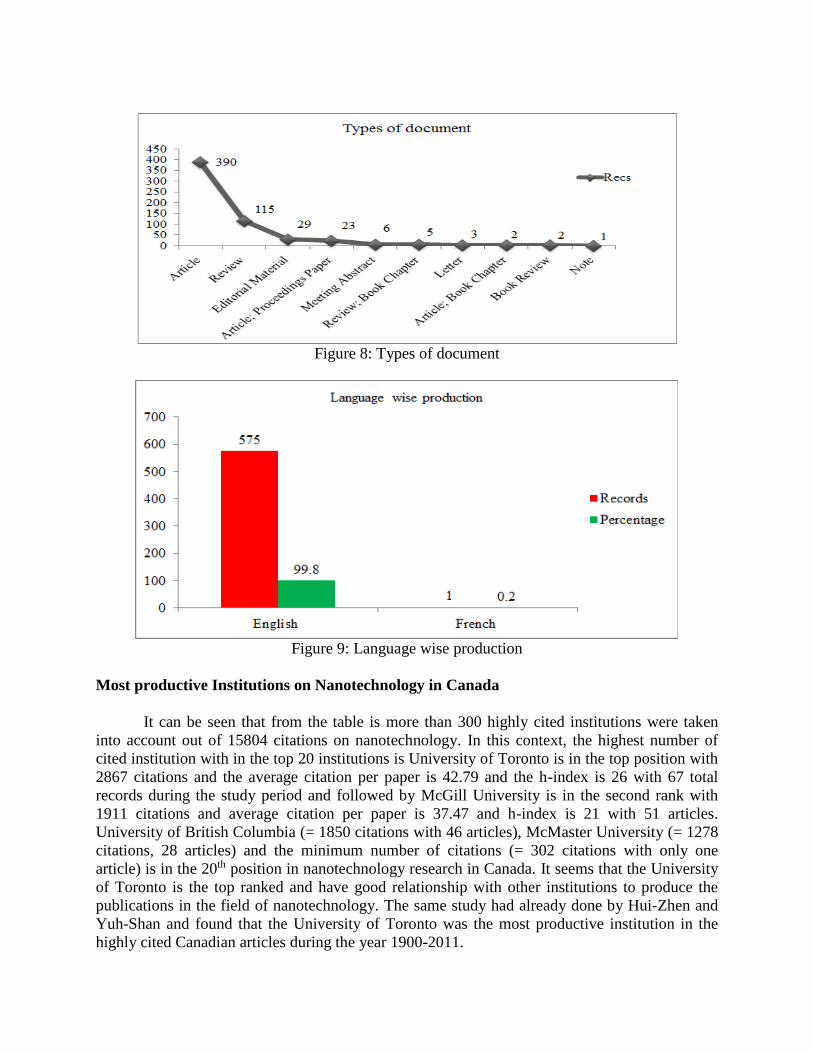
Figure 8: Types of document
Figure 9: Language wise production
Most productive Institutions on Nanotechnology in Canada
It can be seen that from the table is more than 300 highly cited institutions were taken
into account out of 15804 citations on nanotechnology. In this context, the highest number of
cited institution with in the top 20 institutions is University of Toronto is in the top position with
2867 citations and the average citation per paper is 42.79 and the h-index is 26 with 67 total
records during the study period and followed by McGill University is in the second rank with
1911 citations and average citation per paper is 37.47 and h-index is 21 with 51 articles.
University of British Columbia (= 1850 citations with 46 articles), McMaster University (= 1278
citations, 28 articles) and the minimum number of citations (= 302 citations with only one
article) is in the 20th position in nanotechnology research in Canada. It seems that the University
of Toronto is the top ranked and have good relationship with other institutions to produce the
publications in the field of nanotechnology. The same study had already done by Hui-Zhen and
Yuh-Shan and found that the University of Toronto was the most productive institution in the
highly cited Canadian articles during the year 1900-2011.
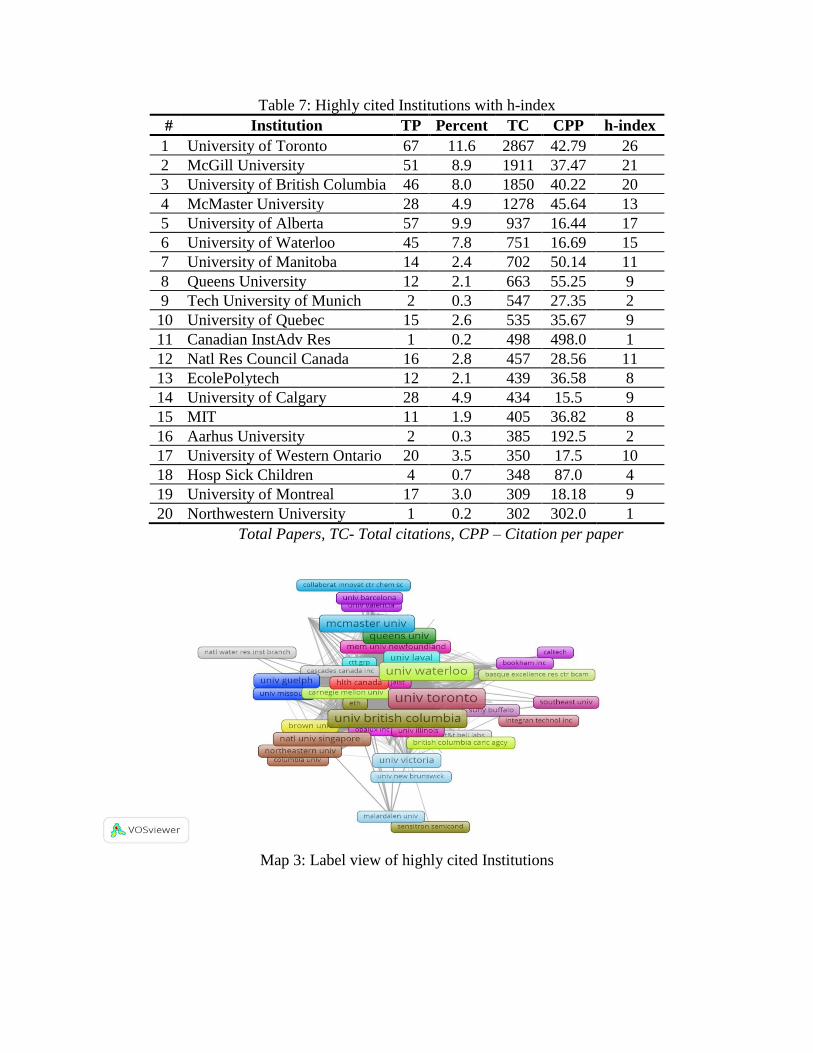
Table 7: Highly cited Institutions with h-index
# Institution TP Percent TC CPP h-index
1 University of Toronto 67 11.6 2867 42.79 26
2 McGill University 51 8.9 1911 37.47 21
3 University of British Columbia 46 8.0 1850 40.22 20
4 McMaster University 28 4.9 1278 45.64 13
5 University of Alberta 57 9.9 937 16.44 17
6 University of Waterloo 45 7.8 751 16.69 15
7 University of Manitoba 14 2.4 702 50.14 11
8 Queens University 12 2.1 663 55.25 9
9 Tech University of Munich 2 0.3 547 27.35 2
10 University of Quebec 15 2.6 535 35.67 9
11 Canadian InstAdv Res 1 0.2 498 498.0 1
12 Natl Res Council Canada 16 2.8 457 28.56 11
13 EcolePolytech 12 2.1 439 36.58 8
14 University of Calgary 28 4.9 434 15.5 9
15 MIT 11 1.9 405 36.82 8
16 Aarhus University 2 0.3 385 192.5 2
17 University of Western Ontario 20 3.5 350 17.5 10
18 Hosp Sick Children 4 0.7 348 87.0 4
19 University of Montreal 17 3.0 309 18.18 9
20 Northwestern University 1 0.2 302 302.0 1
Total Papers, TC- Total citations, CPP – Citation per paper
Map 3: Label view of highly cited Institutions
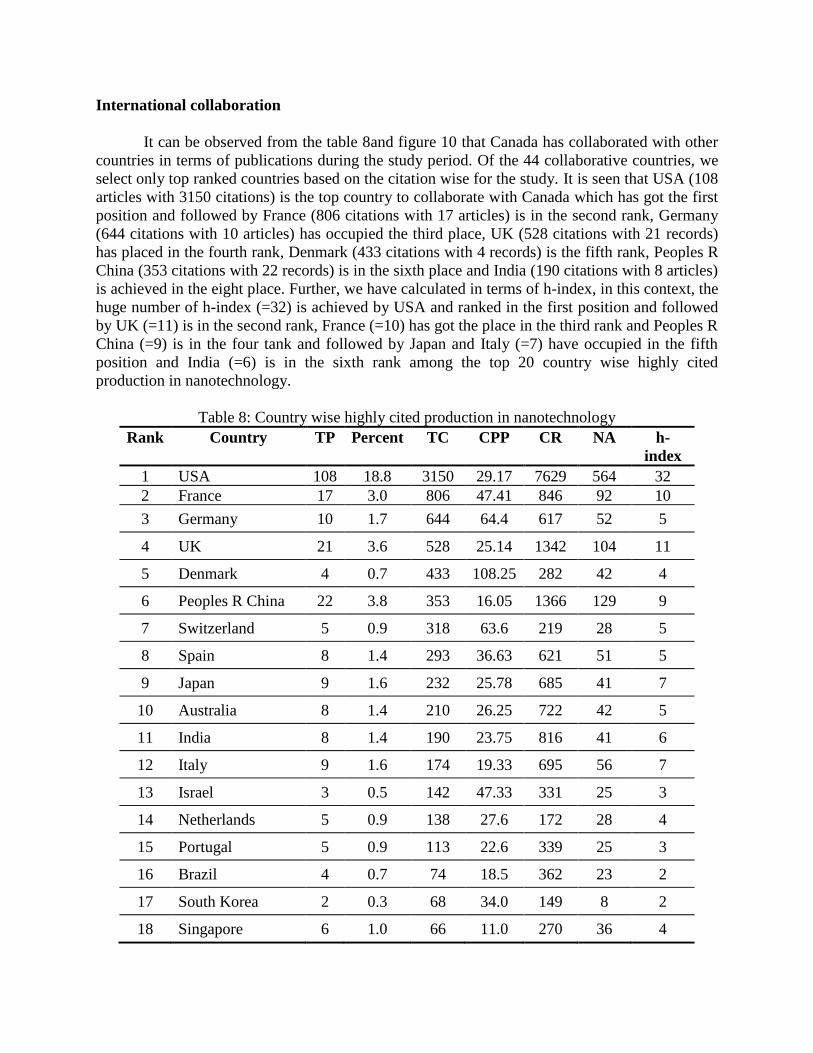
International collaboration
It can be observed from the table 8and figure 10 that Canada has collaborated with other
countries in terms of publications during the study period. Of the 44 collaborative countries, we
select only top ranked countries based on the citation wise for the study. It is seen that USA (108
articles with 3150 citations) is the top country to collaborate with Canada which has got the first
position and followed by France (806 citations with 17 articles) is in the second rank, Germany
(644 citations with 10 articles) has occupied the third place, UK (528 citations with 21 records)
has placed in the fourth rank, Denmark (433 citations with 4 records) is the fifth rank, Peoples R
China (353 citations with 22 records) is in the sixth place and India (190 citations with 8 articles)
is achieved in the eight place. Further, we have calculated in terms of h-index, in this context, the
huge number of h-index (=32) is achieved by USA and ranked in the first position and followed
by UK (=11) is in the second rank, France (=10) has got the place in the third rank and Peoples R
China (=9) is in the four tank and followed by Japan and Italy (=7) have occupied in the fifth
position and India (=6) is in the sixth rank among the top 20 country wise highly cited
production in nanotechnology.
Table 8: Country wise highly cited production in nanotechnology
Rank Country TP Percent TC CPP CR NA h-
index
1 USA 108 18.8 3150 29.17 7629 564 32
2 France 17 3.0 806 47.41 846 92 10
3 Germany 10 1.7 644 64.4 617 52 5
4 UK 21 3.6 528 25.14 1342 104 11
5 Denmark 4 0.7 433 108.25 282 42 4
6 Peoples R China 22 3.8 353 16.05 1366 129 9
7 Switzerland 5 0.9 318 63.6 219 28 5
8 Spain 8 1.4 293 36.63 621 51 5
9 Japan 9 1.6 232 25.78 685 41 7
10 Australia 8 1.4 210 26.25 722 42 5
11 India 8 1.4 190 23.75 816 41 6
12 Italy 9 1.6 174 19.33 695 56 7
13 Israel 3 0.5 142 47.33 331 25 3
14 Netherlands 5 0.9 138 27.6 172 28 4
15 Portugal 5 0.9 113 22.6 339 25 3
16 Brazil 4 0.7 74 18.5 362 23 2
17 South Korea 2 0.3 68 34.0 149 8 2
18 Singapore 6 1.0 66 11.0 270 36 4
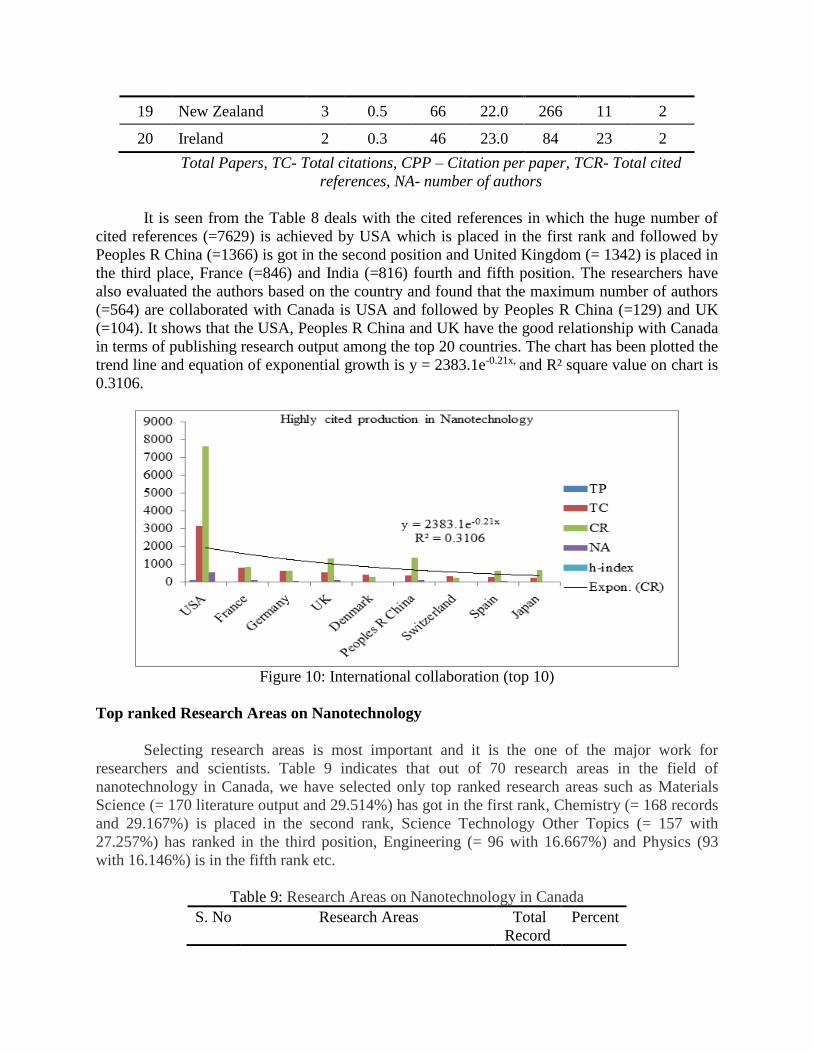
19 New Zealand 3 0.5 66 22.0 266 11 2
20 Ireland 2 0.3 46 23.0 84 23 2
Total Papers, TC- Total citations, CPP – Citation per paper, TCR- Total cited
references, NA- number of authors
It is seen from the Table 8 deals with the cited references in which the huge number of
cited references (=7629) is achieved by USA which is placed in the first rank and followed by
Peoples R China (=1366) is got in the second position and United Kingdom (= 1342) is placed in
the third place, France (=846) and India (=816) fourth and fifth position. The researchers have
also evaluated the authors based on the country and found that the maximum number of authors
(=564) are collaborated with Canada is USA and followed by Peoples R China (=129) and UK
(=104). It shows that the USA, Peoples R China and UK have the good relationship with Canada
in terms of publishing research output among the top 20 countries. The chart has been plotted the
trend line and equation of exponential growth is y = 2383.1e-0.21x, and R² square value on chart is
0.3106.
Figure 10: International collaboration (top 10)
Top ranked Research Areas on Nanotechnology
Selecting research areas is most important and it is the one of the major work for
researchers and scientists. Table 9 indicates that out of 70 research areas in the field of
nanotechnology in Canada, we have selected only top ranked research areas such as Materials
Science (= 170 literature output and 29.514%) has got in the first rank, Chemistry (= 168 records
and 29.167%) is placed in the second rank, Science Technology Other Topics (= 157 with
27.257%) has ranked in the third position, Engineering (= 96 with 16.667%) and Physics (93
with 16.146%) is in the fifth rank etc.
Table 9: Research Areas on Nanotechnology in Canada
S. No Research Areas Total
Record
Percent

1 Materials Science 170 29.514
2 Chemistry 168 29.167
3 Science Technology Other Topics 157 27.257
4 Engineering 96 16.667
5 Physics 93 16.146
6 Pharmacology Pharmacy 61 10.590
7 Biochemistry Molecular Biology 29 5.035
8 Business Economics 29 5.035
9 Biotechnology Applied Microbiology 22 3.819
10 Polymer Science 20 3.472
Top ranked Subject wise distribution
It is inferred in the table 10 that out of 112 subject wise productions in the field of
nanotechnology, only top 10 subjects has been taken into account for the analysis. The results
reveal that the highest number of 140 records with 24.306 percent has occupied in the subject of
‘Materials Science Multidisciplinary’ and placed in the first rank and followed by in the next
place has got by the subject of ‘Nanoscience Nanotechnology’ with 138 research output and
23.958 percent. The subject ‘Chemistry Multidisciplinary’ is in the third rank with 113
publications and 19.618 percent. Within top 10 subject areas, the minimum number of subject in
Canada is Biotechnology Applied Microbiology with 22 records and 3.819 percent.
Table 10: Subject wise distribution on Nanotechnology in Canada
S. No Subject Record
Count
%
1 Materials Science Multidisciplinary 140 24.306
2 Nanoscience Nanotechnology 138 23.958
3 Chemistry Multidisciplinary 113 19.618
4 Physics Applied 75 13.021
5 Chemistry Physical 66 11.458
6 Pharmacology Pharmacy 55 9.549
7 Engineering Electrical Electronic 39 6.771
8 Physics Condensed Matter 29 5.035
9 Biochemistry Molecular Biology 22 3.819
10 Biotechnology Applied Microbiology 22 3.819
Top ranked Source Journals
It is shown in the table 11 that out of 338source journals, researchers have carefully
chosen only leading and top ranked journals such as ACS NANO, International Journal of
Nanotechnology, Angewandte Chemie International Edition, Journal of the American Chemical
Society, and IEEE Transactions on Nanotechnology and Nanotechnology etc. Out of top 15
productivity source journals, ACS NANO (167 h-index) is ranked first place with 14 records
along with 355 total citation score and the average citation per paper is 25.36, and followed by
the second rank is occupied by International Journal of Nanotechnology (25 h-index) with 12 and

43 citations and average citation per paper is 3.58.AngewandteChemie-International Edition is in
the third rank with 11 records (675 citations), and the average citation per paper is 61.36 and the
next position is got by Journal of the American Chemical Society (412 h-index) with 11 articles
and the citations are439 with average citation per paper is 39.91.
Table 11: Source Journals on Nanotechnology in Canada
# Journal TR TC ACPP h-index
1 ACS Nano 14 355 25.36 167
2 International Journal of Nanotechnology 12 43 3.58 25
3 Angewandte Chemie-International Edition 11 675 61.36 -
4 Journal of the American Chemical Society 11 439 39.91 412
5 IEEE Transactions on Nanotechnology 10 216 21.6 56
6 Nanotechnology 10 276 27.6 128
7 International Journal of Nanomedicine 9 210 23.33 53
8 Journal of Pharmaceutical Sciences 9 88 9.78 121
9 Small 8 356 44.5 135
10 Advanced Drug Delivery Reviews 7 328 46.86 205
11 Langmuir 7 50 7.14 241
12 Nanomedicine-Nanotechnology Biology and Medicine 7 221 31.57 66
13 ACS Applied Materials & Interfaces 6 36 6.0 -
14 Journal of Nanoscience and Nanotechnology 6 151 25.17 74
15 Canadian Journal of Chemical Engineering 5 156 31.2 43
Totla recors, Total citations, ACPP- Avarage citaion per paper
Map 4: Label view of the source Journals on Nanotechnology
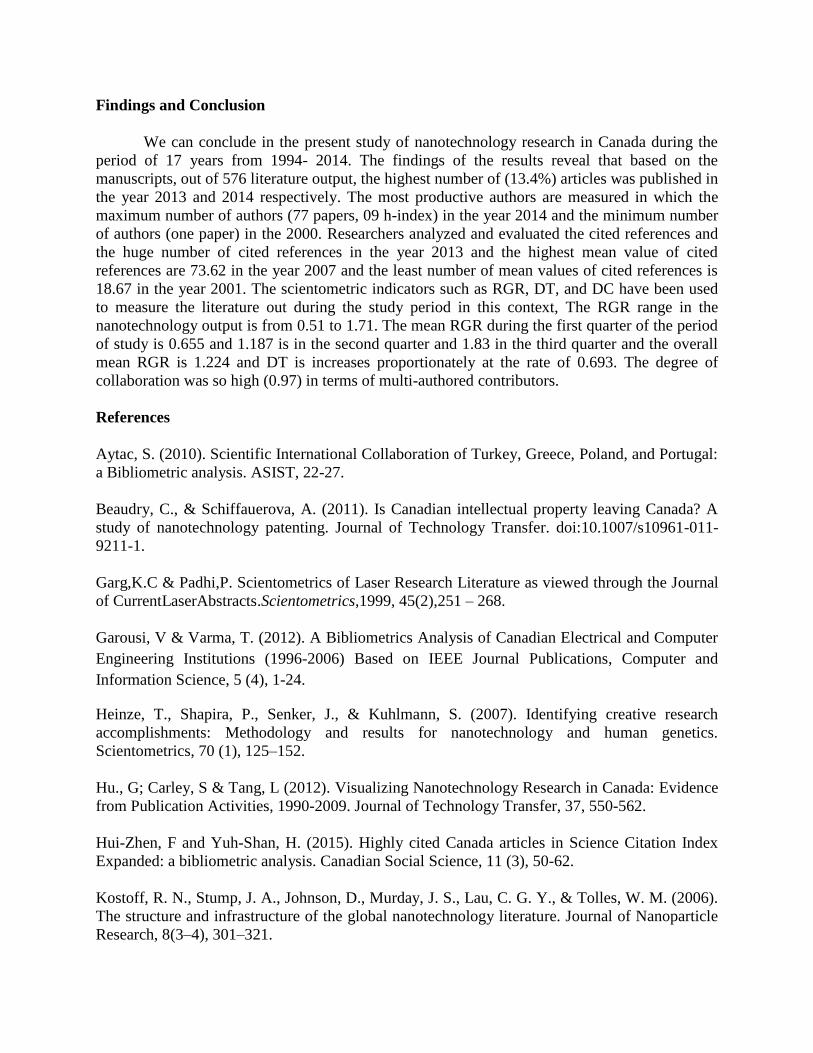
Findings and Conclusion
We can conclude in the present study of nanotechnology research in Canada during the
period of 17 years from 1994- 2014. The findings of the results reveal that based on the
manuscripts, out of 576 literature output, the highest number of (13.4%) articles was published in
the year 2013 and 2014 respectively. The most productive authors are measured in which the
maximum number of authors (77 papers, 09 h-index) in the year 2014 and the minimum number
of authors (one paper) in the 2000. Researchers analyzed and evaluated the cited references and
the huge number of cited references in the year 2013 and the highest mean value of cited
references are 73.62 in the year 2007 and the least number of mean values of cited references is
18.67 in the year 2001. The scientometric indicators such as RGR, DT, and DC have been used
to measure the literature out during the study period in this context, The RGR range in the
nanotechnology output is from 0.51 to 1.71. The mean RGR during the first quarter of the period
of study is 0.655 and 1.187 is in the second quarter and 1.83 in the third quarter and the overall
mean RGR is 1.224 and DT is increases proportionately at the rate of 0.693. The degree of
collaboration was so high (0.97) in terms of multi-authored contributors.
References
Aytac, S. (2010). Scientific International Collaboration of Turkey, Greece, Poland, and Portugal:
a Bibliometric analysis. ASIST, 22-27.
Beaudry, C., & Schiffauerova, A. (2011). Is Canadian intellectual property leaving Canada? A
study of nanotechnology patenting. Journal of Technology Transfer. doi:10.1007/s10961-011-
9211-1.
Garg,K.C & Padhi,P. Scientometrics of Laser Research Literature as viewed through the Journal
of CurrentLaserAbstracts.Scientometrics,1999, 45(2),251 – 268.
Garousi, V & Varma, T. (2012). A Bibliometrics Analysis of Canadian Electrical and Computer
Engineering Institutions (1996-2006) Based on IEEE Journal Publications, Computer and
Information Science, 5 (4), 1-24.
Heinze, T., Shapira, P., Senker, J., & Kuhlmann, S. (2007). Identifying creative research
accomplishments: Methodology and results for nanotechnology and human genetics.
Scientometrics, 70 (1), 125–152.
Hu., G; Carley, S & Tang, L (2012). Visualizing Nanotechnology Research in Canada: Evidence
from Publication Activities, 1990-2009. Journal of Technology Transfer, 37, 550-562.
Hui-Zhen, F and Yuh-Shan, H. (2015). Highly cited Canada articles in Science Citation Index
Expanded: a bibliometric analysis. Canadian Social Science, 11 (3), 50-62.
Kostoff, R. N., Stump, J. A., Johnson, D., Murday, J. S., Lau, C. G. Y., & Tolles, W. M. (2006).
The structure and infrastructure of the global nanotechnology literature. Journal of Nanoparticle
Research, 8(3–4), 301–321.
Lee, L. L., Chan, C. K., Ngiam, M., & Ramakrishna, S. (2006). Nanotechnology patent
landscape 2006. NANO, 1(2), 101–113.
Rosei, F. (2008). Special issue: On nanotechnology in Canada. International Journal of
Nanotechnology, 5 (9–12), 897–899.
Subramanyam, K. (1993). “Bibliometric Study of Research Collaboration: A Review.” Journal
of Information Science, 6 (1): 33-38.
Tang, L., Shapira., P. (2012). Effects of international collaboration and knowledge moderation
on China’s nanotechnology research impacts, Journal of Technology Management in China, 7
(1), 94-110. www.emeraldinsight.com/1746-8779.htm
Velmurugan, C & Radhakrishnan, N. (2015). Research analysis by means of Scientometric
techniques on Biotechnology, International Journal of Multidisciplinary Consortium (IJMC),
2(1), 256-265.
Velmurugan, C & Radhakrishnan, N. (2015). A Scientometric Analysis of Research Papers
Published on Pharmacognosy as reflected in the Web of Science. Advances in Pharmacognosy
and Phytomedicine, 1(1), 27-40.
Velmurugan, C & Radhakrishnan, N. (2015). Journal of Information Literacy: A Scientometric
Profile, Journal of Information Sciences and Application, 3 (1), 1-9.
Velmurugan, C & Radhakrishnan, N. (2015). Quantitative Analysis of Scientific Publications
Output on Engineering Journal: A Scientometric Study, Journal of Information Sciences and
Application, 3 (1), 19-30.
Velmurugan, C & Radhakrishnan, N. (2015). Literature output of Supply Chain Management: A
Scientometric approach, Journal of Organizational Behaviour, 3(2), 31-44.
Velmurugan, C & Radhakrishnan, N. (2015). Authorship trends and collaborative research work
on Library Herald: a Scientometric analysis, In Information Science and Digital Libraries, edited
by Somvir, International Research Publication House, Delhi, 183-197.
Velmurugan, C. (2013). Research Trends in Journal of Intellectual Property Rights (JIPR): A
Bibliometric Study, Library Philosophy and Practice (e-journal), Paper 1043. Retrieved 6 March
from: http://digitalcommons.unl.edu/libphilprac/1043.
Velmurugan, C. (2013). Scientometric analysis: Annals of Library and Information Studies
Publications Output during 2007-2012, International Journal of Library and Information Studies,
3 (3), 58-65.
Velmurugan, C. (2013). Bibliometric analysis with special reference to Authorship Pattern and
Collaborative Research Output of Annals of Library and Information Studies for the Year 2007 –
2012. International Journal of Digital Library Services, 3 (3), 13-21.
Velmurugan, C. (2014). Research Trends in Indian Journal of Pure and Applied Physics (IJPAP)
for the Year 2009 – 2012, Asian Review of Social Sciences, 3 (1), 24-28.
Velmurugan, C & Radhakrishnan, N. (2014). Publication Research Trends on Technical Review
Journal: A Scientometric Study, International Journal of Digital Library Services (IJDLS), 4 (3),
45-55.
Yegul, M. F., Yavuz, M., & Guild, P. (2008). Nanotechnology: Canada’s position in scientific
publications and patents. PICMET 2008 Proceedings, 27–31 July. Cape Town, South Africa.
Youtie, J., Shapira, P., & Porter, A. L. (2008). Nanotechnology publications and citations by
leading countries and blocs. Journal of Nanoparticle Research, 10(6), 981–986.


