
Mapping of HTLV-1 Tax Functional Domain Conferring Cellular Senescence
A Major Qualifying Project Report:
submitted to the Faculty
of the
WORCESTER POLYTECHNIC INSTITUTE
in partial fulfillment of the requirements for the
Degree of Bachelor of Science
by
___________________________________
Katarzyna A. Koscielska
and
___________________________________
Oliver J. Salmon
Date: April 23, 2008
Approved:
___________________________________
Professor Destin Heilman, Project Advisor
___________________________________
Professor Kristin K. Wobbe, Co-Advisor
1. Tax
2. APC/C
3. HTLV-1

2
Contents
Contents .................................................................................................................................... 2
Acknowledgements .................................................................................................................. 3
Introduction .............................................................................................................................. 4
Retroviruses .......................................................................................................................... 4
Human T-lymphotropic Virus Type-1 (HTLV-1) ................................................................ 7
Tax ........................................................................................................................................ 8
Anaphase-Promoting Complex/Cyclosome (APC/C)........................................................... 9
HTLV-1 Tax and the APC/C .............................................................................................. 13
Current Study ...................................................................................................................... 14
Materials and Methods ........................................................................................................... 15
PCR ..................................................................................................................................... 15
pGEM-T vector amplification............................................................................................. 15
p424GAL1 cloning and vector amplification ..................................................................... 16
S. cerevisiae transformation and growth ............................................................................. 16
Results .................................................................................................................................... 18
Discussion .............................................................................................................................. 24
References .............................................................................................................................. 28

3
Acknowledgements
We would like to thank those closest to us, Maja, Artur, and Devin, for dealing with our
awkward hours and Jon, Derrick, Jill, and Adam for making a great MQP lab. More than anyone
else though, we would like to thank Professor Heilman for being available just about every
moment of the day and for being the best advisor we could ask for.

4
Introduction
Retroviruses
Retroviruses are a relatively small group of primarily avian and mammalian pathogens,
classified together in the family Retroviridae. They are divided into seven genera:
Alpharetrovirus (e.g Rous sarcoma virus), Betaretrovirus (e.g. mouse mammary tumor virus),
Gammaretrovirus (e.g. murine leukemia virus), Deltaretrovirus (human T-lymphotropic virus, or
HTLV), Epsilonretrovirus (e.g. walleye fish dermal sarcoma virus), Lentivirus (e.g. human
immunodeficiency virus, or HIV) and Spumavirus (e.g. simian foamy virus). Retroviruses infect
a broad range of hosts including birds, mice, apes and humans. Their most unique feature is their
single stranded RNA genome, which is transcribed into double stranded DNA after the infection
of a host cell (hence the name), and only after this step their genes can be processed by the cell.
Retroviruses are also known for being small viruses, and as a result their genome and protein
structures are small and highly functional.
The diagram below is an example of the basic structure of a retrovirus (HTLV-1). All
retroviral particles possess an outer lipid envelope, consisting of host cell membrane and various
viral glycoproteins (shown in brown for transmembrane, and black for surface glycoproteins),
which usually function to bind specific receptors on the cell surface. The space between the
envelope and the capsid is called the matrix, and it contains viral matrix proteins (green), which
have a propensity to regulate many stages of virus replication (6). The capsid is assembled from
capsid proteins and has varying shapes, depending on the type of virus. The capsid protects the
two copies of the viral genome, various viral proteins, and some molecules from the last host
cell. One protein in the capsid, nucleocapsid protein (purple), interacts with nucleotide
sequences, which allows it to package the genomic RNA, protect RNA from degradation, assist
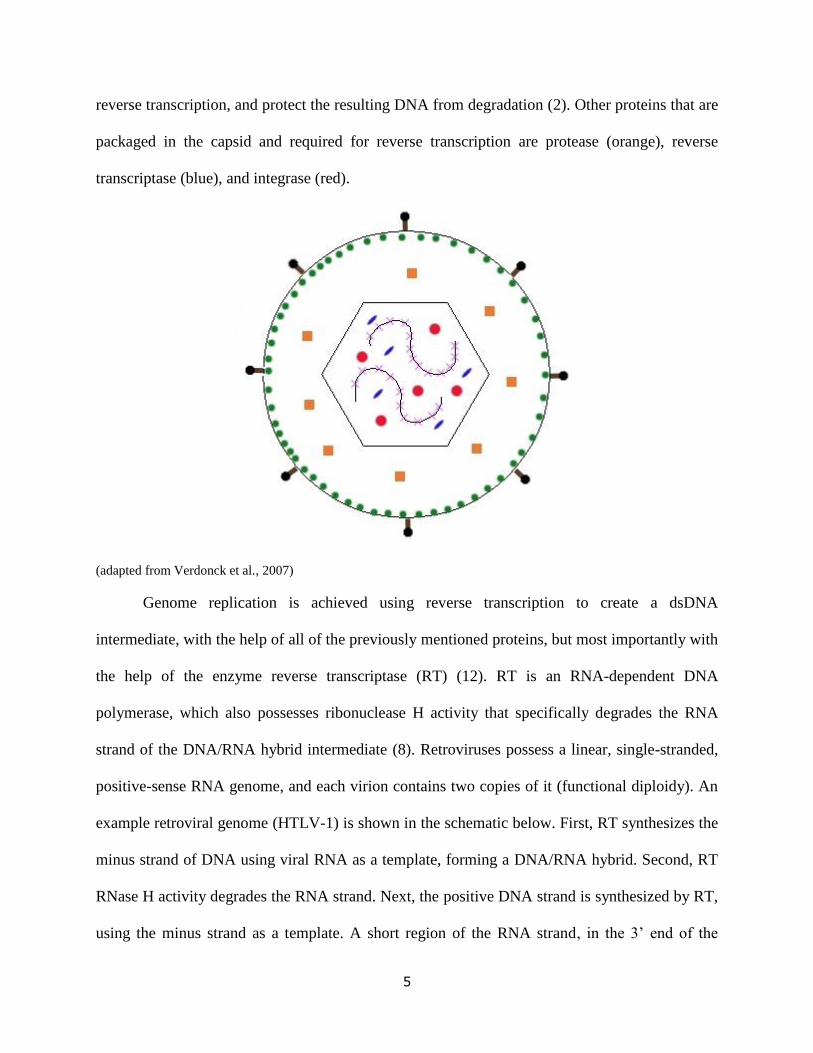
5
reverse transcription, and protect the resulting DNA from degradation (2). Other proteins that are
packaged in the capsid and required for reverse transcription are protease (orange), reverse
transcriptase (blue), and integrase (red).
(adapted from Verdonck et al., 2007)
Genome replication is achieved using reverse transcription to create a dsDNA
intermediate, with the help of all of the previously mentioned proteins, but most importantly with
the help of the enzyme reverse transcriptase (RT) (12). RT is an RNA-dependent DNA
polymerase, which also possesses ribonuclease H activity that specifically degrades the RNA
strand of the DNA/RNA hybrid intermediate (8). Retroviruses possess a linear, single-stranded,
positive-sense RNA genome, and each virion contains two copies of it (functional diploidy). An
example retroviral genome (HTLV-1) is shown in the schematic below. First, RT synthesizes the
minus strand of DNA using viral RNA as a template, forming a DNA/RNA hybrid. Second, RT
RNase H activity degrades the RNA strand. Next, the positive DNA strand is synthesized by RT,
using the minus strand as a template. A short region of the RNA strand, in the 3’ end of the

6
RNA, is resistant to RNase H action and serves as a primer for the positive strand synthesis (8).
(adapted from Verdonck et al., 2007)
All retroviral genomes contain three characteristic open reading frames: gag, which codes
for structural and core proteins, pol, which contains genes for the reverse transcriptase, integrase
and protease, and env, which encodes proteins to be incorporated into the viral envelope. The
simplest retroviruses only possess these 3 coding regions, while the more complicated ones can
have many accessory genes.
Retroviruses typically spend most of their life cycle integrated in the host genome in the
form of a provirus. The long terminal repeats (LTRs), shown as black boxes in above, are located
at both ends of the proviral sequence and serve as promoters, enhancers and regulators of viral
gene expression in the provirus stage (8). LTRs also contain all signals necessary for the viral
gene expression: 5’ end capping, the 3’ polyadenylation, and a transcriptional stop (29). The
LTR sequences have evolved from ‘jumps’ that RT makes from the 5’ to the 3’ end of the
template molecule, duplicating part of the sequence (8).
Retroviral infection begins with the viral glycoproteins binding to a specific cell surface

7
receptor, after which the nucleoprotein core (the genome, the gag-derived proteins and the RT)
of the virus is encased inside the cell. In the cell, reverse transcriptase generates a dsDNA copy
of the genome, a complex of proteins and the dsDNA is imported into the nucleus, and the viral
enzyme integrase facilitates fusion with the host genome after making a double-stranded cut at a
random location in the host genome with some preference for bent or slightly unwound DNA (2).
Afterwards, the viral genome is transcribed as a single mRNA, which is transported to a specific
domain(s) of the cytoplasm and appropriately spliced1. Viral polyproteins are translated and viral
protease cleaves the constituent proteins, which will be packaged for new virion assembly.
Importantly, Gag packages the genomic RNA and principally controls transport towards the host
cell membrane (35). Finally, genomic RNA, viral proteins and some host cell molecules start
budding to intercellular space using the host-cell membrane as their outer lipid envelope (35).
Human T-lymphotropic Virus Type-1 (HTLV-1)
HTLV-1 is a human retrovirus (36) with an 8,507 nucleotide linear single-stranded
genome (see the earlier diagram). It was the first human retrovirus isolated (32), and it was since
identified as the causative agent of adult T-cell leukemia/lymphoma (ATL) and a rare neuronal
disorder named HTLV-1-associated myelopathy/tropical spastic paraparesis (HAM/TSP) (36).
HTLV-1 posesses the three characteristic reading frames present in all retroviruses (gag, pol and
env), but also encodes several other proteins crucial for the HTLV-1 life cycle. The p12, p13 and
p30 proteins fulfill a supporting role during infection (see the table below). HBZ is a DNA-
binding protein encoded on the minus strand of the genome; and Tax and Rex are crucial in
establishing viral infection. Tax is the most conserved region of the HTLV-1 genome (36).
1 Many retroviral gene products require splicing. For example gag, pol, and env from HTLV-1 require splicing in
order for each to create multiple protein products. Also in HTLV-1, tax, p30, and rex require splicing to create
functional proteins.

8
gene product function
gag matrix layer protein organization of viral parts
capsid protein capsid assembly
nucleocapsid protein wrapping of viral genome
pol reverse transcriptase ssRNA to dsDNA conversion
protease cleavage of viral polyproteins
integrase proviral integration into host genome
env surface glycoprotein host cell binding
transmembrane protein glycoprotein anchoring
tax Tax transcriptional activator (both viral and host
genes) rex Rex viral RNA transport regulation
p12 p12 important in replication and activation of T-cells
p13 p13 targeting of mitochondria
p30 p30 transcription regulation
HBZ HBZ HTLV-1 basic leucine zipper factor
(adapted from Verdonck et al., 2007 and Matsuoka and Jeang, 2007)
Tax
Tax is a 351-amino acid, 40-kDa protein (38) which seems to be responsible for the
pleiotropic effects that an HTLV-1 infection can have on susceptible cells. This phosphoprotein
(9) functions as a transcriptional activator of the viral genes by recruiting transcriptional
coactivators to the long terminal repeats flanking the HTLV-1 genome (20). Structurally, Tax
contains both a nuclear localization and nuclear export signal, numerous leucine zipper-like
sequences, a transactivation domain, and other DNA-binding sites (see the figure below) (9). The
transactivation domain is known to regulate nuclear factor-kappa B (NF-κB) (9). In the cell, Tax
is mainly localized in nuclear and perinuclear speckles, and it also colocalizes with the
centrosomes (7). Expression of Tax alone is sufficient to induce detrimental changes in normal
T-cells, especially centrosome overamplification (7), aneuploidy, chromosomal instability and

9
micronucleation of the cells (25). It is possible that the accumulation of these changes is what
leads to cellular transformation; however, the exact mechanism of development of the adult T-
cell leukemia remains to be elucidated.
(adapted from Alefantis et al., 2005)
Interestingly, when Tax is introduced into human transformed cells like HeLa, or into S.
cerevisiae cells, it shows propensity for drastically deregulating the cell cycle. Findings of Liu et
al. (23) indicate that Tax directly interacts with the anaphase-promoting complex/cyclosome
(APC/C), causing a number of cellular events that combine to commit the cells to senescence and
cause growth arrest.
Anaphase-Promoting Complex/Cyclosome (APC/C)
The APC/C is a multi-subunit E3 ubiquitin ligase and the master regulator of the
metazoan cell cycle. Ubiquitin ligases are proteins which covalently append a small regulatory
protein called ubiquitin (34) to the lysine residues of target proteins. Most commonly, this leads
to polyubiquitylation (attachment at least four ubiquitin molecules), which marks the target
protein for degradation by the 26S proteasome (33).
The APC/C exists in two major forms: APC/CCdc20
– APC/C bound to the activator cell
division cycle 20 homolog (Cdc20), and APC/CCdh1
– APC/C bound to the activator Cdh1 (also
called HCT1 or fizzy-related protein). APC/CCdc20
regulates the cell during mitosis and is needed
for metaphase assembly, initiating anaphase, continuing anaphase and telophase, and exiting

10
telophase (see the figure below). The APC/CCdh1
is responsible for regulating exit from mitosis,
G1, and possibly G2 phase.
One substrate of the APC/CCdc20
is cyclin B, which is degraded in a polyubiquitylation
pathway and signals the end of mitosis (14; 17). Cyclin-dependent kinase 1 (Cdk1) is activated
by cyclin B and phosphorylates proteins needed for mitosis (28). After the APC/CCdc20
degrades
cyclin B through anaphase and telophase, Cdk1 becomes deactivated (30). This deactivation
process is necessary to end mitosis (28).
(adapted from Heilman, 2006 and Peters, 2006)
The APC/CCdc20
also initiates anaphase: the rapid, total and irreversible separation of
sister chromatids. The APC/CCdc20
allows for the degradation of securin, a protein inhibitor of the
cysteine protease separase (30). Upon securin degradation, separase is activated and degrades a

11
protein complex called cohesin1. The breakdown of cohesin initiates the separation of sister
chromatids. However, it has been determined that the degradation of cohesin alone is not
sufficient to ensure proper chromosome separation.
There are other proteins necessary for proper chromosome alignment in metaphase,
which need to be degraded to complete anaphase. The protein Xkid was shown in Xenopus frogs
to be associated with the spindles holding chromosomes after the initial sister chromatid
separation (10). Xkid degradation from an APC/C proteolysis pathway is required for
chromosomes to reach the spindle poles (10). Interestingly, it is APC/CCdh1
, not the APC/CCdc20
,
that is involved in Xkid degradation.
In budding yeast, multiple proteins are involved in similar APC/CCdc20
or APC/CCdh1
-
dependent proteolysis, which allow for proper spindle assembly in metaphase and disassembly in
anaphase (11; 16; 19). Clearly, the APC/C function is diverse with respect to sister chromatid
separation in different cell types and species.
When sister chromatids are moving towards their spindle poles, Cdc20 is degraded by
APC/CCdh1
. APC/CCdh1
first serves the role of indirectly inactivating Cdk1, to ensure mitotic exit
(30). But the APC/CCdh1
remains active through G1. At the end of G1, Cdh1 gets phosphorylated
and dissociates. At this point (the start of synthesis), new cyclin proteins can be made without
being degraded (30). Therefore, the APC/C is integral to the entire cell cycle through its cyclin
degradation pathways. There are, however, proteins outside the APC/CCdh1
which may be
required for mitotic phase changes.
Cdh1 is activated by dephosphorylation by the protein phosphatase Cdc14. Cdc14 is
released in anaphase and telophase and initiates multiple pathways leading to the end of mitosis.
1 All eukaryotes follow this basic cohesin degrading process; however, vertebrates degrade most of their cohesin far
from the centrosome earlier in prophase and prometaphase by spindle activity.

12
Cdc14 dephosphorylates the cyclin-dependent kinase (CDK) inhibitor Sic1 and the transcription
factor Swi5. Dephosphorylation of Sic1 prevents SCF complex (a major ubiquitin ligase)
recognition of Sic1, thus stabilizing Sic1. Consequently, Swi5 dephosphorylation allows nuclear
transport and promotes Sic1 transcription. As Sic1 accumulates, mitotic CDKs are inactivated.
APC/CCdh1
may act with Sic1 activity to end mitosis (30). Many more SCF regulation pathways
exist (37).
Perhaps the most important APC/C-SCF pathway exists in G1 phase. At the end of G1, the
SCFSkp2
complex degrades the CDK inhibitors p21, p27, and p57, allowing the cell to transition
into S phase (4; 37). Low levels of CDK inhibitors, specifically p27, are linked to many cancers.
In G1, the APC/CCdh1
ubiquitylates the SCFSkp2
, which functions to hold the cell in G1 phase (4;
37).
Other substrates that bind the APC/C include protein kinases (Plk1, Cdc5), DNA replication
regulators (Geminin, Cdc6), and signaling molecules (SnoN). Phosphorylated APC/C has a
higher affinity for its activators, therefore phosphorylating pathways are predicted to regulate
some of the APC/C activity (26; 30).
Much about the APC/C functioning remains unclear. For example, although both Cdc20
and Cdh1 have WD40 repeats, their method of interacting with the APC/C has not been
identified so far. The exact mechanism of ubiquitin chain formation is not exactly known. It is
also uncertain why the APC/C is so large (at least 11 subunits). The APC/C is likely to take part
in more molecular mechanisms that have not yet been understood. And most importantly, more
information on APC/C involvement in different types of cancers is needed.

13
HTLV-1 Tax and the APC/C
It has been shown that Tax binds and activates APC/C ahead of its regular schedule in the
cell cycle, causing premature degradation of cyclin A, cyclin B1, securin and Skp2 during S
phase (20; 25) (see the diagram below). Skp2 in particular is degraded remarkably early, as it is
normally degraded by APC/CCdh1
in G1 phase. Reduction in the levels of these regulators causes
the cells to go through an erroneous cell division and become permanently growth-arrested in G1
phase. Cells in this condition are virtually undistinguishable from cells committed to senescence
(20).
(adapted from Kuo and Giam, 2006)
Although Tax-induced senescence is phenotypically identical to natural cellular
senescence, it arises by a different mechanism. Tumor suppressors pRb and p53 are known to be
involved in natural cellular senescence (15); however, Tax-induced senescence can occur in

14
HeLa cells, which lack these functioning tumor suppressors (20). A proposed mechanism for
Tax-induced senescence is that Tax prematurely activates the APC/CCdc20
, Skp2 is
polyubiquinated and degraded from S phase on, SCFSkp2
is inactivated, p21C1p1/WAF1
and p27K1P1
are stabilized, and this commits a cell to senescence (25). Finding potential binding sites on both
Tax and APC/CCdc20
could help to validate and improve this theory.
It is likely that other proteins need to be mutated to allow a Tax infection to lead to
transformation rather than senescence. HTLV-1-transformed cell lines have low levels of p27K1P1
and cells that lack functioning p27K1P1
can maintain Tax without experiencing senescence (20).
Therefore, a loss of functional p27K1P1
in the host cell may be what links Tax to transformation.
Current Study
The fact that Tax-induced senescence can be observed in transformed cells (e.g. HeLa)
makes it an important topic in cancer research. Incidentally, the phenotype was also observed in
yeast cells. The goal of this study is to express Tax truncation mutants in S. cerevisiae to
determine which parts of the protein need to be removed in order to obtain a loss-of-function
phenotype (lack of growth arrest that wild type Tax is supposed to induce). These findings can
be used to confirm that Tax binds the APC/CCdc20
, and to estimate the location of the interaction
site.

15
Materials and Methods
PCR
Wild type tax and tax truncation mutants were amplified by PCR using Taq polymerase
and Novagen 10X NovaTaq Buffer with MgCl2 (Cat. No. 71037) at 95°C for 4 min, then 30
cycles of 95°C for 30 sec, 55°C for 30 sec, and 72°C for 1.5 min. Tax wild type clones were
obtained from tax DNA template provided by Dr. Destin Heilman (Worcester Polytechnic
Institute, Worcester, MA, USA). Forward primers started at nucleotides that encode codons 1
and 89 and both primers contained a BamHI restriction site, a start codon in frame with the Tax
protein sequence, and a FLAG-tag DNA sequence. Reverse primers ended at nucleotides that
encode codons 177, 265, and 353 and each reverse primer contained an EcoRI restriction site and
a stop codon in frame with the Tax protein sequence. The exact primer sequences are listed in the
table below. Forward primers are the first two, the last three are the reverse primers, the colored
regions are the conserved sequences, and the underline represents the FLAG tag-encoding
region.
The PCR products were resolved on a 0.9% agarose gel; bands were excised and purified
with a gel purification kit (Promega Wizard Cat No. A7170) according to the manufacturer’s
protocol.
pGEM-T vector amplification
The purified products were ligated into the plasmid vector pGEM-T. The products were
transformed into DH5α E. coli and selected on ampicillin plates (LB). Plasmids were amplified
5’ GCG GAT CCT AAC CAT GGA TTA CAA GGA TGA CGA CGA TAA GAT GGC CCA CTT CCC AGG GTT TGG AC 3’
5’ GCG GAT CCT AAC CAT GGA TTA CAA GGA TGA CGA CGA TAA GCT TAC CCC GCC AAT CAC TCA TAC 3’
5’ CGG AAT TCT CAG CCG GGG TGG CAA AAA ATC AC 3’
5’ CGG AAT TCT CAG CCA TCT TTA GGG CAG GGC CC 3’
5’ CGG AAT TCT CAG ACT TCT GTT TCT CGG A 3’

16
using a standard alkaline lysis miniprep protocol (resuspension in pH 8.0, 50 mM glucose, 25
mM Tris-HCl, 10 mM EDTA, autoclaved; lysis in 0.2N NaOH, 1% SDS; neutralization in pH
4.92, 5M acetate buffer) with an additional 70% ethanol wash step after the 100% ethanol
precipitation. Tax mutants were digested with BamHI and EcoRI for 1hour at 37° and gel-
purified with MP Biomedicals Geneclean Kit (Cat. No. 1001-200) according to the
manufacturer’s protocol.
p424GAL1 cloning and vector amplification
The purified products were ligated into the p424GAL1 plasmid (Mumberg, Müller, Funk,
1994) using a rapid ligation buffer (Promega T4 DNA ligase). The products were transformed
into DH5α E. coli and selected on ampicillin. Positive clones were screened by restriction digest
(as described earlier) and colony PCR (resuspended colony in 1X TE Buffer, PCR with original
primers and using the resuspended colony solution as template) and amplified via midiprep
(Promega Wizard Plus Midiprep Kit Cat. No. A7640, according to the manufacturer’s protocol).
Both the restricition digest and the colony PCR were run on agarose gels.
S. cerevisiae transformation and growth
Plasmids were transformed into Y187 strain of S. cerevisiae using a lithium acetate
protocol (resuspension in 100mM LiAc; transformation in 34% w/v PEG, 1M LiAc, .14mg/mL
single stranded carrier DNA, 0.28-28ng/mL plasmid). The starter culture (50mL) was incubated
at 30°C overnight and the large-scale culture (300mL) was incubated at 30°C until the
Absorbance at 600nm was 0.6. 300µL of the transformation product was plated and selected on
tryptophan deficient (Trp-) YPD plates (1% (m/v) yeast extract, 2% peptone, 2%

17
glucose/dextrose, 2% agar). Tax and truncation expression was induced by growth on
rafinose/galactose (2.0/0.2% respectively) media and growth was monitored in comparison to
growth on glucose media.

18
Results
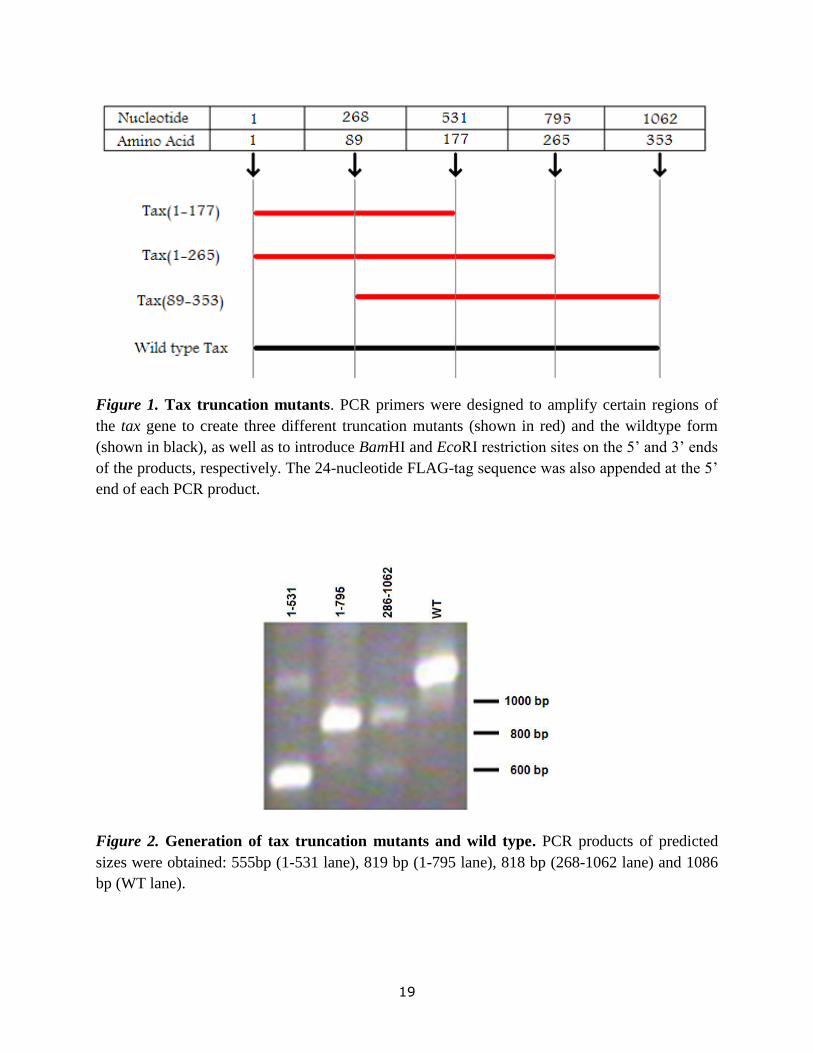
To determine the senescence-inducing domain of the Tax protein, truncation mutants
were expressed in S. cerevisiae. In order to encode the wild type and truncation mutant proteins,
the first step was to create wild type and truncation mutant genes via PCR. The PCR reactions
utilized appropriate primers to generate fragments encoding the 8-amino acid long FLAG-tag
sequence and BamHI and EcoRI restriction sites at the 5' and 3' ends, respectively. The primers
were designed to create truncation mutants of the N-terminal 177 amino acids, N-terminal 265
amino acids and C-terminal 264 amino acids. Including the FLAG-tag sequences, these tax
variants are predicted to be 555, 819, 818 and 1086 nucleotides in length and encode the proteins
Tax(1-177), Tax(1-265), Tax(89-353), and Tax (all including the FLAG-tag sequence)
respectively (see Figure 1). In gene form these will be referred to as 1-531, 1-795, 268-1062, and
wild type tax respectively. The PCR reactions were separtated on an agarose gel (Figure 2) and
the resulting bands were excised and purified. The 1-531 lane revealed a band slightly less than
600 base pairs, the 1-795 and 268-1062 lanes each revealed a band slightly greater than 800 base
pairs, and the wild type tax lane revealed a band slightly greater than 1000 base pairs. These
band sizes indicate that the PCR reactions created the correct tax variants.
19
Figure 1. Tax truncation mutants. PCR primers were designed to amplify certain regions of
the tax gene to create three different truncation mutants (shown in red) and the wildtype form
(shown in black), as well as to introduce BamHI and EcoRI restriction sites on the 5’ and 3’ ends
of the products, respectively. The 24-nucleotide FLAG-tag sequence was also appended at the 5’
end of each PCR product.
Figure 2. Generation of tax truncation mutants and wild type. PCR products of predicted
sizes were obtained: 555bp (1-531 lane), 819 bp (1-795 lane), 818 bp (268-1062 lane) and 1086
bp (WT lane).

20
To facilitate cloning the inserts the into the target vector, pGEM-T from Promega, was
used as a subcloning vector. T-vector ligation provides additional sequence around the restriction
sites in order to facilitate binding of restriction enzymes. Specifically, T-vector is designed with
overhanging T bases that ligate easily to the As on both 3’ ends of PCR products (18). After
ligation, a T-vector restriction digest will drop out products with the correct sticky ends for
ligation into the target vector. T-vector ligation was completed using the manufacturer's protocol
and amplified with an alkaline lysis miniprep protocol. The miniprep results were confirmed in a
restriction digest using BamHI-only, EcoRI-only, and negative controls. This was run on an
agarose gel (Figure 3). The tax variant lanes each had a lower band of comparable size to the
corresponding PCR band results and an upper band of comparable size to T-vector. This
indicates successful ligation of the inserts into T-vector.
To allow inducible expression and selection for the tax variants, the inserts were then
cloned into the inducible target vector p424GAL1 (27), which includes a TRP1 marker and
galactose-inducible promoter (GAL1). Correct ligation was verified using a restriction digest
(Figure 4) and a colony PCR (Figure 5), which were both run on agarose gels to confirm correct
band sizes. In the restriction digest, the 1-531, 1-795, 268-1062, and wild type tax lanes each
showed a lower band of comparable size to the corresponding PCR gel bands and each showed a
similar upper band greater than 6000 base pairs. A native vector control was also digested and
showed only 1 band, which was analogous in size to the upper 6000 base pair band in the other
results. The colony PCR gel revealed equivalent sized bands to the PCR bands and restriction
digest lower bands. This indicates successful ligation of the inserts into p424GAL1.

21
Figure 3. Restriction digest confirmation of T Vector ligation. The purified PCR products
were cloned into the 2µ target vector p424GAL1 (lane p424GAL1) using BamHI and EcoRI
restriction sites. Correct ligation was confirmed by a double digest. Dropout band sizes match the
PCR band sizes in Figure 2.
Figure 4. Restriction digest confirmation of p424GAL1 ligation. The purified products from
T vector were cloned into the 2µ target vector p424GAL1 (lane p424GAL1) using BamHI and
EcoRI restriction sites. Correct ligation was confirmed by a double digest. Dropout band sizes
match the PCR band sizes in Figure 2 and the dropout band sizes in Figure 3.
Figure 5. Colony PCR of ligated p424GAL1. The ligation of tax inserts into p424GAL1 was
also confirmed with a colony PCR. Dropout band sizes match the cooresponding band sizes in
Figures 2, 3 and 4.

22
In order to express the tax variants in yeast, the four tax variant-containing and native
ligated vectors were transformed into the cells using LiOAc protocol, and positive transformants
were selected for using Trp- media. This was re-plated on a single Trp
- plate with a parent
(untransformed) Y187 negative control (Figure 6). Panels 1-4 correspond to Y187 transformed
with plasmid encoding for Tax(1-177), Tax(1-265), Tax(89-353), and Tax respectively. Panel 5
contains Y187 transformed with native plasmid and panel 6 contains the negative control
untransformed Y187. Panels 1 through 5 exhibit noticeable and comparable levels of growth,
while panel 6 indicates no growth of the Y187. This indicates that the vector was successfully
transformed into the Y187.
In order to express the Tax variants in yeast for phenotype analysis, the transformed yeast
from the Trp- selection were induced using galactose. Concurrently, yeast growth was confirmed
on glucose, which did not induce the GAL1 promoter. Colonies from the Trp- plates were
streaked onto glucose (see Figure 7A) and rafinose/galactose plates (7B). Panels 1 through 5
correspond to the same transformed yeast as the Trp- plate, and panel 6 was left empty on both
plates. Panels 1-5 had appreciable growth on the glucose plate. The growth of the wild type Tax-
and Tax(89-353)-containing Y187 panels might be lower than the other panels on the glucose
plate.
After 3 days on galactose, there was a clear growth arrest of Y187 expressing wild type
Tax. The growth of Y187 expressing Tax(1-177) was at least comparable to the native vector-
expressing cells. There was also a possible reduced growth phenotype of Y187 expressing
Tax(89-353) or Tax(1-265) in comparison to native vector containing Y187, although neither
had growth as low as Y187 expressing wild type Tax. Tax(89-353) had noticeably less growth
than Tax(1-265).

23
Figure 6. S. cerevisiae transformation and TRP1 selection. Strain Y187 S. cerevisiae were
transformed with p424GAL1 plasmid containing various forms of the tax gene (see Figure 1) and
plated on Trp- dropout media. Positive transformants were obtained for each tax truncation
mutant and for the wild type (panels 1-4), as well as for Y187 transformed with native
p424GAL1 (panel 5). Untransformed Y187 were also plated as a negative control (panel 6).
(1) p424GAL1-Tax(1-177). (2) p424GAL1-Tax(1-265). (3) p424GAL1-Tax(89-353). (4)
p424GAL1-Tax. (5) p424GAL1. (6) Y187, no plasmid.
Figure 7. Galactose induction of Tax expression. The colonies from Figure 6 were plated in
parallel on glucose- and rafinose/galactose-containing media (A and B, respectively). The order
of panels 1-5 is identical to Figure 6 and panel 6 was left blank on both plates. (A) All positive
clones from Figure 2 showed ample growth on glucose media. (B) The presence of galactose
induced expression of the four Tax variants from the p424GAL1 plasmids, resulting in differing
growth phenotypes.

24
Discussion
Truncation mutants of the HTLV-1 protein Tax were created in an attempt to map the
cellular senescence-inducing domain, suspected to be the site of direct interaction of Tax with
APC/CCdc20
. The data obtained suggests that this domain is located somewhere in the C-terminal
half of the protein (amino acids 177-353).
The truncation mutants generated using PCR were shown using agarose gel
electrophoresis (Figure 2) to have the predicted sizes of approximately 555 (lane 1-531), 819
(lane 1-795), 818 (lane 268-1062), and 1086 nucleotides (WT lane)1. This indicates that the PCR
yielded the correct tax variants. The colony PCR (Figure 5) and double digest (Figure 4) agarose
gels confirm that the tax variants were successfully cloned into the 2µ target vector p424GAL1:
the band sizes from lanes 1-531 to WT in Figures 4 and 5 are clearly the same sizes as their
respective bands in Figure 2. The growth of the plasmid-containing S. cerevisiae on the Trp-
dropout media (Figure 6, panels 1-5) confirms that the plasmid constructs were successfully
transformed into the yeast. Yeast in panels 1-4 were transformed with p424GAL1 containing 1-
531, 1-795, 286-1062 and WT inserts, respectively. Panel 5 shows yeast transformed with an
empty p424GAL1 (no insert). In contrast, the untransformed Y187 yeast in panel 6 did not
survive the selection.
Figure 7 compares growth of yeast transformed with different Tax variants (A) on
glucose and (B) on rafinose/galactose media. Figure 7A demonstrates that growth of all
transformants before Tax induction is identical to native p424GAL1-containing yeast. The
potentially lower growth of wild type Tax- and Tax(89-353)-containing Y187 on glucose (in
comparison to the other glucose panels) may be due to basal levels of transcription of the tax
1 Each fragment also contains the FLAG-tag at the N-terminus, which adds 24 nucleotides to the length of each of
the Tax variants.

25
variants by the GAL1 promoter in a non-induced environment. This would be consistent with the
two yeast strains having the most potent protein products in terms of growth arrest on galactose
plates. Additionally, as can be clearly seen in Figure 7B, panel 4, it has been confirmed that wild
type tax-transformed S. cerevisiae demonstrate a complete growth arrest phenotype.
Growth of yeast expressing Tax(1-177) truncation at a level comparable to native
p424GAL1-transformed yeast possibly indicates that the Tax domain responsible for inducing
cellular senescence has been deleted in this construct. Presence of reduced growth of Tax(89-
353)- and Tax(1-265)-expressing yeast seems to indicate that these mutants retained the cellular
senescence domain at least to some degree. The above data suggests that the domain responsible
for inducing growth arrest phenotype could be located in the C terminus of Tax, in the general
area between amino acids 177 and 265.
Interestingly, Tax(1-265) retained some growth. This phenotype could be the result of
truncating the senescence-inducing domain of Tax. If the domain of interest included amino
acids surrounding amino acid 265, then the truncated domain in Tax(1-265) could induce a low
level of senescence, resulting in the medium-sized growth observed in Figure 7B, panel 2.
Additionally, the medium-sized growth could be related to the loss of the transactivation domain
in the 265-353 region of Tax. The transactivation domain may regulate expression of genes
important to the proposed APC/C activation pathway. This is possible because APC/C activation
pathways involve many proteins important to changes in the cell cycle, and changes in the cell
cycle often involve transcription of specific genes. Overall, Tax(1-177)- and Tax(89-353)-
containing Y187 seem to reveal clearer results.
It is curious that growth of Tax(89-353) was not completely arrested, as this Tax variant
contains the entire C-terminal half of Tax, which includes the proposed binding region.

26
However, this is potentially because Tax(89-353) is missing the nuclear import domain of Tax
and the APC/CCdc20
(the proposed binding site of the senescence-inducing domain of Tax) is
primarily located in the nucleus. Therefore, it is possible that Tax(89-353)-APC/C interactions
were lower than wild type Tax-APC/C interactions, allowing for minimal growth of the cells.
A different study created point mutants of tax to observe which ones could eliminate the
senescence-inducing ability of Tax in S. cerevisiae (25). There were 24 identified amino acids
found to destroy the senescence-inducing ability of Tax, which spanned the entire range of the
protein. This indicates that changing any one of many Tax domains can reduce the senescence-
inducing ability. This supports the notion that Tax(89-353) can contain the senescence-inducing
domain, but have reduced senescence-inducing ability because of other missing domains.
Seven of the point mutations involved amino acids in the nuclear localization domain,
which may have destroyed the nuclear localization domain function, thus lowering the Tax-
APC/C interactions and therefore lowering the cell cycle arrest activity of Tax like is proposed
for Tax(89-353) above. Two of the point mutations were in the transactivation domain and may
have reduced cell-cycle arrest ability of Tax in a mechanism like the proposed one above for
Tax(1-265). Which is logical because both of these point mutations (in addition to eight others)
were found to have impaired Tax transactivation activities.
The other 15 point mutations are possibly important to nearby domain folding patterns or
stabilizing phosphorylation sites. Another possibility is the point mutations are part of an
unidentified domain of Tax, which helps the cell-cycle arrest inducing ability of Tax.
Additionally, the point mutations may be part of the cell-cycle arrest inducing domain itself.
As proposed by Merling et al., the cell arrest-inducing domain may be independent of
transactivation, CREB, and CBP domain, because nine of the mutants that lost the cell-arrest

27
function maintained transactivation, CREB and/or CBP activities1. This suggests that the
senescence-inducing domain of Tax is independent of the transactivation, CREB and CBP
domains. A different study showed found six point mutations which changed the transactivation
activity of Tax expressed in mammalian cells (9)2.
Yet another study showed that when expressed in mammalian cells, the serines at 300 and
301 are sites of phosphorylation and are required for the Tax localization to the nucleus and
CREB and NF-κB activation from the transactivation domain (5). All three studies above
changed amino acid 300, indicating that serine 300 is probably very important for wild type Tax
levels of CREB, transactivation, and senescence-inducing domain activities. Therefore, the loss
of serine 300 (such as in Tax(1-177) and Tax(1-265)) is one potential reason for the lowering,
but not loss, of the senescence-inducing ability of Tax.
Considering the number and range of domains and individual amino acids in Tax which
could have some effect on Tax senescence-inducing ability, a more systematic approach (such as
this study) is more ideal in determining the senescence-inducing domain of Tax. To narrow
down on the exact location of the APC/C binding domain, future studies will focus on creation of
truncation mutants encoding for sections of the C-terminal half of Tax, and eventually induce
specific point mutations in wild type tax with site-directed mutagenesis to change the amino
acids necessary for cell cycle arrest/APC/C binding without disrupting other Tax domains that
may be important for its function.
1 These mutants span the first three quarters of the protein. 2 no senescence-inducing ability of Tax is observed in the cell-type used in this study

28
References
1. Alefantis, T., P. Jain, J. Ahuja, K. Mostoller, and B. Wigdahl. 2005. J. Biomed. Sci. 12:
961-974.
2. Asante-Appiah, E., and A. M. Skalka. 1997. Antiviral Res. 36: 139-156.
3. Bampi, C., S. Jacquenet, D. Lener, D. Décimo, and J-L. Darlix. 2004. Int. J. Biochem.
Cell Biol. 36: 1668-1686.
4. Bashir, T., and M. Pagano. 2004. Cell Cycle 3: 850-852.
5. Bex, F., K. Murphy, R. Wattiez, A. Burny, and R. B. Gaynor. J. Virol. 1999. 73: 738-745.
6. Bukrinskaya, A. 2007. Virus Res. 124: 1-11.
7. Ching, Y-P., S-F. Chan, K-T. Jeang, and D-Y. Jin. 2006. Nat. Cell Biol. 8: 717-724.
8. Coffin, J., M., S.H. Hughes and H.E. Varmus. 1997. Retroviruses. Cold Spring Harbor
Laboratory Press.
9. Durkin, S., M. D. Ward, K. A. Fryrear, and O. J. Semmes. 2006. J. Biol. Chem. 281:
31705-31712.
10. Funabiki, H., and A. W. Murray. 2000. Cell 102: 411-424.
11. Gordan, D., M., and D. M. Roof. 2001. Proc. Natl. Acad. Sci. U. S. A. 98: 12515-12520.
12. Harrich, D., B. Hooker. 2002. Rev. Med. Virol. 12: 31-45.
13. Heilman, D. 2006. Ph.D. thesis. University of Massachusetts Medical School.
14. Hershko, A., D. Ganoth, J. Pehrson, R. E. Palazzo, and L. H. Cohen. 1991. J. Biol.Chem.
266: 16376-16379.
15. Hickman, E. S., M. C. Moroni, and K. Helin. 2002. Current Opinion Gene. Devel. 12: 60-
66.
16. Hildebrandt, E., R., M. A. and Hoyt. 2001. Molec. Bio. Cell 12: 3402-3416.
17. Hough, R., G. Pratt, and M. Rechsteiner. 1986. J. Biol.Chem. 261: 2400-2408.
18. Johnson, R. 1995. Promega Notes Magazine. 51: 26-27.
19. Juang, Y-L., J. Huang, J-M. Peters, M. E. McLaughlin, C-Y. Tai, D. and Pellman. 1997.
Sci. 275: 1311-1314.
20. Kuo, Y-L., and C-Z. Giam. 2006. EMBO J. 25: 1741-1752.
21. Liang, M-H., T. Geisberg, Y. Yao, S. H. Hinrichs, and C-Z. Giam. 2002. J. Virology 76:
4022-4033.
22. Liu, B., M-H. Liang, Y-l. Kuo, W. Liao, I. Boros, T. Kleinberger, J. Blancato, C-Z. and
Giam. 2003. Mol. Cell. Bio. 23: 5269-5281.
23. Liu, B., S. Hong, Z. Tang, H. Yu, and C-Z. Giam. 2005. Proc. Natl. Acad. Sci. U. S. A.
102: 63-68.
24. Matsuoka, M., and K-T. Jeang. 2007. Nat. Rev. Cancer 7: 270-280.
25. Merling, R., C. Chen, S. Hong, L. Zhang, M. Liu, Y-L. Kuo, and C-Z. Giam. 2007.
Retrovir. 4: 35.
26. Morgan, D., O. 1999. Nat. Cell Bio. 1: E47-E53.
27. Mumberg, D., R. Müller, and M. Funk. 1994. Nuc. Acids Res. 22: 5767-5768.
28. Murray, A., W. 2004. Cell 116: 221-234.
29. Nolan Lab. Tutorials – Retroviruses and their Applications. Stanford University: Medical
Center, Stanford, CA. http://www.stanford.edu/group/nolan/tutorials/tutorials.html
30. Peters, J-M. 2002. Molec. Cell 9: 931-943.
31. Peters, J-M. 2006. Nat. Rev. Mol. Cell Biol. 7: 644-656.

29
32. Poiesz B.J., F.W. Ruscetti, A.F. Gazdar, P.A. Bunn, J.D. Minna, and R.C. Gallo. 1980.
Proc. Natl. Acad. Sci. 77: 7415-19.
33. Springael J-Y., J-M. Galan, R. Haguenauer-Tsapis and B. André. 1999. J. of Cell Sci.
112: 1375-1383
34. Stone, S., L., and J. Callis. 2007. Current Opinion Plant Bio. 10: 624-632.
35. Swanson, C., M., and M. H. Malim. 2006. Traffic 7: 1440-1450.
36. Verdonck, K., E. González, S. V. Dooren, A-M. Vandamme, G. Vanham, and E.
Gotuzzo. 2007. Lancet Infect. Dis. 7: 266-281.
37. Vodermaier, H. C. 2004.Curr. Biol. 14: R787-R796.
38. Wu, K., M. E. Bottazzi, C. d. l. Fuente, L. Deng, S. D. Gitlin, A. Maddukuri, S. Dadgar,
H. Li, A. Vertes, A. Pumfery, and F. Kashanchi. 2004. J Biol. Chem. 279: 495-508.


