
DI
SC
US
SI
ON
P
AP
ER
S
ER
IE
S
Forschungsinstitut zur Zukunft der ArbeitInstitute for the Study of Labor
Managerial Incentives and Favoritism inPromotion Decisions: Theory and Field Evidence
IZA DP No. 5543
March 2011
Johannes BergerClaus HerbertzDirk Sliwka

Managerial Incentives and Favoritism in Promotion Decisions:
Theory and Field Evidence
Johannes Berger University of Cologne
Claus Herbertz University of Cologne
Dirk Sliwka
University of Cologne and IZA
Discussion Paper No. 5543 March 2011
IZA
P.O. Box 7240 53072 Bonn
Germany
Phone: +49-228-3894-0 Fax: +49-228-3894-180
E-mail: [email protected]
Any opinions expressed here are those of the author(s) and not those of IZA. Research published in this series may include views on policy, but the institute itself takes no institutional policy positions. The Institute for the Study of Labor (IZA) in Bonn is a local and virtual international research center and a place of communication between science, politics and business. IZA is an independent nonprofit organization supported by Deutsche Post Foundation. The center is associated with the University of Bonn and offers a stimulating research environment through its international network, workshops and conferences, data service, project support, research visits and doctoral program. IZA engages in (i) original and internationally competitive research in all fields of labor economics, (ii) development of policy concepts, and (iii) dissemination of research results and concepts to the interested public. IZA Discussion Papers often represent preliminary work and are circulated to encourage discussion. Citation of such a paper should account for its provisional character. A revised version may be available directly from the author.

IZA Discussion Paper No. 5543 March 2011
ABSTRACT
Managerial Incentives and Favoritism in Promotion Decisions: Theory and Field Evidence
This paper investigates the effects of managerial incentives on favoritism in promotion decisions. First, we theoretically show that favoritism leads to a lower quality of promotion decisions and in turn lower efforts. But the effect can be mitigated by pay-for-performance incentives for managers who decide upon promotion. Second, we analyze matched employer-employee survey data with detailed firm level information on managerial incentive schemes and find that perceived promotion quality is indeed substantially higher when managers receive performance-related pay or participate in gain sharing plans. JEL Classification: J33, M51, M52, M54, J71 Keywords: incentives, favoritism, nepotism, tournaments Corresponding author: Dirk Sliwka University of Cologne Herbert-Lewin-Str. 2 50931 Köln Germany E-mail: [email protected]
1 Introduction
In most jobs work performance is not perfectly re�ected in objective perfor-
mance measures. As a consequence superiors are often asked to rate their
subordinates subjectively, which gives them the possibility to favor one sub-
ordinate over another. As a consequence, performance appraisals may be
biased, not re�ecting actual work performance but the supervisor�s personal
preferences for her subordinates. If internal promotion decisions are based
on subjective performance appraisals, favoritism may eventually result in not
promoting the best but those who are best liked.
To avoid favoritism, pay and promotions are sometimes solely determined
by seniority and other bureaucratic rules which of course also bear the risk
of poor promotion decisions (Prendergast and Topel (1996), Marsh (1960)).
Another solution has been suggested by Prendergast and Topel (1993) who
claim that �a means of aligning the supervisor�s incentives with those of
the organization is to tie rewards to promotion and to make the supervisor
responsible for the output of the job to which his subordinates are promoted�
(Prendergast and Topel (1993), p. 360).
In this paper we investigate this idea in detail and analyze the relation-
ship between managerial incentives and promotion decisions. First, we the-
oretically explore the e¤ect of favoritism on managers�promotion decisions.
Favoritism indeed leads to poor promotion decisions as the more able subor-
dinate is less likely promoted. Workers anticipate their superior�s bias and
reduce e¤orts in promotion tournaments. Thus favoritism not only harms
the company ex-post by putting the wrong people into management positions
but it also reduces e¤ort supply and therefore expected company earnings ex-
ante. Tying the manager�s salary to workers�performances makes favoritism
costly and leads to better promotion decisions.
For testing theoretically predictions, we use a unique employer-employee
matched data set collected on behalf of the German Federal Ministry of
Labor and Social A¤airs by the Great-Place-to-Work Institute, a company
2

specialized in conducting employee surveys, in 2006. The data set is a repre-
sentative sample of 305 German �rms containing company-level information
on management practices. In addition, in each of the �rms an employee-
survey has been conducted containing detailed information about employee
perceptions of approximately 36,000 individuals. In contrast to researchers
who try to assess promotion quality as an outsider to the �rm, employees
have inside knowledge and are in a good position to judge whether indeed the
best people are promoted. We thus focus on a standardized item contained
in the employee-survey which measures if "promotions go to those who best
deserve them". In our analysis we use aggregated employee responses to this
item to compare promotion quality across companies.
Indeed, we �nd that the quality of promotion decisions is signi�cantly
higher in �rms in which managerial incentive schemes are used. Furthermore,
the data suggest that even lower powered incentive schemes su¢ ce to reduce
favoritism in promotions which is well in line with the predictions of the
formal model.
The remainder of the paper is organized as follows. In the next section
we summarize the related literature. In section 3 we analyze our theoretical
model to derive predictions on the consequences of managerial pay for pro-
motion decisions. Section 4 describes our data set and the main variables
used for our empirical analysis. Section 5 includes our main empirical results
while section 6 discusses our results and summarizes our main �ndings.
2 Related Literature
The role of favoritism and social connectivity in �rms has gained consider-
able attention in theoretical economic research in recent years. Prendergast
and Topel (1996) were among the �rst to point out that personnel pref-
erences towards employees may lead to favoritism and biased performance
appraisals in �rms. In their model supervisors derive utility from biasing
3

performance appraisals according to individual preferences. High powered
worker incentives lead to a stronger bias in performance evaluations. Further-
more, favoritism leads to a misallocation of workers to jobs and a distortion
in incentives. Disentangling workers�pay from performance appraisals and
introducing pure bureaucratic rules may constrain favoritism in their model.
Prendergast (2002) extends this framework and shows that when performance
appraisals become generally less valuable under uncertainty, the additional
costs of favoritism associated with an increase in worker incentives are low.
However, both papers do not study the connection between managerial in-
centive schemes and favoritism, which is the key focus of our paper.
There are also some empirical studies on the potentially harmful in�uence
of favoritism. Longenecker et al. (1987) and Bjerke et al. (1987), for instance,
examined determinants of performance evaluations in a US company and
the US Navy respectively. Both studies claim that political considerations
rather than true performance are re�ected in subjective evaluations. This
is especially true if performance appraisals are tied to bonuses. Ittner et al.
(2003) analyze a balanced scorecard bonus plan which is based on supervisors�
subjective evaluations. Even if �nancial measures for evaluating subordinates
are available, supervisors�discretion leads to strong favoritism in employees�
bonus payments in the studied company and �nally to the abolishment of
the scorecard. Breuer et al. (2010) analyze personnel data from a call center
organization arguing that social ties triggered by repeated interaction or
small team size lead to biased performance evaluations by supervisors.
Several other studies have examined resta¢ ng decisions in the presence
of family ties, which can be seen as a prominent case of favoritism in �rms.
Pérez-González (2006) report a faster career as well as higher wages for fam-
ily members in family �rms. Kramarz and Skans (2007) �nd that young
Swedish men frequently work in their father�s plant while having higher ini-
tial wages and worse school grades than comparable colleagues. Bennedsen
et al. (2007), Pérez-González (2006) and Vilallonga and Amit (2006) also
4
�nd that CEO family succession leads to a signi�cant drop in family �rm
performance displaying the ine¢ ciencies caused by favoritism in succession
and promotion politics.1
While the existence and negative in�uence of favoritism is well docu-
mented, possible remedies for it are less intensely studied. One remarkable
recent exception is Bandiera et al. (2009) who analyze an exogenous change
from a �xed wage to bonus scheme for supervisors in a large agricultural
company. Under �xed wages managers favor socially connected workers by
granting them a stronger support which leads to a large productivity gap
between socially connected and socially unconnected workers. When super-
visors receive a bonus based on workers�output they reallocate their support
towards high ability workers causing a signi�cant overall increase in produc-
tivity. We show that managerial bonus payments also substantially a¤ect
the quality of promotion decisons and provide evidence based on a large and
representative sample of �rms.
Finally, by combining survey data on management practices with more
objective information across larger samples on di¤erent �rms our paper adds
to the emerging literature on investigating key issues in personnel economics
and the economics of organizations as for instance recently advocated in
Bloom and Van Reenen (2007).2
3 The Model
We consider a 3 stage model with a top manger M and two heterogeneous
agents i = A;B competing for a middle manger position. In the �rst period,
agents choose an unobservable e¤ort level eit and produce outputs
si1 = ai + ei1 + "i1 (1)
1Two exceptions to these �ndings are Sraer and Thesmar (2007) and Anderson andReeb (2003).
2See also Bloom and Van Reenen (2010).
5

where ai � N (ma; �2a=2) denotes agent i�s time invariant and unknown abil-
ity. The error term is also normally distributed with "i1 � N (0; �2"=2). Weassume ai and "i1 to be independent and their distributions to be common
knowledge. Providing e¤ort yields e¤ort costs c2e2i . Period 1 pro�t is given
by
�1 = sA1 + sB1:
In period 2 top manager M observes performances si1 and chooses which
agent � 2 fA;Bg is to be promoted to the middle manager position. Thepromoted agent receives a wage increase �w.
In period 3, agents choose their e¤ort level ei3, again produce si3 = ai +
ei3 + "i3 and generate company pro�t
�3 = k � s�3 + s��3 (2)
where s�2 and s��2 are the outputs of the promoted and non-promoted agent.
With k > 1 we assume a middle manager�s performance to have larger impact
on company pro�t.
The agents�utilities are simply the sum of their expected wages minus
their e¤ort costs. The top manager M�s wage is given by � + � � (�1 +�3)where � is a �xed wage and � measures the extent of pro�t sharing. Finally,
we assume that the top manager may personally like the two agents to a
di¤erent extent and therefore favor one over the other. Similar to Prendergast
and Topel (1996) and Prendergast (2002) she receives a utility from favoritism
of �� ��w such that the wage increase �w awarded to the promoted agentis weighted with a preference parameter �i. Hence, her overall utility is
�+ � � (�1 +�3) + �� ��w:
We assume M�s discount factor to be 1 and �i to be known by all players.
Furthermore, we take all compensation parameters with the exception of �
as given and focus on the connection between � and promotion decisions.
6

3.1 Equilibrium Analysis
We now determine the Perfect Bayesian Equilibrium. In the absence of in-
centives, agents choose zero e¤ort in stage 3 and produce according to their
ability (see equation 2). At stage 2 the topmanagerM�s conditional expected
utility for � 2 fA;Bg depends on agents�period 1 performances sA1 and sB1and is given by
VM (�; sA1; sB1) = E��+ � � (�1 +�3) + �� ��w j sA1; sB1
�= �+ �k � E [a� j s�1] + � � E [a�� j s��1] + �� ��w:
Hence, M promotes agent A if VM (A; sA1; sB1) � VM (B; sA1; sB1) or
E [aA j sA1]� E [aB j sB1] ��� ��w� (k � 1) (3)
where �� = �B � �A. In the absence of favoritism (�� = 0) the RHS
in equation 3 is zero. In this case, M�s decision is solely driven by her
expectations about agents�abilities and the agent who is expected to be more
able gets promoted. Hence, the model basically boils down to a standard
Lazear and Rosen (1981) type tournament model. Furthermore, pure ability
based promotion decisions maximize the company�s post promotional pro�t
in equation 2. If, however, favoritismmatters,M gains additional utility from
promoting the favored agent. The more M favors an agent, the more likely
it is that her promotion decision will not coincide with the pro�t maximizing
decision. Furthermore, the higher � the smaller this distortion will be which
leads to the �rst result:
Proposition 1 Higher powered incentive schemes reduce the manager�s in-clination to follow her private preferences in the promotion decision.
7

Anticipating M�s decision in 3 agent A�s expected utility is given by
UA = Pr
�E [aA j sA1]� E [aB j sB1] �
�� ��w� (k � 1)
��w � c
2e2A1:
The conditional expectation about agent i�s ability is given by
E [ai j si1] = ma +�2a
�2a + �2"
(ai + ei + "i1 �ma � bei1) (4)
where bei1 denotes M�s belief about agent i�s equilibrium e¤ort choice.3 Sub-
stituting M�s conditional expectation into agents�objective function yields
EUA = �
0@eA1 � eB1 � beA1 + beB1 � ����w�(k�1)
�2a+�2"
�2ap�2a + �
2"
1A�w � c
2e2A1
where � (�) is the c.d.f. of the standard normal distribution. If an internalequilibrium exists4, the agents�optimal symmetric e¤ort choices are therefore
given by
e�A;B =�w
cp2� (�2a + �
2")exp
�� ��2 ��w2
2�2 (k � 1)2(�2a + �
2")
�4a
�: (5)
From this equation we directly obtain our second result:
Proposition 2 The agents�equilibrium e¤ort levels are strictly decreasing inthe degree of favoritism �� and strictly increasing in the power of managerial
incentives �.
Favoritism towards subordinates does not only reduce future pro�ts as
on average less able agents are promoted. It also lowers ex-ante pro�ts as
3For the conditional expectation of normally distributed random variables see for in-stance DeGroot (1970) p.167.
4Existence can be assured when c is su¢ ciently large as the objective functions arethen strictly concave.
8

the agents anticipate that promotion decisions are note entirely driven by
performance considerations. This mechanism weakens the link between per-
formance and rewards and, in turn, makes exerting high e¤orts less attractive.
To illustrate the relationship between managerial incentives and promo-
tion quality we derive the ex-ante probability of promoting the more able
agent. Assume w.l.o.g. that �� > 0; i.e. agent B is favored by M . The
likelihood that indeed the agent is promoted who is expected to be more able
is given by
1� Pr�0 < Ean [aA j sA1]� Ean [aB j sB1] <
�� ��w� (k � 1)
�:
Inserting the conditional expectation (4) and simplifying yields that in equi-
librium this probability is equal to
3
2� Pr
��a+�" <
�2a + �2"
�2a
�� ��w� (k � 1)
�:
As from an ex-ante perspective �a+�" is normally distributed with mean
0 and variance 2�2a + 2�2" this probability is
3
2� �
�1
2�2a
�� ��w� (k � 1)
�: (6)
The function is monotonically increasing in � but becomes �at if � is su¢ -
ciently large.5 Figure 1 displays plots of function 6 for di¤erent degrees of
favoritism ��.6 Note that even at rather low levels of � the probability that
the wrong agent is promoted is 50% when there are no managerial incentives.
But in this case even very low powered incentive schemes su¢ ce to generate
substantial e¢ ciency gains. Of course, when the impact of favoritism is large
5Note that lim�!1@
�32��
�1
2�2a
����w�(k�1)
��@� = 0.
6Figure 1 shows graphs for w = 10; k = 3 and �2a = 5 for values of �� = 0:1; 0:2; or0:4.
9

0.0 0.1 0.2 0.3 0.4 0.5 0.6 0.7 0.8 0.9 1.00.0
0.1
0.2
0.3
0.4
0.5
0.6
0.7
0.8
0.9
1.0
Figure 1: Probability that more able agents are promoted as a function of �
higher values of � become necessary to reduce the bias.
4 Data and Hypotheses
Our data source is a 2006 employer-employee matched survey conducted by
the Great-Place-to-Work Institute and the German Federal Ministry of Labor
and Social A¤airs. The data set is a representative sample of 305 German
�rms employing a minimum of 20 workers. For each �rm the management
provided company-level information on organizational facts, strategic goals
and corporate values as well as on various management practices and the
structure of compensation. Most of this information is provided separately
for managers and workers in each �rm.7
In addition to this �rm-level information, a representative employee-
7More speci�cally, answers were provided for employees in supervisory function andthe largest group of nonmanagerial employees, i.e. the core occupational group.
10

survey was conducted at each sampled �rm yielding over 36,000 observations
in total. The employee survey includes 58 standardized items to be answered
on a 5-point Likert scale which are designed to measure the level of trust,
pride, and cooperation within �rms. More precisely the items focus on the
relationship among employees, between employees and management, and on
their work environment.
Due to the random sampling process the 305 �rms are almost evenly
spread across the di¤erent industries in Germany. The majority of the sam-
pled �rms are small or medium sized. While the average number of employees
amounts to 430, the median lies at 157. However, roughly 10% of the �rms
employ more than 1,000 workers including the largest �rm in the sample with
14,000 workers.
The management survey includes detailed information on the structure of
incentive pay in each �rm. Each management representative stated whether
wages for managers and workers in the corresponding �rm include a perfor-
mance related pay component. For both, managers and workers, we know
the share of the average wage (in %) determined by performance related pay
(henceforth PRP).8
Figure 2 gives a descriptive overview of PRP usage across industries dis-
playing the share of �rms using PRP for managers and workers. While only
less than half of all sampled �rms use variable pay components for workers,
the use of manager PRP varies from only 16% in the Public Sector to 90%
in Financial Services. In total 168 out of 296 (57%) �rms use PRP for their
managers.9
In addition to the information on the strength of performance related pay
8To be precise, the items are �Does the compensation of the employees encompass aperformance-based part? (yes/no)�and �How big is the variable share on average (in %)�and �What are the shares of the following measures of success in this variable compensationcomponent? (company success, success of the organizational unit (team, working group),personal performance, or other)�. It is important to note that this does not refer to theactual payments in the studied year but the general structure of the compensation scheme.
99 out of the 305 sampled �rms did not provide information on PRP.
11

0.2
.4.6
.81
Food I
ndus
try
Chemica
l Indu
stry
Metal In
dustr
y
Mecha
nical
Engine
ering
Automoti
ve In
dustr
y
Constr
uctio
n
Trade,
Mainten
ance
and R
epair
Logis
tics a
nd Tran
sport
ation
Financ
ial S
ervice
s
Busine
ss-re
lated
Serv
ices
Public
Adm
inistr
ation
Health
and S
ocial
Ass
istan
ceTota
l
Share of Firms with PRP for WorkersShare of Firms with PRP for Managers
Figure 2: Utilization of Performance related Pay across German Industries
components the management survey also includes information on whether
there is a gain sharing scheme or managers hold company assets. In contrast
to manager PRP this information is only provided as a binary variable which
we label as Manager Gain Sharing. 36 out of 295 (12%) �rms used such gain
sharing plans for their managers. Together with manager PRP this variable
will serve as our main independent variable in the upcoming analysis.10
Typically, it is very hard to assess the quality of promotion decisions em-
pirically. One reason is that the counterfactual, i.e. the performance of the
non-promoted employees on the considered position is never observable. Fur-
thermore, personnel records such as personal assessments or employee�s past
performances (data that are usually hard to obtain) may not reveal which
candidate best meets the requirements for the speci�c position to be �lled.
10Note that manager PRP and manager gain sharing are two di¤erent ways of tying man-agers�pay to company performance. The two variables show only a weak and insigni�cantcorrelation of r = 0:07.
12

However, employees in a company are in a good position to judge whether
indeed the best people are promoted. Of course each individual�s opinion is
in�uenced by speci�c personal experiences. But aggregating responses to a
standardized survey item across a large number of employees within a given
company should result in a reliable measure of promotion quality that can
be compared between companies.
Complementing the �rm level information provided by the management,
we therefore exploit the employee surveys conducted in each �rm to mea-
sure the quality of promotion decisions.11 The survey item �Promotions go
to those who best deserve them�measures the perceived promotion quality
within a �rm. The item is to be answered on a 5-point Likert scale ranging
from 1 �almost always untrue�to 5 �almost always true�and refers to the
company as a whole. On average 28.3% of all fulltime employees in our data
set a¢ rm this statement by choosing 4 or 5 on the 5 point scale (ticking the
�top boxes�).
According to our theoretical model presented in the previous section man-
agerial incentives should lead to a higher likelihood of promoting the better
employees as managers face a cost for promoting the personally favored over
the more able workers. To test this prediction preserving independence of
observations we use the share of a¢ rmative answers to the Promotion item
among all respondents within a �rm as a measure for the quality of internal
sta¢ ng decisions. The existence and strength of managers�pay for perfor-
mance and the existence of gain sharing plans are our main explanatory
variables. Table A1 in the appendix displays descriptive statistics of all in-
dependent variables.
11In �rms with less than 500 employees all employees were asked to participate. Inlarger �rms a representative 500-employee sample was drawn.
13

5 Results
In this section we present our main results. At �rst we look at the aggre-
gate data examining di¤erences between �rms with and without managerial
incentives. Afterwards we explore the e¤ects of the strength of managerial
incentives and their relation to the quality of promotion decisions.
5.1 Aggregate Data
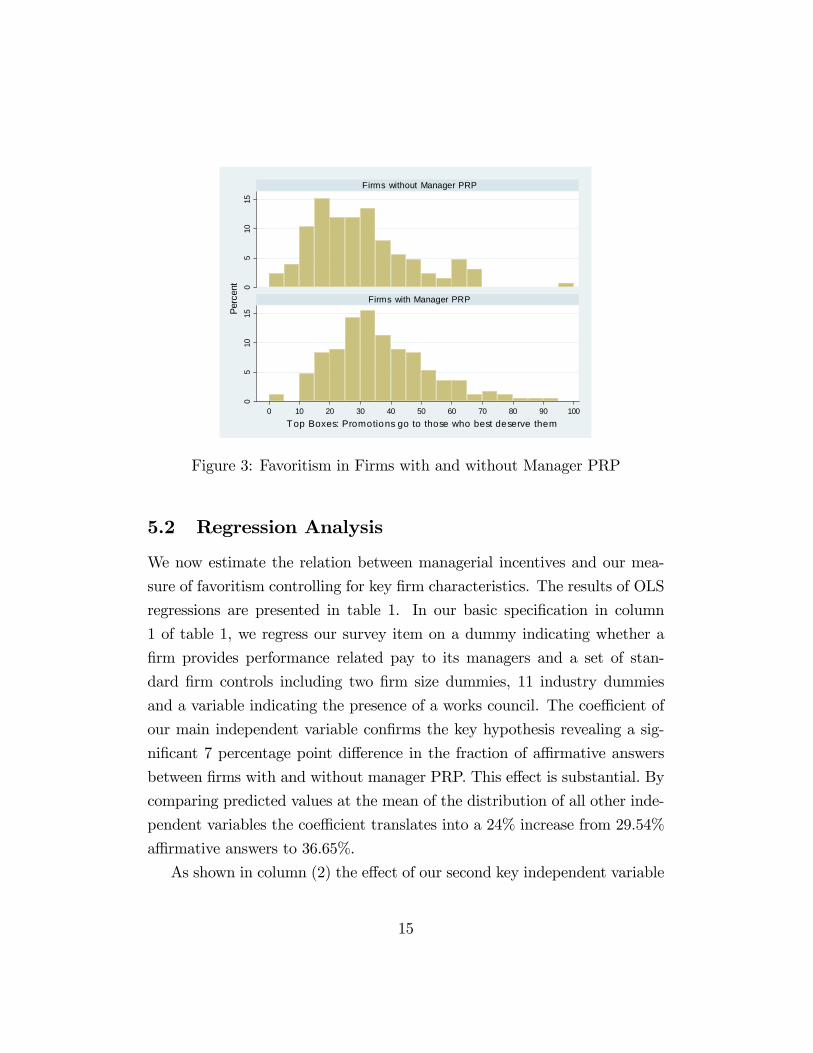
First, we contrast the emperical distributions of our main survey item in
�rms with and without managerial incentives. Figure 3 depicts the two dis-
tributions and reveals a clear di¤erence as the percentage of workers agreeing
to the item "Promotions go to those who best deserve them" is much larger
in �rms with manager PRP than in �rms without such incentives.12 Ac-
cording to a two-sample Kolmogorov-Smirnov the data do not stem from the
same distribution (p = 0:003). The di¤erence in the average percentage of
a¢ rmative answers is as large as 6.3 percentage points and also signi�cant
applying a simple t-test (p = 0:0015). This notable di¤erence is in line with
our theoretical prediction suggesting that the quality of promotion decisions
is indeed higher when �rms provide PRP for their managers.
Repeating the analysis for �rms with and without manager gain sharing
plans reveals very similar results. Figure A1 displays a highly signi�cant
9.5 percentage point di¤erence in a¢ rmative answers (t-test, p = 0:0014;
KS-Test, p = 0:005).
12Note that analyzing means rather than shares of a¢ rmative answers leads to verysimilar results. Here and in the further analysis we use the share of a¢ rmative answers(top boxes) rather than means in order to facilitate the economic interpretation of thecoe¢ cients.
14
05
1015
05
1015
0 10 20 30 40 50 60 70 80 90 100
Firms without Manager PRP
Firms with Manager PRP
Perc
ent
Top Boxes: Promotions go to those who best deserve them
Figure 3: Favoritism in Firms with and without Manager PRP
5.2 Regression Analysis
We now estimate the relation between managerial incentives and our mea-
sure of favoritism controlling for key �rm characteristics. The results of OLS
regressions are presented in table 1. In our basic speci�cation in column
1 of table 1, we regress our survey item on a dummy indicating whether a
�rm provides performance related pay to its managers and a set of stan-
dard �rm controls including two �rm size dummies, 11 industry dummies
and a variable indicating the presence of a works council. The coe¢ cient of
our main independent variable con�rms the key hypothesis revealing a sig-
ni�cant 7 percentage point di¤erence in the fraction of a¢ rmative answers
between �rms with and without manager PRP. This e¤ect is substantial. By
comparing predicted values at the mean of the distribution of all other inde-
pendent variables the coe¢ cient translates into a 24% increase from 29.54%
a¢ rmative answers to 36.65%.
As shown in column (2) the e¤ect of our second key independent variable
15
Manager Gain Sharing is also highly signi�cant and similar in size. Moreover,
when including both in speci�cation (3), coe¢ cients remain stable indicating
that both separately a¤ect the quality of promotion decisions, i.e. �rms
which use both instruments have a substantially higher perceived quality of
promotions as compared to �rms which use only one of them.13
13There is no signi�cant interaction between Manager PRP and Manager Gain Sharing.
16

DependentVariable
"Promotionsgotothosewhobestdeservethem"
TopBoxes(0-100)
(1)
(2)
(3)
(4)
(5)
(6)
DummyManagerPRP
7.110***
6.801***
5.665***
6.500**
4.486*
(2.294)
(2.275)
(2.088)
(2.724)
(2.441)
DummyManagerGainSharing
8.093***
7.572***
6.787***
6.180**
(2.627)
(2.593)
(2.593)
(2.608)
DummyWorkerPRP
1.224
2.822
(2.437)
(2.267)
InternalManagerialSta¢ng(%)
0.0533**
0.0457*
(0.0249)
(0.0245)
WorksCouncil
-6.775***
-6.150***
-6.521***
-4.433**
-6.809***
-4.041*
(2.044)
(2.145)
(2.048)
(2.097)
(2.056)
(2.063)
Socioeconomics
No
No
No
Yes
No
Yes
Constant
37.63***
38.93***
36.44***
51.29***
37.61***
50.56***
(4.274)
(4.285)
(4.360)
(5.609)
(4.321)
(5.409)
Observations
294
294
294
274
294
274
R2
0.193
0.183
0.214
0.312
0.194
0.334
***p<0.01,**p<0.05,*p<0.1,robuststandarderrorsinparentheses
OLSregression:furthercontrols:2�rmsizedummiesand11industrydummies
Referencecategory:0-99employee�rminthefoodindustry
Socioeconomicsincludeaveragetenure&shareofmalesamongrespondents
Table1:TheRelationbetweenManagerialIncentivesandFavoritism
17

But it is of course important to control for further potentially confounding
factors. In speci�cation (4) we control for average tenure and gender compo-
sition of their surveyed workforce and the percentage of managerial positions
�lled internally (Internal Managerial Sta¢ ng) since higher internal sta¢ ng
quotas may cause an upward bias in the respective answers. While we see
that manager gain sharing as well as higher internal sta¢ ng quotas are also
signi�cantly positively related to higher promotion quality, the coe¢ cient of
our main variable of interest, the existence of manager PRP, decreases by
only 1 percentage point and remains highly signi�cant.
Finally, we use �rm level information on the existence of performance
related pay for workers (variable Worker PRP). Since �rms who use man-
agerial incentives are also much more likely to have performance related pay
components for the rest of the workforce, the observed di¤erence could also
be due to the existence of worker PRP. One may argue that in �rms with
worker PRP work performance is easier to measure leaving less room for fa-
voritism in promotion decisions. Moreover, the use of Manager PRP could
just indicate that a �rm is willing to use �professional�HR practices. In this
case the above stated di¤erence in promotion decisions might be partially
confounded. As shown in columns 5 & 6 of table 1 the results for manager
PRP becomes somewhat weaker14 but the e¤ect of gain sharing remains very
similar. As a further robustness check, the models reported in table A2 in
the appendix only consider the subset of �rms who do not pay PRP to their
workers. The coe¢ cients ofManager PRP andManager Gain Sharing again
remain similar in terms of economic and statistical signi�cance. The results,
therefore, are in line with our main theoretical hypothesis that managerial
incentives either in the form of performance related pay or gain sharing plans
are connected to better promotion decisions in �rms.
In an alternative speci�cation we only consider responses of employees
14Note that the variables Manager PRP and Worker PRP are highly correlated with aPearson correlation coe¢ cient of 0.58.
18

with at least 2 years of �rm tenure as company newcomers may be inexperi-
enced and therefore incapable of judging promotion quality at their current
workplace. The presented results in table A3 show that the noise is indeed
reduced and in particular the coe¢ cients of Manager PRP gain in statistical
signi�cance.
In the next step we take the strength of managerial incentives into ac-
count. Our theoretical model suggests that higher managerial incentives
should lead to less favoritism suggesting a monotone e¤ect of managerial in-
centives on favoritism. However, as indicated by �gure 1, the e¤ect should be
non-linear. For instance, when preferences for favoritism are not too strong,
already weak managerial incentives may have a substantial e¤ect on the qual-
ity of promotion decisions. Any further increase in managerial incentives may
provide only little further improvement.
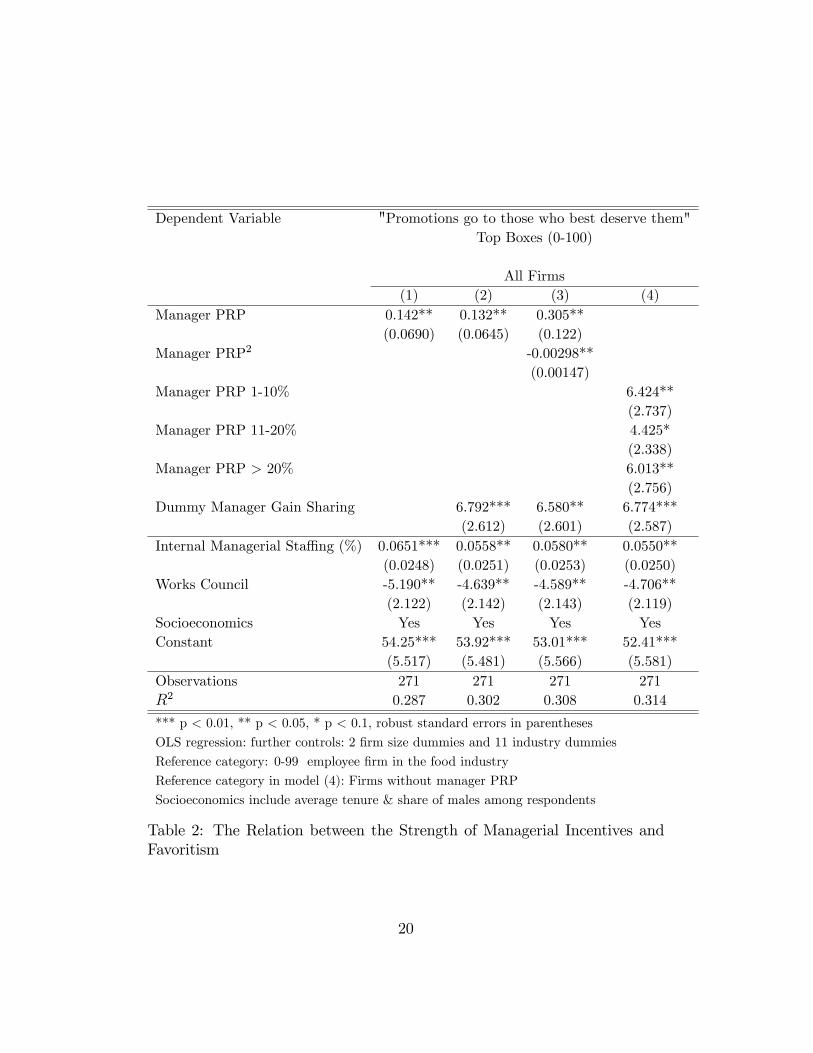
In table 2 we therefore regress our main dependent variable on the strength
of manager PRP (column 1 & 2). In column 3 we test for a quadratic func-
tional form of managerial incentives, while column 4 allows a non-parametric
functional form by including 3 interval dummies for the strength of manager
PRP with the reference category being �rms without manager PRP.
The coe¢ cients in columns 1 & 2 in table 2 indicate a positive slope.
However, the last two columns reveal that even �rms in which less than 10% of
the managers�total wages depend on performance exhibit signi�cantly better
promotion decisions. Increasing managerial incentives beyond 10% does not
additionally increase the share of a¢ rmative answers.15 This result con�rms
our theoretical prediction and suggests that already rather weak managerial
incentives indeed help to overcome favoritism in promotion decisions.
15Note that the coe¢ cients of the interval dummies are not signi�cantly di¤erent fromone another.
19
Dependent Variable "Promotions go to those who best deserve them"Top Boxes (0-100)
All Firms(1) (2) (3) (4)
Manager PRP 0.142** 0.132** 0.305**(0.0690) (0.0645) (0.122)
Manager PRP2 -0.00298**(0.00147)
Manager PRP 1-10% 6.424**(2.737)
Manager PRP 11-20% 4.425*(2.338)
Manager PRP > 20% 6.013**(2.756)
Dummy Manager Gain Sharing 6.792*** 6.580** 6.774***(2.612) (2.601) (2.587)
Internal Managerial Sta¢ ng (%) 0.0651*** 0.0558** 0.0580** 0.0550**(0.0248) (0.0251) (0.0253) (0.0250)
Works Council -5.190** -4.639** -4.589** -4.706**(2.122) (2.142) (2.143) (2.119)
Socioeconomics Yes Yes Yes YesConstant 54.25*** 53.92*** 53.01*** 52.41***
(5.517) (5.481) (5.566) (5.581)Observations 271 271 271 271R2 0.287 0.302 0.308 0.314
*** p < 0.01, ** p < 0.05, * p < 0.1, robust standard errors in parentheses
OLS regression: further controls: 2 �rm size dummies and 11 industry dummies
Reference category: 0-99 employee �rm in the food industry
Reference category in model (4): Firms without manager PRP
Socioeconomics include average tenure & share of males among respondents
Table 2: The Relation between the Strength of Managerial Incentives andFavoritism
20
6 Conclusion
When performance is not perfectly observable promotion decisions are fre-
quently based on subjective performance measures. If managers have per-
sonal preferences for certain workers they have an incentive to distort perfor-
mance ratings by promoting favored workers rather than most able workers.
We theoretically show that favoritism can reduce company pro�ts not only
by putting the wrong people into management positions but also by reduc-
ing incentives for workers to exert e¤ort during the tournament. Managerial
incentives can constrain favoritism in promotion decisions by realigning man-
agers�and �rm interest whereas even rather weak managerial incentives may
generate strong e¢ ciency gains.
We empirically tested the theoretical prediction using a unique represen-
tative matched employer-employee data set. The empirical analysis con�rms
our theoretical result as promotion quality is signi�cantly higher in �rms in
which managers receive performance related pay or participate in gain shar-
ing plans. Indeed this higher perceived quality of promotion decisions should
translate in higher company performance as, not only the probability that
the best and not the best-liked employees are promoted increases, but also
because stronger merit-based promotions should lead to a more motivated
workforce.
References
Anderson, R. C. and D. M. Reeb (2003). Founding-family ownership and �rm
performance: Evidence from the s&p 500. The Journal of Finance 58 (3),
1301�1327.
Bandiera, O., I. Barankay, and I. Rasul (2009). Social connections and incen-
tives in the workplace: Evidence from personnel data. Econometrica 77,
1047�1094.
21

Bennedsen, M., K. M. Nielsen, F. Perez-Gonzalez, and D. Wolfenzon (2007).
Inside the familiy �rm: The role of families in succession decisions and
performance. the Quarterly Journal of Economics, 647�690.
Bjerke, R., J. Cleveland, R. Morrison, and W. Wilson (1987). O¢ cer �tness
report evaluation study. Report TR-88-4 (Navy Personnel Research and
Development Center. Washingtion DC).
Bloom, N. and J. Van Reenen (2007). Measuring and explaining management
practices across �rms and countries. Quarterly Journal of Economics, MIT
Press 122, 1351�1408.
Bloom, N. and J. Van Reenen (2010). New approaches to surveying organiza-
tions. American Economic Review, American Economic Association 100,
105�109.
Breuer, K., P. Nieken, and D. Sliwka (2010). Social ties and subjective
performance evaluations: An empirical investigation. IZA DP No. 4913 .
DeGroot, M. (1970). Optimal Statistical Decisions. New York: McGraw-Hill.
Ittner, C. D., D. F. Larcker, and M. W. Meyer (2003). Subjectivity and the
weighting of performance measures: Evidence from a balanced scorecard.
The Accounting Review 78, 725�758.
Kramarz, F. and O. N. Skans (2007). With a little help from my parents:
Family networks and youth labor market entry. Crest Working Paper .
Lazear, E. P. and S. Rosen (1981). Rank-order tournaments as optimum
labor contracts. Journal of Political Economy 89, 841�864.
Longenecker, C. O., H. P. Sims, and D. A. Gioia (1987). Behind the mask:
The politics of employee appraisal. The Academy Of Management Execu-
tive 1, 183�193.
22

Marsh, R. M. (1960). Bureaucratic constraints on nepotism in the ch�ing
period. The Journal of Asian Studies 19, 117�133.
Prendergast, C. and R. Topel (1996). Favoritism in organizations. Journal
of Political Economy 104, 958�978.
Prendergast, C. J. (2002). Uncertainty and incentives. Journal of Labor
Economics 20, 115�37.
Prendergast, C. J. and R. H. Topel (1993). Discretion and bias in performance
evaluation. European Economic Review 37, 355�65.
Pérez-González (2006). Inherited control and �rm performance. American
Economic Review 96, 1559�1588.
Sraer, D. and D. Thesmar (2007). Performance and behavior of family �rms:
Evidence from the french stock market. Journal of the European Economic
Association 5 (4), 709�751.
Vilallonga, B. and R. Amit (2006). How do family ownership, control and
management a¤ect �rm value? Journal of Financial Economics 80, 385�
417.
23

7 Appendix
05
1015
200
510
1520
0 50 100
Firms without Manager Gain Sharing
Firms with Manager Gain Sharing
Perc
ent
Item: Promotions go to those who best deserve them
Figure A1: Favoritism in Firms with and without Manager Gain Sharing
24

ExplanatoryVariables
Name
Description
Min
Max
Mean
SdN
DummyManagerPRP
FirmusesManagerialIncentives(Yes/No)
01
0.57
.50
294
ManagerPRP(in%)
TotalWageDependingonVariablePayment
080
4.56
8.81
292
DummyManagerGainSharing
ManagersreceiveGainSharing/holdFirmAssets(Yes/No)
01
0.12
0.33
294
DummyWorkerPRP
Dummy=1ifFirmusesWorkerPRP
01
0.37
.48
294
Promotion
Item:"Promotionsgotothosewhobestdeservethem"
0100
28.3
16.8
305
WorksCouncil
WorksCouncilintheFirm(Yes/No)
01
0.60
0.49
294
InternalManagerialSta¢ng
%ofManagerialVacancies�lledwithInternalHires
0100
52.20
37.78
274
Tenure
AverageYearsofTenureamongtheWorkforce
2.9
19.5
9.98
3.38
305
Male
%ofMaleWorkersintheFirm
01
.648
.23
305
Industries
12IndustryDummies
112
--
305
FirmSize
3FirmSizeDummies:0-99,100-499and>500Employees
13
--
305
TableA1:DescriptiveStatisticsofMainVariables
25

DependentVariable
"Promotionsgotothosewhobestdeservethem"
TopBoxes(0-100)
ExcludingFirmswithWorkerPRP
(1)
(2)
(3)
(4)
DummyManagerPRP
6.383**
6.265*
4.648*
(3.212)
(3.183)
(2.789)
DummyManagerGainSharing
8.073**
7.853**
8.039**
(3.978)
(3.863)
(3.379)
InternalManagerialSta¢ng(%)
0.0189
(0.0336)
WorksCouncil
-6.016**
-5.697**
-5.793**
-3.461
(2.749)
(2.872)
(2.765)
(2.910)
Socioeconomics
No
No
No
Yes
Constant
43.00***
42.80***
41.35***
58.22***
(5.106)
(5.547)
(5.351)
(6.056)
Observations
185
185
185
171
R2
0.183
0.175
0.199
0.319
***p<0.01,**p<0.05,*p<0.1,robuststandarderrorsinparentheses
OLSregression:furthercontrols:2�rmsizedummiesand11industrydummies
Referencecategory:0-99employee�rminthefoodindustry
Socioeconomicsincludeaveragetenure&shareofmalesamongrespondents
TableA2:TheRelationbetweenManagerialIncentivesandFavoritism
inFirmswithoutWorkerPRP
26

DependentVariable
"Promotionsgotothosewhobestdeservethem"
TopBoxes(0-100)
Onlyemployesswithatleast2yearsoftenure
(1)
(2)
(3)
(4)
(5)
(6)
DummyManagerPRP
7.089***
6.785***
5.912***
7.297***
5.499**
(2.298)
(2.274)
(2.086)
(2.769)
(2.471)
DummyManagerGainSharing
7.969***
7.449***
6.921***
6.636**
(2.650)
(2.640)
(2.623)
(2.622)
DummyWorkerPRP
-0.416
1.019
(2.541)
(2.416)
InternalManagerialSta¢ng(%)
0.0495*
0.0412*
(0.0253)
(0.0249)
WorksCouncil
-6.988***
-6.367***
-6.738***
-5.063**
-6.976***
-4.706**
(2.071)
(2.165)
(2.073)
(2.112)
(2.076)
(2.078)
Socioeconomics
No
No
No
Yes
No
Yes
Constant
38.65***
39.96***
37.48***
52.75***
38.66***
52.21***
(4.388)
(4.348)
(4.487)
(5.745)
(4.384)
(5.478)
Observations
294
294
294
274
294
274
R2
0.198
0.188
0.217
0.313
0.198
0.335
***p<0.01,**p<0.05,*p<0.1,robuststandarderrorsinparentheses
OLSregression:furthercontrols:2�rmsizedummiesand11industrydummies
Referencecategory:0-99employee�rminthefoodindustry
Socioeconomicsincludeaveragetenure&shareofmalesamongrespondents
TableA3:TheRelationbetweenManagerialIncentivesandFavoritism
-onlyEmployeeswithatleast2
YearsofTenure
27


