
MITI Tower, No. 7, Jalan Sultan Haji Ahmad Shah, 50480 Kuala Lumpur, Malaysia Tel: +603 - 8000 8000 Fax: +603 - 6202 9446
MITI Weekly Bulletin | www.miti.gov.my
On 27 February 2017, a Memorandum of Understanding (MoU) was signed by Dato’ Sri Mustapa Mohamed, the Minister of International Trade and Industry and Dr. Ibrahim Abdulaziz Al-Assaf, State Minister of Saudi Arabia, on behalf of the country’s Ministry of Commerce and Investment. The MoU aims to promote cooperation in trade and investment, particularly in five key areas namely healthcare, construction, education, small and medium enterprises (SMEs) and Halal industry. The cooperation between the two governments as outlined under the MoU will cover exchange of information and experience, visits involving experts and professional as well as to host seminar and meeting sessions to further promote opportunities available in respective countries. The two countries have also agreed to form a Working Committee under the Malaysia-Saudi Arabia Joint Commission Meeting tasked to identify and improve understanding on trade and investment issues related to both countries as well as develop cooperation programmes to further enhance our economic ties. On the formation of the working group, Dato’ Sri Mustapa Mohamed said, “This is step forward that we hope will result in more trade between our two countries and further diversification in imports and exports. Among key areas which we hope to benefit from a more diversified trade include services, digital economy and tourism sector. Our officials will be tasked to go into details on what products and services could be further promoted.” Malaysia and Saudi Arabia continue to enjoy a strong bilateral relation. In 2016, total trade between our countries was RM14 billion, an increase of 27.8% from the year before. Our exports amounted to RM3.4 billion while our imports stood at RM10.6 billion. Meanwhile on investment front, Malaysia has a strong presence in Saudi Arabia’s construction sector with 19 contracts worth RM18.5 billion awarded to Malaysian companies. “We would like to thank the Saudi government for the facilitation given to Malaysian companies and hope that it will continue as our companies continue to participate in the Saudi’s National Transformation Program 2020 and the Vision 2030”, Dato’ Sri Mustapa added.
MALAYSIA-SAUDI ARABIA COOPERATION ON TRADE AND INVESTMENT
Ministry of International Trade and Industry, Malaysia27 February 2017

MITI Tower, No. 7, Jalan Sultan Haji Ahmad Shah, 50480 Kuala Lumpur, Malaysia Tel: +603 - 8000 8000 Fax: +603 - 6202 9446
MITI Weekly Bulletin | www.miti.gov.my
162.
9
163.
0
174.
9
184.
6
161.
5
162.
6
172.
2
189.
7
33.2
32.3
34.1
35.5
34.6
35.3
34.8
36.0
11.4
15.5
9.6
12.3
10.8
12.9
9.7
12.9
2.4
2.8
3.2
3.5
3.5
3.8
4.0
4.5
0
50
100
150
200
Q1 Q2 Q3 Q4 Q1 Q2 Q3 Q4
2015 2016
RM bi
llion
Goods Services Primary income Secondary Income
MALAYSIA Current Account Components in
Balance of Payments (BOP), Q1 2015 - Q4 2016
Exports
Imports
Net Exports
Source : Department of Statistics, Malaysia
135.
2
139.
4
147.
7
153.
5
138.
0
142.
8
145.
7
158.
3
36.7
37.3
40.1
41.9
41.5
39.9
39.9
42.0
19.1
20.1
20.2
21.4
17.4
21.2
20.5
21.9
7.5
8.7
9.0
8.6
8.5
8.9
8.6
8.6
0
50
100
150
200
Q1 Q2 Q3 Q4 Q1 Q2 Q3 Q4
2015 2016
RM bi
llion
Goods Services Primary income Secondary Income
27.7
23.6 27
.2 31.1
23.5
19.8 26
.5 31.4
-3.5
-5.0
-6.0
-6.4
-6.8 -4.6
-5.1
-6.0
-7.7 -4
.6
-10.6 -9
.1 -6.7
-8.2
-10.8 -9
.0-5.1
-5.9
-5.9
-5.0
-4.9
-5.1
-4.6
-4.1
-15
0
15
30
45
RM bi
llion
Goods Services Primary income Secondary Income
Q1 Q2 Q1 Q2Q3 Q4 Q3 Q42015 2016

MITI Tower, No. 7, Jalan Sultan Haji Ahmad Shah, 50480 Kuala Lumpur, Malaysia Tel: +603 - 8000 8000 Fax: +603 - 6202 9446
MITI Weekly Bulletin | www.miti.gov.my
Trade in Services by Components, 2016Travel Transport Telecommunications, computer
and information services
Insurance and pension services
Exports: RM70.1 bilGrowth: 2.4%
Imports: RM41.5 bilGrowth: 0.7%
Exports: RM16.0bilGrowth: 2.0%
Imports: RM40.0bilGrowth: -2.5%
Exports: RM9.9 bilGrowth: -4.8%
Imports: RM12.8 bilGrowth: 1.7%
Exports: RM9.0 bilGrowth: 7.0%
Imports: RM0.2 bilGrowth: 19.2%
Manufacturing services on physical inputs owned by others Construction
Exports: RM4.4 bilGrowth: 9.1%
Imports: RM10.5 bilGrowth: -0.8%
Financial services
Exports: RM2.1 bilGrowth: 58.8%
Imports: RM2.2 bilGrowth: 29.4%
Personal, cultural and recreational services
Exports: RM1.5 bilGrowth: -0.3%
Exports: RM0.5 bilGrowth: 30.7%
Exports: RM0.4bilGrowth: -1.2%
Exports: RM23.9 bilGrowth: 10.2%
Exports: RM1.5bilGrowth: 6.5%
Exports: RM1.4bilGrowth: -4.4%
Imports: RM3.3bilGrowth: -4.6%
Imports: RM5.5bilGrowth: 12.5%
Imports: RM1.0bilGrowth: 8.0%
Imports: RM35.2bilGrowth: 21.0%
Imports: RM1.5 bilGrowth: 20.6%
Imports: RM9.5 bilGrowth: 3.4%
Maintenance and repair services n.i.e.
Charges for the use of intellectual property n.i.e.
Government goods and services n.i.e. Other business services
Source : Department of Statistics, Malaysia

MITI Tower, No. 7, Jalan Sultan Haji Ahmad Shah, 50480 Kuala Lumpur, Malaysia Tel: +603 - 8000 8000 Fax: +603 - 6202 9446
MITI Weekly Bulletin | www.miti.gov.my
Consumer Price Index, Jan 2017Jan 2016 Jan 2017
Index Number114.5
Percentage change3.5%
Index Number118.2
Percentage change3.2%
8.3
4.0
3.2
2.52.1 2.0 1.9
1.5 1.4
0.2-0.2 -0.7
-2
0
2
4
6
8
10
Trans
port
Food
&No
n-Alco
holic
Beve
rages
Recre
ation
Servi
ces &
Cultu
re
Healt
h
Resta
urants
&Ho
tels
Educ
ation
Hous
ing, W
ater,
Elec
tricity
, Gas
&Ot
her F
uels
Furni
shing
s,Ho
useh
old Eq
uipme
nt &
Rou
tine H
ouse
hold…
Misc
ellan
eous
Goo
ds &
Servi
ces
Alcoh
olic
Beve
rages
&To
bacc
o
Comm
unica
tion
Clothi
ng &
Footw
ear
%
Year on Year Percentage Change by Main Groups, Jan 2017
Five sub-group Recorded Higher Increasesfor Food & Non-Alcoholic Beverages, Jan 2017
Oils & Fats37.9%
Food Away from Home3.6%
Vegetables7.8%
Fruits2.1%
Fish & Seafood6.1%
Source : Department of Statistics, Malaysia

MITI Tower, No. 7, Jalan Sultan Haji Ahmad Shah, 50480 Kuala Lumpur, Malaysia Tel: +603 - 8000 8000 Fax: +603 - 6202 9446
MITI Weekly Bulletin | www.miti.gov.my
International ReportIndonesia Trade Performance, January 2017
Indonesia’s Trade Surplus/Deficit , 2014 - Jan 2017
Exports USD13.38b 27.21%
Source: Statistics Indonesia
12.54 14.93 17
.68 20.7
17.24
18.09 20
.84 27.61 33
.11
31.76
29.1
27.66
16.55
18.12
21.48
24.18
23.02
29.39
35.11
31.1
27.94
27.73
31 29.43
29.0933.05
39.1644.88
40.25
47.48
55.9558.7 61.05 59.49 60.1
57.09
0
10
20
30
40
50
60
70
2005 2006 2007 2008 2009 2010 2011 2012 2013 2014 2015 2016
RM b
illion
Exports Imports Total Trade
Source : Department of Statistics, Malaysia
Malaysia’s Trade with Indonesia, 2005-2016
ImportsUSD11.99b 14.54%
Total TradeUSD25.37b 21.10%
USD million
Note: % : Year on Year growth

MITI Tower, No. 7, Jalan Sultan Haji Ahmad Shah, 50480 Kuala Lumpur, Malaysia Tel: +603 - 8000 8000 Fax: +603 - 6202 9446
MITI Weekly Bulletin | www.miti.gov.my
0
20
40
60
80
100
120
140
160
0
20
40
60
80
100
120
140
160
4 D
ec
11 D
ec
18 D
ec
25 D
ec
1 Ja
n
8 Ja
n
15 J
an
22 J
an
29 J
an
5 Fe
b
12 F
eb
19 F
eb
No. o
f Cer
tific
ate
of O
rigin
RM m
il.
Generalised System of Preferences (GSP)
Total FOB (RM mil.) Total CO
Note: The preference giving countries under the GSP scheme are Liechtenstein, the Russian Federation, Japan, Switzerland, Belarus, Kazakhstan and Norway.
Source: Ministry of International Trade and Industry, Malaysia
Number and Value of Preferential Certificates of Origin (PCOs)
0
1,000
2,000
3,000
4,000
5,000
6,000
0
200
400
600
800
1,000
1,200
1,4004
Dec
11 D
ec
18 D
ec
25 D
ec
1 Ja
n
8 Ja
n
15 J
an
22 J
an
29 J
an
5 Fe
b
12 F
eb
19 F
eb
No. o
f Cer
tific
ate
of O
rigin
RM m
il.
ASEAN Trade in Goods Agreement (ATIGA)
Total FOB (RM mil.) Total CO
0
200
400
600
800
1,000
1,200
1,400
1,600
1,800
2,000
0
500
1,000
1,500
2,000
2,500
3,000
4 D
ec
11 D
ec
18 D
ec
25 D
ec
1 Ja
n
8 Ja
n
15 J
an
22 J
an
29 J
an
5 Fe
b
12 F
eb
19 F
eb
No. o
f Cer
tific
ate
of O
rigin
RM m
il.
ASEAN-China Free Trade Agreement (ACFTA)
Total FOB (RM mil.) Total CO
0
200
400
600
800
1,000
1,200
0
500
1,000
1,500
2,000
2,500
4 D
ec
11 D
ec
18 D
ec
25 D
ec
1 Ja
n
8 Ja
n
15 J
an
22 J
an
29 J
an
5 Fe
b
12 F
eb
19 F
eb
No. o
f Cer
tific
ate
of O
rigin
RM m
il.
ASEAN-Korea Free Trade Agreement (AKFTA)
Total FOB (RM mil.) Total CO
0
50
100
150
200
250
300
350
0
50
100
150
200
250
4 D
ec
11 D
ec
18 D
ec
25 D
ec
1 Ja
n
8 Ja
n
15 J
an
22 J
an
29 J
an
5 Fe
b
12 F
eb
19 F
eb
No. o
f Cer
tific
ate
of O
rigin
RM m
il.
ASEAN-Japan Comprehensive Economic Partnership (AJCEP)
Total FOB (RM mil.) Total CO
0
100
200
300
400
500
600
700
800
0
50
100
150
200
250
300
350
4 D
ec
11 D
ec
18 D
ec
25 D
ec
1 Ja
n
8 Ja
n
15 J
an
22 J
an
29 J
an
5 Fe
b
12 F
eb
19 F
eb
No. o
f Cer
tific
ate
of O
rigin
RM m
il.
ASEAN-India Free Trade Agreement (AIFTA)
Total FOB (RM mil.) Total CO
0
200
400
600
800
1,000
1,200
0
50
100
150
200
250
300
4 D
ec
11 D
ec
18 D
ec
25 D
ec
1 Ja
n
8 Ja
n
15 J
an
22 J
an
29 J
an
5 Fe
b
12 F
eb
19 F
eb
No. o
f Cer
tific
ate
of O
rigin
RM m
il.
ASEAN-Australia-New Zealand Free Trade Agreement (AANZFTA)
Total FOB (RM mil.) Total CO
Note: * Provisional data
MITI Tower, No. 7, Jalan Sultan Haji Ahmad Shah, 50480 Kuala Lumpur, Malaysia Tel: +603 - 8000 8000 Fax: +603 - 6202 9446
MITI Weekly Bulletin | www.miti.gov.my
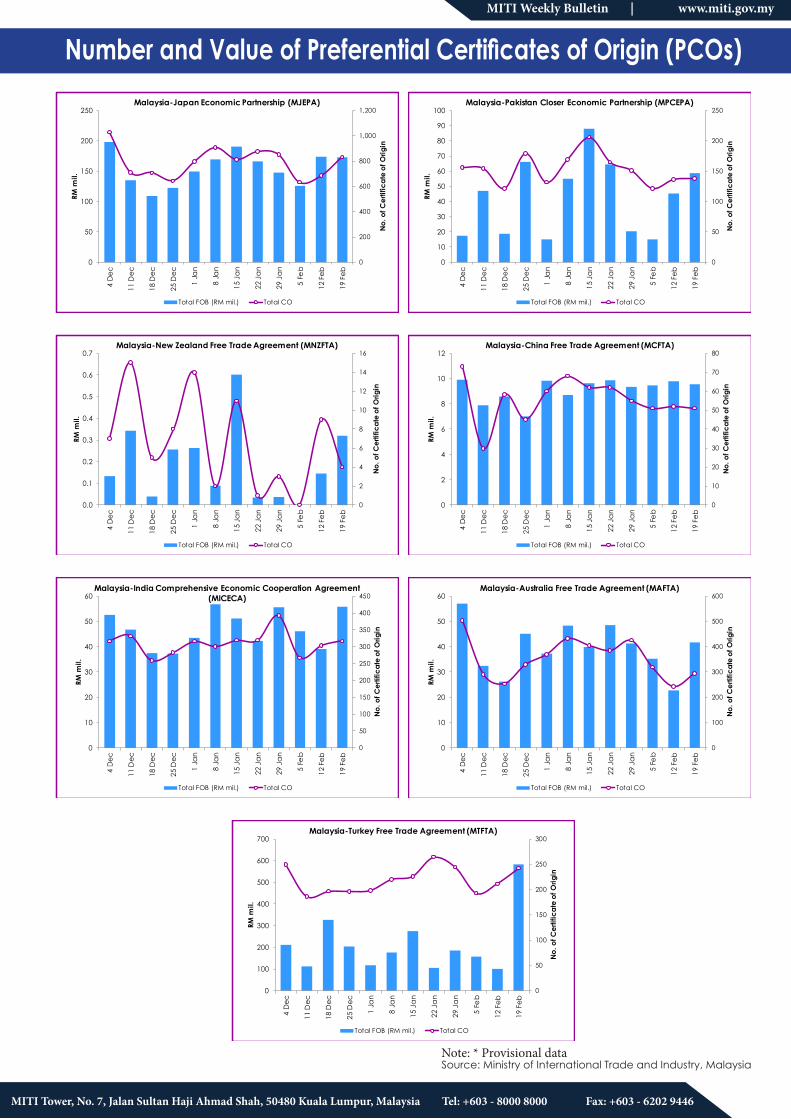
Number and Value of Preferential Certificates of Origin (PCOs)
Source: Ministry of International Trade and Industry, Malaysia
0
200
400
600
800
1,000
1,200
0
50
100
150
200
2504
Dec
11 D
ec
18 D
ec
25 D
ec
1 Ja
n
8 Ja
n
15 J
an
22 J
an
29 J
an
5 Fe
b
12 F
eb
19 F
eb
No. o
f Cer
tific
ate
of O
rigin
RM m
il.
Malaysia-Japan Economic Partnership (MJEPA)
Total FOB (RM mil.) Total CO
0
50
100
150
200
250
0
10
20
30
40
50
60
70
80
90
100
4 D
ec
11 D
ec
18 D
ec
25 D
ec
1 Ja
n
8 Ja
n
15 J
an
22 J
an
29 J
an
5 Fe
b
12 F
eb
19 F
eb
No. o
f Cer
tific
ate
of O
rigin
RM m
il.
Malaysia-Pakistan Closer Economic Partnership (MPCEPA)
Total FOB (RM mil.) Total CO
0
2
4
6
8
10
12
14
16
0.0
0.1
0.2
0.3
0.4
0.5
0.6
0.7
4 D
ec
11 D
ec
18 D
ec
25 D
ec
1 Ja
n
8 Ja
n
15 J
an
22 J
an
29 J
an
5 Fe
b
12 F
eb
19 F
eb
No. o
f Cer
tific
ate
of O
rigin
RM m
il.
Malaysia-New Zealand Free Trade Agreement (MNZFTA)
Total FOB (RM mil.) Total CO
0
10
20
30
40
50
60
70
80
0
2
4
6
8
10
12
4 D
ec
11 D
ec
18 D
ec
25 D
ec
1 Ja
n
8 Ja
n
15 J
an
22 J
an
29 J
an
5 Fe
b
12 F
eb
19 F
eb
No. o
f Cer
tific
ate
of O
rigin
RM m
il.
Malaysia-China Free Trade Agreement (MCFTA)
Total FOB (RM mil.) Total CO
0
50
100
150
200
250
300
350
400
450
0
10
20
30
40
50
60
4 D
ec
11 D
ec
18 D
ec
25 D
ec
1 Ja
n
8 Ja
n
15 J
an
22 J
an
29 J
an
5 Fe
b
12 F
eb
19 F
eb
No. o
f Cer
tific
ate
of O
rigin
RM m
il.
Malaysia-India Comprehensive Economic Cooperation Agreement (MICECA)
Total FOB (RM mil.) Total CO
0
100
200
300
400
500
600
0
10
20
30
40
50
60
4 D
ec
11 D
ec
18 D
ec
25 D
ec
1 Ja
n
8 Ja
n
15 J
an
22 J
an
29 J
an
5 Fe
b
12 F
eb
19 F
eb
No. o
f Cer
tific
ate
of O
rigin
RM m
il.
Malaysia-Australia Free Trade Agreement (MAFTA)
Total FOB (RM mil.) Total CO
0
50
100
150
200
250
300
0
100
200
300
400
500
600
700
4 D
ec
11 D
ec
18 D
ec
25 D
ec
1 Ja
n
8 Ja
n
15 J
an
22 J
an
29 J
an
5 Fe
b
12 F
eb
19 F
eb
No. o
f Cer
tific
ate
of O
rigin
RM m
il.
Malaysia-Turkey Free Trade Agreement (MTFTA)
Total FOB (RM mil.) Total CO
Note: * Provisional data

MITI Tower, No. 7, Jalan Sultan Haji Ahmad Shah, 50480 Kuala Lumpur, Malaysia Tel: +603 - 8000 8000 Fax: +603 - 6202 9446
MITI Weekly Bulletin | www.miti.gov.my
Source : Bank Negara, Malaysia
Malaysian Ringgit Exchange Rate with Selected Countries,January 2016 - January 2017
US Dollar
Canadian Dollar
New Zealand Dollar
Swiss Franc
Saudi Riyal
Myanmar Kyat
4.3481
4.4596
3.60
3.70
3.80
3.90
4.00
4.10
4.20
4.30
4.40
4.50
4.60
Jan Feb Mar Apr May Jun Jul Aug Sep Oct Nov Dec Jan
2016 2017
RM
USD 1 = RM
3.06
3.38
2.80
2.90
3.00
3.10
3.20
3.30
3.40
3.50
Jan Feb Mar Apr May Jun Jul Aug Sep Oct Nov Dec Jan
2016 2017
RM
CAD 1 = RM
2.84
3.17
2.40
2.50
2.60
2.70
2.80
2.90
3.00
3.10
3.20
3.30
Jan Feb Mar Apr May Jun Jul Aug Sep Oct Nov Dec Jan
2016 2017
RM
NZD 1 = RM
4.32
4.42
3.80
3.90
4.00
4.10
4.20
4.30
4.40
4.50
Jan Feb Mar Apr May Jun Jul Aug Sep Oct Nov Dec Jan
2016 2017
RM
CHF 1 = RM
115.89
118.90
95.00
100.00
105.00
110.00
115.00
120.00
125.00
Jan Feb Mar Apr May Jun Jul Aug Sep Oct Nov Dec Jan
2016 2017
RM
SAR 100 = RM
0.337
0.330
0.315
0.320
0.325
0.330
0.335
0.340
0.345
0.350
Jan Feb Mar Apr May Jun Jul Aug Sep Oct Nov Dec Jan
2016 2017
RM
MMK 100 = RM

MITI Tower, No. 7, Jalan Sultan Haji Ahmad Shah, 50480 Kuala Lumpur, Malaysia Tel: +603 - 8000 8000 Fax: +603 - 6202 9446
MITI Weekly Bulletin | www.miti.gov.my
Commodity Prices
Notes: All figures have been rounded to the nearest decimal point * Refer to % change from the previous week’s price i Average price in the year except otherwise indicated Sources: Ministry of International Trade and Industry Malaysia, Malaysian Palm Oil Board, Malaysian Rubber Board, Malaysian Cocoa Board, Malaysian Iron and Steel Industry Federation, Bloomberg and Czarnikow Group.
CRUDE PETROLEUM (BRENT)-per bbl-
24 Feb 2017 : US$56.0, 0.3%*
Average Pricei : 2016: US$45.3 2015: US$53.6
CRUDE PALM OIL-per MT-
24 Feb 2017 : US$779.5, 3.4%*Average Pricei : 2016: US$702.2 2015: US$616.9
RUBBER SMR 20-per MT-
24 Feb 2017 : US$2,059.5, 5.7%*
Average Pricei : 2016: US$1.394.5 2015: US$1.364.3
COAL -per MT-24 Feb 2017 : US$44.1, unchangedAverage Pricei : 2016: US$45.6 2015: US$49.9
COCOA SMC 2-per MT-
24 Feb 2017 : US$1,473.2, 2.0%*
Average Pricei : 2016: US$1,609.8 2015: US$2,077.0
SCRAP IRON HMS-per MT-
26 Feb 2017 : US310.0 (high), 3.1% US$290.0 (low), unchangedAverage Pricei : 2016: US$243.2 2015: US$239.6
HIGHEST and LOWEST 2016/2017
Highest 6 Jan 2017 : US$57.1 30 Dec 2016 : US$56.8
Lowest
13 Jan 2017 : US$55.5
15 Jan 2016 : US$28.9
Crude Petroleum
(Brent)-per bbl-
Highest 20 Jan 2017 : US$843.0 30 Dec 2016 : US$797.5
Lowest
15 Jan 2016 : US$545.5 13 Jan 2017 : US$798.8
Crude Palm Oil -per MT-
Domestic Prices26 February 2017
Steel Bars(per MT)
RM2,150 – RM2,300
Billets(per MT)
RM1,950 – RM2,050
SUGAR -per lbs-24 Feb 2017 : US¢ 19.8, 2.2%*
Average Pricei : 2016: US¢18.2 2015: US¢13.2

MITI Tower, No. 7, Jalan Sultan Haji Ahmad Shah, 50480 Kuala Lumpur, Malaysia Tel: +603 - 8000 8000 Fax: +603 - 6202 9446
MITI Weekly Bulletin | www.miti.gov.my
Commodity Price Trends
Sources: Ministry of International Trade and Industry Malaysia, Malaysian Palm Oil Board, Malaysian Rubber Board, Malaysian Cocoa Board, Malaysian Pepper Board, Bloomberg and Czarnikow Group, World Bank, World Gold Council, The Wall Street Journal.
776.0
786.0789.5
797.5 798.8
812.5
843.0
835.0
810.0807.0
807.0
779.5
740
760
780
800
820
840
860
9 Dec 16 Dec 23 Dec 30 Dec 6 Jan 13 Jan 20 Jan 27 Jan 3 Feb 10 Feb 17 Feb 24 Feb
US$
/mt
Crude Palm Oil
1,770.5
1,729.0
1,653.4
1,585.01,566.0
1,609.81,596.3
1,506.6
1,715.8
1,485.71,473.4
1,502.9
1,473.2
1,300
1,350
1,400
1,450
1,500
1,550
1,600
1,650
1,700
1,750
1,800
2 Dec 9 Dec 16 Dec 23 Dec 30 Dec 6 Jan 13 Jan 20 Jan 27 Jan 3 Feb 10 Feb 17 Feb 24 Feb
US$
/mt
Cocoa
19.2
18.2 18.2
19.5
20.820.5
20.220.3
21.1
20.420.3
19.8
16.0
16.5
17.0
17.5
18.0
18.5
19.0
19.5
20.0
20.5
21.0
21.5
9 Dec 16 Dec 23 Dec 30 Dec 6 Jan 13 Jan 20 Jan 27 Jan 3 Feb 10 Feb 17 Feb 24 Feb
US¢
/lbs
Sugar
1,800.5
2,102.0
1,956.5 1,970.0
1,995.0
2,228.5
2,166.0
2,303.0
2,221.02,193.0
2,183.0
2,059.5
1,400
1,500
1,600
1,700
1,800
1,900
2,000
2,100
2,200
2,300
2,400
9 Dec 16 Dec 23 Dec 30 Dec 6 Jan 13 Jan 20 Jan 27 Jan 3 Feb 10 Feb 17 Feb 24 Feb
US$
/mt
Rubber SMR 20
6,900 7,088 7,113
7,281
6,917 6,851 6,730 6,337
6,085 5,965
4,516
3,984
4,366
4,642
3,500
4,000
4,500
5,000
5,500
6,000
6,500
7,000
7,500
8,000
8,500
Jan Feb Mar Apr May Jun Jul Aug Sep Oct Nov Dec Jan Feb
2016 2017
USD
/ to
nne
Black Pepper
* until 24 February 2017

MITI Tower, No. 7, Jalan Sultan Haji Ahmad Shah, 50480 Kuala Lumpur, Malaysia Tel: +603 - 8000 8000 Fax: +603 - 6202 9446
MITI Weekly Bulletin | www.miti.gov.my
Sources: Ministry of International Trade and Industry Malaysia, , Malaysian Iron and Steel Industry Federation, Bloomberg and Czarnikow Group, World Bank, World Gold Council, The Wall Street Journal.
Commodity Price Trends
44.1 44.1 44.1 44.1 44.1 44.1 44.1 44.1 44.1 44.1 44.1 44.1
43.5
43.6
43.7
43.8
43.9
44.0
44.1
44.2
9 Dec 16 Dec 23 Dec 30 Dec 6 Jan 13 Jan 20 Jan 27 Jan 3 Feb 10 Feb 17 Feb 24 Feb
US$
/mt
Coal
1,481
1,531 1,531
1,571 1,551
1,591
1,629 1,641
1,589
1,663
1,737 1,728
1,790
1,400
1,450
1,500
1,550
1,600
1,650
1,700
1,750
1,800
1,850
Jan Feb Mar Apr May Jun Jul Aug Sep Oct Nov Dec Jan
2016 2017
US$
/ to
nne
Aluminium
4,472
4,599
4,954 4,873
4,695 4,633
4,865
4,759 4,716 4,726
5,451
5,660 5,743
4,000
4,200
4,400
4,600
4,800
5,000
5,200
5,400
5,600
5,800
6,000
Jan Feb Mar Apr May Jun Jul Aug Sep Oct Nov Dec Jan
2016 2017
US$
/ to
nne
Copper
8,507 8,299
8,717 8,879
8,660
8,906
10,263 10,366
10,176 10,251
11,129 10,972
9,975
7,000
7,500
8,000
8,500
9,000
9,500
10,000
10,500
11,000
11,500
Jan Feb Mar Apr May Jun Jul Aug Sep Oct Nov Dec Jan
2016 2017
US$
/ to
nne
Nickel
51.551.9
53.053.7 54.0
52.4 52.453.2
53.8 53.953.4
54.0
54.355.2 55.2
56.8 57.1
55.5 55.5 55.5
56.8 56.755.8 56.0
40
42
44
46
48
50
52
54
56
58
60
9 Dec 16 Dec 23 Dec 30 Dec 6 Jan 13 Jan 20 Jan 27 Jan 3 Feb 10 Feb 17 Feb 24 Feb
US$
/bbl
Crude Petroleum
Crude Petroleum (WTI)/bbl Crude Petroleum (Brent)/bbl

MITI Tower, No. 7, Jalan Sultan Haji Ahmad Shah, 50480 Kuala Lumpur, Malaysia Tel: +603 - 8000 8000 Fax: +603 - 6202 9446
MITI Weekly Bulletin | www.miti.gov.my
927.0
906.0 905.0 903.0
961.0973.0
965.0 967.0
994.0 995.0
1,012.0
1,029.0
800.0
850.0
900.0
950.0
1,000.0
1,050.0
9 Dec 16 Dec 23 Dec 30 Dec 6 Jan 13 Jan 20 Jan 27 Jan 3 Feb 10 Feb 17 Feb 24 Feb
US$
/oz
Platinum
Commodity Price Trends
Sources: Ministry of International Trade and Industry Malaysia, Malaysian Iron and Steel Industry Federation, Bloomberg and Czarnikow Group, World Bank.
290.0295.0
300.0 300.0 300.0
320.0 320.0 320.0 320.0 320.0 320.0
310.0
270.0
280.0285.0 285.0
290.0 290.0 290.0 290.0 290.0 290.0 290.0 290.0
150
170
190
210
230
250
270
290
310
330
350
11 Nov 18 Nov 25 Nov 2 Dec 19 Dec 23 Dec 6 Jan 16 Jan 3 Feb 13 Feb 17 Feb 26 Feb
US$
/mt
Scrap Iron
Scrap Iron/MT (High) Scrap Iron/MT(Low)
42.0
47.0
56.0
61.0
55.052.0
57.0
61.058.0 59.0
73.0
80.0 80.0
30.0
40.0
50.0
60.0
70.0
80.0
90.0
Jan Feb Mar Apr May Jun Jul Aug Sep Oct Nov Dec Jan
2016 2017
US$
/dm
tu
Iron Ore
17.0
16.1
15.8
16.216.4
16.7
17.0
16.8
17.5
17.7
18.0
18.4
14.0
14.5
15.0
15.5
16.0
16.5
17.0
17.5
18.0
18.5
19.0
9 Dec 16 Dec 23 Dec 30 Dec 6 Jan 13 Jan 20 Jan 27 Jan 3 Feb 10 Feb 17 Feb 24 Feb
US$
/ozSilver
37.4
36.4 36.4
36.8
37.8
38.3 38.6
38.1
39.1
39.5
39.9
40.3
34.0
35.0
36.0
37.0
38.0
39.0
40.0
41.0
9 Dec 16 Dec 23 Dec 30 Dec 6 Jan 13 Jan 20 Jan 27 Jan 3 Feb 10 Feb 17 Feb 24 Feb
US$
/oz
Gold

MITI Tower, No. 7, Jalan Sultan Haji Ahmad Shah, 50480 Kuala Lumpur, Malaysia Tel: +603 - 8000 8000 Fax: +603 - 6202 9446
MITI Weekly Bulletin | www.miti.gov.my
Malaysia-Saudi MoU on Trade and Investment , 27 February 2017MITI Programme

MITI Tower, No. 7, Jalan Sultan Haji Ahmad Shah, 50480 Kuala Lumpur, Malaysia Tel: +603 - 8000 8000 Fax: +603 - 6202 9446
MITI Weekly Bulletin | www.miti.gov.my
YB Dato’ Sri Mustapa Mohamed Visited Decathlon’s Premise at Bandar Sri Damansara, 23 Februari 2017
MITI Programme

MITI Tower, No. 7, Jalan Sultan Haji Ahmad Shah, 50480 Kuala Lumpur, Malaysia Tel: +603 - 8000 8000 Fax: +603 - 6202 9446
MITI Weekly Bulletin | www.miti.gov.my
MITI Programme
Majlis Menandatangani Ikrar Bebas Rasuah, 27 February 2017

MITI Tower, No. 7, Jalan Sultan Haji Ahmad Shah, 50480 Kuala Lumpur, Malaysia Tel: +603 - 8000 8000 Fax: +603 - 6202 9446
MITI Weekly Bulletin | www.miti.gov.my
IKRAR BEBAS RASUAH (IBR) (Corruption Free Pledge)
Saya, adalah dengan sesungguhnya dan suci hati berikrar bahawa sepanjang
perkhidmatan saya dengan Kementerian Perdagangan Antarabangsa dan Industri,:
i. Saya akan mematuhi sepenuhnya undang-undang, peraturan, prosedur serta
dasar-dasar Negara yang berkaitan dengan pencegahan jenayah rasuah dan salah
guna kuasa;
ii. Saya akan membenci dan menolak sebarang bentuk jenayah rasuah dan
salah guna kuasa, serta memberikan kerjasama sepenuhnya kepada Suruhanjaya
Pencegahan Rasuah Malaysia dalam mencegah sebarang perlakuan jenayah
rasuah dan salah guna kuasa;
iii. Saya tidak akan melibatkan diri dalam sebarang bentuk jenayah rasuah dan
salah guna kuasa, sama ada secara langsung atau tidak langsung, dengan mana-
mana pihak yang berurusan dengan Kementerian Perdagangan Antarabangsa dan
Industri;
iv. Saya akan memastikan kakitangan-kakitangan di bawah seliaan saya tidak akan
melibatkan diri dalam sebarang bentuk jenayah rasuah dan salah guna kuasa dalam
apa-apa jua urusan berkaitan dengan Kementerian Perdagangan Antarabangsa dan
Industri; dan
v. Saya akan melaporkan kepada Suruhanjaya Pencegahan Rasuah Malaysia,
dengan seberapa segera, sebarang bentuk perlakuan jenayah rasuah dan salah
guna kuasa yang melibatkan saya atau kakitangan-kakitangan di bawah seliaan
saya.

MITI Tower, No. 7, Jalan Sultan Haji Ahmad Shah, 50480 Kuala Lumpur, Malaysia Tel: +603 - 8000 8000 Fax: +603 - 6202 9446
MITI Weekly Bulletin | www.miti.gov.my
ANNOUNCEMENT
Anugerah Kecemerlangan Industri 2016
Asia Pacific’s Premier Maritime and Aerospace Showcase 2017
MEDIA RELEASETHE ESTABLISHMENT OF THE DIGITAL FREE TRADE ZONE (DFTZ)
The Ministry of International Trade and Industry (MITI) would like to respond to the media reports by The Star, Bernama and Utusan Malaysia dated on 20 February 2017 referring to the statement made by YB Datuk Seri Ong Ka Chuan, Second International Trade and Industry Minister on tax exemption for goods purchased through eCommerce transactions. MITI would like to emphasise that no decision has been made with regards to revision of the existing De Minimis threshold from the current rate of RM500 on goods purchased through eCommerce. Any announcement in relation to the Digital Free Trade Zone (DFTZ) will be made by the respective ministry and agencies concerned.
Ministry of International Trade and Industry (MITI)

MITI Tower, No. 7, Jalan Sultan Haji Ahmad Shah, 50480 Kuala Lumpur, Malaysia Tel: +603 - 8000 8000 Fax: +603 - 6202 9446
MITI Weekly Bulletin | www.miti.gov.my
MITI @ Your ServiceStrategic
Negotiations
Mohammad Sanusi Abdul KarimSenior Director
Syahril Syazli GhazaliDirector Wan Wadrina Wan Abdul Wahab
Senior Principal Assistant Director
Lim Chee HauSenior Principal
Assistant Director
Suresh a/l Kaliyana Sundram
Senior Principal Assistant Director
Sara Hani Mohd ZinSenior Assistant DirectorHazilah Argadan
PA to DirectorMohd Rifaat HussinAssistant Director
Email: [email protected]

MITI Tower, No. 7, Jalan Sultan Haji Ahmad Shah, 50480 Kuala Lumpur, Malaysia Tel: +603 - 8000 8000 Fax: +603 - 6202 9446
MITI Weekly Bulletin | www.miti.gov.my
Dear Readers,
Kindly click the link below for any comments in this issue. MWB reserves the right to edit and republish letters as reprints. http://www.miti.gov.my/index.php/forms/form/13
MITI Weekly BulleTIn (MWB) MoBIle Apps
MITI MWB APPs is now available for IOS, Android and Windows platforms. MWB APPs can be download from Gallery of Malaysian Government Mobile APPs (GAMMA) at the link: http://gamma.malaysia.gov.my/#/appDetails/85
MWB Facebook PageLike MWB page at https://www.facebook.com/MITIWeeklyBulletin/?fref=ts


