Download - MAGONTEC LIMITED ANNUAL REPORT 2016
A NNUA L REPOR T 2016 M AGON T EC L IMI T ED
CON T EN T S
Magontec is a leading manufacturer
of magnesium alloys and Cathodic
Corrosion Protection (anode) products
made from magnesium and titanium.
Magontec is a pioneer in the field of
magnesium alloys and anode products
with vast experience in production and
development of new alloy and anode
applications.
A summary of the Company’s corporate governance practices including the Corporate Governance Statement discussing adherence to the Australian Securities Exchange’s Third Edition “Corporate Governance Principles and Recommendations” can be located at www.magontec.com under the Investor Relations or Investor Centre section.
1 Global Locations and Activities
2 2016 Highlights
3 Executive Chairman’s Commentary
6 Financial Report
8 Metals Division – Magnesium Alloys
12 Cathodic Corrosion Protection –
Magnesium and Electronic Anodes
14 Magontec Qinghai Cast House Project
15 Research and Development
16 Board of Directors
18 Executive Management
22 Directors’ Report
33 Independent Auditor’s Declaration
34 Financial Statements
39 Notes to the Financial Statements
75 Directors’ Declaration
76 Independent Auditor’s Report
78 Shareholder Information
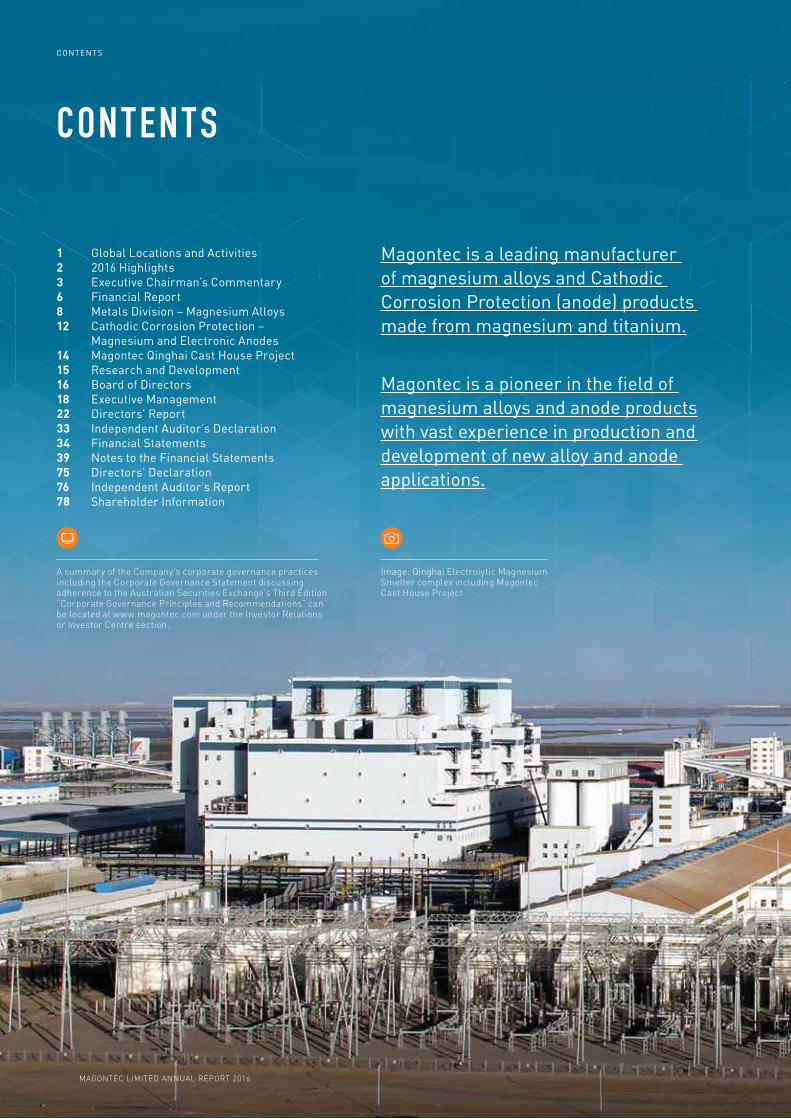
Image: Qinghai Electrolytic Magnesium Smelter complex including Magontec Cast House Project
MAGONTEC LIMITED ANNUAL REPORT 2016
CONTENTS

Bottrop
Santana Golmud
ShanxiTokyo
SydneyMelbourne
Xi’an
Production Sales Office Technology Centre Cast House Project Headquarters
Toronto
GLOBAL LOCAT IONS AND AC T IV I T IES
1MAGONTEC LIMITED ANNUAL REPORT 2016
GLOBAL LOCATIONS AND ACTIVITIES

2016 HIGHLIGH T S
− Magontec Qinghai Cast House now fully commissioned and prepared for mass production
− Qinghai Salt Lake Magnesium (QSLM) electrolytic plant completed and in commissioning stage
− Customer qualification of Magontec Qinghai to commence on supply of liquid magnesium metal from QSLM
− Cast House production, administration and management staff engaged at Golmud
− A strong year for Primary and Recycled Magnesium Alloys with overall volumes steady on improved conversion costs
− European Recycling operating at full capacity utilisation as cost controls offer more competitive product
− Rising volumes of specialty alloys supplied to automotive and aerospace sectors generating higher margins
− Continued strong growth in global automotive output driving magnesium alloy sector demand
− Volumes up 7% in 2016 and now up 40% in the last 2 years
− Investment in automation driving down conversion costs and driving up market share and volumes
− Operating cost improvements remain a key target for the CCP businesses in China and Europe
− Market and application expansion in electronic anodes delivers another strong year
MAGONTEC QINGHAI PROJECT
FINANCIAL HIGHLIGHTS
METALS DIVISION Magnesium Alloys
CATHODIC CORROSION PROTECTION DIVISION Magnesium and Electronic Anodes
FY14 FY15 FY16 FY14 FY15 FY16 FY14
Gross profit ($M)
8.5
12
.9
Gross profit margin (%)
9.3
6.4
11.3
14
.4
Cash from underlying operations ($M)
3.5
0.7
4.9
FY15 FY16
2 MAGONTEC LIMITED ANNUAL REPORT 2016
2016 HIGHLIGHTS

E X ECU T IVE CHAIRMA N’S COMMEN TARY
2016 has been a year of solid growth and
some considerable progress for Magontec.
The Company has achieved higher levels
of efficiency in all its operating divisions
as the effects of investment in plant and
people over the last 4 years have positively
impacted sales and profits.
In the near future the Qinghai Salt Lake
Magnesium smelter is expected to
commence production and begin supply
of liquid pure magnesium to the Magontec
Qinghai Cast House facility.
2017 will be an exciting and challenging year
for our magnesium alloy manufacturing
operations as we return to markets in Asia,
Europe and North America with a newly
competitive product in greater volume.
Many of these markets have been hitherto
beyond the reach of our existing production
facilities. As production at Qinghai
commences it may become possible for the
company to examine other opportunities in
business areas where Magontec already
has skills and expertise.
In 2016 Magontec generated $4.9 million
of cash from underlying operating activities.
This was largely directed to reducing net
debt, which fell nearly $2 million from
$12 million to just over $10 million over
the period as well as capital expenditure
on the Qinghai project. While there
remain some capital commitments at the
Qinghai project the majority of committed
capital expenditure is now behind us. The
improvement in cash generation at the
operating level comes at an opportune
time for Magontec as the larger volumes
occasioned by the commencement of the
Qinghai project will require higher overall
levels of working capital.
Magnesium industry trends in 2016 have
continued to be challenging. The price of
pure magnesium, our principal raw material
for both magnesium alloy and magnesium
anode manufacturing, has been particularly
volatile. Prices for alloying elements have
also seen sharp rises in recent months
and passing on these price adjustments
in a competitive market environment has
been difficult.
Turning to our manufacturing businesses
I am pleased to report that there was
another decline in the company’s Total
Reportable Injury (TRI) rate. This is
a key metric for our business as our
employees work in a potentially hazardous
environment. Our new Qinghai Cast House
will be a highly automated facility and will
also use a new cover gas system offering
one of the healthiest and safest work
environments in the magnesium industry.
Shareholders can also look forward
to further growth in sales and
profitability as we approach
the commencement of our new
production facility at Golmud in Qinghai
Province, China. Magontec’s new Cast
House in Qinghai represents the largest
investment and most exciting prospect since
Magontec became an independent company
in 2011. It is expected to be a company-
transforming project.
Over the last four years we have sought
to build a world-leading magnesium alloy
business sustained by a supply of primary
magnesium alloy that is competitively priced
and environmentally unrivalled. From the
new Magontec Qinghai Cast House we will
continue to pursue both of those objectives
with greater vigour.
Nicholas AndrewsExecutive Chairman
3MAGONTEC LIMITED ANNUAL REPORT 2016
EXECUTIVE CHAIRMAN’S COMMENTARY
Magnesium alloy recycling operations in
Germany and Romania have performed
well. Both factories operated at close
to full capacity reflecting the newly
competitive economics of Magontec’s
European recycling processes. In China
recycling operations were reduced in 2016
by the closure of our facility at Suzhou.
Our current Chinese recycling business
forms part of the Shanxi factory operations.
It also enjoyed a strong year.
In all regions of the world magnesium alloy
recycling is highly competitive. Magontec
has won its current market position in
Europe and North-Western China by
achieving lower conversion costs than
its competitors. However these facilities
require constant process improvements
to stay ahead of the cost curve.
The arrival of primary magnesium alloy
product from our new Qinghai plant
should strengthen Magontec’s position in
European markets and provide the company
the opportunity to offer a comprehensive
primary alloy and scrap recycling contract
to our regional customer base.
The magnesium anode (cathodic corrosion
protection) businesses in Europe and China
both enjoyed a positive year in 2016. The
European business has recovered strongly
over the last two years but remains a
work in progress. The relocation of this
manufacturing operation to Romania in 2013
restored a base level of competitiveness
for Magontec in the Europe and Middle East
region. Over the next 12 months further
process changes will be introduced that
are expected to increase productivity in a
business that is highly sensitive to volume.
In Magontec’s Chinese magnesium anode
business higher volumes and lower
conversion costs were the critical factors
driving profit improvement. Both locations
face a tough 2017 as raw material prices
have risen by around 10% on 2016. This
has been particularly acute in China where
competitive forces are often augmented by
regional grants and other hidden subsidies.
The primary magnesium alloy
manufacturing operations in Shanxi
Province have performed well in 2016.
Our management team in Shanxi is
particularly strong and have achieved
further improvements in conversion costs.
Nonetheless the market environment for
magnesium alloys in China and around
the world remains very competitive.
Our principal competitors are integrated
magnesium manufacturers producing
pure magnesium, magnesium alloy
and occasionally downstream die cast
applications offering a more flexible and
occasionally lower cost production process.
Commencement of operations at Qinghai
is expected to address this competitive
issue for Magontec in 2017 and beyond.
In the period since the acquisition of the
Magontec assets in 2011 the company
has been focussed on developing its
existing assets and a platform for future
growth. As we move into the next phase
for the company with the commencement
of production at Qinghai, the Board and
management will be considering strategy
for 2018 and beyond.
Currently the company has its major
original material (primary magnesium
alloy) production base in China, soon
to be at Qinghai, and two downstream
manufacturing activities in magnesium
recycling and magnesium anodes in
Europe and China. Running concurrently
with the upgrade programs for each of
these businesses have been a series of
research and development programs to
improve existing products and services
and to improve productivity and profitability.
Over the coming year new machines and
processes will be introduced in recycling
and anode manufacturing developed in-
house by Magontec engineers.
In the metals area there have also been
exciting developments as we come to
the end of a three-year magnesium alloy
research program. Our partners in this
research have included RMIT in Melbourne,
who have conducted some original research
into magnesium micro-structures, as well
as leading magnesium alloy application
manufacturers in Europe. The fruits of these
labours are harvested over the longer term
but we can already see opportunities for a
wider application of Magontec’s proprietary
AE family of alloys in the automotive, power
tool and electronics industries and we are
actively marketing these to prospective
customers all over the World.
E X ECU T IVE CH A IRM A N’S COMMEN TA RYcontinued
In all regions
of the world
magnesium alloy
recycling is highly
competitive.
Magontec has won
its current market
position in Europe
and North-Western
China by achieving
lower conversion
costs than its
competitors.
4 MAGONTEC LIMITED ANNUAL REPORT 2016
EXECUTIVE CHAIRMAN’S COMMENTARY
Magontec is a company with nearly
65 years of history in the magnesium
industry, a period through which it has
gathered considerable knowledge.
This is delivered through long serving
personnel who form our anode technical
services teams in Germany and China
and the engineers who oversee and refine
production processes in our factories.
With access to enhanced cash flows and
new production opportunities Magontec
expects to be able to leverage these abilities
more adroitly in the period ahead.
2017 is going to be a year of some
complexity for Magontec. The timing
of the commencement of production at
Qinghai is highly dependent on the speed
of commissioning of the dehydration and
reduction units that are owned and operated
by Qinghai Salt Lake Magnesium (QSLM).
This is very difficult to assess at the time of
writing. We know that access to the Qinghai
product will improve our competitiveness
by reducing our costs of production. We
expect to regain market share lost in the
last few years and to win new customers
in both primary and recycled magnesium
alloy markets. We expect this will also
have flow on effects to our magnesium
anodes business.
While we look forward to these events with
great anticipation we know that there are
heightened risks and costs in a period of
change. Over the last 12 months we have
incurred growing cash costs at Magontec
Qinghai as we engage staff at every
level to prepare the business for start of
production. At the same time in all three of
our businesses we see robust competition,
volatile pricing and occasionally uncertain
markets as change and disruption
challenge our customers, particularly
in the automotive industry, every much
as they challenge Magontec.
In these uncertain times our company is
fortunate to have a stable and experienced
Board and management team. I would like
to thank Board members for their strong
contributions through the last 12 months.
I would also like to thank the staff and
management who have achieved a result
that, whilst modest in the greater scheme
of things, is a strong statement of our intent
in the years ahead.
Nicholas Andrews Executive Chairman
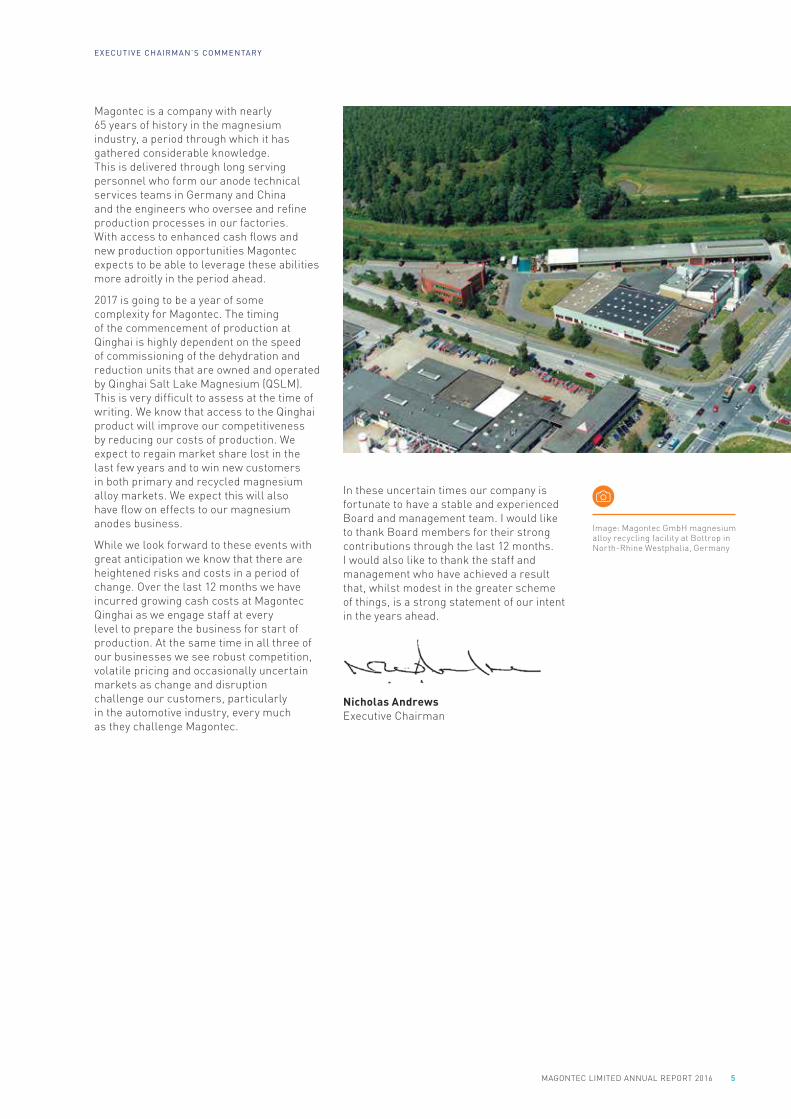
Image: Magontec GmbH magnesium alloy recycling facility at Bottrop in North-Rhine Westphalia, Germany
5MAGONTEC LIMITED ANNUAL REPORT 2016
EXECUTIVE CHAIRMAN’S COMMENTARY

Reported net profit after tax was
$620,000 for the 12 months to
31 December 2016, significantly
ahead of the prior year
(2015: $45,000).
The consolidated entity saw gross profit
increases in both the metals and anodes
segments, with gains in the Romanian
metals business a particular highlight –
an outstanding result, after much hard work
by the local management team in Europe.
FINANCIAL REPOR T
Underlying Net Profit After Tax* for the 12 months
to 31 December 2016 was $1.1 million compared
with a loss of $0.2 million in 2015 while the Gross
Profit margin rose to 11.3% from 9.3% in the prior
corresponding period.
Reconciliation of significant items in earnings
12 months to 31 Dec 2016
$’000
12 months to 31 Dec 2015
$’000
Net Profit Before Tax, unrealised FX
and significant items 2,409 1,310
Significant items
Less non-cash equity expense (183) (174)
Less STI provision (145) –
Less LTI provision (141) –
Less extraordinary doubtful debts
provision PRC – (470)
Less impairment associated with Suzhou
plant closure – (371)
Less Redundancies at Suzhou plant – (149)
VAT levies in Romania and adjustments
to retained earnings – (243)
Net Profit Before Tax excluding unrealised FX 1,939 (98)
Less tax expense (821) (150)
Net Profit After Tax before unrealised FX 1,118 (248)
Add/(subtract) unrealised FX gains/(losses) (498) 293
Reported Net Profit Before Tax 620 45
Underlying NPAT* ($m)
The result was also boosted by disciplined cost control and the absence
of significant non-recurring adjustments seen in the prior year such as
the Suzhou impairment and VAT levies.
The table below has been provided to allow shareholders to better
understand the significant items comprised in the results of both
the current and prior year.
* Underlying Net Profit After Tax is defined here as Reported Net Profit After Tax excluding unrealised foreign exchange gains and losses.
-2.0
-1.5
-1.0
-0.5
0.0
0.5
1.0
1.5
2014 2015 2016
MAGONTEC LIMITED ANNUAL REPORT 20166
FINANCIAL REPORT
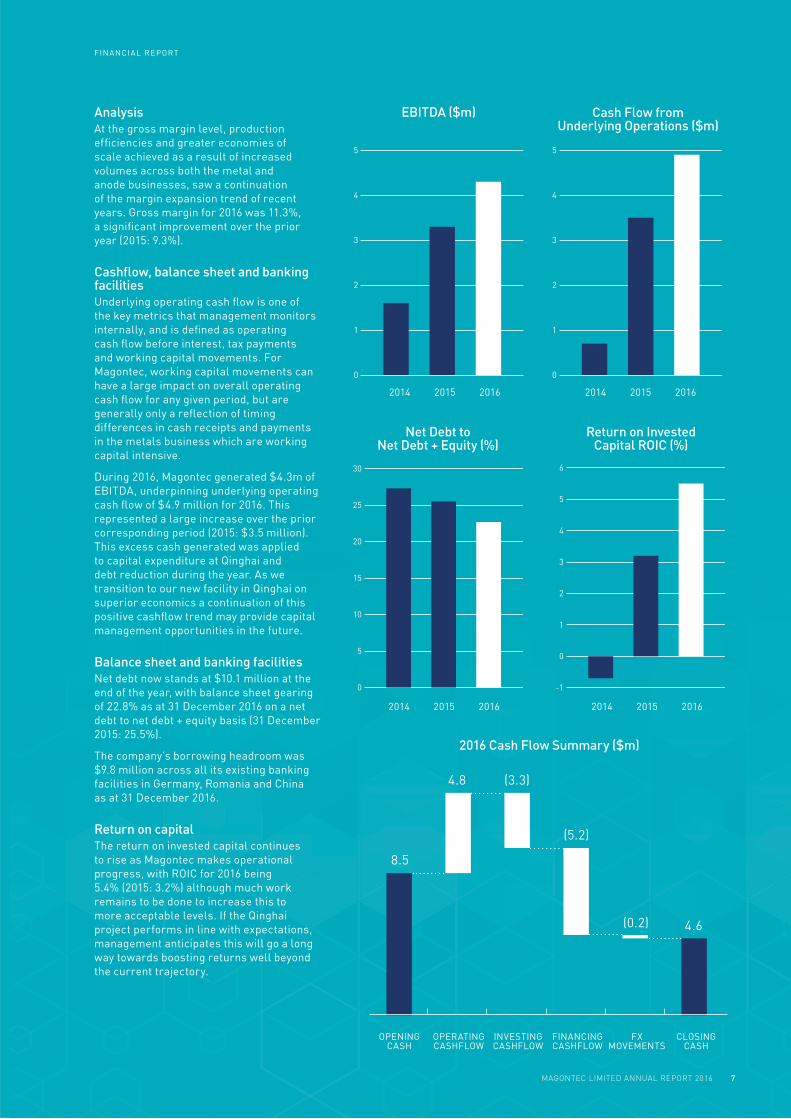
Analysis
At the gross margin level, production
efficiencies and greater economies of
scale achieved as a result of increased
volumes across both the metal and
anode businesses, saw a continuation
of the margin expansion trend of recent
years. Gross margin for 2016 was 11.3%,
a significant improvement over the prior
year (2015: 9.3%).
Cashflow, balance sheet and banking facilities
Underlying operating cash flow is one of
the key metrics that management monitors
internally, and is defined as operating
cash flow before interest, tax payments
and working capital movements. For
Magontec, working capital movements can
have a large impact on overall operating
cash flow for any given period, but are
generally only a reflection of timing
differences in cash receipts and payments
in the metals business which are working
capital intensive.
During 2016, Magontec generated $4.3m of
EBITDA, underpinning underlying operating
cash flow of $4.9 million for 2016. This
represented a large increase over the prior
corresponding period (2015: $3.5 million).
This excess cash generated was applied
to capital expenditure at Qinghai and
debt reduction during the year. As we
transition to our new facility in Qinghai on
superior economics a continuation of this
positive cashflow trend may provide capital
management opportunities in the future.
Balance sheet and banking facilities
Net debt now stands at $10.1 million at the
end of the year, with balance sheet gearing
of 22.8% as at 31 December 2016 on a net
debt to net debt + equity basis (31 December
2015: 25.5%).
The company’s borrowing headroom was
$9.8 million across all its existing banking
facilities in Germany, Romania and China
as at 31 December 2016.
Return on capital
The return on invested capital continues
to rise as Magontec makes operational
progress, with ROIC for 2016 being
5.4% (2015: 3.2%) although much work
remains to be done to increase this to
more acceptable levels. If the Qinghai
project performs in line with expectations,
management anticipates this will go a long
way towards boosting returns well beyond
the current trajectory.
0
1
2
3
4
5
EBITDA ($m)
0
1
2
3
4
5
Cash Flow from Underlying Operations ($m)
2014 2015 2016 2014 2015 2016
0
5
10
15
20
25
30
Net Debt to Net Debt + Equity (%)
-1
0
1
2
3
4
5
6
Return on Invested Capital ROIC (%)
2014 2015 2016 2014 2015 2016
2016 Cash Flow Summary ($m)
8.5
4.8 (3.3)
(5.2)
(0.2) 4.6
OPENING CASH
OPERATING CASHFLOW
INVESTING CASHFLOW
FINANCING CASHFLOW
FX MOVEMENTS
CLOSING CASH
7MAGONTEC LIMITED ANNUAL REPORT 2016
FINANCIAL REPORT

In 2017 the metals business
looks forward to the
commencement of production
at the new primary magnesium
alloy plant at Golmud in
Qinghai Province PRC. The
Qinghai project is expected
to significantly improve the
economics of Magontec’s
Chinese unit and that of
the overall business.
Magontec is a leading magnesium
alloy manufacturer supplying
generic and patented alloys to
companies who manufacture die
cast and extruded magnesium products
all over the World.
Globally traded magnesium alloys are
mainly sourced from China where Magontec
buys pure magnesium and other alloying
elements and manufactures primary
magnesium alloys at its facility in Shanxi
Province, PRC.
Magontec is also a recycler of magnesium
alloys in Germany, Romania and China. Over
40% of magnesium alloy material sold to
customers is returned in the form of scrap
that Magontec recycles and returns to the
die-casting and extrusion industries in
the form of ingots.
ME TALS DIV ISION – MAGNESIUM ALLOYS
In 2016 Magontec saw a sharp improvement in
profitability in its magnesium alloy manufacturing
business driven by a more competitive offering; the result
of investment in new plant and processes in Europe and
higher levels of production efficiency in China.
Total worldwide Magontec magnesium alloy metal sales (Suzhou recycling plant closed in 2015)
Total metal sales ex-Suzhou Suzhou recycling
Metric tonnes
2014 2015 2016
40,000
25,000
35,000
30,000
15,000
10,000
5,000
20,000
0
8 MAGONTEC LIMITED ANNUAL REPORT 2016
OPERATIONS REPORT
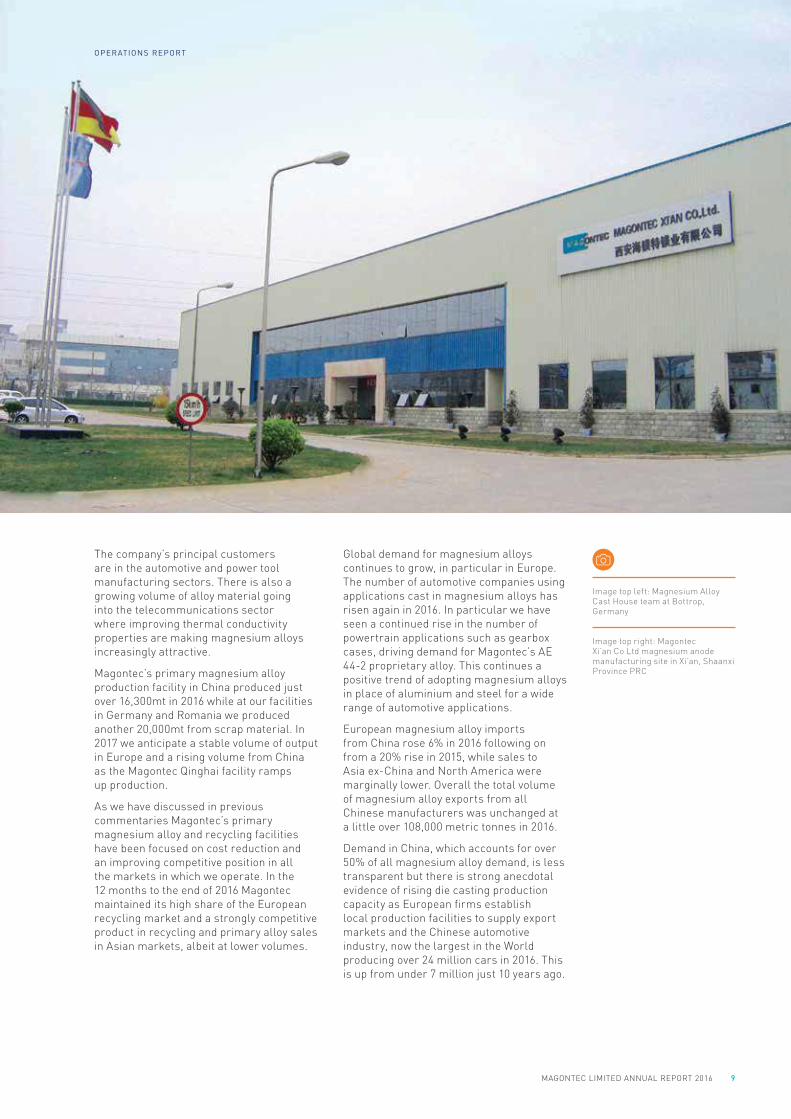
The company’s principal customers
are in the automotive and power tool
manufacturing sectors. There is also a
growing volume of alloy material going
into the telecommunications sector
where improving thermal conductivity
properties are making magnesium alloys
increasingly attractive.
Magontec’s primary magnesium alloy
production facility in China produced just
over 16,300mt in 2016 while at our facilities
in Germany and Romania we produced
another 20,000mt from scrap material. In
2017 we anticipate a stable volume of output
in Europe and a rising volume from China
as the Magontec Qinghai facility ramps
up production.
As we have discussed in previous
commentaries Magontec’s primary
magnesium alloy and recycling facilities
have been focused on cost reduction and
an improving competitive position in all
the markets in which we operate. In the
12 months to the end of 2016 Magontec
maintained its high share of the European
recycling market and a strongly competitive
product in recycling and primary alloy sales
in Asian markets, albeit at lower volumes.
Global demand for magnesium alloys
continues to grow, in particular in Europe.
The number of automotive companies using
applications cast in magnesium alloys has
risen again in 2016. In particular we have
seen a continued rise in the number of
powertrain applications such as gearbox
cases, driving demand for Magontec’s AE
44-2 proprietary alloy. This continues a
positive trend of adopting magnesium alloys
in place of aluminium and steel for a wide
range of automotive applications.
European magnesium alloy imports
from China rose 6% in 2016 following on
from a 20% rise in 2015, while sales to
Asia ex-China and North America were
marginally lower. Overall the total volume
of magnesium alloy exports from all
Chinese manufacturers was unchanged at
a little over 108,000 metric tonnes in 2016.
Demand in China, which accounts for over
50% of all magnesium alloy demand, is less
transparent but there is strong anecdotal
evidence of rising die casting production
capacity as European firms establish
local production facilities to supply export
markets and the Chinese automotive
industry, now the largest in the World
producing over 24 million cars in 2016. This
is up from under 7 million just 10 years ago.
Image top left: Magnesium Alloy Cast House team at Bottrop, Germany
Image top right: Magontec Xi’an Co Ltd magnesium anode manufacturing site in Xi’an, Shaanxi Province PRC
9MAGONTEC LIMITED ANNUAL REPORT 2016
OPERATIONS REPORT

Magontec continues to play a leading
role in encouraging magnesium alloy
usage in the automotive, power tool and
telecommunications industry by developing
and promoting its proprietary alloys and
by funding research projects in Australia,
Asia and Europe.
By combining leadership in magnesium
R&D with new recycling production
processes and production of low CO2
material from the new Qinghai plant,
Magontec offers an increasingly competitive
and attractive range of products, skills
and services to its existing customer base.
This has been particularly evident over the
last 12 months, as the metals division has
continued to attract new business through
improved pricing and service offerings.
In the coming months our company and
industry face a number of challenges in both
primary magnesium alloy and recycling
activities. These include the logistics and
regulatory requirements associated with
commencement of production at Qinghai,
potential ownership changes among
our principal customers and the largely
unpredictable effects of US politics on
Chinese access to international markets.
It is, however, fair to say that magnesium is
likely to be less affected than most markets
by changes in existing international trade
patterns; in 2005 the US imposed a 141%
import tax on Chinese magnesium products
which resulted in a much smaller domestic
US die casting industry.
Other challenges for Magontec in 2016
reflect the nature of the magnesium
industry in China and in particular the
volatility of pure magnesium pricing.
Through the past year the price of pure
magnesium rose 32% to ¥15,050 and
reached a high of ¥16,750, up over 47%
year on year. Since the end of 2016 the
price has fallen as low as ¥13,000 in
mid-January 2017, a decline of 14% in just
2 weeks. As a spot purchaser for contracts
for delivery in Europe, Japan and North
America that require significant lead times,
Magontec is heavily reliant on the skills and
business talents of purchasing and sales
executives at our Xi’an offices and in Europe.
Over the last 12 months they have managed
this price volatility extremely well which
has meant Magontec has not suffered any
significant losses on inventory or longer-
term contracts.
The magnesium industry has seen some
consolidation in the last 2 years with a
major Chinese company acquiring a leading
magnesium alloy die-caster as well as a
large pure magnesium plant. Furthermore
the key competitors for Magontec in China
are now similarly vertically integrated.
Magontec is addressing this challenge
through its initiatives in Qinghai where our
close relationship with the Qinghal Salt Lake
Magnesium Co. Ltd (QSLM), soon to be the
world’s largest pure magnesium producer,
will provide Magontec with access to many
of the benefits of an integrated structure.
Over the last 12 months there have
also been many positive trends for the
magnesium industry including rising
automotive sales in the key European, North
American and Chinese markets. While there
is a trend away from diesel engines back to
petrol, which will be neutral for magnesium,
the trend to hybrid and especially electric
cars will likely be positive. Magontec’s
newly developed high thermal conductivity
alloys, initially developed for the
telecommunications industry, are expected
to have applications in electric cars where
light weight and heat dissipation will also
be highly prized attributes that extend
battery life and mileage.
The Magontec metals division is also
pursuing a number of specialty metal
product categories. These are high
specification alloys largely focussed on
the aerospace industry. In 2016 good
progress has been made with the first
of these products in Europe and North
America and in 2017 Magontec expects to
follow up with other specialty magnesium
alloy products. In general these are high
margin/low volume products and target a
new customer base. This will increasingly
diversify the company’s profile and address
some of the risks associated with a high
reliance on volume magnesium alloys
in the metals business.
ME TA L S DIV ISION – M AGNE SIUM A LLOYScontinued
By combining
leadership in
magnesium R&D
with new recycling
production
processes and
production of
low CO2 material
from the new
Qinghai plant,
Magontec offers
an increasingly
competitive and
attractive range
of products, skills
and services
to its existing
customer base.
10 MAGONTEC LIMITED ANNUAL REPORT 2016
OPERATIONS REPORT

¥9,500
¥10,500
¥11,500
¥12,500
¥13,500
¥14,500
¥15,500
¥16,500
¥17,500
04-Jan-16 04-Mar-16 04-May-16 04-Jul-16 04-Sep-16 04-Nov-16 04-Jan-17
80
100
120
140
160
180
200
04-Jan-16 04-Feb-16 04-Mar-16 04-Apr-16 04-May-16 04-Jun-16 04-Jul-16 04-Aug-16 04-Sep-16 04-Oct-16 04-Nov-16 04-Dec-16 04-Jan-17 04-Feb-17
Al Ingot 99.7% Ch RMB FeSi 75% Ch RMB/mt Base 100
Mg 99.9% Ch RMB Base 100 Zinc ingot 99.99% Ch RMB Base 100
70.0
75.0
80.0
85.0
90.0
95.0
100.0
0.0
5.0
10.0
15.0
20.0
25.0
30.0
2013 2014 2015 2016 2017 2018
China USA Japan Germany
Actual Forecast
Global (RHS)
Global MV sales trend
Magnesium and other material price charts
Global light vehicle sales (millions)
Pure magnesium price chart (Chinese RMB)
Since 1 January 2016
Pure magnesium, alloying elements and raw material price movements.
Based to 100 on 1 January 2016
11MAGONTEC LIMITED ANNUAL REPORT 2016
OPERATIONS REPORT

Magontec manufactures a wide
variety of magnesium anodes
in China and Romania and
supplies those products to the
global water heater industry. This is a
‘downstream’ value adding business that
has strong synergies with our magnesium
alloy manufacturing and recycling activities.
The Romanian anode business is located
on the same site as the Romanian recycling
operation minimising handling and melting
costs in this very competitive sector.
Magontec is a global leader in magnesium
anode production by both volume and
quality, supplying leading hot water
heater manufacturers in Europe, Asia
and the Americas with a competitive and
quality magnesium anode that provides
effective cathodic corrosion protection
for conventional and renewable energy
water tanks.
Magontec is also a manufacturer of
electronic anodes that provide a higher level
of corrosion protection and are targeted at
higher value and more sophisticated water
heater products such as heat pump devices.
This product is also finding new markets
in other corrosion critical products such
as heat transfer devices.
CAT HODIC CORROSION PROT EC T ION – MAGNESIUM A ND ELEC T RONIC A NODES
In the 12 months to 31 December 2016 the CCP division
saw revenues rise 2.5% and are now up 32% over the last
24 months to $23.4 million. Gross Profit for the same
period has also risen by 10% to $7.1 million restoring this
division to profitability after a period of lower returns.
In China and Europe Magontec
is building a stronger
and more competitive
platform. Both businesses
now enjoy considerable
momentum, the result of a
strong focus on production
process improvements and
enhanced service levels.
Image top: Magnesium anodes.
12 MAGONTEC LIMITED ANNUAL REPORT 2016
OPERATIONS REPORT

In 2016 the CCP division’s overall business
performed well with magnesium anode
volumes up over 7% to 2,000 metric tonnes
following a 31% rise in 2015. The Asian
business in particular enjoyed a robust
year leveraging improving economies of
scale despite continuing unit price declines.
Overall the company’s global magnesium
anodes business has consistently reduced
unit costs of manufacturing more
rapidly than the decline in sales prices,
notwithstanding the sharp rise in raw
material costs, particularly evident in
the last quarter of 2016.
As the anode business has experienced
a consistent price reduction environment
in the last few years we have sought
to leverage both the efficiencies of an
integrated magnesium alloy manufacturer
and recycler with a rapid increase in
automation. We have introduced new
machinery in China and Romania to improve
manufacturing process efficiency and
reduce wastage. In 2016 the company
embarked on a further round of capital
investment designed to increase automation
and further improve unit costs of production
at both magnesium anode factories.
Another strategic initiative commenced in
2014 was to enhance the sales network,
particularly in Europe, North America
and the Middle East. While this has had
some short-term impact on costs we can
now address our regional markets more
comprehensively and pursue a broader
base of customers and markets. In 2017
we have already engaged additional sales
and marketing resources in North America
to assist us in building a stronger position
in both magnesium and electronic anodes
in that market.
Our overall strategy in the CCP business
has been to drive down our costs and offer
a high level of service to a customer base
that includes large and small companies
all over the world. The magnesium anode
industry is characterised by a large number
of smaller manufacturers who are very cost
competitive at low volumes. Our challenge
has been to match those prices through
developing new manufacturing techniques
and processes. Over the last three years we
have successfully risen to that challenge
and in 2017 and beyond we expect to build
further on our progress to date.
Image top right: Magontec Romania SRL - production and administration staff.
Magontec global magnesium anode volumes and revenues
CCP division revenues Magnesium anode volumes (LHS)
2014 2015 2016
2,200
Metric tonnes
2,000
1,800
1,600
1,400
1,200
1,000
A$25 mil
A$20 mil
A$10 mil
A$15 mil
A$0 mil
A$5 mil
13MAGONTEC LIMITED ANNUAL REPORT 2016
OPERATIONS REPORT
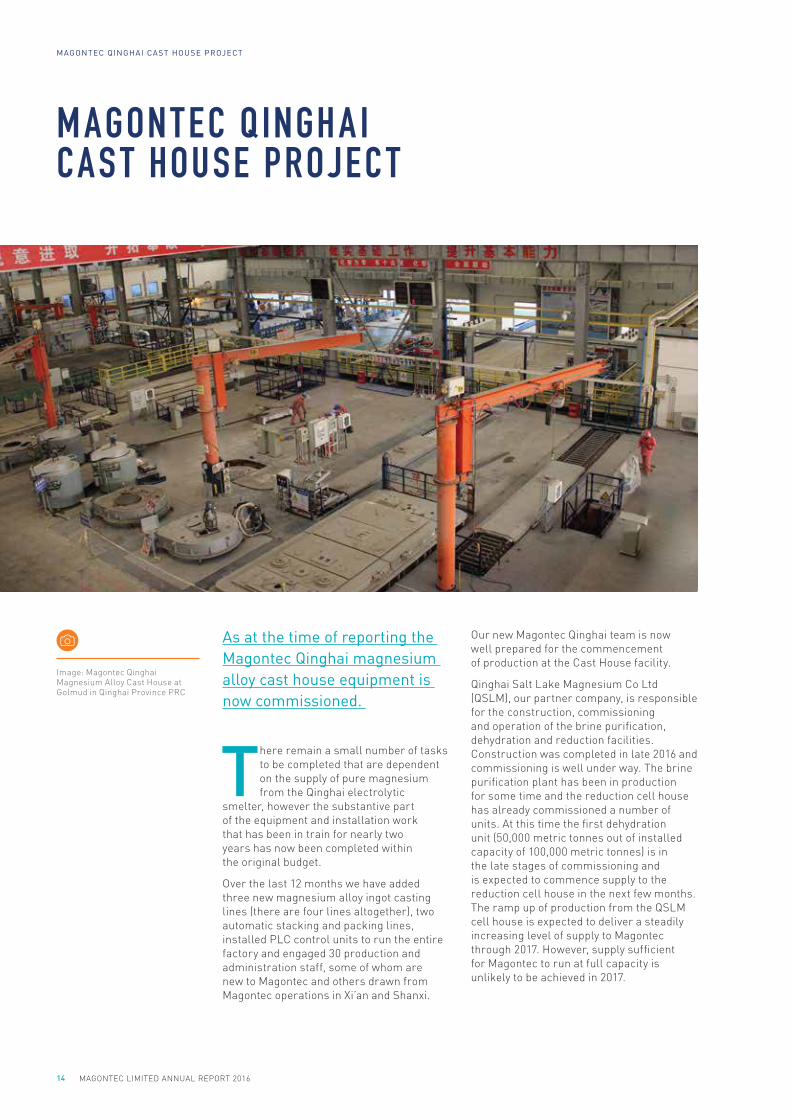
As at the time of reporting the
Magontec Qinghai magnesium
alloy cast house equipment is
now commissioned.
There remain a small number of tasks
to be completed that are dependent
on the supply of pure magnesium
from the Qinghai electrolytic
smelter, however the substantive part
of the equipment and installation work
that has been in train for nearly two
years has now been completed within
the original budget.
Over the last 12 months we have added
three new magnesium alloy ingot casting
lines (there are four lines altogether), two
automatic stacking and packing lines,
installed PLC control units to run the entire
factory and engaged 30 production and
administration staff, some of whom are
new to Magontec and others drawn from
Magontec operations in Xi’an and Shanxi.
MAGONTEC Q INGHA I CAS T HOUSE PRO JEC T
Image: Magontec Qinghai Magnesium Alloy Cast House at Golmud in Qinghai Province PRC
Our new Magontec Qinghai team is now
well prepared for the commencement
of production at the Cast House facility.
Qinghai Salt Lake Magnesium Co Ltd
(QSLM), our partner company, is responsible
for the construction, commissioning
and operation of the brine purification,
dehydration and reduction facilities.
Construction was completed in late 2016 and
commissioning is well under way. The brine
purification plant has been in production
for some time and the reduction cell house
has already commissioned a number of
units. At this time the first dehydration
unit (50,000 metric tonnes out of installed
capacity of 100,000 metric tonnes) is in
the late stages of commissioning and
is expected to commence supply to the
reduction cell house in the next few months.
The ramp up of production from the QSLM
cell house is expected to deliver a steadily
increasing level of supply to Magontec
through 2017. However, supply sufficient
for Magontec to run at full capacity is
unlikely to be achieved in 2017.
14 MAGONTEC LIMITED ANNUAL REPORT 2016
MAGONTEC QINGHAI CAST HOUSE PROJECT
Magontec has a long history of
alloy research and development
stretching back to predecessor
organisations, namely, Hydro
Magnesium’s magnesium competence
centre in Porsgrunn, Norway and the
CAST Co-operative Research Centres
in Melbourne and Brisbane, Australia.
Magontec continues to be active in new
alloy development through a collaborative
model. In conjunction with funding from
the Australian Research Council through
their linkage grant program, Magontec
supports R&D activities at Australian
research organisations and elsewhere.
Collaboration in R&D for Magontec means
two things; collaboration with Research
Providers, and, perhaps more importantly,
collaboration with OEMs who will ultimately
utilise the alloys. Magontec currently has a
number of development projects underway
with automotive and non-automotive OEM’s
in Germany, China and elsewhere.
The path from research discovery to
revenue from products takes several years
and in each year there are items covering
the entire spectrum of development.
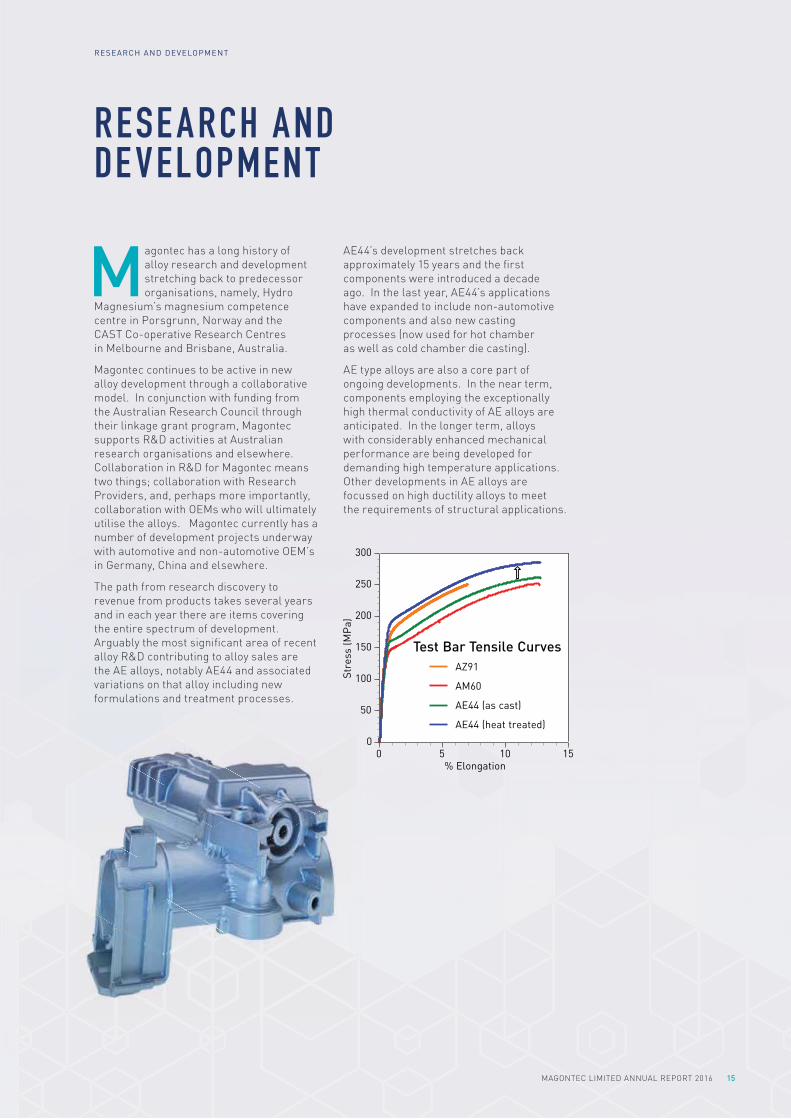
Arguably the most significant area of recent
alloy R&D contributing to alloy sales are
the AE alloys, notably AE44 and associated
variations on that alloy including new
formulations and treatment processes.
RESE ARCH A ND DE VELOPMEN T
AE44’s development stretches back
approximately 15 years and the first
components were introduced a decade
ago. In the last year, AE44’s applications
have expanded to include non-automotive
components and also new casting
processes (now used for hot chamber
as well as cold chamber die casting).
AE type alloys are also a core part of
ongoing developments. In the near term,
components employing the exceptionally
high thermal conductivity of AE alloys are
anticipated. In the longer term, alloys
with considerably enhanced mechanical
performance are being developed for
demanding high temperature applications.
Other developments in AE alloys are
focussed on high ductility alloys to meet
the requirements of structural applications.
0
50
100
150
200
250
300
0 5 10 15
Str
ess
(MP
a)
% Elongation
AZ91
AM60
AE44 (as cast)
AE44 (heat treated)
Test Bar Tensile Curves
15MAGONTEC LIMITED ANNUAL REPORT 2016
RESEARCH AND DEVELOPMENT

Nicholas AndrewsExecutive Chairman
B Ec.(Syd)
Mr Andrews has been the Executive
Chairman of Magontec Limited since
November 2009.
From 2007 to 2009 Mr Andrews served
as a Non-Executive Director of Advanced
Magnesium Limited prior to the acquisition
of Magontec GmbH and the company name
change to Magontec Limited.
Mr Andrews has a financial services
background in the funds management
industry and in investment banking. From
1996 to 2005 he was a Managing Director
at UBS Investment Bank and responsible
for global distribution of Australian and
New Zealand Equity products. From 1989 to
1996 Mr Andrews was the Chief Investment
Officer at LGT Investment Management in
charge of the group’s investment portfolios
for the Australasian region.
Mr Andrews is also a Vice President of the
International Magnesium Association.
Xie KangminNon-Executive Director (re-appointed 8 May 2015)
Member of the Finance, Audit and Compliance Committee (FAC)
Graduate of Chongqing University
Mr Xie is the President of Qinghai Salt
Lake Industry Co., Ltd. Mr Xie has been
an employee of the Qinghai Salt Lake
Industry Co Ltd (QSLI) since 1984 and
through this period has held a number
of roles within the organisation and
its subsidiary companies. Mr Xie is a
Senior Engineer and holds a Bachelor
of Engineering (Mining) degree from
Chongqing University. QLSI is the parent
company of Qinghai Salt Lake Magnesium
Limited (QSLM).
QSLM is a 29.19% substantial shareholder
in Magontec Limited and the company
with whom Magontec Limited has entered
into a Cooperation Agreement in relation
to the alloy production facility at Golmud
in Qinghai province PRC.
Andre LabuschagneNon-Executive Director (re-appointed 11 May 2016)
Member of the Finance, Audit and Compliance Committee (FAC)
B. Comm (Potchefstroom University)
Mr Labuschagne is the Executive Chairman
of Aeris Resources Limited (formerly Straits
Resources Limited) which is a substantial
shareholder of Magontec Limited to the
extent of 13.15% at the date of this report.
Mr Labuschagne is an experienced mining
executive with a career spanning more than
25 years, primarily in the gold industry,
and has held various executive roles in
South Africa, PNG, Fiji and Australia for a
number of leading gold companies, including
Emperor Gold Mines, DRD Gold and
AngloGold Ashanti. Mr Labuschagne was
previously Managing Director of ASX-listed
gold company, Norton Gold Fields Limited.
Li Zhongjun Non-Executive Director (re-appointed 8 May 2015)
Member of the Remuneration and Appointments Committee (REM)
Graduate of Wuhan University of Technology
Mr Li is the owner of Tianjin Keweier Metal
Material Co Ltd (KWE (TJ)) in China. He is a
graduate of Wuhan University of Technology
and spent 10 years at Tianjin Auto Industry
Company Ltd. For more than 10 years, Mr
Li has built a trading and manufacturing
business that specialises in magnesium
products. KWE (TJ) has facilities located
in Hong Kong and Tianjin and a broad
experience of the global magnesium
industry. Mr Li is a major beneficial
shareholder in Magontec Limited.
BOARD OF DIREC TORS
Nicholas Andrews
Xie Kangmin
Andre Labuschagne
Li Zhongjun
16 MAGONTEC LIMITED ANNUAL REPORT 2016
BOARD OF DIRECTORS

Robert ShawIndependent Director (re-appointed 29 May 2014)
Chairman of the Finance, Audit and Compliance Committee (FAC)
Member of the Remuneration and Appointments Committee (REM)
BE, MBA, MPA, FAICD, JP
Mr Shaw has extensive experience in
business management in both an Executive
and Non-Executive capacity. He has
specialist skills in finance and financial
analysis, audit committees and corporate
governance. He is currently a Non-
Executive Director of Credit Corp (CCP)
where he is Chairman of the Audit and
Risk Committee. Mr Shaw holds Bachelor
of Industrial Engineering, Master of
Business Administration and Master
of Professional Accounting degrees.
Robert Kaye SCIndependent Director (re-appointed 29 May 2014)
Chairman of the Remuneration and Appointments Committee (REM)
LLB (Syd), LLM (Cambridge) (Hons)
Mr Kaye was admitted to legal practice in
1978 and employed as a solicitor at Allen
Allen & Hemsley Solicitors. Thereafter
he pursued his legal career at the NSW
Bar and was appointed Senior Counsel in
2003, practising in commercial law. He has
been involved in an array of commercial
matters both advisory and litigious in
nature and served on a number of NSW
Bar Association committees including the
Professional Conduct Committee. He has
also served as a director for various private
companies. In the conduct of his practice as
a barrister, he has acted for many financial
institutions and commercial enterprises,
both public and private and given both legal
and strategic advice. He has had significant
mediation experience and been involved
in the successful resolution of complex
commercial disputes. Mr Kaye is currently
Chairman of Spicers Limited (formerly
Paperlinx Limited) and Chairman of Collins
Foods Limited.
Li YongAlternate Non-Executive Director (appointed 29 May 2014)
In 2014, Mr Li was appointed as the
Secretary of the Board of Qinghai Salt Lake
Industry Co Ltd (QSLI), the parent company
of QSLM. After graduating from the Sichuan
School of Statistics in 1992, Mr Li joined
the Qinghai Salt Lake group of companies.
In 2009, he qualified as a member of
The Chinese Institute of Chartered
Accountants (CPA).
Within QSLI, he maintains responsibility
for and is involved in a number of functions
including investor relations, external
reporting, economics, finance and
accounting. He is the alternate director
to Mr Xie Kangmin.
Robert Shaw
Robert Kaye SC
Li Yong
17MAGONTEC LIMITED ANNUAL REPORT 2016
BOARD OF DIRECTORS

Tong XunyouPresident, Magontec Asia
Graduate of Dalian University
Mr Tong joined Magontec Limited (then
Hydro Magnesium) in 2003 in the role of
Production Manager, Finance Manager
and Deputy General Manager. In 2006
Mr Tong was appointed General Manager
and assumed responsibility for all of
Magontec’s Chinese activities, including
recycling and joint ventures.
Prior to joining Magontec Limited Mr Tong
spent eight years with the Henkel Adhesive
Company Limited where he was Production
and Branch Manager.
Mr Tong holds a Bachelors degree in
Chemistry from Dalian University of Science
and Engineering and an MBA from Hong
Kong Polytechnic University.
Christoph Klein-SchmeinkPresident Magontec Europe, North America and Middle East
MBA (Münster University)
Mr Klein-Schmeink joined Magontec
Limited (then Hydro Magnesium) in 2000 as
Sales and Marketing Manager responsible
for global sales of the company’s anode
products. He was appointed Head of Sales
and Marketing in 2007 and Vice-President
of Global Sales and Marketing in 2011 and
has responsibility for magnesium alloy
and anode sales group-wide.
Prior to joining Magontec Mr Klein-
Schmeink held the position of Sales Director
Asia Pacific with the global mining services
company Terex Mining Corp.
Mr Klein-Schmeink holds a Masters of
Business Administration degree from
Münster University.
E X ECU T IVE M A N AGEMEN T
Derryn Chin
Tong Xunyou
Christoph Klein-Schmeink
Derryn ChinChief Financial Officer
B Com (UNSW), CA, CFA
Mr Chin joined Magontec Limited in 2014
and was appointed as the Chief Financial
Officer commencing 1 March 2016.
Prior to joining Magontec, Mr Chin was
an equity research analyst at Macquarie
Group in Australia and prior to that held
roles in both the audit and financial
advisory divisions of KPMG.
He is a member of the Institute of
Chartered Accountants Australia and
New Zealand, a CFA charterholder and
speaks conversational Mandarin. He holds
a Bachelor of Commerce (Accounting and
Finance) degree from the University of
New South Wales.
18 MAGONTEC LIMITED ANNUAL REPORT 2016
EXECUTIVE MANAGEMENT

Patrick LookVice President, Finance & HR
Business Economist VWA
Mr Look is the Vice-President of Finance
& HR, with primary finance and operating
oversight responsibilities for the company’s
divisions in Europe, North America and the
Middle East. Mr Look started his career at
Magontec GmbH (then Hydro Magnesium)
in 1998 as part of the industrial business
management trainee program. Over the last
18 years, after assuming various finance
roles in the company including accounting,
purchasing and logistics and graduating
as a Business Economist (VWA) he was
appointed Finance Manager in 2009 and
Vice-President Finance & HR in 2012.
John TalbotCompany Secretary
B Bus, Accounting (UTS)
Mr Talbot has been the Company Secretary
for Magontec since February 2008, a role he
has previously combined with that of Chief
Financial Officer. Mr Talbot relinquished his
responsibilities as CFO in February 2016.
From 1988 to Sept 2000 Mr Talbot was a
senior executive at the Commonwealth Bank
of Australia where he headed the Bank’s
Project and Infrastructure Finance Division.
Prior to 1988 his other responsibilities
within the bank included capital markets
activity and income tax compliance. From
2000 to his appointment in February 2008
with Magontec, he undertook various
corporate advisory roles in Australia
and overseas.
Patrick Look
John Talbot
19MAGONTEC LIMITED ANNUAL REPORT 2016
EXECUTIVE MANAGEMENT

FINANCIAL REPOR T
22 Directors’ Report
23 Remuneration Report
33 Independent Auditor’s Declaration
34 Consolidated Statement of Profit & Loss and Other Comprehensive Income
36 Consolidated Balance Sheet
37 Consolidated Statement of Changes in Equity
38 Consolidated Cash Flow Statement
39 1. Summary of Accounting Policies
44 2. Results from Operations
46 3. Income Taxes
49 4. Key Management Personnel Remuneration
50 5. Remuneration of Auditors
50 6. Current Trade and Other Receivables
51 7. Current Inventories
51 8. Other Current Assets
51 9. Non Current Trade and Other Receivables
52 10. Property Plant and Equipment
53 11. Intangibles
54 12. Current Trade and Other Payables
54 13. Borrowings
55 14. Current Provisions
55 15. Non-Current Provisions
57 16. Share Capital
59 17. Reserves
60 18. Accumulated Losses
60 19. Earnings/(Loss) Per Share
61 20. Contingent Liabilities and Contingent Assets
62 21. Capital and Leasing Commitments
63 22. Controlled Entities
65 23. Segment Information
67 24. Related Party Disclosures
68 25. Financial Instruments
73 26. Parent Entity Information Magontec Limited
75 27. Subsequent Events
75 28. Additional Company Information
75 Directors’ Declaration
76 Independent Auditor’s Report
78 Shareholder Information
20 MAGONTEC LIMITED ANNUAL REPORT 2016
FINANCIAL REPORT

FINANCIAL REPORT
21MAGONTEC LIMITED ANNUAL REPORT 2016
FIN A NCI A L REPOR Tfor the year ended 31 December 2016
1. Corporate information
The consolidated financial statements of Magontec Limited and its controlled subsidiaries as listed in Note 22 herein
(collectively, the Group) for the year ended 31 December 2016 were authorised for issue in accordance with a resolution of
the directors on 23 February 2017. Magontec Limited is a company limited by shares incorporated in Australia. The shares
are publicly traded on the Australian Securities Exchange (ASX) under the code “MGL”.
2. Glossary of entities referred to in this report
Formal Name of Entity Description of Entity Referred to as
Head office entities
Magontec Limited The ultimate parent/holding company of the Group. Parent Entity,
the Company
or MGL
Advanced Magnesium Technologies Pty
Limited
Wholly owned subsidiary of Magontec Limited that acts
as the administrative operating entity.
AMT
Varomet Holdings Limited The holding company that owns the Group’s operating
businesses at Bottrop (Germany), Xi’an (PRC) and
Suzhou (PRC). In turn, Magontec Limited owns all of the
ordinary shares issued by Varomet Holdings Limited.
VHL
Operating entities
Magontec GmbH The wholly owned entity that owns the Group’s operations
in Bottrop, Germany.
MAB
Magontec SRL The wholly owned entity that owns the Group’s operations
in Santana, Romania.
MAR
Magontec Xi’an Co Ltd. The wholly owned entity that owns the Group’s operations
in Xi’an, PRC.
MAX
Magontec Shanxi Company Limited The joint venture operations in Jishan, Shanxi province
PRC.
MAY
Magontec Suzhou Co Ltd The wholly owned entity that owns the Group’s operations
in Suzhou, PRC. Production ceased at this facility in 2015.
MAS
Magontec Qinghai Co. Ltd. The wholly owned entity that owns the Group’s
operations in Qinghai, PRC.
MAQ
Magontec US LLC The wholly owned entity located in the United States
of America.
MAU
Major related shareholders
Qinghai Salt Lake Magnesium Co. Limited A subsidiary of Qinghai Salt Lake Industry Co. Limited (a
company listed on the Shenzhen Securities Exchange) and
a 29.19% shareholder in MGL at the date of this report.
QSLM
Straits Mine Management Pty Limited The company from which MGL acquired the Magontec
group of companies on 4 July 2011. SMM, a subsidiary of
Aeris Resources Limited remains a 13.15% substantial
shareholder of MGL at the date of this report.
SMM
KWE (HK) Investment Development Co Ltd Shareholder in Magontec Limited. Mr Li Zhongjun, a
director of Magontec Limited is also a director and
shareholder of KWE (HK) Investment Development Co Ltd.
KWE (HK)
3. Rounding errors
The tables in this report may indicate apparent errors to the extent of one unit (being $1,000) in:
− the addition of items comprising total and sub totals; and
− the comparative balances of items from the financial accounts for the period ended 31 December 2015.
Such differences arise from the process of:
− converting foreign currency amounts to two decimal places in AUD; and
− subsequent rounding of the AUD amounts to one thousand dollars.
MAGONTEC LIMITED ANNUAL REPORT 2016
FINANCIAL REPORT
22
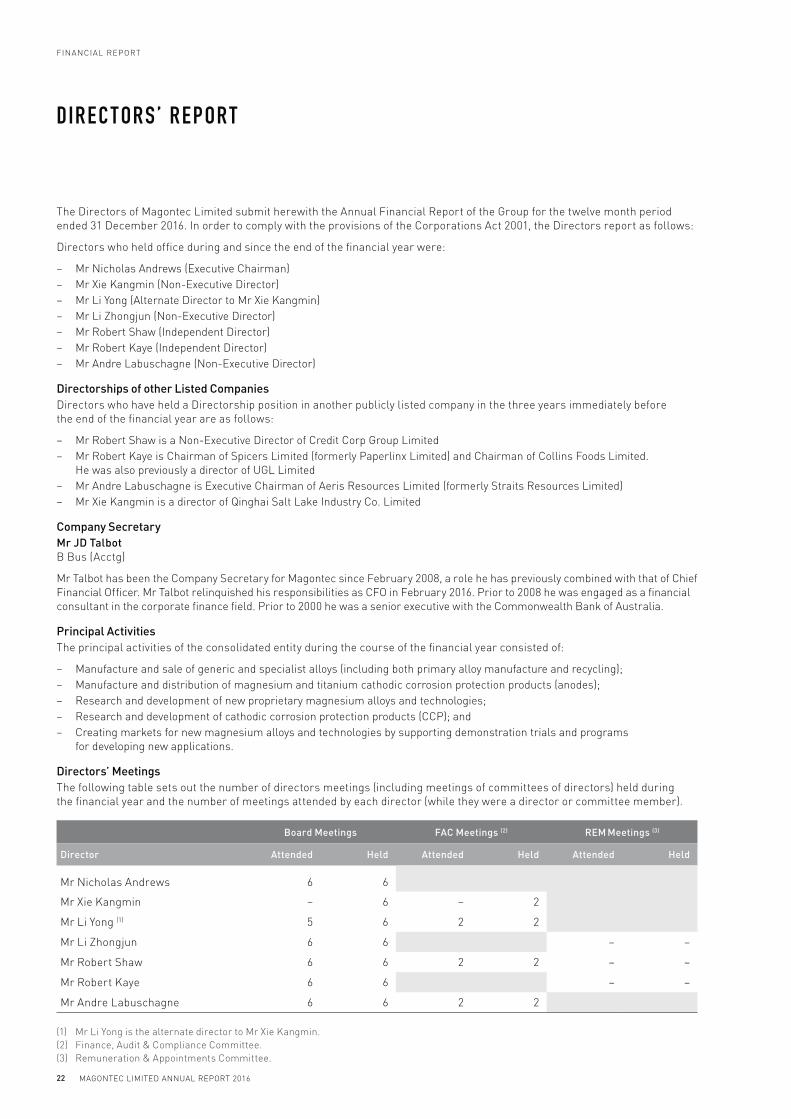
The Directors of Magontec Limited submit herewith the Annual Financial Report of the Group for the twelve month period
ended 31 December 2016. In order to comply with the provisions of the Corporations Act 2001, the Directors report as follows:
Directors who held office during and since the end of the financial year were:
− Mr Nicholas Andrews (Executive Chairman)
− Mr Xie Kangmin (Non-Executive Director)
− Mr Li Yong (Alternate Director to Mr Xie Kangmin)
− Mr Li Zhongjun (Non-Executive Director)
− Mr Robert Shaw (Independent Director)
− Mr Robert Kaye (Independent Director)
− Mr Andre Labuschagne (Non-Executive Director)
Directorships of other Listed Companies
Directors who have held a Directorship position in another publicly listed company in the three years immediately before
the end of the financial year are as follows:
− Mr Robert Shaw is a Non-Executive Director of Credit Corp Group Limited
− Mr Robert Kaye is Chairman of Spicers Limited (formerly Paperlinx Limited) and Chairman of Collins Foods Limited.
He was also previously a director of UGL Limited
− Mr Andre Labuschagne is Executive Chairman of Aeris Resources Limited (formerly Straits Resources Limited)
− Mr Xie Kangmin is a director of Qinghai Salt Lake Industry Co. Limited
Company Secretary
Mr JD Talbot
B Bus (Acctg)
Mr Talbot has been the Company Secretary for Magontec since February 2008, a role he has previously combined with that of Chief
Financial Officer. Mr Talbot relinquished his responsibilities as CFO in February 2016. Prior to 2008 he was engaged as a financial
consultant in the corporate finance field. Prior to 2000 he was a senior executive with the Commonwealth Bank of Australia.
Principal Activities
The principal activities of the consolidated entity during the course of the financial year consisted of:
− Manufacture and sale of generic and specialist alloys (including both primary alloy manufacture and recycling);
− Manufacture and distribution of magnesium and titanium cathodic corrosion protection products (anodes);
− Research and development of new proprietary magnesium alloys and technologies;
− Research and development of cathodic corrosion protection products (CCP); and
− Creating markets for new magnesium alloys and technologies by supporting demonstration trials and programs
for developing new applications.
Directors’ Meetings
The following table sets out the number of directors meetings (including meetings of committees of directors) held during
the financial year and the number of meetings attended by each director (while they were a director or committee member).
Board Meetings FAC Meetings (2) REM Meetings (3)
Director Attended Held Attended Held Attended Held
Mr Nicholas Andrews 6 6
Mr Xie Kangmin – 6 – 2
Mr Li Yong (1) 5 6 2 2
Mr Li Zhongjun 6 6 – –
Mr Robert Shaw 6 6 2 2 – –
Mr Robert Kaye 6 6 – –
Mr Andre Labuschagne 6 6 2 2
(1) Mr Li Yong is the alternate director to Mr Xie Kangmin.
(2) Finance, Audit & Compliance Committee.
(3) Remuneration & Appointments Committee.
DIREC T ORS’ REPOR T

FINANCIAL REPORT
23MAGONTEC LIMITED ANNUAL REPORT 2016
Directors’ Shareholdings
The following table sets out the relevant interest (direct and indirect) of each serving director in shares, debentures, and
rights or options in shares or debentures of the Company or a related body corporate as at the date of this report
Director Security typeNumber of shares as at
Date of this Report
Mr Nicholas Andrews Ordinary shares 18,993,502
Mr Xie Kangmin –
Mr Li Yong (Alternate) –
Mr Li Zhongjun Ordinary shares 56,197,298
Mr Robert Shaw Ordinary shares 800,000
Mr Robert Kaye –
Mr Andre Labuschagne –
REMUNERATION REPORT
The remuneration report for the year ended 31 December 2016 outlines the remuneration arrangements of the Group in
accordance with the requirements of the Corporations Act 2001 (the Act) and its regulations.
The remuneration report details the remuneration arrangements for key management personnel (KMP) who are defined as
those persons having authority and responsibility for planning, directing and controlling the major activities of the Group,
directly or indirectly, including any director (whether executive or otherwise) of the Parent Entity. Directors and executives
who have a direct reporting responsibility to the Executive Chairman are deemed to be such individuals.
The remuneration report is presented under the following sections:
1. Individual key management personnel disclosures
2. Remuneration at a glance
3. Board oversight of remuneration
4. Non-executive director remuneration arrangements
5. Executive remuneration arrangements (including equity instrument disclosures)
6. Group performance and the link to remuneration
7. Executive contractual arrangements
1. INDIVIDUAL KEY MANAGEMENT PERSONNEL (KMP) DISCLOSURES
Details of KMP are set out below and their remuneration is detailed in the table on page 25.
Key Management Personnel
(i) Directors during the year ended 31 December 2016
− Mr Nicholas Andrews (Executive Chairman)
− Mr Xie Kangmin (Non-Executive Director)
− Mr Li Yong (Alternate Non-Executive Director to Mr Xie Kangmin)
− Mr Li Zhongjun (Non-Executive Director)
− Mr Robert Shaw (Independent Director)
− Mr Robert Kaye (Independent Director)
− Mr Andre Labuschagne (Non-Executive Director)
(ii) Key Management Personnel (KMP) (Being the Executive Chairman and his Direct Reports except the Company Secretary) during the year ended 31 December 2016
− Mr Nicholas Andrews - Executive Chairman
− Mr Christoph Klein-Schmeink - President Magontec Europe, North America and Middle East
− Mr Tong Xunyou - President Magontec Asia
− Mr Derryn Chin - Chief Financial Officer (commenced as KMP 1 March 2016)
− Mr John Talbot - Former Chief Financial Officer and Company Secretary (ceased to be KMP as at 1 March 2016)
DIREC T ORS’ REPOR Tcontinued

MAGONTEC LIMITED ANNUAL REPORT 2016
FINANCIAL REPORT
24
2. REMUNERATION AT A GLANCE
Remuneration Strategy
The Group uses a combination of cash and non-cash
mechanisms to remunerate KMP. At the Company’s 2011
Annual General Meeting shareholders approved a plan
for the issue of shares to the executives of the Group.
3. BOARD OVERSIGHT OF REMUNERATION
Remuneration Committee
The remuneration committee is responsible for making
recommendations to the board on the remuneration
arrangements for non-executive directors (NEDs)
and executives.
The remuneration committee assesses the appropriateness
of the nature and amount of remuneration of NEDs and
executives on a periodic basis by reference to relevant
employment market conditions, with the overall objective of
ensuring maximum benefit from the retention of its directors
and executive team.
Remuneration Approval Process
The board approves the remuneration arrangements of the
Executive Chairman and executives and all issue of options
under the Employee Share Option Plan (ESOP) following
recommendations from the remuneration committee.
Remuneration Structure
The structure of NED and executive remuneration
is a separate and distinct process.
4. NON-EXECUTIVE DIRECTOR REMUNERATION ARRANGEMENTS
Remuneration Policy and Structure
The remuneration of NEDs consists of directors’ fees.
Options may only be issued to a Director pursuant to the
Employee Share Option Plan if the issue complies with the
requirements (if any) of the Corporations Act and the ASX
Listing Rules.
The aggregate amount of Non-Executive Directors’ fees
is approved by Shareholders and is currently limited to
$600,000 per annum. Any increase must be approved by
Shareholders. The Board decides how that aggregate
or a lesser amount is divided between the Directors.
Within the constraint of the aggregate $600,000 fees
approved by Shareholders for Non-Executive Directors
(NEDs), the Board has set compensation at $35,000 per
annum for each Non-Executive Director (inclusive of
any payments for superannuation).
5. EXECUTIVE REMUNERATION ARRANGEMENTS
The Board of Directors’ policy on remuneration is as follows:
− When an executive or an employee is recruited, the
Group’s aim is to reward its staff at market rates within
the manufacturing technology industry as determined
and in consultation with a remuneration specialist where
appropriate;
− The individual’s package is flexible and can incorporate
salary sacrifice components making the individual’s
package tax effective;
− The remuneration policy aims to retain key employees
and align employee interests with Group performance
and Shareholders’ interests;
− An Employee Share Option Plan (ESOP) was established
in October 2005 and modified at the 2010 AGM;
− An Executive Securities Issue Plan (ESIP) was approved
by shareholders at the 2011 AGM.
The ESOP & ESIP are utilised to
a. motivate key management personnel (KMP) to originate
and innovate strategies for growth;
b. reward KMP for the satisfaction of positive strategic
and financial outcomes; and
c. provide an adjunct to cash remuneration to preserve
cash resources.
Staff remuneration has three components:
a. Base or fixed remuneration;
b. Variable (at risk) performance; and
c. A long-term incentive in the form of options and/or share
issues approved by shareholders.
Each KMP has a set of key performance indicators (KPIs)
mutually agreed by the employee and the Executive
Chairman/Board (as appropriate) on an annual basis. The
KPIs reflect the employee’s ability to add value to the entity
and increase shareholder wealth by ensuring productive
gains such as increasing efficiencies, reduction in costs and
increased profitability by maximising sales volumes and
margins on sale revenues. Variable and long term incentives
will only be paid if set objectives are achieved.
During the year ended 31 December 2016 shares were
issued to one KMP Mr Christoph Klein-Schmeink as well
as another non KMP executive Mr Patrick Look under
the terms of the approval given by shareholders under
resolution 8 of the 2011 Annual General Meeting.
This Board Policy will be reviewed periodically by the
Remuneration and Appointments Committee. Where
appropriate, recommendations to the Board for
variations will be made.
DIREC T ORS’ REPOR Tcontinued
FINANCIAL REPORT
25MAGONTEC LIMITED ANNUAL REPORT 2016
5. EXECUTIVE REMUNERATION ARRANGEMENTS (CONTINUED)
Structure
The Group’s limited resources mean that its remuneration structures must be simple. The arrangements therefore must
balance ease of administration with appropriate reward. Any non-cash mechanisms are confined to shares and options.
Complex remuneration packages involving after tax benefits are generally avoided. The issue of shares will be in terms of
resolutions put to shareholders. Only a limited number of employees are eligible for the issue of options under the ESOP.
Technical services tend to be required by the Group on an irregular basis. There is a reliable base of technical consultants
on which the Group can call upon when the need arises. This avoids the cost of maintaining permanent resources.
The executive remuneration framework consisted of the following components:
− fixed cash component;
− non cash component; and
− post-employment benefits (superannuation and certain social benefits for Chinese personnel).
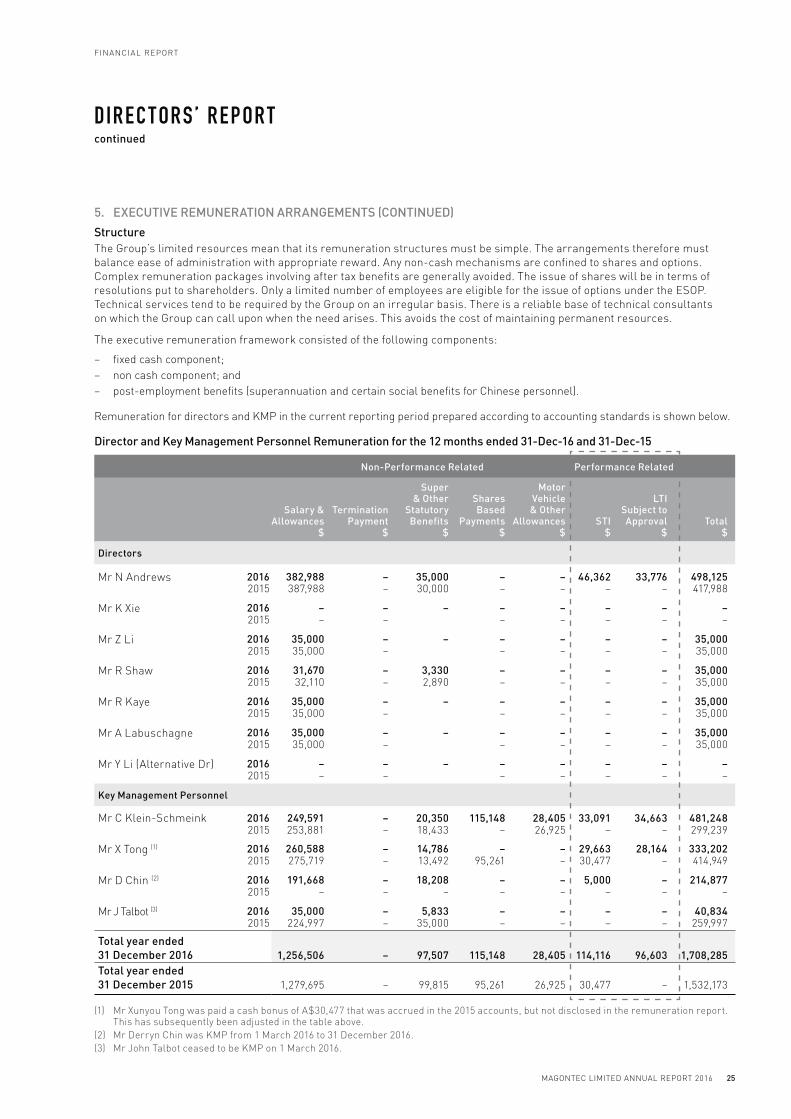
Remuneration for directors and KMP in the current reporting period prepared according to accounting standards is shown below.
Director and Key Management Personnel Remuneration for the 12 months ended 31-Dec-16 and 31-Dec-15
Non-Performance Related Performance Related
Salary & Allowances
$
Termination Payment
$
Super & Other
Statutory Benefits
$
Shares Based
Payments $
Motor Vehicle & Other
Allowances $
STI $
LTI Subject to Approval
$Total
$
Directors
Mr N Andrews 2016 382,988 – 35,000 – – 46,362 33,776 498,1252015 387,988 – 30,000 – – – – 417,988
Mr K Xie 2016 – – – – – – – –2015 – – – – – – –
Mr Z Li 2016 35,000 – – – – – – 35,0002015 35,000 – – – – – 35,000
Mr R Shaw 2016 31,670 – 3,330 – – – – 35,0002015 32,110 – 2,890 – – – – 35,000
Mr R Kaye 2016 35,000 – – – – – – 35,0002015 35,000 – – – – – 35,000
Mr A Labuschagne 2016 35,000 – – – – – – 35,0002015 35,000 – – – – – 35,000
Mr Y Li (Alternative Dr) 2016 – – – – – – – –2015 – – – – – – –
Key Management Personnel
Mr C Klein-Schmeink 2016 249,591 – 20,350 115,148 28,405 33,091 34,663 481,2482015 253,881 – 18,433 – 26,925 – – 299,239
Mr X Tong (1) 2016 260,588 – 14,786 – – 29,663 28,164 333,2022015 275,719 – 13,492 95,261 – 30,477 – 414,949
Mr D Chin (2) 2016 191,668 – 18,208 – – 5,000 – 214,8772015 – – – – – – – –
Mr J Talbot (3) 2016 35,000 – 5,833 – – – – 40,8342015 224,997 – 35,000 – – – – 259,997
Total year ended
31 December 2016 1,256,506 – 97,507 115,148 28,405 114,116 96,603 1,708,285
Total year ended
31 December 2015 1,279,695 – 99,815 95,261 26,925 30,477 – 1,532,173
(1) Mr Xunyou Tong was paid a cash bonus of A$30,477 that was accrued in the 2015 accounts, but not disclosed in the remuneration report. This has subsequently been adjusted in the table above.
(2) Mr Derryn Chin was KMP from 1 March 2016 to 31 December 2016.
(3) Mr John Talbot ceased to be KMP on 1 March 2016.
DIREC T ORS’ REPOR Tcontinued

MAGONTEC LIMITED ANNUAL REPORT 2016
FINANCIAL REPORT
26
5. EXECUTIVE REMUNERATION ARRANGEMENTS (CONTINUED)
Key management personnel are defined as Directors, the Executive Chairman and those with direct reporting responsibility to the Executive Chairman except the Company Secretary.
The remuneration structure of key management personnel
can be summarised as follows:
Fixed Cash Remuneration
Executive contracts of employment do not include any
guaranteed base pay increases.
Value of Options Issued to Key Management Personnel
No options were issued to KMP during the current financial
period.
Value of Options – Basis of Calculation (Employee Share Option Plan - ESOP)
Under the Employee Share Option Plan approved on 4
October 2005, options allowing subscription of up to 5% of
the issued share capital of MGL are available for issue to
employees, with options over a further 5% of the issued
share capital in the future based on performance. As there
are no options remaining unexercised at 31 December 2016
no valuation has been performed.
Security-based Payment Schemes
a. Employee Share Option Plan (ESOP) – Summary of Options Grants
As at 31 December 2016 and 31 December 2015 no
unexercised options were held by KMP.
b. Executives’ Securities Issue Plan (ESIP)
At the 2011 Annual General meeting of the Company held
on 22 November 2011, in accordance with the terms of
Resolution 8(a) shareholders approved a plan – referred to
as the Executives Securities Issue Plan (ESIP) – for the issue
of shares to Executives of the Company and its wholly owned
subsidiaries.
The ESIP provided for three components.
1. Short term rewards – Mixture of cash and share
rewards, based on group operating profitability in excess of
budget and agreed upon KPIs assessed on an annual basis.
Executive STI Plan
The STI plan is designed to award executives for achieving
group financial performance targets. The Board determines
the size of the pool based on actual financial metrics
achieved relative to budget, and has discretion to adjust
these payments depending on the particular circumstances
of the Group and other qualitative factors as it sees fit. STI
awards are 100% cash-settled.
2. Retention rights scheme – a scheme designed to
ensure the retention of five key executives within the
Magontec group of companies upon its acquisition by the
former Advanced Magnesium Limited. Retention Rights
entitlements are equivalent to one-year’s salary (prevailing
as at the date of the 2011 AGM) for each of these executives.
Shares issued under this scheme at the time were linked to
the profitability of MGL over the next four years and priced
at the 10-day VWAP of the Company’s shares in the period
prior to the date of grant of each award as follows:
− a minimum award of 10% was made on the day following
the 2011 AGM;
− dependent on profitability of the Company, additional
awards will be made on each of 1 July 2012, 1 July 2013,
and 1 July 2014, but in any event a minimum award of
10% of the total award will be made on each of these
dates; and
− any residual Retention Rights outstanding on 1 July 2015
will be awarded on that date.
As per Resolution 5 of the 2015 AGM, the conditions of issue
of Retention Rights shares to Mr C Klein-Schmeink and Mr P
Look were varied. The variation allowed these employees at
their option to elect that the shares be issued at the earlier
of either 30 June 2016 or 30 June 2017 or within 5 business
days of the date a takeover offer is made on the Company
in compliance with the terms of the Corporations Act 2001.
At the date of this report, all shares with respect to the
Retention Rights Scheme have been issued in full.
3. Long term incentive scheme
Executive LTI Plan
Under the executive LTI plan, awards are made to executives
and other key talent who have an impact on the consolidated
entity’s performance. LTI awards are delivered in the form
of share grants which vest upon completion of an escrow
period following grant date. The Board has considered a
plan which will be put forward for shareholder approval
which uses absolute total shareholder return (TSR) as the
key performance measure. TSR comprises the percentage
change in the Company’s share price, plus the value of any
future dividends received during the period and is measured
over a 3 year period. Under this proposed plan, the fair value
of the equity instruments granted is calculated assuming a
0% probability of forfeiture before the expiry of the escrow
period, and is expensed on a straight-line basis over the
vesting period.
In the 2016 LTI scheme being proposed for shareholder
approval at the 2017 AGM, the escrow period has been
set at 12 months from issue date to encourage employee
retention. If the employee were to resign or be dismissed
for cause before the expiration of this escrow period, the
relevant shares would be forfeited at the discretion of
the Board of Directors. No other performance conditions
are attached to the issue of shares under the LTI scheme
being contemplated.
DIREC T ORS’ REPOR Tcontinued

FINANCIAL REPORT
27MAGONTEC LIMITED ANNUAL REPORT 2016
5. EXECUTIVE REMUNERATION ARRANGEMENTS (CONTINUED)
Eligible Participants in Executives’ Securities Issue Plan (ESIP)
Potential Participants Position In CompanyEligibility 2012 - 2014
Eligibility 2015
Eligibility 2016
Nicholas William Andrews Executive Chairman Eligible Eligible Eligible
John David TalbotCompany Secretary and former
Chief Financial OfficerEligible Eligible Eligible
Christoph Klein-SchmeinkPresident Magontec Europe, North
America and Middle EastEligible Eligible Eligible
Patrick LookVice President, Finance and HR, Europe,
North America and Middle EastEligible Eligible Eligible
Tong Xunyou President Magontec Asia Eligible Eligible Eligible
Derryn Chin Chief Financial Officer Not Eligible Not Eligible Not Eligible
c. Loans to Members of Key Management Personnel
As at 31 December 2016, there were 2 employee loans outstanding to Mr Christoph Klein-Schmeink for a total of A$63,642
(2015: A$21,399). The first loan of A$13,962 is due for repayment by 30 November 2018, with the remaining $49,680 loan
having a maturity date of 16 July 2021, which can be extended by 10 years at the option of the Company. There were no
other employee loans to key management personnel outstanding as at 31 December 2016.
Key Management Personnel Equity Holdings
Fully paid ordinary shares of Magontec Limited - 31 Dec 2016
Balance @ 1/01/16
Granted as remuneration
Received on exercise of
options
Acquired On Market or
Under Share Purchase Plan
Total balance (held directly
and indirectly) 31/12/16
Balance held nominally
(indirectly)
No. No. No. No. No. No.
Mr Z Li (1) 56,197,298 – – – 56,197,298 55,797,298
Mr N Andrews (2) 18,993,502 – – – 18,993,502 15,409,401
Mr R Shaw 800,000 – – – 800,000 800,000
Mr C Klein-Schmeink 1,141,542 3,073,894 – – 4,215,436 –
Mr X Tong 8,317,435 – – – 8,317,435 –
Mr D Chin 266,883 – – 733,117 1,000,000 –
Mr J Talbot 4,078,280 – – 34,988 4,113,268 –
89,794,940 3,073,894 – 768,105 93,636,939 72,006,699
(1) 55,797,298 shares are held via KWE (HK) Investment Development Co Limited and 400,000 shares are held directly.
(2) 15,409,401 shares are held via DEWBERRI PTY LIMITED as trustee for Andrews Superannuation Fund and 3,584,101 are held directly.
Fully paid ordinary shares of Magontec Limited - 31 Dec 2015
Balance @ 1/01/15
Granted as remuneration
Received on exercise of
options
Acquired On Market or
Under Share Purchase Plan
Total balance (held directly
and indirectly) @ 31/12/15
Balance held nominally
(indirectly)
No. No. No. No. No. No.
Mr Z Li (1) 56,197,298 – – – 56,197,298 55,797,298
Mr N Andrews (2) 18,993,502 – – – 18,993,502 15,409,401
Mr R Shaw 800,000 – – – 800,000 800,000
Mr C Klein-Schmeink 1,141,542 – – – 1,141,542 –
Mr X Tong 1,987,815 6,329,620 – – 8,317,435 –
Mr J Talbot 4,000,768 – – 77,512 4,078,280 –
Total 83,120,925 6,329,620 – 77,512 89,528,057 72,006,699
(1) 55,797,298 shares are held via KWE (HK) Investment Development Co Limited and 400,000 shares are held directly.
(2) 15,409,401 shares are held via DEWBERRI PTY LIMITED as trustee for Andrews Superannuation Fund and 3,584,101 are held directly.
DIREC T ORS’ REPOR Tcontinued
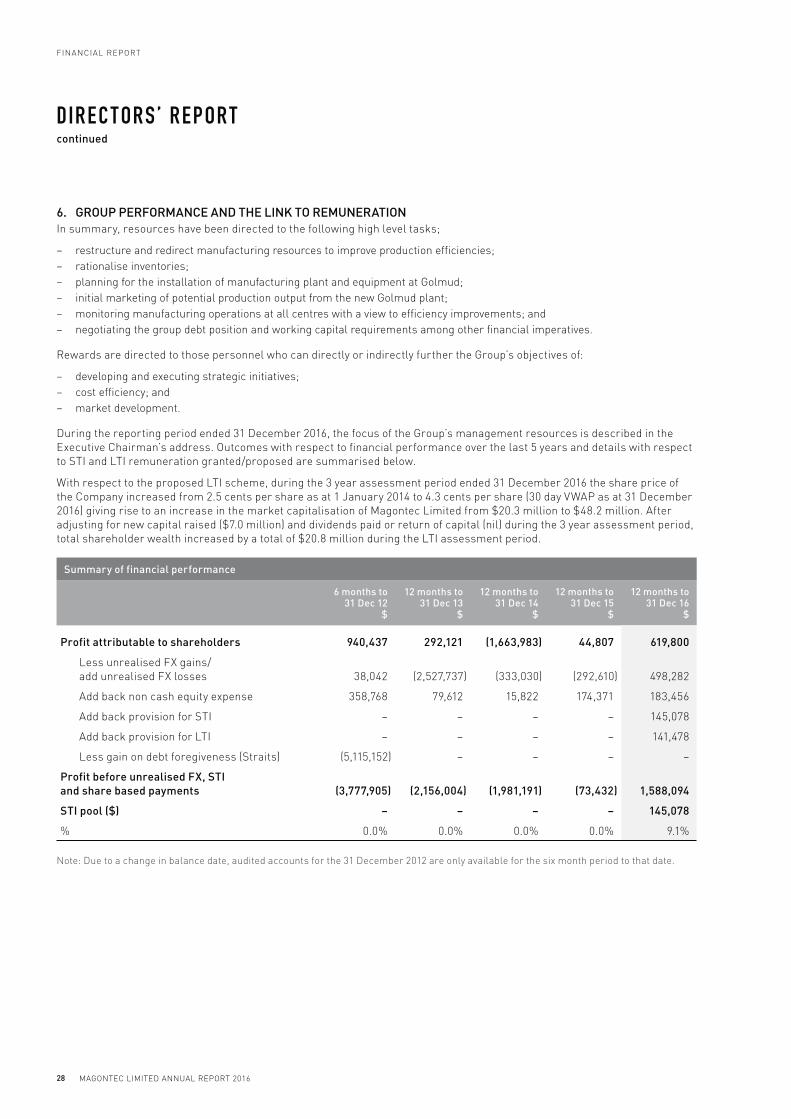
MAGONTEC LIMITED ANNUAL REPORT 2016
FINANCIAL REPORT
28
6. GROUP PERFORMANCE AND THE LINK TO REMUNERATION
In summary, resources have been directed to the following high level tasks;
− restructure and redirect manufacturing resources to improve production efficiencies;
− rationalise inventories;
− planning for the installation of manufacturing plant and equipment at Golmud;
− initial marketing of potential production output from the new Golmud plant;
− monitoring manufacturing operations at all centres with a view to efficiency improvements; and
− negotiating the group debt position and working capital requirements among other financial imperatives.
Rewards are directed to those personnel who can directly or indirectly further the Group’s objectives of:
− developing and executing strategic initiatives;
− cost efficiency; and
− market development.
During the reporting period ended 31 December 2016, the focus of the Group’s management resources is described in the
Executive Chairman’s address. Outcomes with respect to financial performance over the last 5 years and details with respect
to STI and LTI remuneration granted/proposed are summarised below.
With respect to the proposed LTI scheme, during the 3 year assessment period ended 31 December 2016 the share price of
the Company increased from 2.5 cents per share as at 1 January 2014 to 4.3 cents per share (30 day VWAP as at 31 December
2016) giving rise to an increase in the market capitalisation of Magontec Limited from $20.3 million to $48.2 million. After
adjusting for new capital raised ($7.0 million) and dividends paid or return of capital (nil) during the 3 year assessment period,
total shareholder wealth increased by a total of $20.8 million during the LTI assessment period.
Summary of financial performance
6 months to 31 Dec 12
$
12 months to 31 Dec 13
$
12 months to 31 Dec 14
$
12 months to 31 Dec 15
$
12 months to 31 Dec 16
$
Profit attributable to shareholders 940,437 292,121 (1,663,983) 44,807 619,800
Less unrealised FX gains/
add unrealised FX losses 38,042 (2,527,737) (333,030) (292,610) 498,282
Add back non cash equity expense 358,768 79,612 15,822 174,371 183,456
Add back provision for STI – – – – 145,078
Add back provision for LTI – – – – 141,478
Less gain on debt foregiveness (Straits) (5,115,152) – – – –
Profit before unrealised FX, STI
and share based payments (3,777,905) (2,156,004) (1,981,191) (73,432) 1,588,094
STI pool ($) – – – – 145,078
% 0.0% 0.0% 0.0% 0.0% 9.1%
Note: Due to a change in balance date, audited accounts for the 31 December 2012 are only available for the six month period to that date.
DIREC T ORS’ REPOR Tcontinued

FINANCIAL REPORT
29MAGONTEC LIMITED ANNUAL REPORT 2016
6. GROUP PERFORMANCE AND THE LINK TO REMUNERATION (CONTINUED)
Summary of 2016 STIs and LTIs awarded/proposed to key management personnel
2016 STI awarded
$
2016 LTI proposed
$
2016 STI & LTI
$
Current key management personnel
Nicholas Andrews 46,362 79,917 126,279
Christoph Klein-Schmienk 33,091 82,017 115,108
Xunyou Tong 29,663 66,640 96,303
Derryn Chin 5,000 – 5,000
Former key management personnel
John Talbot 12,339 66,663 79,002
Total 126,455 295,236 421,691
Note: The table above shows the total face value of the LTI proposed with respect to the year ended 31 December 2016 for each employee which differs to the expense amount recognised according to Australian Accounting Standards. Refer to the Remuneration Report, for details of the portion of LTI expense recognised in accordance with Australian Accounting Standards.
7. EXECUTIVE CONTRACTUAL ARRANGEMENTS
Remuneration arrangements for KMP whose employment is current as at 31 December 2016 are provided below.
Personnel Position2016 Remuneration (1)
Contract Term
Contract Expiry
Notice Period for Termination
Payment in Lieu of Notice
Other Provisions
Mr N Andrews Executive
Chairman
$498,125 3 years 1-Apr-17 6 months 6 months’
pay
Eligible for
participation
in ESIP
& ESOP (2)
Mr C Klein-Schmeink President
Magontec
Europe
& North
America
$481,248 5 years 14-Aug-17 12 months 12 months’
pay
Eligible for
participation
in ESIP
& ESOP (2)
Mr X Tong President
Magontec Asia
$333,202 No fixed term
or expiry
6 months 6 months’
pay
Eligible for
participation
in ESIP
& ESOP (2)
Mr D Chin Chief Financial
Officer
$214,877 3 years 1-Mar-18 6 months 6 months’
pay
Eligible for
participation
in ESIP from
2017 (2)
Notes
(1) Total cost to the Group for the reporting period ended 31 December 2016.
Differences between “total cost to the Group” and current contractual arrangements are as follows:
– Mr Chin’s fixed contractual cash remuneration at 31 December 2016 is $251,851 including super & other statutory benefits.
– Total 2016 remuneration includes LTI awards which are subject to shareholder approval at the Company’s 2017 AGM.
(2) ESIP = Executive Securities Issue Plan; ESOP = Employee Share Option Plan.
Financial Report
Refer to ‘Financial Report’ section on page 6.
Operations Report
Refer to Operations Report.
DIREC T ORS’ REPOR Tcontinued
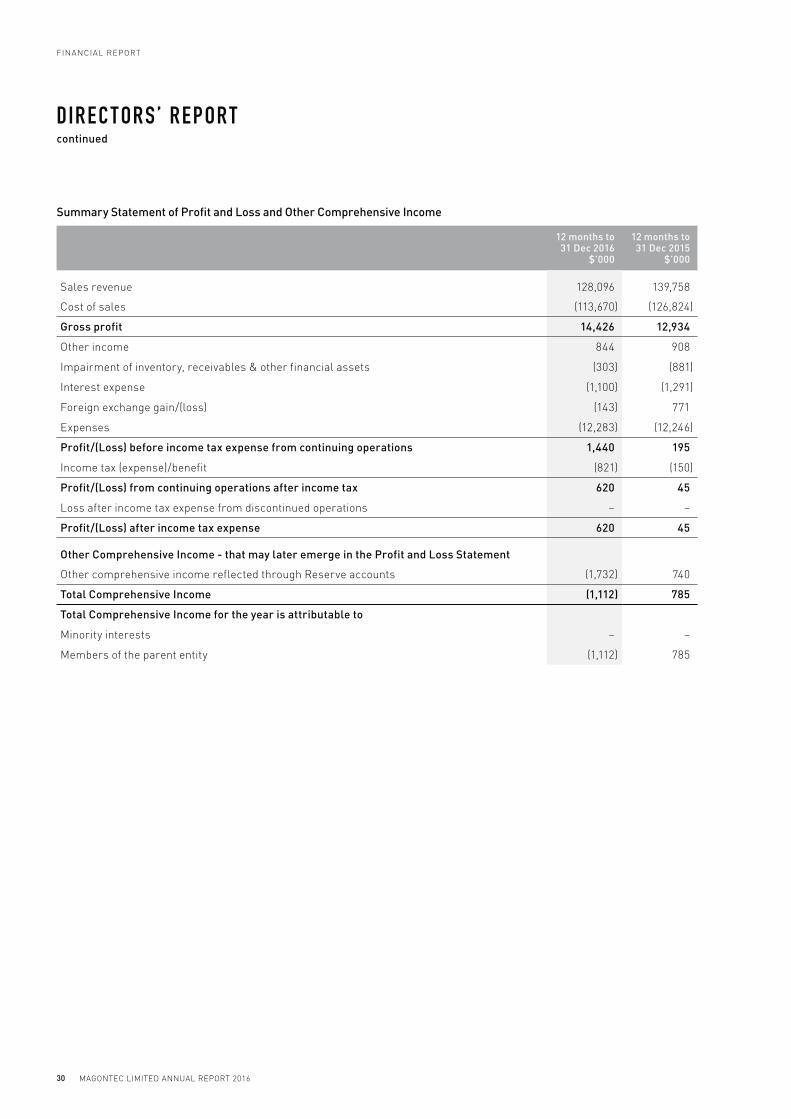
MAGONTEC LIMITED ANNUAL REPORT 2016
FINANCIAL REPORT
30
Summary Statement of Profit and Loss and Other Comprehensive Income
12 months to 31 Dec 2016
$’000
12 months to 31 Dec 2015
$’000
Sales revenue 128,096 139,758
Cost of sales (113,670) (126,824)
Gross profit 14,426 12,934
Other income 844 908
Impairment of inventory, receivables & other financial assets (303) (881)
Interest expense (1,100) (1,291)
Foreign exchange gain/(loss) (143) 771
Expenses (12,283) (12,246)
Profit/(Loss) before income tax expense from continuing operations 1,440 195
Income tax (expense)/benefit (821) (150)
Profit/(Loss) from continuing operations after income tax 620 45
Loss after income tax expense from discontinued operations – –
Profit/(Loss) after income tax expense 620 45
Other Comprehensive Income - that may later emerge in the Profit and Loss Statement
Other comprehensive income reflected through Reserve accounts (1,732) 740
Total Comprehensive Income (1,112) 785
Total Comprehensive Income for the year is attributable to
Minority interests – –
Members of the parent entity (1,112) 785
DIREC T ORS’ REPOR Tcontinued

FINANCIAL REPORT
31MAGONTEC LIMITED ANNUAL REPORT 2016
Summary of Balance Sheet
31 Dec 2016 $’000
31 Dec 2015 $’000
Assets
Cash and cash equivalents 4,593 8,490
Receivables 21,956 22,163
Inventory 22,302 26,316
Property, plant & equipment 20,543 19,567
Prepayments and other 5,683 5,992
Total Assets 75,077 82,528
Liabilities
Trade and other payables 13,818 16,157
Bank loans 14,734 20,507
Provisions 12,152 10,703
Total Liabilities 40,703 47,367
Net Assets 34,373 35,161
Summary of Cash Flow
12 months to 31 Dec 2016
$’000
12 months to 31 Dec 2015
$’000
Opening cash balance 8,490 6,435
Cash flows from operating activities
Net interest (paid)/received (1,045) (1,223)
Taxation (paid)/received (85) (50)
Net working capital assets (outflow)/inflow 1,068 1,837
Adjustments for non-cash items and unrealised foreign exchange gains/(losses) 4,865 3,506
Net cash (used)/generated in operating activities 4,804 4,070
Cash flows from investing and financing activities
Net cash (outflow)/inflow on purchase/disposal of PP&E (3,326) (4,092)
Net cash (outflow)/inflow on group information technology software (12) (117)
Security deposit (1) 894
Other investing – 140
Bank debt inflow/(outflow) (5,209) 677
Net capital raised from issue of securities – (4)
Net cash (used)/generated in investing and financing activities (8,548) (2,503)
Foreign exchange movements (153) 488
Net cash inflows/(outflows) (3,897) 2,055
Closing cash balance 4,593 8,490
DIREC T ORS’ REPOR Tcontinued

MAGONTEC LIMITED ANNUAL REPORT 2016
FINANCIAL REPORT
32
Dividends
The Directors have not recommended payment of a dividend and no dividends have been paid or declared since the end
of the previous financial year.
Subsequent Events
Subsequent events are detailed in Note 27.
Future Developments
Disclosure of information regarding likely developments in the operations of the consolidated entity in future financial
years and the expected results of those operations are likely to result in unreasonable prejudice to the consolidated entity.
Accordingly, this information has not been disclosed in this report.
Non Audit Services
Camphin Boston (the Group’s auditors) provided tax and other services during the financial year. Aggregate fees for non audit
services paid in the financial year were $21,372.
Auditor’s Independence Declaration
The Auditor’s independence declaration is included on page 33 of this Annual Report.
Indemnification of Officers and Auditors
The Group paid premia to insure certain officers of the Company and related bodies corporate in relation to performance
of their duties as officers of the Company. The officers of the Group covered by this insurance include directors or secretaries
of controlled entities.
The Company has not otherwise, during or since the financial year except to the extent permitted by law, indemnified or
agreed to indemnify an officer or auditor of the Company or of any related body corporate against a liability incurred as such
an officer or auditor.
On behalf of the Board of Directors
Mr N Andrews Mr R Shaw
Executive Chairman Non-Executive Director
Signed on the 23 February 2017 in accordance with a resolution of the Directors made pursuant to Section 298(2) of the
Corporations Act 2001.
DIREC T ORS’ REPOR Tcontinued
FINANCIAL REPORT
33MAGONTEC LIMITED ANNUAL REPORT 2016
INDEPENDEN T AUDI T OR’S DECL A R AT ION

MAGONTEC LIMITED ANNUAL REPORT 2016
FINANCIAL REPORT
34
CONSOLIDAT ED S TAT EMEN T OF PROFI T & LOSS A ND O T HER COMPREHENSIVE INCOMEfor the year ended 31 December 2016
Note
12 months to 31 Dec 2016
$’000
12 months to 31 Dec 2015
$’000
Sale of goods 2(a) 128,096 139,758
Cost of sales 2(b) (113,670) (126,824)
Gross profit 14,426 12,934
Other income 2(c) 844 908
Interest expense (1,100) (1,291)
Impairment of inventory, receivables & other financial assets 2(d) (303) (881)
Travel accommodation and meals (682) (697)
Research, development, licensing and patent costs (418) (301)
Promotional activity (67) (45)
Information technology (332) (340)
Personnel 2(d) (6,750) (6,589)
Depreciation & amortisation (475) (499)
Office expenses (333) (282)
Corporate (3,162) (3,339)
Foreign exchange gain/(loss) (143) 771
Other operating expenses (64) (155)
Profit/(Loss) before income tax expense/benefit from continuing operations 1,440 195
Income tax (expense)/benefit 3(a) (821) (150)
Profit/(Loss) after income tax expense/benefit from continuing operations 620 45
Profit/(Loss) after income tax expense from discontinued operations - –
Profit/(Loss) after income tax expense/benefit including
discontinued operations 620 45
Other Comprehensive Income - that may later emerge in the Profit and Loss Statement
Exchange differences taken to reserves in equity – translation of overseas
entities 17 (1,112) 608
Other Comprehensive Income - that will not emerge in the Profit and Loss Statement
Movement in various actuarial assessments 17 (620) 132
Total Comprehensive Income (1,112) 785
Profit/(Loss) after income tax expense for the year (incl discontinued operations) attributable to
Minority interests – –
Members of the parent entity 620 45
Total 620 45
Comprehensive Income for the year attributable to
Minority interests – –
Members of the parent entity (1,112) 785
Total Comprehensive Income for the year (1,112) 785

FINANCIAL REPORT
35MAGONTEC LIMITED ANNUAL REPORT 2016
CONSOLIDAT ED S TAT EMEN T OF PROFI T & LOSS A ND O T HER COMPREHENSIVE INCOMEcontinued
Note
12 months to 31 Dec 2016
cents per share
12 months to 31 Dec 2015
cents per share
Profit/(Loss) after income tax expense for the year
(including discontinued operations)
Members of the parent entity - Basic (cents per share) 19 0.055 0.004
Members of the parent entity - Diluted (cents per share) 19 0.055 0.004
Profit/(Loss) after income tax expense for the year
(excluding discontinued operations)
Members of the parent entity - Basic (cents per share) 19 0.055 0.004
Members of the parent entity - Diluted (cents per share) 19 0.055 0.004
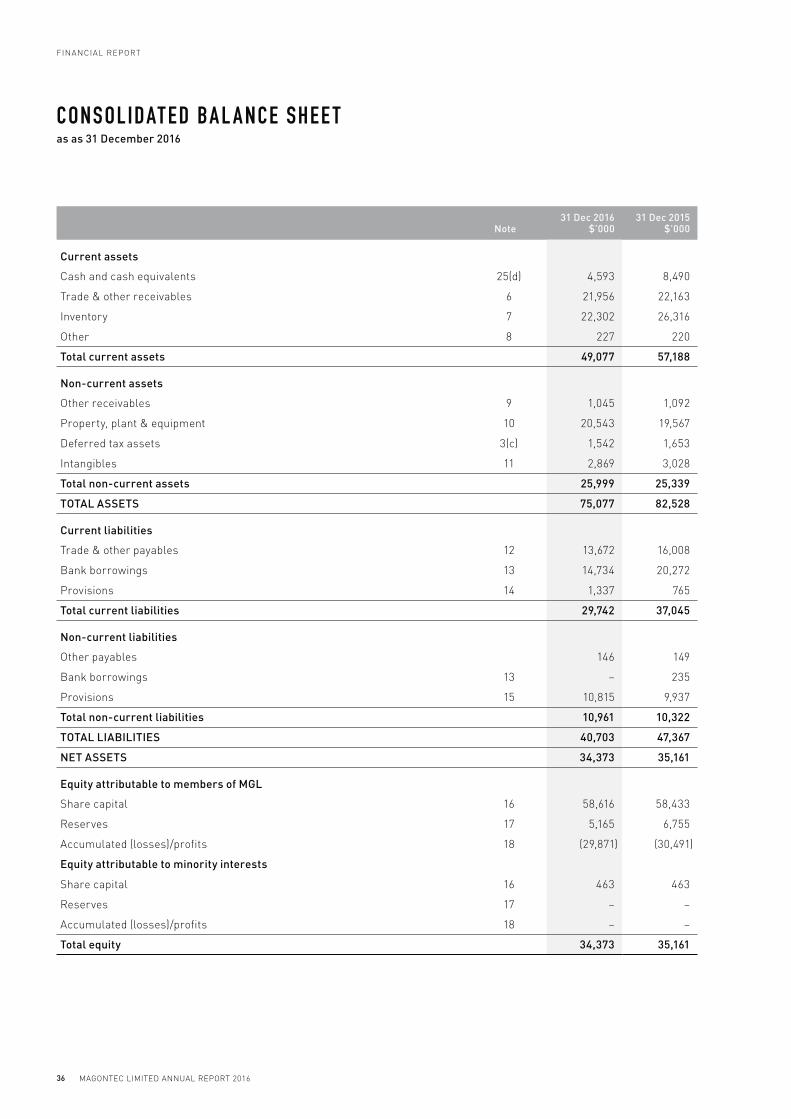
MAGONTEC LIMITED ANNUAL REPORT 2016
FINANCIAL REPORT
36
CONSOLIDAT ED BA L A NCE SHEE Tas as 31 December 2016
Note31 Dec 2016
$’00031 Dec 2015
$’000
Current assets
Cash and cash equivalents 25(d) 4,593 8,490
Trade & other receivables 6 21,956 22,163
Inventory 7 22,302 26,316
Other 8 227 220
Total current assets 49,077 57,188
Non-current assets
Other receivables 9 1,045 1,092
Property, plant & equipment 10 20,543 19,567
Deferred tax assets 3(c) 1,542 1,653
Intangibles 11 2,869 3,028
Total non-current assets 25,999 25,339
TOTAL ASSETS 75,077 82,528
Current liabilities
Trade & other payables 12 13,672 16,008
Bank borrowings 13 14,734 20,272
Provisions 14 1,337 765
Total current liabilities 29,742 37,045
Non-current liabilities
Other payables 146 149
Bank borrowings 13 – 235
Provisions 15 10,815 9,937
Total non-current liabilities 10,961 10,322
TOTAL LIABILITIES 40,703 47,367
NET ASSETS 34,373 35,161
Equity attributable to members of MGL
Share capital 16 58,616 58,433
Reserves 17 5,165 6,755
Accumulated (losses)/profits 18 (29,871) (30,491)
Equity attributable to minority interests
Share capital 16 463 463
Reserves 17 – –
Accumulated (losses)/profits 18 – –
Total equity 34,373 35,161

FINANCIAL REPORT
37MAGONTEC LIMITED ANNUAL REPORT 2016
CONSOLIDAT ED S TAT EMEN T OF CH A NGE S IN EQUI T Yfor the year ended 31 December 2016
Share Capital
Retained Earnings (1)
Foreign Currency
Translation Reserve (FCTR) (1)
Capital Reserve
Actuarial Reserve
Expired Options
Reserve
Share Issue
ReserveMinority
InterestsTotal
EquityOrdinaryOptions
Valuation
$’000 $’000 $’000 $’000 $’000 $’000 $’000 $’000 $’000 $’000
Balance 1 Jan 2015 58,262 – (30,536) 3,546 2,750 (1,917) 1,637 – 463 34,205
Profit/(Loss)
attributable to
members of parent
entity – – 45 – – – – – – 45
Other – – – – – – – – – –
Comprehensive
income – – – 608 – 132 – – – 740
Issue of shares 171 – – – – – – – – 171
Minority share capital – – – – – – – – – –
Balance 31 Dec 2015 58,433 – (30,491) 4,154 2,750 (1,785) 1,637 – 463 35,161
Balance 1 Jan 2016 58,433 – (30,491) 4,154 2,750 (1,785) 1,637 – 463 35,161
Profit/(Loss)
attributable to
members of parent
entity – – 620 – – – – – – 620
Other – – – – – – – 141 – 141
Comprehensive
income – – – (1,112) – (620) – – – (1,732)
Issue of shares 183 – – – – – – – – 183
Minority share capital – – – – – – – – – –
Balance 31 Dec 2016 58,616 – (29,871) 3,042 2,750 (2,405) 1,637 141 463 34,373
(1) During the period, A$1.1m of the Foreign Currency Translation Reserve (FCTR) was reclassified into retained losses. As this adjustment originally related to the year ended 31 December 2012, opening balances of the FCTR and retained earnings have been updated in both the current period and prior comparative period accordingly. No impact on overall equity balance as at 31 December 2016.
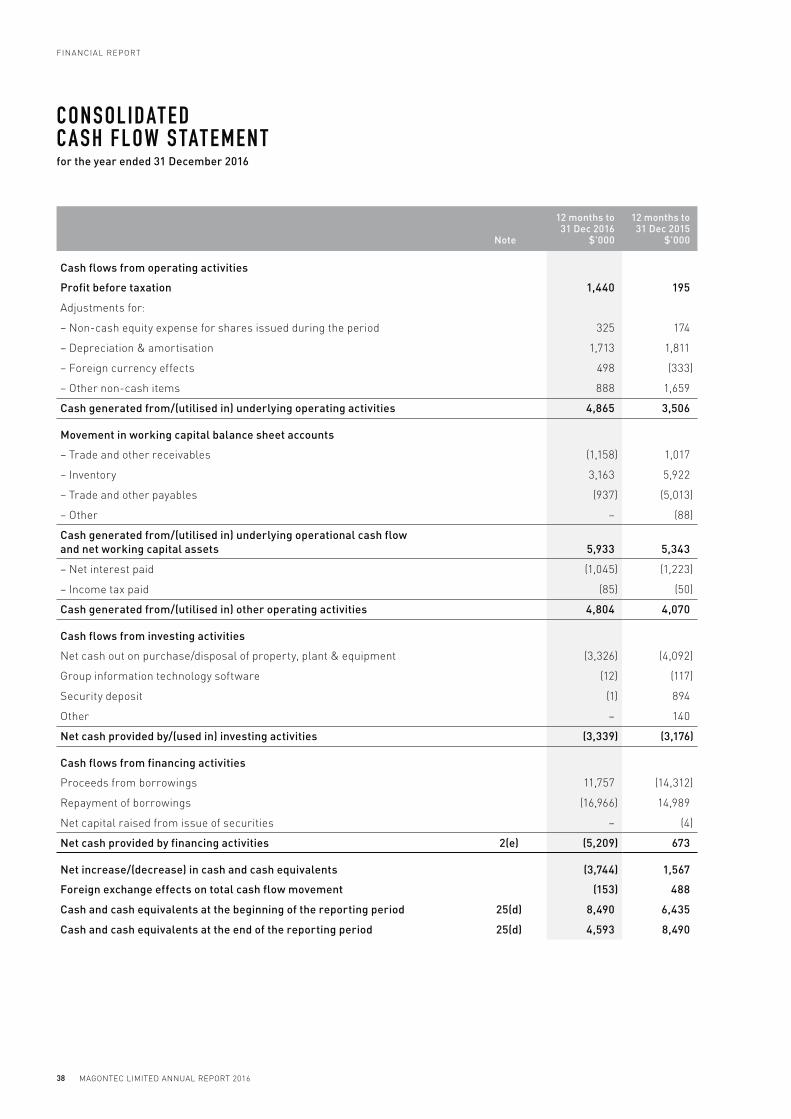
MAGONTEC LIMITED ANNUAL REPORT 2016
FINANCIAL REPORT
38
Note
12 months to 31 Dec 2016
$’000
12 months to 31 Dec 2015
$’000
Cash flows from operating activities
Profit before taxation 1,440 195
Adjustments for:
– Non-cash equity expense for shares issued during the period 325 174
– Depreciation & amortisation 1,713 1,811
– Foreign currency effects 498 (333)
– Other non-cash items 888 1,659
Cash generated from/(utilised in) underlying operating activities 4,865 3,506
Movement in working capital balance sheet accounts
– Trade and other receivables (1,158) 1,017
– Inventory 3,163 5,922
– Trade and other payables (937) (5,013)
– Other – (88)
Cash generated from/(utilised in) underlying operational cash flow
and net working capital assets 5,933 5,343
– Net interest paid (1,045) (1,223)
– Income tax paid (85) (50)
Cash generated from/(utilised in) other operating activities 4,804 4,070
Cash flows from investing activities
Net cash out on purchase/disposal of property, plant & equipment (3,326) (4,092)
Group information technology software (12) (117)
Security deposit (1) 894
Other – 140
Net cash provided by/(used in) investing activities (3,339) (3,176)
Cash flows from financing activities
Proceeds from borrowings 11,757 (14,312)
Repayment of borrowings (16,966) 14,989
Net capital raised from issue of securities – (4)
Net cash provided by financing activities 2(e) (5,209) 673
Net increase/(decrease) in cash and cash equivalents (3,744) 1,567
Foreign exchange effects on total cash flow movement (153) 488
Cash and cash equivalents at the beginning of the reporting period 25(d) 8,490 6,435
Cash and cash equivalents at the end of the reporting period 25(d) 4,593 8,490
CONSOLIDAT ED CASH FLOW S TAT EMEN Tfor the year ended 31 December 2016

FINANCIAL REPORT
39MAGONTEC LIMITED ANNUAL REPORT 2016
NO T E S T O T HE F IN A NCI A L S TAT EMEN T Sfor the year ended 31 December 2016
1. SUMMARY OF ACCOUNTING POLICIES
Statement of Compliance
The financial report is a general purpose financial
report which has been prepared in accordance with the
Corporations Act 2001, Australian Accounting Standards,
Australian Accounting Interpretations and other
authoritative pronouncements of the Australian Accounting
Standards Board.
Australian Accounting Standards set out accounting policies
that the AASB has concluded would result in a financial
report containing relevant and reliable information about
transactions, events and conditions. Compliance with
Australian Accounting Standards ensures that the financial
statements and notes also comply with International
Financial Reporting Standards. Material accounting policies
adopted in the preparation of this financial report are
presented below and have been consistently applied unless
otherwise stated.
The audited accounts were authorised for issue by the
Directors on 23 February 2017.
The Group has adopted all new standards and amendments to
standards, including any consequential amendments to other
standards, with a date of initial application of 1 January 2016.
There were no significant changes from the prior year deemed
relevant to the Company.
Basis of Preparation
The financial report has been prepared on an accruals
basis and is based on historical cost, modified where
applicable, by the measurement at fair value of selected
non-current assets, financial assets and financial liabilities.
Cost is based on the fair values of the consideration given
in exchange for assets. All amounts are presented in
Australian dollars, unless otherwise noted.
Significant Accounting Polices
The following significant accounting policies have been
adopted in the preparation and presentation of the financial
report:
a. Cash and Cash Equivalents
Cash and cash equivalents comprise cash on hand, cash in
banks, at call and on deposit.
b. Employee Benefits
Provision is made for benefits accruing to employees in
respect of wages and salaries, annual leave and long service
leave when it is probable that settlement will be required
and they are capable of being measured reliably.
Provisions made in respect of employee benefits expected to
be settled within 12 months are measured at their nominal
values using the remuneration rate expected to apply at the
time of settlement.
Provisions made in respect of employee benefits which are
not expected to be settled within 12 months are measured
at the present value of the estimated future cash outflows
to be made by the consolidated entity in respect of services
provided by employees up to reporting date.
Contributions by the Group to superannuation plans
on behalf of Australian employees and other defined
contribution payments on behalf of employees are expensed
when incurred. Provision is made for any long term defined
benefit pension obligations the Group has to employees in
foreign jurisdictions. The required amount of the provision
is actuarially assessed having regard to such matters as
future interest rates, the date at which pension payments
might commence and the likely period over which pensions
may be paid.
c. Financial Assets
Subsequent to initial recognition, investments in subsidiaries
are measured at cost less any allowance for impairment.
Other financial assets are classified into the following
specified categories: financial assets ‘at fair value through
profit or loss’, ‘held-to-maturity’ investments, ‘available-
for-sale’ financial assets, and ‘loans and receivables’. The
classification depends on the nature and purpose of the
financial assets and is determined at the time of initial
recognition.
Receivables
Trade receivables and other receivables are recognised
initially at their fair value and subsequently at amortised
cost less impairment.
d. Financial Instruments Issued by the Company
Debt and Equity Instruments
Debt and equity instruments are classified as either
liabilities or as equity in accordance with the substance of
the contractual arrangement.
Transaction Costs on the Issue of Equity Instruments
Transaction costs arising on the issue of equity instruments
are recognised directly in equity as a reduction of the
proceeds of the equity instruments to which the costs relate.
Transaction costs are the costs that are incurred directly in
connection with the issue of those equity instruments and
which would not have been incurred had those instruments
not been issued.
e. Foreign Currency
Foreign Currency Transactions
All foreign currency transactions during the financial year
are brought to account using the exchange rate in effect
at the date of the transaction. Foreign currency monetary
items are translated at the exchange rate prevailing at the
end of the reporting period. Non-monetary items measured
at fair value are reported at the exchange rate prevailing at
the date when the fair value was determined.
1. SUMMARY OF ACCOUNTING POLICIES (CONTINUED)
Foreign Operations
On consolidation, the assets and liabilities of the
consolidated entity’s overseas operations are translated at
exchange rates prevailing at the reporting date. Income and
expense items are translated at the average exchange rates
for the period unless exchange rates fluctuate significantly.
Exchange differences arising, if any, are recognised in the
foreign currency translation reserve, and recognised in
profit or loss on disposal of the foreign operation.
f. Goods and Services Tax and Value Added Tax
Revenues, expenses, assets and liabilities are recognised
net of the amount of goods and services tax (GST) or value
added tax (VAT) for certain foreign jurisdictions, except
where the GST or VAT is not recoverable from the relevant
tax authority. In these circumstances the GST or VAT is
recognised as part of the cost of acquisition of the asset or
as part of an item of the expense. Receivables and payables
in the balance sheet are shown inclusive of GST.
Cash flows are included in the cash flow statement on a
gross basis. The GST or VAT component of cash flows arising
from investing and financing activities which is recoverable
from, or payable to, the taxation authority is classified as
operating cash flows.
g. Impairment of Assets
At each reporting date, the consolidated entity reviews
the carrying amounts of its tangible and intangible assets
to determine whether there is any indication that those
assets have been impaired. If any such indication exists,
the recoverable amount of the asset, being the higher of
the asset’s fair value less costs to sell and value in use,
is compared to the asset’s carrying value. Any excess of
the asset’s carrying value over its recoverable amount is
expensed to the income statement.
Where it is not possible to estimate the recoverable amount
of an individual asset, the consolidated entity estimates the
recoverable amount of the cash generating unit to which the
asset belongs.
h. Income Tax
Current Tax
Current tax is calculated by reference to the amount of
income taxes payable or recoverable in respect of the
taxable profit or loss for the period. It is calculated using tax
rates and tax laws that have been enacted or substantively
enacted by reporting date. Current tax for current and prior
periods is recognised as a liability to the extent that it is
unpaid.
Deferred Tax
Deferred tax assets and liabilities are ascertained based
on temporary differences arising from differences between
the carrying amount of assets and liabilities in the financial
statements and the corresponding tax base of those items.
In principle, deferred tax liabilities are recognised for all
taxable temporary differences. Deferred tax assets are
recognised to the extent that it is probable that sufficient
taxable amounts will be available against which deductible
temporary differences or unused tax losses and tax offsets
can be utilised. However, deferred tax assets and liabilities
are not recognised if the temporary differences giving rise
to them arise from the initial recognition of assets and
liabilities (other than as a result of a business combination)
which affects neither taxable income nor accounting profit.
Deferred tax liabilities are recognised for taxable temporary
differences arising on investments in subsidiaries,
branches, associates and joint ventures except where the
consolidated entity is able to control the reversal of the
temporary differences and it is probable that the temporary
differences will not reverse in the foreseeable future.
Deferred tax assets arising from deductible temporary
differences associated with these investments and interests
are only recognised to the extent that it is probable that
there will be sufficient taxable profits against which to
utilise the benefits of the temporary differences and they are
expected to reverse in the foreseeable future.
Deferred tax assets and liabilities are calculated at the
tax rates that are expected to apply to the period(s) when
the asset is realised or the liability is settled, based on tax
rates enacted or substantively enacted at reporting date.
Their measurement also reflects the manner in which
management expects to recover or settle the carrying
amount of its assets and liabilities.
Deferred tax assets and liabilities are offset when they
relate to income taxes levied by the same taxation authority
and the Company/consolidated entity intends to settle its
current tax assets and liabilities on a net basis.
MAGONTEC LIMITED ANNUAL REPORT 2016
FINANCIAL REPORT
40
NO T E S T O T HE F IN A NCI A L S TAT EMEN T Scontinued

1. SUMMARY OF ACCOUNTING POLICIES (CONTINUED)
Current and Deferred Tax for the Period
Current and deferred tax is recognised as an expense or
income in the income statement, except when it relates
to items credited or debited directly to equity, in which
case the deferred tax is recognised directly in equity, or
where it arises from the initial accounting for a business
combination, in which case it is taken into account in the
determination of goodwill or excess.
Tax Consolidation
The Parent Entity and all its wholly-owned Australian
subsidiaries are part of a tax-consolidated group under
Australian tax consolidation legislation. Magontec Limited is
the head entity in the tax-consolidated group. Tax expense/
income, deferred tax liabilities and deferred tax assets
arising from temporary differences of the members of the
tax-consolidated group are recognised in the separate
financial statements of the members of the tax-consolidated
group using the ‘stand-alone taxpayer’ approach. Current
tax liabilities and assets and deferred tax assets arising
from unused tax losses and tax credits of the members of
the tax consolidated group are recognised by the Company
(as head entity in the tax-consolidated group).
Due to the existence of a tax funding arrangement between
the entities in the tax-consolidated group, amounts are
recognised as payable to or receivable by the Company and
each member of the group in relation to the tax contribution
amounts paid or payable between the parent entity and the
other members of the tax-consolidated group in accordance
with the arrangement. Further information about the tax
funding arrangement is detailed in Note 3 to the financial
statements. Where the tax contribution amount recognised
by each member of the tax-consolidated group for a
particular period is different to the aggregate of the current
tax liability or asset and any deferred tax asset arising from
unused tax losses and tax credits in respect of that period,
the difference is recognised as a contribution from (or
distribution to) equity participants.
i. Intangible Assets
Patents, Trademarks and Licences
Patents, trademarks and licences are recorded at cost
of acquisition. Patents and trademarks have an indefinite
useful life and are carried at cost. Carrying values are
subject to the impairment tests as outlined in (g) above.
Research and Development Costs
Expenditure on the research phase of a project is recognised
as an expense when incurred. Development costs are
capitalised only when technical feasibility studies identify
that the project is expected to deliver future economic
benefits and these benefits can be measured reliably.
j. Inventories
Inventories are measured at the lower of cost and net
realisable value. Costs are assigned to inventory using a
weighted average cost method most appropriate to each
particular class of inventory, being valued on a first in first
out basis. Net realisable value represents the estimated
selling price less all estimated costs of completion and
costs to be incurred in marketing, selling and distribution.
k. Leases
Leases are classified as finance leases where the terms of
the lease transfer substantially all the risks and rewards of
ownership to the lessee. All other leases are classified as
operating leases.
Operating lease payments are recognised as an expense
on a straight-line basis over the lease term, except where
another systematic basis is more representative of the time
pattern in which economic benefits from the leased asset
are consumed. Rentals arising under operating leases are
recognised as an expense in the period in which they are
incurred.
Lease Incentives
In the event that lease incentives are received to enter
into operating leases, such incentives are recognised as a
liability. The aggregate benefits of incentives are recognised
as a reduction of rental expense on a straight-line basis over
the life of the lease term.
l. Non-current Assets Held for Sale
Non-current assets (and disposal groups) classified as held
for sale are measured at the lower of carrying amount and
fair value less costs to sell.
Non-current assets and disposal groups are classified
as held for sale if their carrying amount will be recovered
through a sale transaction rather than through continuing
use. This condition is regarded as met only when the sale is
highly probable and the asset (or disposal group) is available
for immediate sale in its present condition. The sale of the
asset (or disposal group) is expected to be completed within
one year from the date of classification.
m. Payables
Trade payables and other accounts payable are recognised
when the consolidated entity becomes obliged to make
future payments resulting from the purchase of goods and
services.
n. Presentation Currency
The presentation currency of the Group is Australian dollars.
FINANCIAL REPORT
41MAGONTEC LIMITED ANNUAL REPORT 2016
NO T E S T O T HE F IN A NCI A L S TAT EMEN T Scontinued

1. SUMMARY OF ACCOUNTING POLICIES (CONTINUED)
o. Principles of Consolidation and Investments in Subsidiaries
The consolidated financial statements are prepared by
combining the financial statements of all the entities that
comprise the consolidated entity, being the Company (the
parent entity) and its subsidiaries as defined in Accounting
Standard AASB 127 ‘Consolidated and Separate Financial
Statements.’
A list of subsidiaries appears in Note 22 to the financial
statements. Consistent accounting policies are employed
in the preparation and presentation of the consolidated
financial statements.
On acquisition, the assets, liabilities and contingent
liabilities of a subsidiary are measured at their fair
values at the date of acquisition. Any excess of the cost
of acquisition over the fair values of the identifiable net
assets acquired is recognised as goodwill. Similarly, any
excess of the fair market value over the cost of acquisition
is recognised as a discount upon acquisition.
The consolidated financial statements include the
information and results of each subsidiary from the date
on which the Company obtains control and until such time
as the Company ceases to control such entity.
In preparing the consolidated financial statements, all
intercompany balances and transactions, and unrealised
profits arising within the consolidated entity are
eliminated in full.
p. Plant and Equipment
Plant and equipment are stated at cost less accumulated
depreciation and impairment. Cost includes expenditure
that is directly attributable to the acquisition of the item.
In the event that settlement of all or part of the purchase
consideration is deferred, cost is determined by discounting
the amounts payable in the future to their present value as
at the date of acquisition.
Subsequent costs are included in the asset’s carrying
amount or recognised as a separate asset, as appropriate,
only when it is probable that future economic benefits
associated with the item will flow to the Group and the cost
of the item can be measured reliably. All other repairs and
maintenance are charged to the income statement during
the financial period in which they are incurred.
Depreciation is provided on plant and equipment and is
calculated on a straight line basis so as to write off the
net cost or other revalued amount of each asset over
its expected useful life to its estimated residual value.
Useful life is determined having regard to the nature of
the plant and equipment, the environment in which it
operates (including geographical and climatic conditions)
and an expectation that maintenance is conducted on a
scheduled basis.
Leasehold improvements are depreciated over the period of
the lease or estimated useful life, whichever is the shorter,
using the straight line method. The assets’ estimated
useful lives and residual values is reviewed, and adjusted if
appropriate, at the end of each annual reporting period. The
estimated useful lives of significant items of property, plant
and equipment are as follows:
Land & Buildings 4 - 60 years
Plant & Equipment 3 - 20 years
q. Provisions
Provisions are recognised when the consolidated entity has
a legal or constructive obligation, as a result of past events,
for which it is probable that an outflow of economic benefits
will result and that outflow can be reliably measured.
r. Revenue Recognition
Sale of Goods
Revenue from the sale of goods is recognised when the
consolidated entity has transferred to the buyer the
significant risks and rewards of ownership of the goods. The
Group’s activities involve the sale and delivery of a variety of
products including primary and recycled magnesium ingots,
as well as both magnesium and titanium anodes.
As it relates to Magontec specifically, the timing of revenue
recognition is determined with reference to the INCO
shipping terms (e.g. FOB, CIF, DDP, DAP) that apply to each
delivery. Invoices are issued and revenue is recognised at
the point where the transfer of the significant risks and
rewards of ownership of the goods are determined to have
passed to the customer in line with this framework. For
example, under FOB shipping terms, the Group recognises
revenue at the point when goods have arrived at the port of
departure and has received the bill of lading.
Rendering of Services
Revenue from a contract to provide services is recognised
by reference to the stage of completion of the contract.
Interest Revenue
Interest revenue is recognised on a time proportionate
basis that takes into account the effective yield on the
financial asset.
MAGONTEC LIMITED ANNUAL REPORT 2016
FINANCIAL REPORT
42
NO T E S T O T HE F IN A NCI A L S TAT EMEN T Scontinued

1. SUMMARY OF ACCOUNTING POLICIES (CONTINUED)
s. Share-based Payments
Senior executives of the Company receive remuneration
in the form of share-based payments, whereby employees
render services as consideration for equity instruments
(equity-settled transactions).
Equity-settled Transactions
The cost of equity-settled transactions is determined by
the fair value at the date when the grant is made using an
appropriate valuation model. The fair value determined at
the grant date of the equity-settled share-based payments
is expensed on a straight-line basis over the vesting
period, based on the Company’s estimate of shares that
will eventually vest.
The cumulative expense recognised for equity-settled
transactions at each reporting date until the vesting date
reflects the extent to which the vesting period has expired
and the Company’s best estimate of the number of equity
instruments that will ultimately vest. The expense or credit
in the statement of profit or loss for a period represents
the movement in cumulative expense recognised as at the
beginning and end of that period.
Service and non-market performance conditions are not
taken into account when determining the grant date fair
value of awards, but the likelihood of the conditions being
met is assessed as part of the Company’s best estimate of
the number of equity instruments that will ultimately vest.
Market performance conditions are reflected within the
grant date fair value.
Any other conditions attached to an award, but without an
associated service requirement, are considered to be non-
vesting conditions. Non-vesting conditions are reflected
in the fair value of an award and lead to an immediate
expensing of an award unless there are also service and/or
performance conditions.
No expense is recognised for awards that do not ultimately
vest because non-market performance and/or service
conditions have not been met. Where awards include a
market or non-vesting condition, the transactions are
treated as vested irrespective of whether the market or
non-vesting condition is satisfied, provided that all other
performance and/or service conditions are satisfied.
When the terms of an equity-settled award are modified,
the minimum expense recognised is the grant date fair value
of the unmodified award, provided the original terms of
the award are met. An additional expense, measured as at
the date of modification, is recognised for any modification
that increases the total fair value of the share-based
payment transaction, or is otherwise beneficial to the
employee. Where an award is cancelled by the entity or by
the counterparty, any remaining element of the fair value
of the award is expensed immediately through profit or loss.
The dilutive effect of outstanding options is reflected as
additional share dilution in the computation of diluted
earnings per share.
Cash-settled Transactions
A liability is recognised for the fair value of cash-settled
transactions. The fair value is measured initially and at
each reporting date up to and including the settlement date,
with changes in fair value recognised in employee benefits
expense. The fair value is expensed over the period until the
vesting date with recognition of a corresponding liability.
The fair value is determined using a binomial model.
t. Critical Accounting Judgements and Key Sources of Estimation Uncertainty
In the application of the Group’s accounting policies,
which are described in this note, management is required
to make judgements, estimates and assumptions about
carrying values of assets and liabilities that are not readily
apparent from other sources. The estimates and associated
assumptions are based on historical experience and various
other factors that are believed to be reasonable under
the circumstances, the results of which form the basis of
making the judgements. Actual results may differ from
these estimates.
The estimates and underlying assumptions are reviewed
on an ongoing basis. Revisions to accounting estimates are
recognised in the period in which the estimate is revised if
the revision affects only that period or in the period of the
revision and future periods if the revision affects both the
current and future periods.
Material examples of management applying critical
accounting judgements and key sources of estimation
uncertainty include:
− actuarial assessment of future pension liabilities;
− value of trade debtors; and
− valuation of intellectual property acquired with the
Magontec group of companies in July 2011.
u. New Accounting Standards for Application in Future Periods
The AASB has issued new and amended standards and
interpretations that have mandatory application dates for
future reporting periods. The Group has not early adopted
any of these standards. New standards and disclosures that
will be significant to the Group in future years include:
AASB 9 Financial Instruments, Effective from 1 January 2018
Caused by a re-write of the financial instruments standard
by the International Accounting Standards Board this new
standard will effect classification and measurement of
financial assets (AASB 2009), classification, measurement
and derecognition of financial liabilities (AASB 9 2010) and
Hedge Accounting (AASB 9 2013).
FINANCIAL REPORT
43MAGONTEC LIMITED ANNUAL REPORT 2016
NO T E S T O T HE F IN A NCI A L S TAT EMEN T Scontinued
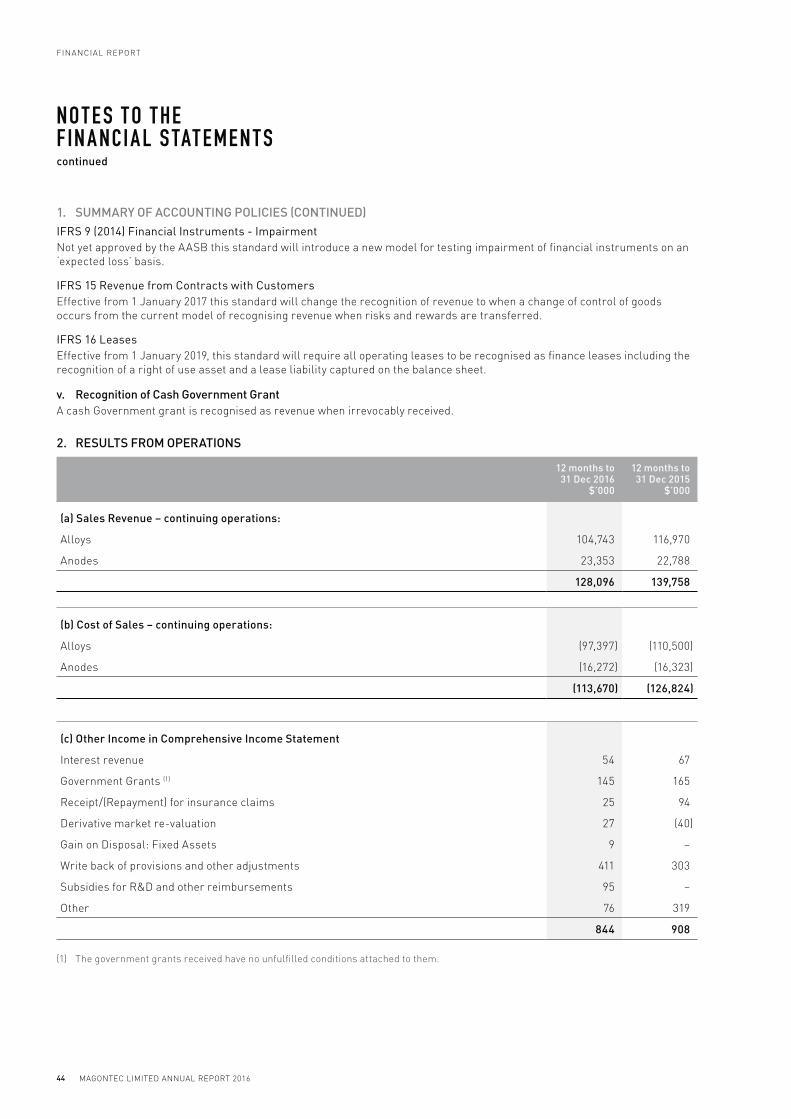
1. SUMMARY OF ACCOUNTING POLICIES (CONTINUED)
IFRS 9 (2014) Financial Instruments - Impairment
Not yet approved by the AASB this standard will introduce a new model for testing impairment of financial instruments on an
‘expected loss’ basis.
IFRS 15 Revenue from Contracts with Customers
Effective from 1 January 2017 this standard will change the recognition of revenue to when a change of control of goods
occurs from the current model of recognising revenue when risks and rewards are transferred.
IFRS 16 Leases
Effective from 1 January 2019, this standard will require all operating leases to be recognised as finance leases including the
recognition of a right of use asset and a lease liability captured on the balance sheet.
v. Recognition of Cash Government Grant
A cash Government grant is recognised as revenue when irrevocably received.
2. RESULTS FROM OPERATIONS
12 months to 31 Dec 2016
$’000
12 months to 31 Dec 2015
$’000
(a) Sales Revenue – continuing operations:
Alloys 104,743 116,970
Anodes 23,353 22,788
128,096 139,758
(b) Cost of Sales – continuing operations:
Alloys (97,397) (110,500)
Anodes (16,272) (16,323)
(113,670) (126,824)
(c) Other Income in Comprehensive Income Statement
Interest revenue 54 67
Government Grants (1) 145 165
Receipt/(Repayment) for insurance claims 25 94
Derivative market re-valuation 27 (40)
Gain on Disposal: Fixed Assets 9 –
Write back of provisions and other adjustments 411 303
Subsidies for R&D and other reimbursements 95 –
Other 76 319
844 908
(1) The government grants received have no unfulfilled conditions attached to them.
MAGONTEC LIMITED ANNUAL REPORT 2016
FINANCIAL REPORT
44
NO T E S T O T HE F IN A NCI A L S TAT EMEN T Scontinued
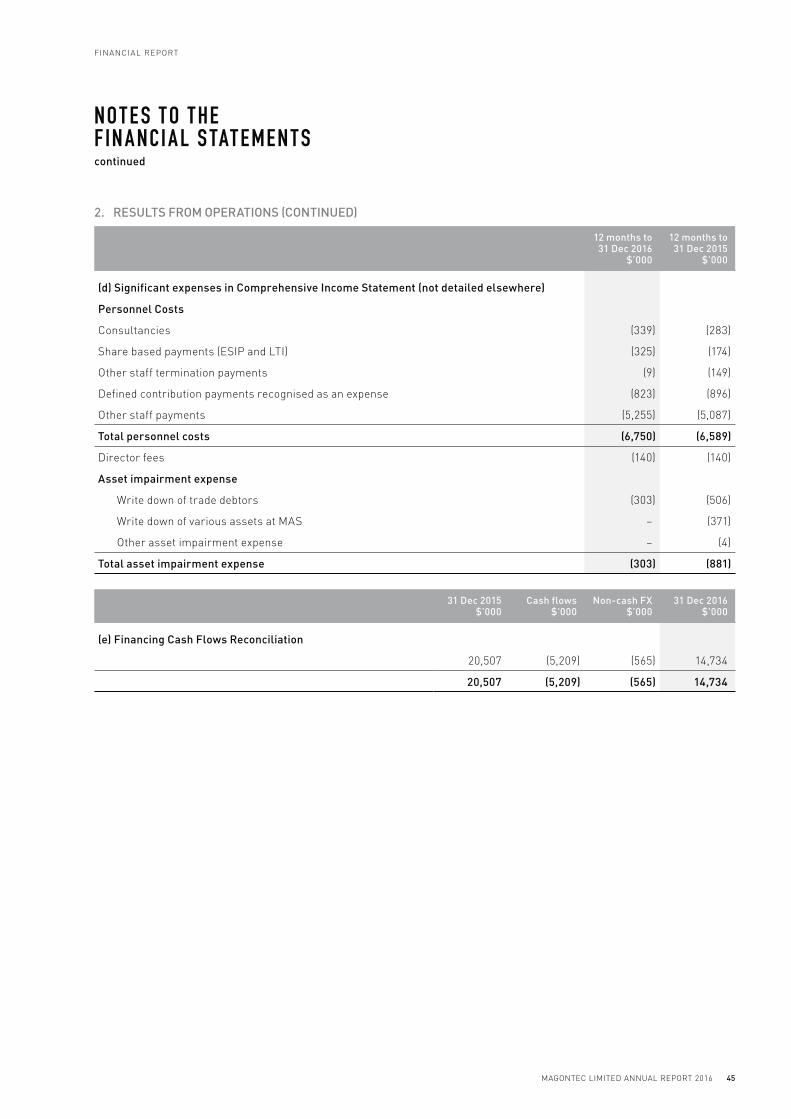
2. RESULTS FROM OPERATIONS (CONTINUED)
12 months to 31 Dec 2016
$’000
12 months to 31 Dec 2015
$’000
(d) Significant expenses in Comprehensive Income Statement (not detailed elsewhere)
Personnel Costs
Consultancies (339) (283)
Share based payments (ESIP and LTI) (325) (174)
Other staff termination payments (9) (149)
Defined contribution payments recognised as an expense (823) (896)
Other staff payments (5,255) (5,087)
Total personnel costs (6,750) (6,589)
Director fees (140) (140)
Asset impairment expense
Write down of trade debtors (303) (506)
Write down of various assets at MAS – (371)
Other asset impairment expense – (4)
Total asset impairment expense (303) (881)
31 Dec 2015 $’000
Cash flows $’000
Non-cash FX $’000
31 Dec 2016 $’000
(e) Financing Cash Flows Reconciliation
20,507 (5,209) (565) 14,734
20,507 (5,209) (565) 14,734
FINANCIAL REPORT
45MAGONTEC LIMITED ANNUAL REPORT 2016
NO T E S T O T HE F IN A NCI A L S TAT EMEN T Scontinued
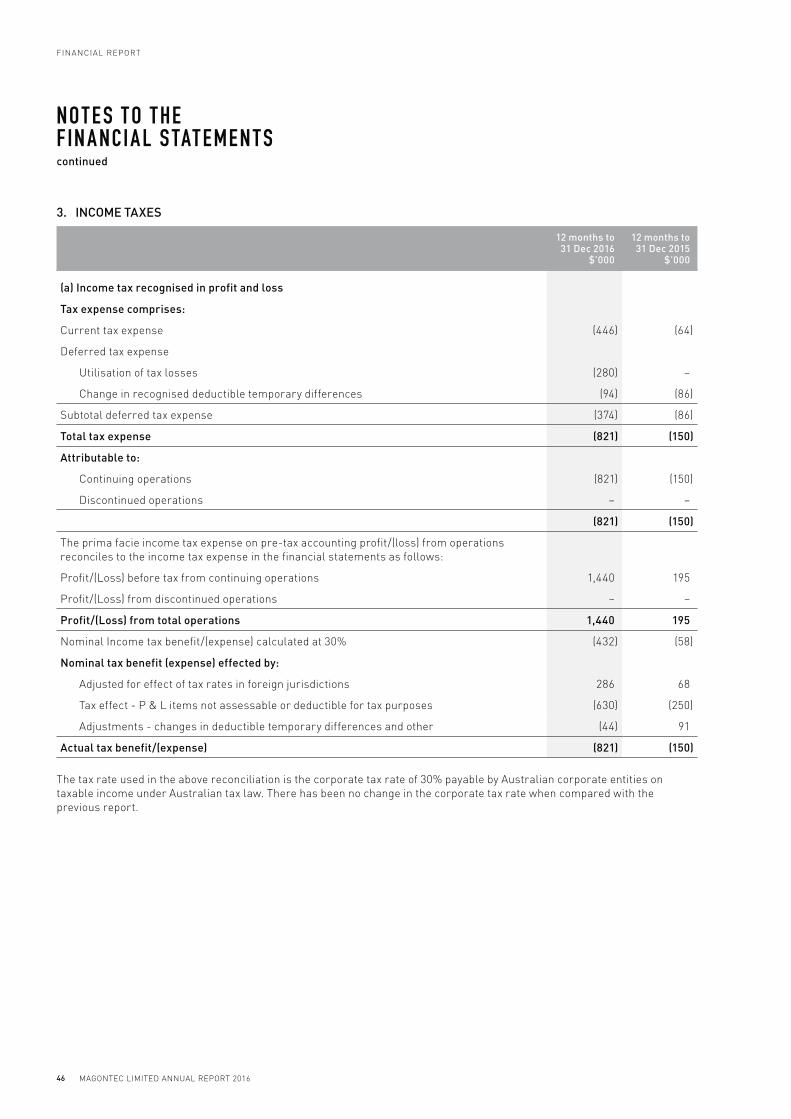
3. INCOME TAXES
12 months to 31 Dec 2016
$’000
12 months to 31 Dec 2015
$’000
(a) Income tax recognised in profit and loss
Tax expense comprises:
Current tax expense (446) (64)
Deferred tax expense
Utilisation of tax losses (280) –
Change in recognised deductible temporary differences (94) (86)
Subtotal deferred tax expense (374) (86)
Total tax expense (821) (150)
Attributable to:
Continuing operations (821) (150)
Discontinued operations – –
(821) (150)
The prima facie income tax expense on pre-tax accounting profit/(loss) from operations
reconciles to the income tax expense in the financial statements as follows:
Profit/(Loss) before tax from continuing operations 1,440 195
Profit/(Loss) from discontinued operations – –
Profit/(Loss) from total operations 1,440 195
Nominal Income tax benefit/(expense) calculated at 30% (432) (58)
Nominal tax benefit (expense) effected by:
Adjusted for effect of tax rates in foreign jurisdictions 286 68
Tax effect - P & L items not assessable or deductible for tax purposes (630) (250)
Adjustments - changes in deductible temporary differences and other (44) 91
Actual tax benefit/(expense) (821) (150)
The tax rate used in the above reconciliation is the corporate tax rate of 30% payable by Australian corporate entities on
taxable income under Australian tax law. There has been no change in the corporate tax rate when compared with the
previous report.
MAGONTEC LIMITED ANNUAL REPORT 2016
FINANCIAL REPORT
46
NO T E S T O T HE F IN A NCI A L S TAT EMEN T Scontinued
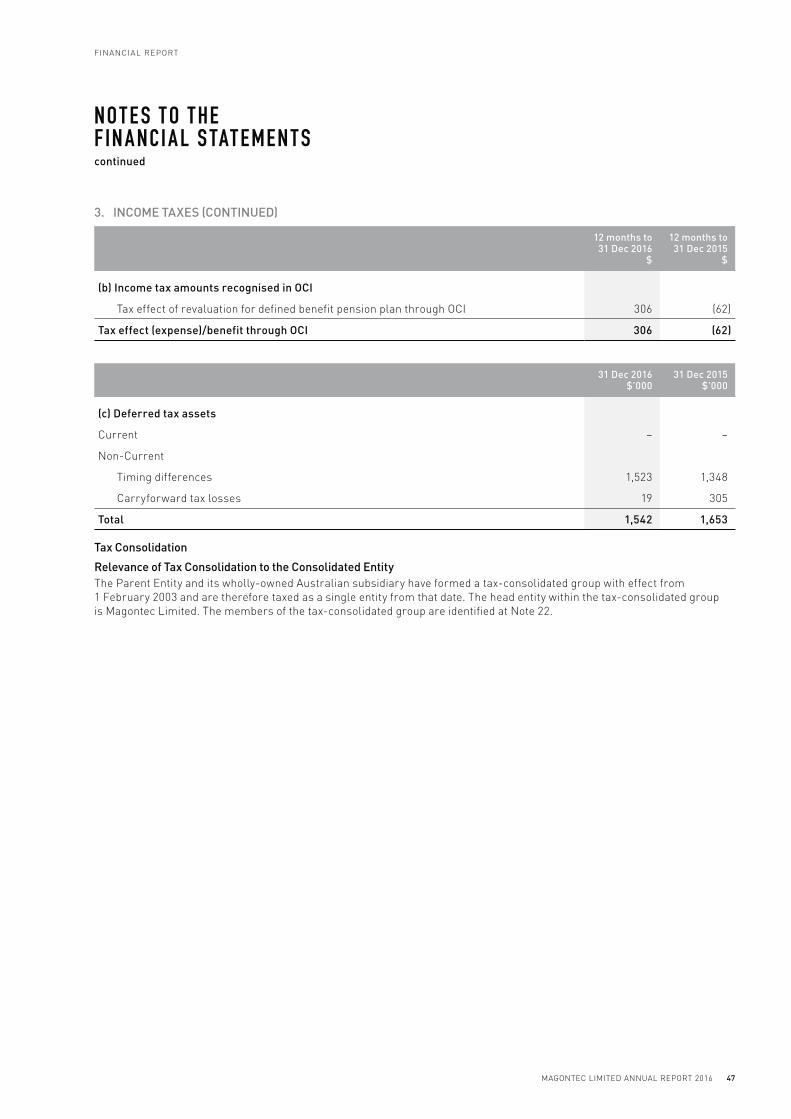
3. INCOME TAXES (CONTINUED)
12 months to 31 Dec 2016
$
12 months to 31 Dec 2015
$
(b) Income tax amounts recognised in OCI
Tax effect of revaluation for defined benefit pension plan through OCI 306 (62)
Tax effect (expense)/benefit through OCI 306 (62)
31 Dec 2016 $’000
31 Dec 2015 $’000
(c) Deferred tax assets
Current – –
Non-Current
Timing differences 1,523 1,348
Carryforward tax losses 19 305
Total 1,542 1,653
Tax Consolidation
Relevance of Tax Consolidation to the Consolidated Entity
The Parent Entity and its wholly-owned Australian subsidiary have formed a tax-consolidated group with effect from
1 February 2003 and are therefore taxed as a single entity from that date. The head entity within the tax-consolidated group
is Magontec Limited. The members of the tax-consolidated group are identified at Note 22.
FINANCIAL REPORT
47MAGONTEC LIMITED ANNUAL REPORT 2016
NO T E S T O T HE F IN A NCI A L S TAT EMEN T Scontinued

3. INCOME TAXES (CONTINUED)
Nature of Tax Funding Arrangements and Tax Sharing Agreements
Entities within the tax-consolidated group ensure that inter-company transactions are conducted at fair market value and at
arm’s length.
Consolidated Parent Entity
31 Dec 2016 $’000
31 Dec 2015 $’000
(d) Unrecognised deferred tax balances
The following deferred tax assets have not been brought to account as assets:
Australian Tax Consolidated Group
Deferred Tax Asset (DTA) on pre-tax consolidation revenue losses 81,581 81,581
DTA on post-tax consolidation revenue losses 36,643 35,081
DTA on capital losses 29,019 29,019
Sub Total Australian Tax Consolidated Group 147,242 145,681
Foreign Subsidiaries
DTA on revenue losses 93 93
Sub Total Foreign Subsidiaries 93 93
Consolidated Group Total 147,335 145,774
These are based on the following tax losses:
Aust consolidated group Tax losses – revenue pre-tax consolidation 271,935 271,935
Aust consolidated group Tax losses – revenue post-tax consolidation 122,142 116,936
Foreign subsidiaries Tax losses – revenue 371 371
Aust consolidated group Tax losses – capital 96,731 96,731
Consolidated Group Total 491,180 485,974
The benefit from the Australian deferred tax asset in respect of unused tax losses will only be obtained if:
a. the tax consolidated group derives future Australian assessable income of a nature and amount sufficient to enable the
benefits to be realised;
b. the consolidated group continues to comply with the conditions for deductibility imposed by the tax law; and
c. no changes in tax legislation adversely affect the consolidated group in realising the benefit of the losses.
No deferred tax asset has been brought to account as an asset because it is not probable that taxable profit will be available
against which such an asset could be utilised.
Unused tax losses incurred after the formation of the former Advanced Magnesium Limited (the former name of Magontec
Limited) consolidated group are $122.1 million. These losses will be fully available to offset future taxable income to the
extent the tax-consolidated group continues to satisfy the loss integrity rules (i.e. Continuity of Ownership Test and Same
Business Test).
MAGONTEC LIMITED ANNUAL REPORT 2016
FINANCIAL REPORT
48
NO T E S T O T HE F IN A NCI A L S TAT EMEN T Scontinued
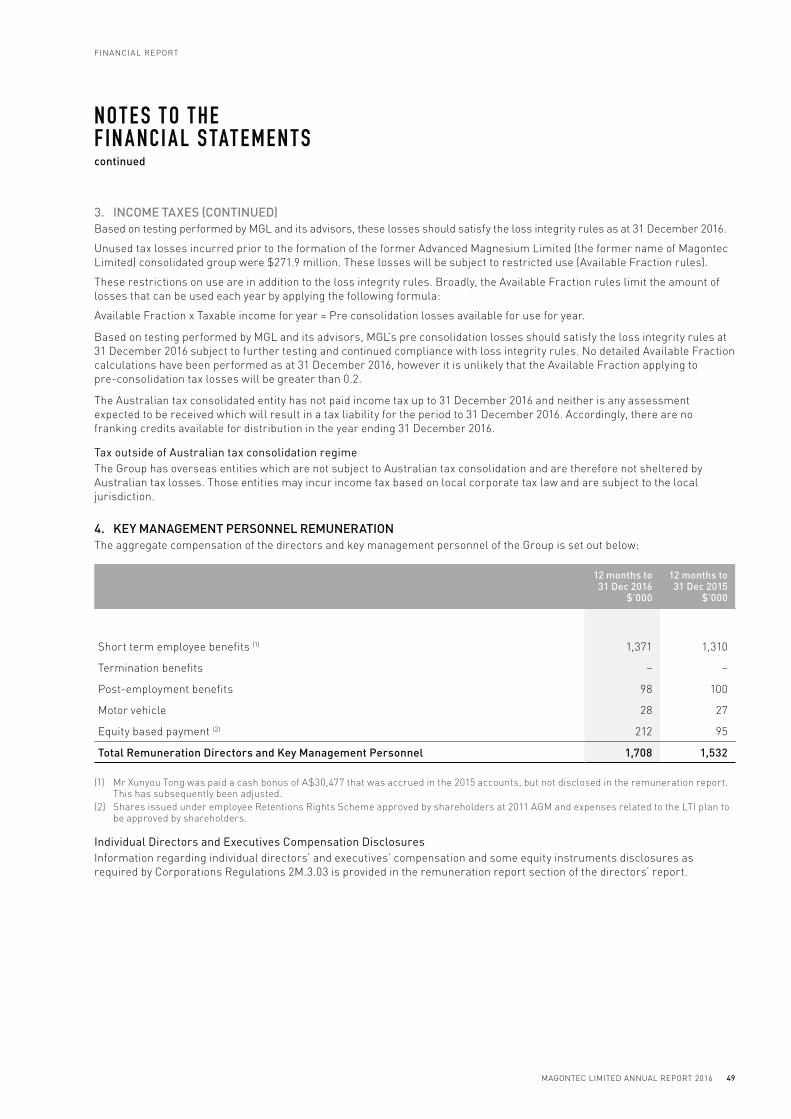
3. INCOME TAXES (CONTINUED)
Based on testing performed by MGL and its advisors, these losses should satisfy the loss integrity rules as at 31 December 2016.
Unused tax losses incurred prior to the formation of the former Advanced Magnesium Limited (the former name of Magontec
Limited) consolidated group were $271.9 million. These losses will be subject to restricted use (Available Fraction rules).
These restrictions on use are in addition to the loss integrity rules. Broadly, the Available Fraction rules limit the amount of
losses that can be used each year by applying the following formula:
Available Fraction x Taxable income for year = Pre consolidation losses available for use for year.
Based on testing performed by MGL and its advisors, MGL’s pre consolidation losses should satisfy the loss integrity rules at
31 December 2016 subject to further testing and continued compliance with loss integrity rules. No detailed Available Fraction
calculations have been performed as at 31 December 2016, however it is unlikely that the Available Fraction applying to
pre-consolidation tax losses will be greater than 0.2.
The Australian tax consolidated entity has not paid income tax up to 31 December 2016 and neither is any assessment
expected to be received which will result in a tax liability for the period to 31 December 2016. Accordingly, there are no
franking credits available for distribution in the year ending 31 December 2016.
Tax outside of Australian tax consolidation regime
The Group has overseas entities which are not subject to Australian tax consolidation and are therefore not sheltered by
Australian tax losses. Those entities may incur income tax based on local corporate tax law and are subject to the local
jurisdiction.
4. KEY MANAGEMENT PERSONNEL REMUNERATION
The aggregate compensation of the directors and key management personnel of the Group is set out below:
12 months to 31 Dec 2016
$’000
12 months to 31 Dec 2015
$’000
Short term employee benefits (1) 1,371 1,310
Termination benefits – –
Post-employment benefits 98 100
Motor vehicle 28 27
Equity based payment (2) 212 95
Total Remuneration Directors and Key Management Personnel 1,708 1,532
(1) Mr Xunyou Tong was paid a cash bonus of A$30,477 that was accrued in the 2015 accounts, but not disclosed in the remuneration report.This has subsequently been adjusted.
(2) Shares issued under employee Retentions Rights Scheme approved by shareholders at 2011 AGM and expenses related to the LTI plan to be approved by shareholders.
Individual Directors and Executives Compensation Disclosures
Information regarding individual directors’ and executives’ compensation and some equity instruments disclosures as
required by Corporations Regulations 2M.3.03 is provided in the remuneration report section of the directors’ report.
FINANCIAL REPORT
49MAGONTEC LIMITED ANNUAL REPORT 2016
NO T E S T O T HE F IN A NCI A L S TAT EMEN T Scontinued

5. REMUNERATION OF AUDITORS
12 months to 31 Dec 2016
$’000
12 months to 31 Dec 2015
$’000
Group auditor
- Audit or review of the financial report 92 85
- Accounting/taxation services 21 14
Auditors of subsidiaries
- Audit or review of the financial reports 111 88
- Accounting/taxation services 41 82
265 269
The auditor of Magontec Limited is Camphin Boston Chartered Accountants. Magontec GmbH, Magontec Xi’an Co Limited
and Magontec Romania are all audited by local auditors who supply information as requested by the Group Auditor
Camphin Boston.
6. CURRENT TRADE AND OTHER RECEIVABLES
31 Dec 2016 $’000
31 Dec 2015 $’000
Trade receivables (1) 14,898 19,101
Allowance for doubtful debts (975) (705)
13,923 18,396
Net GST/VAT recoverable 1,513 822
Security deposits 37 29
Derivatives fair value adjustment 25(f) 66 –
Other receivables due to operating entities 6,367 2,866
Other 50 51
8,034 3,767
Total receivables 21,956 22,163
(1) Trade receivables represent 42.57 days sales at 31 Dec 16 (49.89 days sales at 31 Dec 15).
MAGONTEC LIMITED ANNUAL REPORT 2016
FINANCIAL REPORT
50
NO T E S T O T HE F IN A NCI A L S TAT EMEN T Scontinued
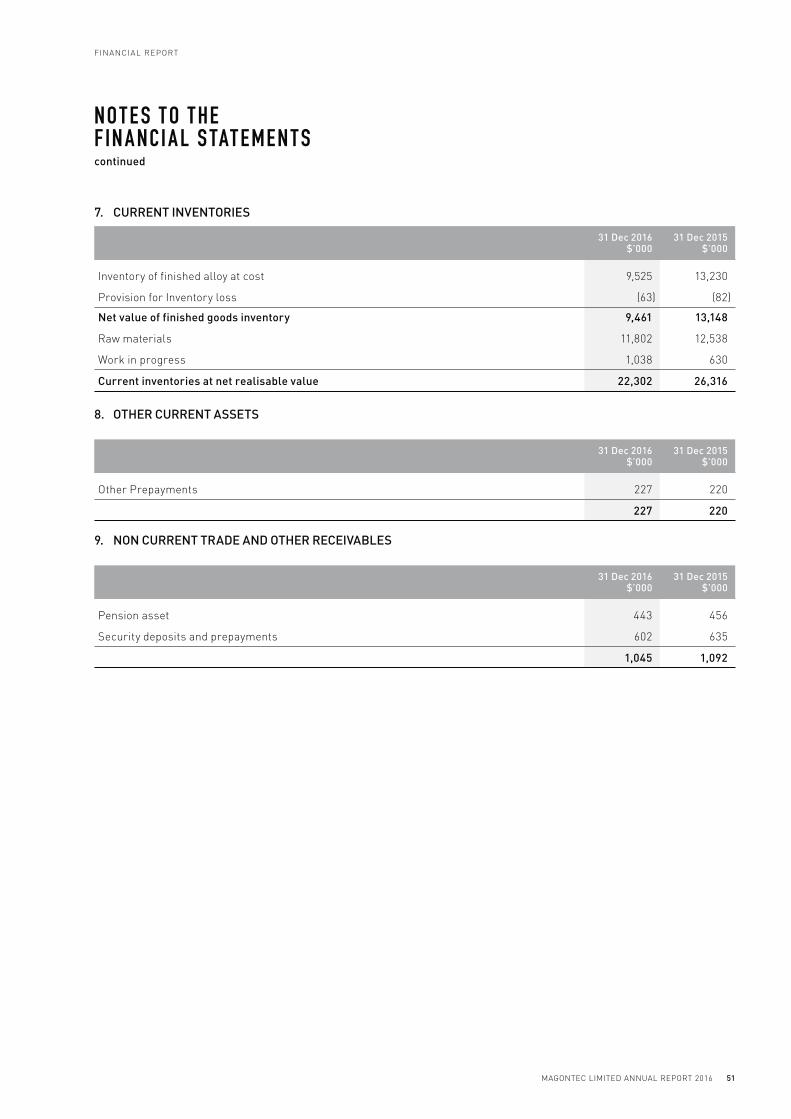
7. CURRENT INVENTORIES
31 Dec 2016 $’000
31 Dec 2015 $’000
Inventory of finished alloy at cost 9,525 13,230
Provision for Inventory loss (63) (82)
Net value of finished goods inventory 9,461 13,148
Raw materials 11,802 12,538
Work in progress 1,038 630
Current inventories at net realisable value 22,302 26,316
8. OTHER CURRENT ASSETS
31 Dec 2016 $’000
31 Dec 2015 $’000
Other Prepayments 227 220
227 220
9. NON CURRENT TRADE AND OTHER RECEIVABLES
31 Dec 2016 $’000
31 Dec 2015 $’000
Pension asset 443 456
Security deposits and prepayments 602 635
1,045 1,092
FINANCIAL REPORT
51MAGONTEC LIMITED ANNUAL REPORT 2016
NO T E S T O T HE F IN A NCI A L S TAT EMEN T Scontinued

10. PROPERTY PLANT AND EQUIPMENT
Capital WIP $’000
Land & Buildings
$’000
Plant & Equipment
$’000Total
$’000
Gross carrying amount
Balance at 1 January 2015 1,707 16,805 24,160 42,672
Additions 2,696 491 906 4,092
Adjustments and reclassifications (630) 694 (258) (194)
Impairment at MAS (1) – – (579) (579)
Disposals and write offs (1) – (80) (80)
Net foreign currency exchange differences 82 256 696 1,034
Balance at 31 December 2015 3,854 18,246 24,845 46,945
Additions 2,539 110 662 3,311
Write Offs – – – –
Adjustments and reclassifications (2) – (15) (301) (316)
Impairment – – 85 85
Disposals – – (89) (89)
Net foreign currency exchange differences (204) (459) (823) (1,485)
Balance at 31 December 2016 6,190 17,882 24,379 48,450
Accumulated depreciation/amortisation and impairment
Balance at 1 January 2015 – 7,324 18,108 25,432
Disposals and write offs – – (78) (78)
Adjustments and reclassifications (2) – 146 (173) (27)
Impairment at MAS (1) – – (328) (328)
Depreciation expense – 540 1,076 1,616
Net foreign currency exchange differences – 139 623 762
Balance at 31 December 2015 – 8,148 19,230 27,377
Disposals – – (58) (58)
Write Offs – – – –
Adjustments and reclassifications (2) – – (176) (176)
Impairment – – 121 121
Depreciation expense – 548 998 1,545
Net foreign currency exchange differences – (216) (687) (903)
Balance at 31 December 2016 – 8,480 19,427 27,907
Net Book Value As at 31 Dec 15 3,854 10,099 5,616 19,567
Net Book Value As at 31 Dec 16 6,190 9,403 4,952 20,543
Note 1. Impairment of assets at Suzhou recycling facility (MAS)
The prior year ended 31 December 2015 saw the Group recognise an impairment loss at our recycling facility at MAS of -
− $250,612 related to the write down of the net value of property, plant and equipment, being the carrying value of gross assets $578,857 less accumulated depreciation of $328,244 and;
− $120,529 related to the write down of the net value of assets other than property, plant and equipment
MAGONTEC LIMITED ANNUAL REPORT 2016
FINANCIAL REPORT
52
NO T E S T O T HE F IN A NCI A L S TAT EMEN T Scontinued

10. PROPERTY PLANT & EQUIPMENT (CONTINUED)
Following the decrease in recycling volumes in 2015, the MAS cash generating unit was assessed for impairment by adopting a value in use model which assumed a discount rate of 12.1% and a terminal decline rate of 3%. The write down of $250,612 in the net value of property, plant and equipment was determined after offsetting the terminal realisable value of selected property, plant and equipment that will be redeployed in other facilities within China which remain profitable.
Note 2. Adjustments and reclassifications
Adjustments and reclassifications reflects the effects of the rebuild of the accounts in Romania to the opening balance sheet as at 31 December 2014 in the prior year as well as subsequent asset transfers.
11. INTANGIBLES
Indefinite Life (1) $’000
Finite Life
$’000Total
$’000
Gross carrying amount
Balance at 31-Dec-15 2,800 1,391 4,191
Disposals – (2) (2)
Adjustments and reclassifications – – –
Net foreign currency exchange differences – (31) (31)
Additions – 15 15
Balance at 31-Dec-16 2,800 1,373 4,173
Accumulated depreciation/amortisation and impairment
Balance at 31-Dec-15 – 1,163 1,163
Disposals – – –
Adjustments and reclassifications – – –
Depreciation/amortisation expense – 168 168
Net foreign currency exchange differences – (26) (26)
Balance at 31-Dec-16 – 1,305 1,305
Net Book Value As at 31 Dec 15 2,800 228 3,028
Net Book Value As at 31 Dec 16 2,800 69 2,869
Note 1 - Indefinite Life Intangible Assets - Patents in relation to “AE44” and “Correx”.
The indefinite life intangible assets comprise the patents held over the range of “AE” alloys and the “Correx” anode system.
The Board believes both products enjoy a margin of technical superiority over possible alternatives and as such both continue
to provide high gross margins.
In testing the value of this asset for impairment, the Group has applied a discount rate of 6.9% to management cash flow
forecasts, reflecting a reduction from the 15% rate used last year as this has been ascribed to our European operations which
has a lower cost of capital. A zero growth rate has been assumed over the initial 5 year period, with a declining terminal
rate of decline of 12.4% per annum assumed thereafter. The final result found the value in use to be in excess of its carrying
amount and thus no impairment loss was recorded.
FINANCIAL REPORT
53MAGONTEC LIMITED ANNUAL REPORT 2016
NO T E S T O T HE F IN A NCI A L S TAT EMEN T Scontinued

12. CURRENT TRADE AND OTHER PAYABLES
31 Dec 2016 $’000
31 Dec 2015 $’000
Trade creditors (1) 11,219 12,609
Other creditors and accruals (2) 2,453 3,399
13,672 16,008
(1) Trade creditors represent 36.12 days cost of goods sold (36.29 days cost of goods sold at 31 Dec 15).
(2) A reclass of $268,000 was made from other creditors and accruals into the provision for annual and long service leave caption as at 31 December 2015. This adjustment was balance sheet only and did not have an impact on profit and loss.
13. BORROWINGS
31 Dec 2016 31 Dec 2016 31 Dec 2016 31 Dec 2015 31 Dec 2015 31 Dec 2015
Notes $’000Maturity
DateInterest
pa (1) $’000Maturity
DateInterest
pa (1)
Bank & Institutional Borrowings
Magontec GmbH
(Bank Loan) (2) (5) (6) 25(g) 2,922 30-Jun-17 2.15% 8,939 30-Jun-17 2.00%
Magontec GmbH
(Bank Loan) (2) (5) (6) 25(g) 3,521 30-Jun-17 2.15% 1,436 30-Jun-17 2.27%
Magontec GmbH
(Hire Purchase Facility) (5) (6) 25(g) 472 31-Dec-18 2.50% 696 31-Dec-18 1.20%
Magontec GmbH
(Factoring Facility) (4) 796 30-Nov-16 1.34% 863 30-Nov-16 1.30%
Magontec SRL
(Working Capital Facility) (3) 3,583 31-Dec-18 3.15% 1,693 Open 3.15%
Magontec SRL (Bank Loan) (3) 231 30-Nov-16 2.70% 942 28-Apr-17 2.70%
Magontec Xi’an Limited
(Bank Loan) (5) (6) 25(g) – – – 685 19-Aug-16 5.38%
Magontec Xi’an Limited
(Bank Loan) (5) (6) 25(g) – – – 646 23-Sep-16 5.33%
Magontec Xi’an Limited
(Bank Loan) (5) (6) 25(g) – – – 602 14-Oct-16 5.28%
Magontec Xi’an Limited
(Bank Loan) (5) (6) 25(g) – – – 647 21-Oct-16 5.19%
Magontec Xi’an Limited
(Bank Loan) 4,005 25-Apr-17 4.52% 4,222 28-Apr-16 5.62%
Total Bank Borrowings 15,530 21,370
Current Borrowings
Bank borrowings as above
(excluding factoring facility) 14,734 Various – 20,272 Various
Total Current Borrowings 14,734 20,272
Non-Current Borrowings
Bank borrowings as above – – 235 28-Apr-17
Total Non-Current borrowings – 235
(1) Interest rate is the rate that applied at the end of the relevant reporting period and is expressed as compounding annually in arrears.
(2) These borrowings are secured by a charge over MAB’s trade debtors to the extent of EUR 1.7m ($2.5m) and inventory of EUR 4.6m ($6.7m).
MAGONTEC LIMITED ANNUAL REPORT 2016
FINANCIAL REPORT
54
NO T E S T O T HE F IN A NCI A L S TAT EMEN T Scontinued
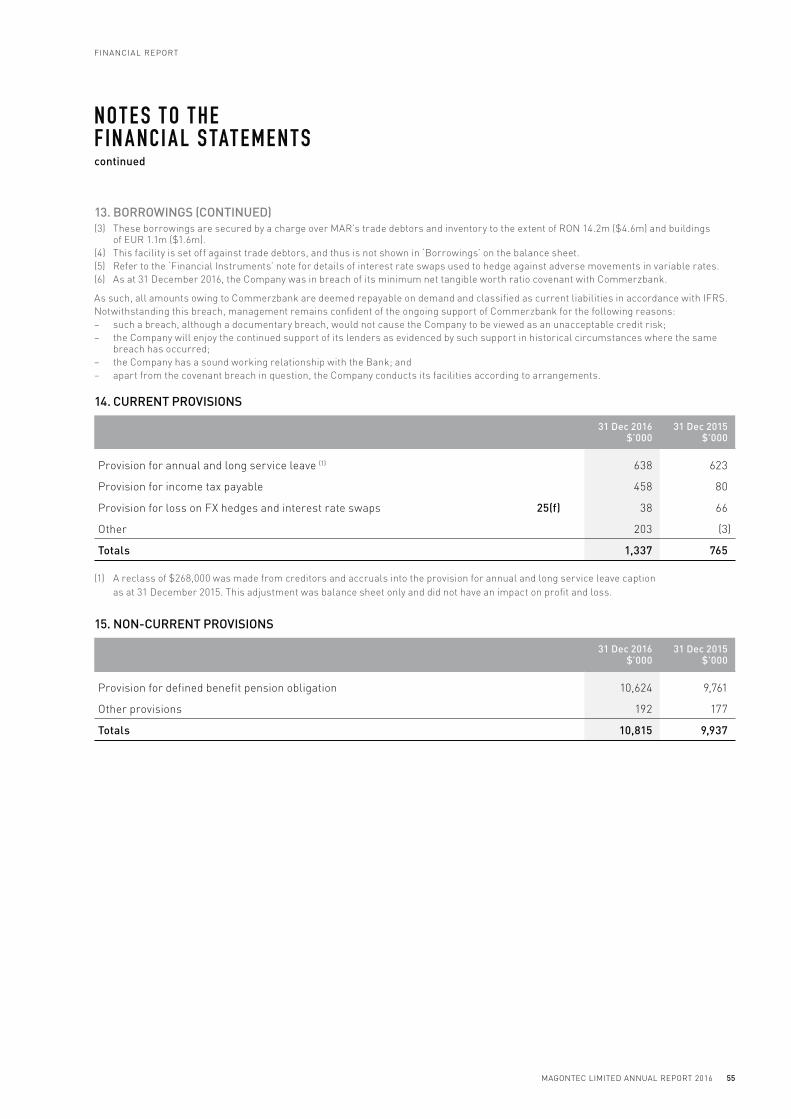
13. BORROWINGS (CONTINUED)
(3) These borrowings are secured by a charge over MAR’s trade debtors and inventory to the extent of RON 14.2m ($4.6m) and buildings of EUR 1.1m ($1.6m).
(4) This facility is set off against trade debtors, and thus is not shown in ‘Borrowings’ on the balance sheet.
(5) Refer to the ‘Financial Instruments’ note for details of interest rate swaps used to hedge against adverse movements in variable rates.
(6) As at 31 December 2016, the Company was in breach of its minimum net tangible worth ratio covenant with Commerzbank.
As such, all amounts owing to Commerzbank are deemed repayable on demand and classified as current liabilities in accordance with IFRS.
Notwithstanding this breach, management remains confident of the ongoing support of Commerzbank for the following reasons:
− such a breach, although a documentary breach, would not cause the Company to be viewed as an unacceptable credit risk;
− the Company will enjoy the continued support of its lenders as evidenced by such support in historical circumstances where the same breach has occurred;
− the Company has a sound working relationship with the Bank; and
− apart from the covenant breach in question, the Company conducts its facilities according to arrangements.
14. CURRENT PROVISIONS
31 Dec 2016 $’000
31 Dec 2015 $’000
Provision for annual and long service leave (1) 638 623
Provision for income tax payable 458 80
Provision for loss on FX hedges and interest rate swaps 25(f) 38 66
Other 203 (3)
Totals 1,337 765
(1) A reclass of $268,000 was made from creditors and accruals into the provision for annual and long service leave caption
as at 31 December 2015. This adjustment was balance sheet only and did not have an impact on profit and loss.
15. NON-CURRENT PROVISIONS
31 Dec 2016 $’000
31 Dec 2015 $’000
Provision for defined benefit pension obligation 10,624 9,761
Other provisions 192 177
Totals 10,815 9,937
FINANCIAL REPORT
55MAGONTEC LIMITED ANNUAL REPORT 2016
NO T E S T O T HE F IN A NCI A L S TAT EMEN T Scontinued

15. NON-CURRENT PROVISIONS (CONTINUED)
Reconciliation of the Defined Benefit Pension Obligation
Year Ended 31 Dec 2016
$’000
Year Ended 31 Dec 2015
$’000
Defined benefit obligation beginning of year 9,761 9,753
Current service cost 195 214
Interest cost 217 208
Total benefits paid - actual (290) (291)
Foreign currency exchange rate changes (188) 64
Experience adjustments (gains)/ losses – –
Actuarial (gains)/ losses due to change of assumptions 928 (187)
Defined benefit obligation end of year 10,624 9,761
The extent of the Provision for the Defined Benefit Obligation is assessed annually based on actuarial calculations which take
into account such matters as:
− number of participants in the plan;
− likely retirement salaries of participants in the pension plan;
− their life expectancy beyond retirement; and
− implied interest earnings on the extent of the fund.
The defined benefit plan is an unfunded plan which has been provided to employees in the European business. Increasing
interest rates will act to decrease the Provision. The converse is also true. In the context of falling interest rates in Europe
(where the beneficiaries of this pension plan are domiciled) there has been upward pressure on the Provision over the last few
years. A summary of the key assumptions underpinning the actuarial calculation and a sensitivity analysis is provided below.
Key Actuarial Assumptions used in Calculation of the Defined Benefit Obligation
Year Ended 31 Dec 2016
$’000
Year Ended 31 Dec 2015
$’000
Discount rate 1.80% 2.30%
Expected salary increase per annum 2.75% 2.75%
Expected pension increase per annum 1.75% 1.75%
MAGONTEC LIMITED ANNUAL REPORT 2016
FINANCIAL REPORT
56
NO T E S T O T HE F IN A NCI A L S TAT EMEN T Scontinued
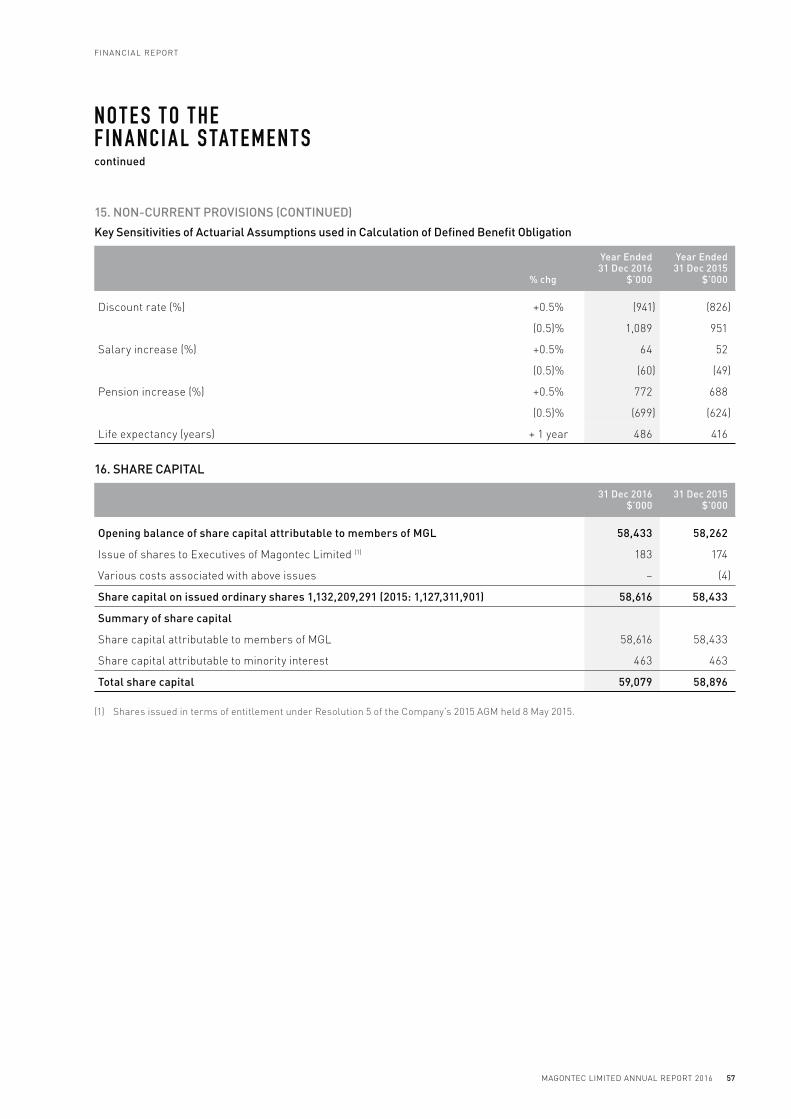
15. NON-CURRENT PROVISIONS (CONTINUED)
Key Sensitivities of Actuarial Assumptions used in Calculation of Defined Benefit Obligation
% chg
Year Ended 31 Dec 2016
$’000
Year Ended 31 Dec 2015
$’000
Discount rate (%) +0.5% (941) (826)
(0.5)% 1,089 951
Salary increase (%) +0.5% 64 52
(0.5)% (60) (49)
Pension increase (%) +0.5% 772 688
(0.5)% (699) (624)
Life expectancy (years) + 1 year 486 416
16. SHARE CAPITAL
31 Dec 2016 $’000
31 Dec 2015 $’000
Opening balance of share capital attributable to members of MGL 58,433 58,262
Issue of shares to Executives of Magontec Limited (1) 183 174
Various costs associated with above issues – (4)
Share capital on issued ordinary shares 1,132,209,291 (2015: 1,127,311,901) 58,616 58,433
Summary of share capital
Share capital attributable to members of MGL 58,616 58,433
Share capital attributable to minority interest 463 463
Total share capital 59,079 58,896
(1) Shares issued in terms of entitlement under Resolution 5 of the Company’s 2015 AGM held 8 May 2015.
FINANCIAL REPORT
57MAGONTEC LIMITED ANNUAL REPORT 2016
NO T E S T O T HE F IN A NCI A L S TAT EMEN T Scontinued

16. SHARE CAPITAL (CONTINUED)
A reconciliation of the movement in fully paid ordinary shares at the line in Note 16 ‘Share capital on issued ordinary shares
1,132,209,291 (31 Dec 2015: 1,127,311,901) is set out below:
Consolidated Parent Entity
31 Dec 2016 31 Dec 2015
No. $’000 No. $’000
Fully paid ordinary shares
Balance at beginning of financial year 1,127,311,901 58,433 1,115,725,813 58,262
Expenses of various issues – – – (4)
Issue of shares to Executives of Magontec Limited 4,897,390 183 11,586,088 174
1,132,209,291 58,616 1,127,311,901 58,433
Fully paid ordinary shares carry one vote per share and carry the right to dividends.
Share Options
All share options carry no rights to dividends and no voting rights until paid for by conversion into ordinary shares.
Further details of the share-based payment schemes are contained in the Remuneration Report.
MAGONTEC LIMITED ANNUAL REPORT 2016
FINANCIAL REPORT
58
NO T E S T O T HE F IN A NCI A L S TAT EMEN T Scontinued

17. RESERVES
Note31 Dec 2016
$’00031 Dec 2015
$’000
Capital reserve
Balance at beginning of financial year (1) 2,750 2,750
Balance at end of financial year 2,750 2,750
Foreign currency translation reserve
Balance at beginning of financial year (2) 4,154 3,546
Movement in VHL Consolidated accounts (1,112) 608
Balance at end of financial year 3,042 4,154
Actuarial Reserves
Balance at beginning of financial year (1,785) (1,917)
Derivatives – –
Deferred tax assets 306 (62)
Employee pensions (928) 187
Other 1 7
Balance at end of financial year (2,405) (1,785)
Expired Options Reserve
Balance at beginning of financial year 1,637 1,637
ESOP options expiry – –
Balance at end of financial year 1,637 1,637
Share Issue Reserve
Balance at beginning of financial year – –
Issue of LTI shares subject to shareholder approval 141 –
Balance at end of financial year 141 –
Total reserves 5,165 6,755
Reserves attributable to minority interests – –
Reserves attributable to members of MGL 5,165 6,755
Total reserves 5,165 6,755
Other Comprehensive Income - that may later emerge in the Profit and Loss Statement
Exchange differences taken to reserves in equity – translation of overseas
entities (1,112) 608
Movement in various actuarial assessments (620) 131
Total Other Comprehensive Income (1,732) 740
Notes
(1) The capital reserve is a historical reserve from 2002 that arose after calculation of the outside equity interest in the (as it was then) Australian Magnesium Investments Pty Ltd consolidated entity.
The foreign currency translation reserve arises as a result of translating overseas subsidiaries from their functional currency to the presentation currency of Australian dollars.
The expired options reserve captures the balance of unexercised options on their expiry date from the appropriate share capital account.
The actuarial reserve represents the cumulative amount of actuarial gains / (losses) on the Group’s unfunded defined benefit pension obligation that needs to be recognised in “Other comprehensive income” (OCI) as well as movements attributable to the market value of derivatives and deferred tax assets where relevant.
(2) The opening balance of the foreign currency translation reserve was increased by $1.1m from the numbers previously reported at 31 December 2015 due to a reclassification from retained earnings. This adjustment related to the period to 31 December 2012 and had no impact on the overall equity balance.
FINANCIAL REPORT
59MAGONTEC LIMITED ANNUAL REPORT 2016
NO T E S T O T HE F IN A NCI A L S TAT EMEN T Scontinued

18. ACCUMULATED LOSSES
31 Dec 2016 $’000
31 Dec 2015 $’000
Balance at beginning of financial year (30,491) (29,398)
Reclass to FCTR (1) – (1,138)
Profit/(Loss) attributable to members of Magontec Limited 620 45
Profit/(Loss) attributable to minority interests – –
(29,871) (30,491)
Accumulated losses attributable to members of Magontec Limited (29,871) (30,491)
Accumulated losses attributable to minority interests – –
Total accumulated losses (29,871) (30,491)
(1) The opening balance of retained earnings was decreased by $1.1m from the numbers previously reported at 31 December 2015 due to a reclassification from the foreign currency translation reserve. This adjustment related to the period to 31 December 2012 and had no impact on the overall equity balance.
19. EARNINGS/(LOSS) PER SHARE
12 months to 31 Dec 2016
cents per share
12 months to 31 Dec 2015
cents per share
Basic earnings/(loss) per share (including Discontinued Operations): 0.055 0.004
Diluted earnings/(loss) per share (including Discontinued Operations): 0.055 0.004
Basic earnings/(loss) per share (excluding Discontinued Operations): 0.055 0.004
Diluted earnings/(loss) per share (excluding Discontinued Operations): 0.055 0.004
MAGONTEC LIMITED ANNUAL REPORT 2016
FINANCIAL REPORT
60
NO T E S T O T HE F IN A NCI A L S TAT EMEN T Scontinued

19. EARNINGS/(LOSS) PER SHARE (CONTINUED)
The earnings and weighted average number of ordinary shares used in the calculation of basic and diluted loss per share are
as follows:
12 months to 31 Dec 2016
$’000
12 months to 31 Dec 2015
$’000
Profit/(Loss) after income tax expense/benefit including discontinued operations
Members of the parent entity 620 45
Profit/(Loss) after income tax expense/benefit from continuing operations
Members of the parent entity 620 45
Weighted average number of ordinary securities on issue (for basic earnings calculation) 1,129,787,358 1,123,121,864
Employee shares LTI subject to shareholder approval 7,864,192 –
Weighted average number of ordinary securities on issue (for diluted earnings calculation) 1,129,808,845 1,123,121,864
20. CONTINGENT LIABILITIES AND CONTINGENT ASSETS
At 31 December 2016 a contingent asset exists in relation to the item describe at point 1(ii) in this Note.
1. Romanian Tax Office Audit of MAR
Note 5 in the half year report at 30 June 2015 referred to an audit by the Romanian tax office of VAT matters at MAR. The audit
was expanded to a full tax audit.
The audit was completed in October 2015 and resulted in two primary adjustments -
(i) a reduction of $181,169 in the Deferred Tax Asset at 31 December 2014; and
(ii) imposition of penalties and interest amounting to $115,012 associated with denial of a VAT input credit.
The effect of both items now reflect in the accounts as at 31 December 2015.
Item (ii) may be recovered in 3 ways -
− under a formal objection lodged;
− under a professional indemnity claim; and
− under Romanian amnesty legislation recently enacted.
FINANCIAL REPORT
61MAGONTEC LIMITED ANNUAL REPORT 2016
NO T E S T O T HE F IN A NCI A L S TAT EMEN T Scontinued

21. CAPITAL AND LEASING COMMITMENTS
a. Operating Lease Arrangements (contractual lease payments to lease expiry the Group is obligated to make)
Nature of Lease
Date of First Lease
Payment
Date of Last Lease
Payment
Frequency of Lease
Payments
Lease Payment
Per Frequency
(AUD)
Current Year
(2016) Lease
Payments
Lease Payments
Due Within 12 Months
(ie year ended 31 Dec
2017)
Lease Payments
Due Beyond
12 Months (ie beyond
31 Dec 2017)
Unexpired Lease
Obligation
MAB company car 5-Jun-15 4-Jun-18 Monthly $1,010 $12,116 $12,116 $6,058 $18,174
MAB company car 1-Jul-16 30-Jun-20 Monthly $647 $3,884 $7,768 $19,419 $27,186
MAB company car 19-Mar-14 18-Mar-17 Monthly $497 $5,959 $5,959 – $5,959
MAB company car 28-Jan-15 27-Jan-19 Monthly $457 $5,488 $5,488 $5,945 $11,434
MAB wheel loader 20-Jun-13 31-Jan-17 Monthly $2,831 $33,966 $2,831 – $2,831
MAB wheel loader 1-May-16 30-Nov-19 Monthly $1,544 $12,350 $18,525 $35,507 $54,033
MAB forklift trucks 1-Jun-15 31-May-20 Monthly $2,046 $24,548 $24,548 $59,323 $83,871
MAB forklift trucks 2-Jul-09 30-Jun-19 Monthly $416 $4,992 $4,992 $7,489 $12,481
MAB forklift trucks 1-Nov-14 31-Oct-19 Monthly $1,118 $13,411 $13,411 $24,587 $37,997
MAB forklift trucks 1-Nov-14 31-Oct-19 Monthly $1,118 $13,411 $13,411 $24,587 $37,997
MAB forklift trucks 1-Jul-14 30-Jun-19 Monthly $1,347 $16,166 $16,166 $24,249 $40,415
MAB external storage
facility (1) 1-Jun-06 Open Monthly $5,114 $61,369 $15,342 – $15,342
MAB Canon copy/scan
systems 29-Jan-16 31-Jan-20 Monthly $403 $4,841 $4,841 $10,085 $14,926
MAR car operating lease 14-May-15 2-Jan-17 Monthly $617 $7,399 $617 – $617
MAR car operating leases 1-Dec-16 1-May-20 Monthly $1,534 $1,534 $18,411 $44,492 $62,903
MAY plant and equipment
lease 1-Jul-12 1-Jun-17 Monthly $24,747 $296,961 $148,481 – $148,481
MGL head office lease 15-Jul-14 15-Jul-18 Monthly $3,431 $40,904 $41,168 $24,015 $65,183
Total $559,299 $354,073 $285,755 $639,828
(1) Able to be cancelled at any time with 3 months notice.
MAB = Magontec GmbH (Bottrop Germany) MGL = Magontec Limited (Sydney head office)
MAY = Magontec Shanxi Company Limited MAR = Magontec SRL (Romania)
31 Dec 2016 $’000
31 Dec 2015 $’000
Non-cancellable operating lease payments
Not longer than 1 year 354 605
Longer than 1 year and not longer than 5 years 286 479
Longer than 5 years – –
Total 639 1,084
MAGONTEC LIMITED ANNUAL REPORT 2016
FINANCIAL REPORT
62
NO T E S T O T HE F IN A NCI A L S TAT EMEN T Scontinued
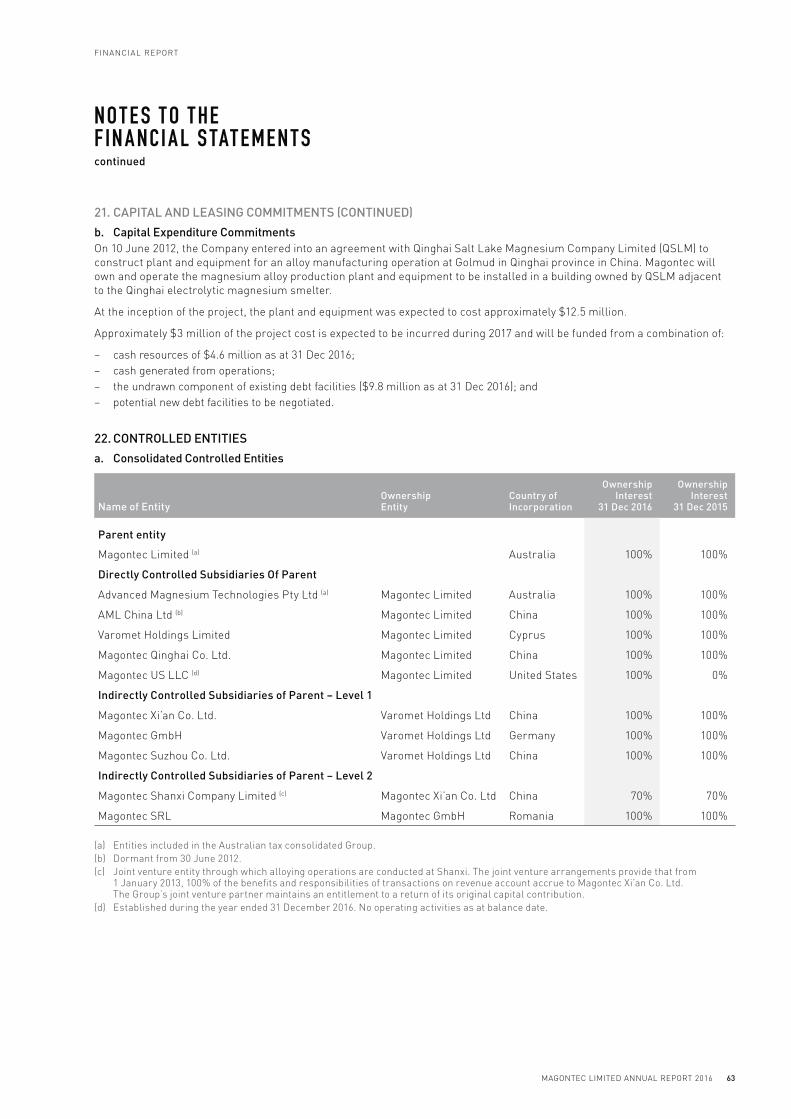
21. CAPITAL AND LEASING COMMITMENTS (CONTINUED)
b. Capital Expenditure Commitments
On 10 June 2012, the Company entered into an agreement with Qinghai Salt Lake Magnesium Company Limited (QSLM) to
construct plant and equipment for an alloy manufacturing operation at Golmud in Qinghai province in China. Magontec will
own and operate the magnesium alloy production plant and equipment to be installed in a building owned by QSLM adjacent
to the Qinghai electrolytic magnesium smelter.
At the inception of the project, the plant and equipment was expected to cost approximately $12.5 million.
Approximately $3 million of the project cost is expected to be incurred during 2017 and will be funded from a combination of:
− cash resources of $4.6 million as at 31 Dec 2016;
− cash generated from operations;
− the undrawn component of existing debt facilities ($9.8 million as at 31 Dec 2016); and
− potential new debt facilities to be negotiated.
22. CONTROLLED ENTITIES
a. Consolidated Controlled Entities
Name of EntityOwnership Entity
Country of Incorporation
Ownership Interest
31 Dec 2016
Ownership Interest
31 Dec 2015
Parent entity
Magontec Limited (a) Australia 100% 100%
Directly Controlled Subsidiaries Of Parent
Advanced Magnesium Technologies Pty Ltd (a) Magontec Limited Australia 100% 100%
AML China Ltd (b) Magontec Limited China 100% 100%
Varomet Holdings Limited Magontec Limited Cyprus 100% 100%
Magontec Qinghai Co. Ltd. Magontec Limited China 100% 100%
Magontec US LLC (d) Magontec Limited United States 100% 0%
Indirectly Controlled Subsidiaries of Parent – Level 1
Magontec Xi’an Co. Ltd. Varomet Holdings Ltd China 100% 100%
Magontec GmbH Varomet Holdings Ltd Germany 100% 100%
Magontec Suzhou Co. Ltd. Varomet Holdings Ltd China 100% 100%
Indirectly Controlled Subsidiaries of Parent – Level 2
Magontec Shanxi Company Limited (c) Magontec Xi’an Co. Ltd China 70% 70%
Magontec SRL Magontec GmbH Romania 100% 100%
(a) Entities included in the Australian tax consolidated Group.
(b) Dormant from 30 June 2012.
(c) Joint venture entity through which alloying operations are conducted at Shanxi. The joint venture arrangements provide that from 1 January 2013, 100% of the benefits and responsibilities of transactions on revenue account accrue to Magontec Xi’an Co. Ltd. The Group’s joint venture partner maintains an entitlement to a return of its original capital contribution.
(d) Established during the year ended 31 December 2016. No operating activities as at balance date.
FINANCIAL REPORT
63MAGONTEC LIMITED ANNUAL REPORT 2016
NO T E S T O T HE F IN A NCI A L S TAT EMEN T Scontinued
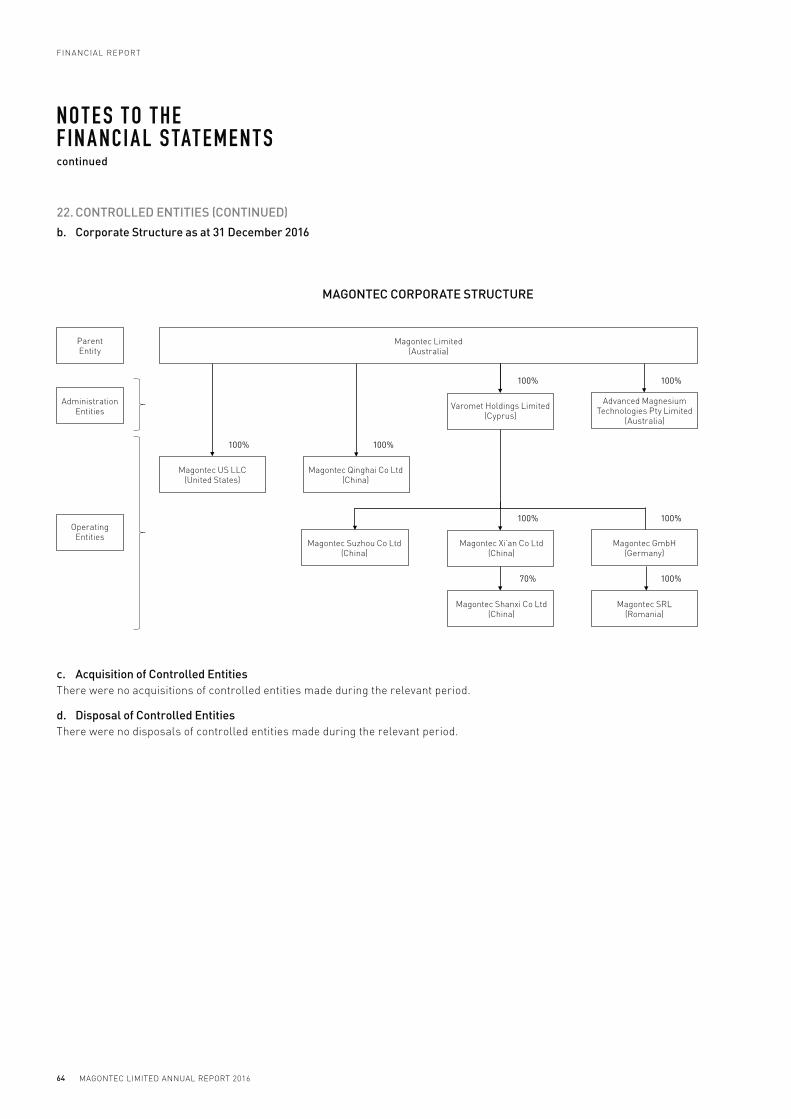
22. CONTROLLED ENTITIES (CONTINUED)
b. Corporate Structure as at 31 December 2016
c. Acquisition of Controlled Entities
There were no acquisitions of controlled entities made during the relevant period.
d. Disposal of Controlled Entities
There were no disposals of controlled entities made during the relevant period.
MAGONTEC CORPORATE STRUCTURE
Parent Entity
Magontec Limited (Australia)
Administration Entities
Magontec US LLC (United States)
100% 100%
100%
100%
70%
100%
100%
100%
Magontec Qinghai Co Ltd (China)
Magontec Suzhou Co Ltd (China)
Magontec Xi’an Co Ltd (China)
Magontec Shanxi Co Ltd (China)
Magontec GmbH (Germany)
Magontec SRL (Romania)
Varomet Holdings Limited (Cyprus)
Advanced Magnesium Technologies Pty Limited
(Australia)
Operating Entities
MAGONTEC LIMITED ANNUAL REPORT 2016
FINANCIAL REPORT
64
NO T E S T O T HE F IN A NCI A L S TAT EMEN T Scontinued

23. SEGMENT INFORMATION
Identification of Reportable Segments
The consolidated entity comprises the entities as described in Note 22.
In respect of the period to 31 December 2016, segment information is presented in respect of the three main departments
within the group.
− ‘Admin Units’ = Magontec administrative entities performing a Head Office function comprising -
Magontec Limited (Australia)
Advanced Magnesium Technologies Pty Limited (Australia)
Varomet Holdings Limited (Cyprus)
− ‘EUR’ = Magontec operating entities in Europe comprising -
Magontec GmbH (Germany)
Magontec SRL (Romania)
Magontec LLC (United States)
− ‘PRC’ = Magontec operating entities in the People’s Republic of China comprising -
Magontec Xi’an Co. Ltd. (China)
Magontec Shanxi Co. Ltd. (China)
Magontec Suzhou Co. Ltd. (China)
Magontec Qinghai Co. Ltd. (China)
Types of Products and Services
The principal operating activities comprise:
− Magnesium alloy production
− Magnesium alloy recycling
− Manufacture of cathodic corrosion protection products
Accounting Policies and Inter-segment Transactions
The accounting policies used by the Group in reporting segments internally are the same as those contained in Note 1 to
the accounts. Magontec GmbH (Bottrop, Germany) is the entity through which alloy production at Magontec Xi’an Co Limited
(Xi’an, PRC) and Magontec Shanxi Company Limited (Shanxi, PRC) destined for Europe is sold.
The segment data below on page 66 is presented net of intergroup transactions (other than sales).
FINANCIAL REPORT
65MAGONTEC LIMITED ANNUAL REPORT 2016
NO T E S T O T HE F IN A NCI A L S TAT EMEN T Scontinued
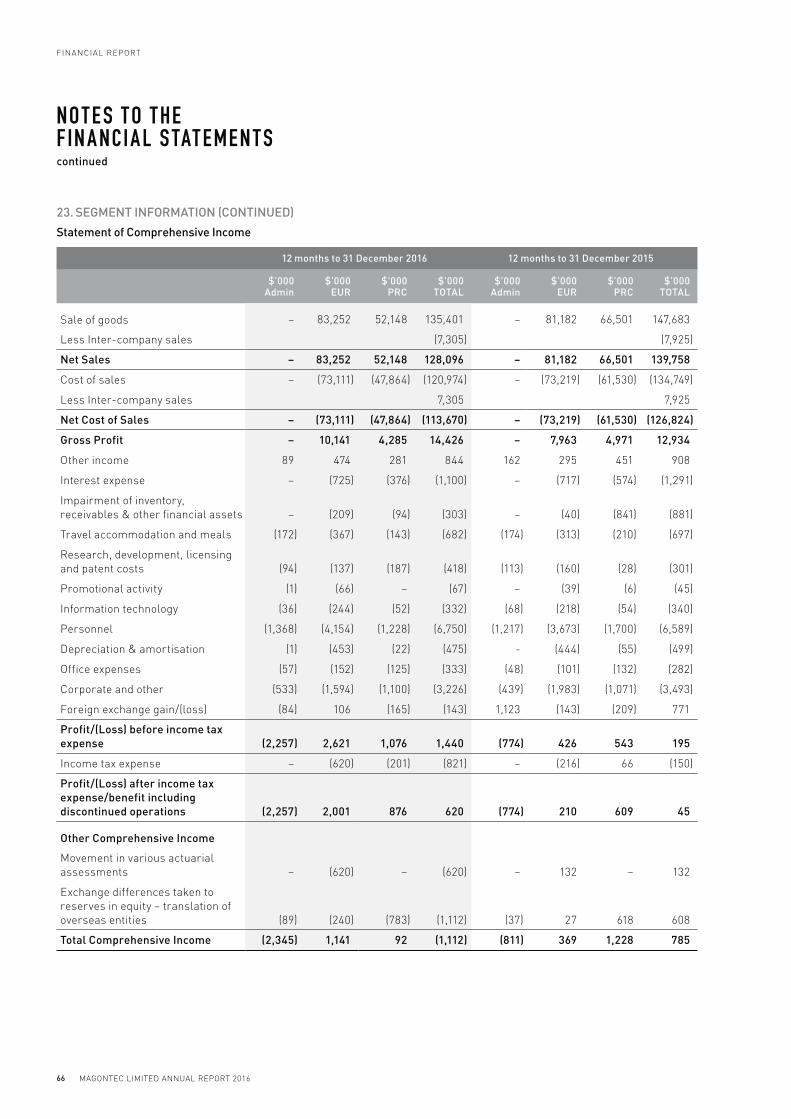
23. SEGMENT INFORMATION (CONTINUED)
Statement of Comprehensive Income
12 months to 31 December 2016 12 months to 31 December 2015
$’000 Admin
$’000 EUR
$’000 PRC
$’000 TOTAL
$’000 Admin
$’000 EUR
$’000 PRC
$’000 TOTAL
Sale of goods – 83,252 52,148 135,401 – 81,182 66,501 147,683
Less Inter-company sales (7,305) (7,925)
Net Sales – 83,252 52,148 128,096 – 81,182 66,501 139,758
Cost of sales – (73,111) (47,864) (120,974) – (73,219) (61,530) (134,749)
Less Inter-company sales 7,305 7,925
Net Cost of Sales – (73,111) (47,864) (113,670) – (73,219) (61,530) (126,824)
Gross Profit – 10,141 4,285 14,426 – 7,963 4,971 12,934
Other income 89 474 281 844 162 295 451 908
Interest expense – (725) (376) (1,100) – (717) (574) (1,291)
Impairment of inventory,
receivables & other financial assets – (209) (94) (303) – (40) (841) (881)
Travel accommodation and meals (172) (367) (143) (682) (174) (313) (210) (697)
Research, development, licensing
and patent costs (94) (137) (187) (418) (113) (160) (28) (301)
Promotional activity (1) (66) – (67) – (39) (6) (45)
Information technology (36) (244) (52) (332) (68) (218) (54) (340)
Personnel (1,368) (4,154) (1,228) (6,750) (1,217) (3,673) (1,700) (6,589)
Depreciation & amortisation (1) (453) (22) (475) - (444) (55) (499)
Office expenses (57) (152) (125) (333) (48) (101) (132) (282)
Corporate and other (533) (1,594) (1,100) (3,226) (439) (1,983) (1,071) (3,493)
Foreign exchange gain/(loss) (84) 106 (165) (143) 1,123 (143) (209) 771
Profit/(Loss) before income tax
expense (2,257) 2,621 1,076 1,440 (774) 426 543 195
Income tax expense – (620) (201) (821) – (216) 66 (150)
Profit/(Loss) after income tax
expense/benefit including
discontinued operations (2,257) 2,001 876 620 (774) 210 609 45
Other Comprehensive Income
Movement in various actuarial
assessments – (620) – (620) – 132 – 132
Exchange differences taken to
reserves in equity – translation of
overseas entities (89) (240) (783) (1,112) (37) 27 618 608
Total Comprehensive Income (2,345) 1,141 92 (1,112) (811) 369 1,228 785
MAGONTEC LIMITED ANNUAL REPORT 2016
FINANCIAL REPORT
66
NO T E S T O T HE F IN A NCI A L S TAT EMEN T Scontinued

23. SEGMENT INFORMATION (CONTINUED)
31 Dec 2016
$’000 Admin
31 Dec 2016
$’000 EUR
31 Dec 2016
$’000 PRC
31 Dec 2016
$’000 TOTAL
31 Dec 2015
$’000 Admin
31 Dec 2015
$’000 EUR
31 Dec 2015
$’000 PRC
31 Dec 2015
$’000 TOTAL
Segment Assets
Gross Segment assets 56,998 41,929 35,006 133,933 58,174 42,594 40,216 140,984
Eliminations
– Inter-Coy Loans (40,135) (1,743) (4,082) (45,959) (39,934) (1,371) (3,202) (44,506)
– Investment in subsidiaries (15,392) – – (15,392) (15,392) – – (15,392)
– Other 2,715 6 (227) 2,494 1,461 198 (216) 1,442
As per Consolidated Balance Sheet 4,187 40,192 30,698 75,077 4,309 41,421 36,798 82,528
Segment Liabilities
Gross Segment liabilities 29,065 37,057 20,855 86,976 27,480 38,990 25,368 91,838
Eliminations – – – – – – – –
– Inter-Coy Loans (28,894) (7,268) (9,756) (45,918) (27,258) (7,762) (9,528) (44,548)
– Other 102 – (458) (355) – – 78 78
As per Consolidated Balance Sheet 274 29,788 10,641 40,703 222 31,228 15,917 47,367
Segment Disclosures
– Acquisition of segment fixed
assets – 508 2,802 3,311 – 1,206 2,886 4,092
– Non-cash share based payments
expense 325 – – 325 174 – – 174
Provisioning
– Inventory Increase/(Decrease) – (19) – (19) – (14) – (14)
– Doubtful debts Increase/
(Decrease) – (252) 522 270 – (3) (80) (83)
24. RELATED PARTY DISCLOSURES
a. Equity Interests in Related Parties
Equity interest in subsidiaries
Details of the percentage of ordinary shares held in subsidiaries are disclosed in Note 22 to the financial statements.
b. Transactions with Key Management Personnel
Details of key management personnel compensation are disclosed in Note 4 to the financial statements and in the
Remuneration Report.
c. Group Entity
The parent entity is Magontec Limited. Members of the group are set out in Note 22. Transactions during the financial year
between group entities included:
− Investment in controlled entities;
− Repayment of interest free funds from controlled entities to the parent entity; and
− Incurring expenditure on behalf of other entities for office rental and related costs, travel costs, seconded employees and
other sundry costs.
The entity is fully reimbursed for these costs on an actual cost basis.
FINANCIAL REPORT
67MAGONTEC LIMITED ANNUAL REPORT 2016
NO T E S T O T HE F IN A NCI A L S TAT EMEN T Scontinued

25. FINANCIAL INSTRUMENTS
a. Capital Risk Management
The Group manages its capital to ensure that entities in the Group will be able to continue as a going concern while
maximising the potential future return to stakeholders through the development and marketing of the Group’s technologies
and its production facilities.
The capital structure of the Group consists of cash and cash equivalents, equity attributable to equity holders of the parent,
comprising issued capital, reserves and accumulated losses as disclosed in Note 16, Note 17 and Note 18 respectively and
debt funding provided by Chinese and European banks (Note 13).
The group’s main financial risk management issues are:
− ensuring the integrity of debtors;
− planning for production capacity expansion in China; and
− continued availability of debt funding.
The Group operates globally, primarily through subsidiary companies established in the markets in which the Group trades.
None of the Group’s entities are subject to externally imposed capital requirements.
b. Financial Risk Management Objectives
The magnesium alloy industry operates with a disparity of trade terms on the purchase of production inputs (generally
not better than 15 days) and the sale of output (up to 120 days). The Group’s senior management effort is aimed at firstly,
arranging funding for working capital and secondly, negotiating with purchasers and buyers the best available terms.
The Group’s senior management team co-ordinates access to domestic and international financial markets and monitors
and manages the financial risks relating to the operations of the Group in line with the Group’s policies. These risks include
market risk (including currency risk, fair value interest rate risk and price risk), credit risk, liquidity risk and cash flow
interest rate risk.
The consolidated entity does not enter into or trade financial instruments, including derivative financial instruments,
for speculative purposes.
c. Significant Accounting Policies
Details of the significant accounting policies and methods adopted, including the criteria for recognition, the basis of
measurement and the basis on which income and expenses are recognised, in respect of each class of financial asset,
financial liability and equity instrument are disclosed in Note 1 to the financial statements.
d. Categories and Maturity Profile of Financial Instruments and Interest Rate Risk
The following table details the consolidated entity’s exposure to interest rate risk as at 31 December 2016.
31 December 2016 Notes
Weighted average
effective interest
rate %
Variable interest
rate $’000
Fixed interest
rate $’000
Non- interest bearing
$’000Total
$’000
Financial assets:
Cash and cash equivalents 0.26% 4,593 – – 4,593
Trade & other receivables (net of provision for loss) – – – 21,956 21,956
Other – – – 227 227
4,593 – 22,183 26,776
Financial liabilities:
Trade & other payables – – – 13,672 13,672
Current Bank Borrowings 13 3.05% 15,530 – – 15,530
Bank accepted bills issued to suppliers 13 – – – – –
Current Owing to Straits Mine Management Pty Ltd 13 – – – – –
Non-current Bank Borrowings 13 – – – – –
15,530 – 13,672 29,202
MAGONTEC LIMITED ANNUAL REPORT 2016
FINANCIAL REPORT
68
NO T E S T O T HE F IN A NCI A L S TAT EMEN T Scontinued
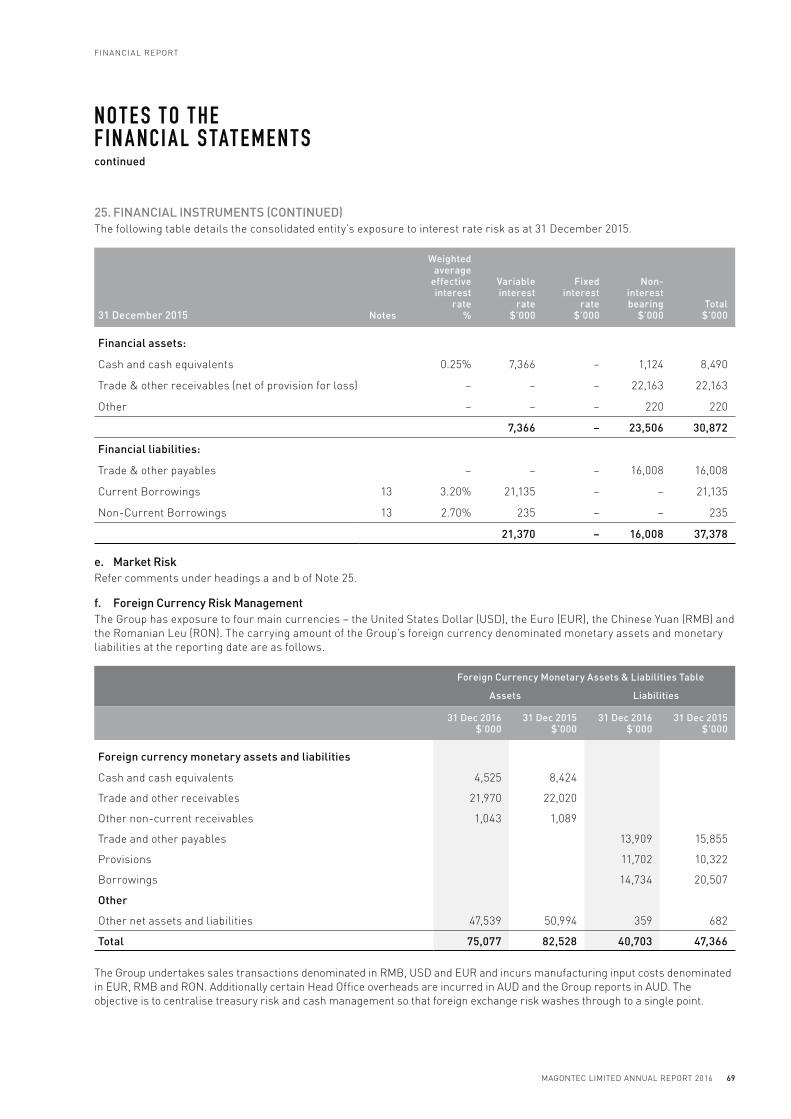
25. FINANCIAL INSTRUMENTS (CONTINUED)
The following table details the consolidated entity’s exposure to interest rate risk as at 31 December 2015.
31 December 2015 Notes
Weighted average
effective interest
rate %
Variable interest
rate $’000
Fixed interest
rate $’000
Non-interest bearing
$’000Total
$’000
Financial assets:
Cash and cash equivalents 0.25% 7,366 – 1,124 8,490
Trade & other receivables (net of provision for loss) – – – 22,163 22,163
Other – – – 220 220
7,366 – 23,506 30,872
Financial liabilities:
Trade & other payables – – – 16,008 16,008
Current Borrowings 13 3.20% 21,135 – – 21,135
Non-Current Borrowings 13 2.70% 235 – – 235
21,370 – 16,008 37,378
e. Market Risk
Refer comments under headings a and b of Note 25.
f. Foreign Currency Risk Management
The Group has exposure to four main currencies – the United States Dollar (USD), the Euro (EUR), the Chinese Yuan (RMB) and
the Romanian Leu (RON). The carrying amount of the Group’s foreign currency denominated monetary assets and monetary
liabilities at the reporting date are as follows.
Foreign Currency Monetary Assets & Liabilities Table
Assets Liabilities
31 Dec 2016 $’000
31 Dec 2015 $’000
31 Dec 2016 $’000
31 Dec 2015 $’000
Foreign currency monetary assets and liabilities
Cash and cash equivalents 4,525 8,424
Trade and other receivables 21,970 22,020
Other non-current receivables 1,043 1,089
Trade and other payables 13,909 15,855
Provisions 11,702 10,322
Borrowings 14,734 20,507
Other
Other net assets and liabilities 47,539 50,994 359 682
Total 75,077 82,528 40,703 47,366
The Group undertakes sales transactions denominated in RMB, USD and EUR and incurs manufacturing input costs denominated
in EUR, RMB and RON. Additionally certain Head Office overheads are incurred in AUD and the Group reports in AUD. The
objective is to centralise treasury risk and cash management so that foreign exchange risk washes through to a single point.
FINANCIAL REPORT
69MAGONTEC LIMITED ANNUAL REPORT 2016
NO T E S T O T HE F IN A NCI A L S TAT EMEN T Scontinued
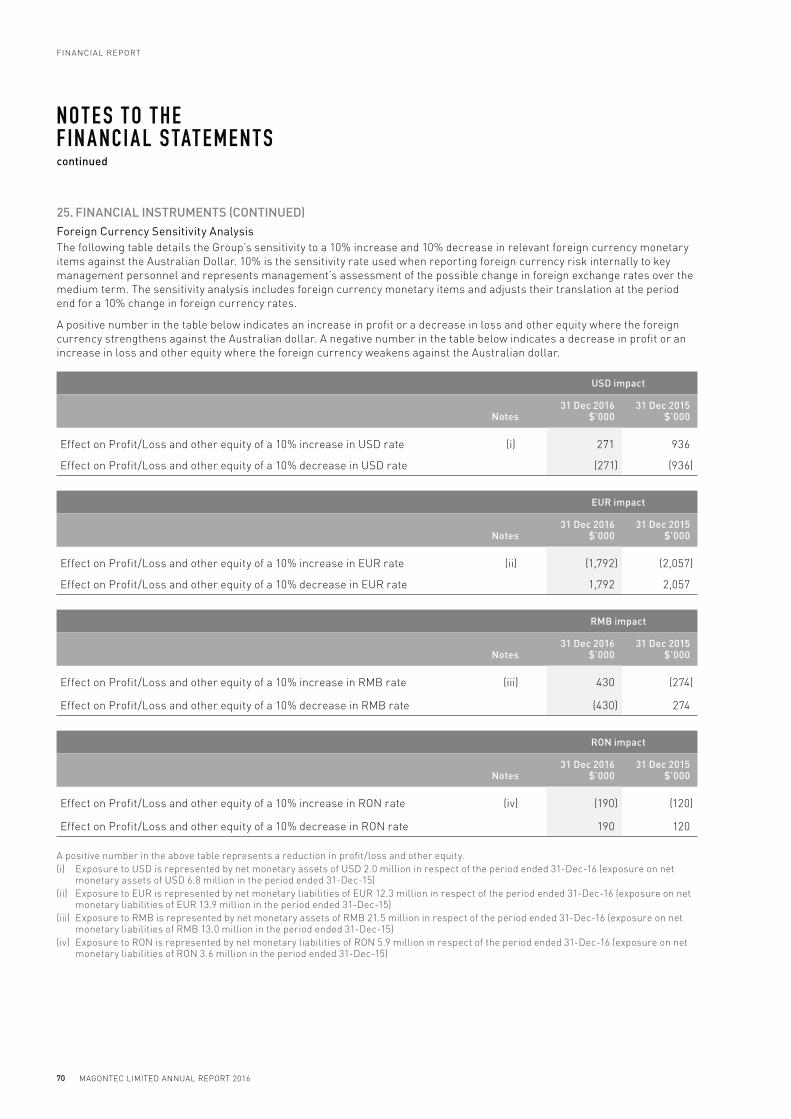
25. FINANCIAL INSTRUMENTS (CONTINUED)
Foreign Currency Sensitivity Analysis
The following table details the Group’s sensitivity to a 10% increase and 10% decrease in relevant foreign currency monetary
items against the Australian Dollar. 10% is the sensitivity rate used when reporting foreign currency risk internally to key
management personnel and represents management’s assessment of the possible change in foreign exchange rates over the
medium term. The sensitivity analysis includes foreign currency monetary items and adjusts their translation at the period
end for a 10% change in foreign currency rates.
A positive number in the table below indicates an increase in profit or a decrease in loss and other equity where the foreign
currency strengthens against the Australian dollar. A negative number in the table below indicates a decrease in profit or an
increase in loss and other equity where the foreign currency weakens against the Australian dollar.
USD impact
Notes31 Dec 2016
$’00031 Dec 2015
$’000
Effect on Profit/Loss and other equity of a 10% increase in USD rate (i) 271 936
Effect on Profit/Loss and other equity of a 10% decrease in USD rate (271) (936)
EUR impact
Notes31 Dec 2016
$’00031 Dec 2015
$’000
Effect on Profit/Loss and other equity of a 10% increase in EUR rate (ii) (1,792) (2,057)
Effect on Profit/Loss and other equity of a 10% decrease in EUR rate 1,792 2,057
RMB impact
Notes31 Dec 2016
$’00031 Dec 2015
$’000
Effect on Profit/Loss and other equity of a 10% increase in RMB rate (iii) 430 (274)
Effect on Profit/Loss and other equity of a 10% decrease in RMB rate (430) 274
RON impact
Notes31 Dec 2016
$’00031 Dec 2015
$’000
Effect on Profit/Loss and other equity of a 10% increase in RON rate (iv) (190) (120)
Effect on Profit/Loss and other equity of a 10% decrease in RON rate 190 120
A positive number in the above table represents a reduction in profit/loss and other equity.
(i) Exposure to USD is represented by net monetary assets of USD 2.0 million in respect of the period ended 31-Dec-16 (exposure on net monetary assets of USD 6.8 million in the period ended 31-Dec-15)
(ii) Exposure to EUR is represented by net monetary liabilities of EUR 12.3 million in respect of the period ended 31-Dec-16 (exposure on net monetary liabilities of EUR 13.9 million in the period ended 31-Dec-15)
(iii) Exposure to RMB is represented by net monetary assets of RMB 21.5 million in respect of the period ended 31-Dec-16 (exposure on net monetary liabilities of RMB 13.0 million in the period ended 31-Dec-15)
(iv) Exposure to RON is represented by net monetary liabilities of RON 5.9 million in respect of the period ended 31-Dec-16 (exposure on net monetary liabilities of RON 3.6 million in the period ended 31-Dec-15)
MAGONTEC LIMITED ANNUAL REPORT 2016
FINANCIAL REPORT
70
NO T E S T O T HE F IN A NCI A L S TAT EMEN T Scontinued
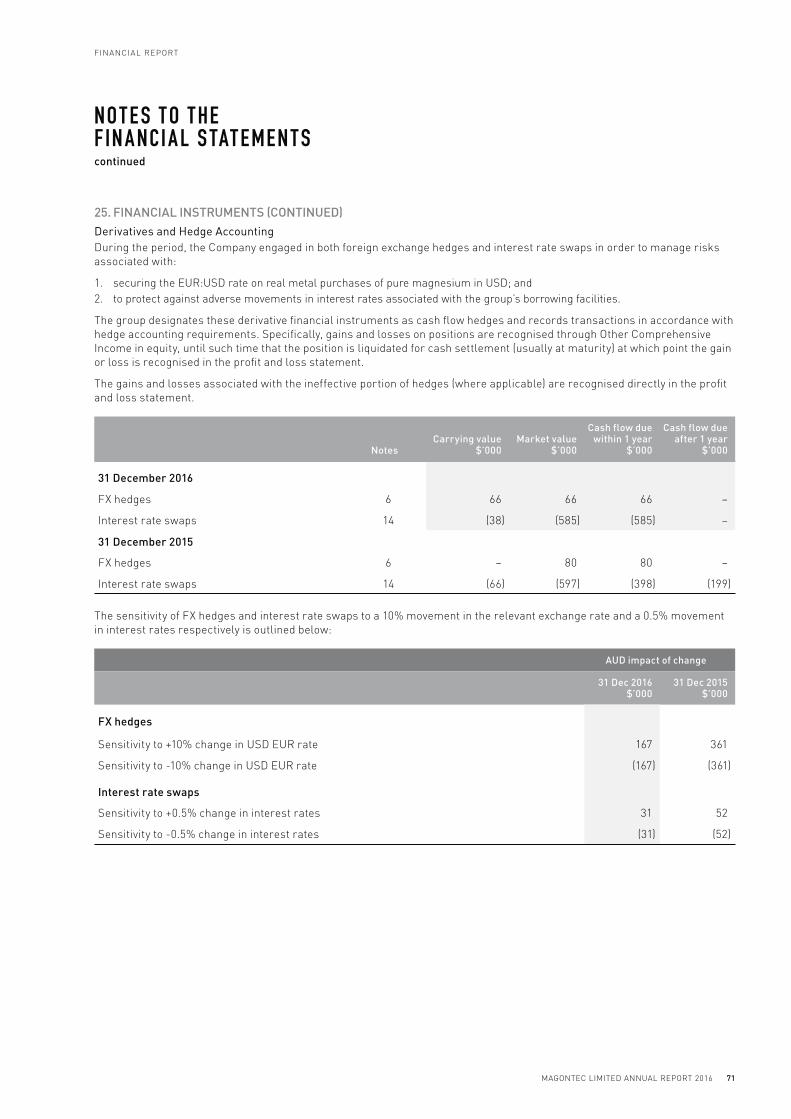
25. FINANCIAL INSTRUMENTS (CONTINUED)
Derivatives and Hedge Accounting
During the period, the Company engaged in both foreign exchange hedges and interest rate swaps in order to manage risks
associated with:
1. securing the EUR:USD rate on real metal purchases of pure magnesium in USD; and
2. to protect against adverse movements in interest rates associated with the group’s borrowing facilities.
The group designates these derivative financial instruments as cash flow hedges and records transactions in accordance with
hedge accounting requirements. Specifically, gains and losses on positions are recognised through Other Comprehensive
Income in equity, until such time that the position is liquidated for cash settlement (usually at maturity) at which point the gain
or loss is recognised in the profit and loss statement.
The gains and losses associated with the ineffective portion of hedges (where applicable) are recognised directly in the profit
and loss statement.
NotesCarrying value
$’000Market value
$’000
Cash flow due within 1 year
$’000
Cash flow due after 1 year
$’000
31 December 2016
FX hedges 6 66 66 66 –
Interest rate swaps 14 (38) (585) (585) –
31 December 2015
FX hedges 6 – 80 80 –
Interest rate swaps 14 (66) (597) (398) (199)
The sensitivity of FX hedges and interest rate swaps to a 10% movement in the relevant exchange rate and a 0.5% movement
in interest rates respectively is outlined below:
AUD impact of change
31 Dec 2016 $’000
31 Dec 2015 $’000
FX hedges
Sensitivity to +10% change in USD EUR rate 167 361
Sensitivity to -10% change in USD EUR rate (167) (361)
Interest rate swaps
Sensitivity to +0.5% change in interest rates 31 52
Sensitivity to -0.5% change in interest rates (31) (52)
FINANCIAL REPORT
71MAGONTEC LIMITED ANNUAL REPORT 2016
NO T E S T O T HE F IN A NCI A L S TAT EMEN T Scontinued
25. FINANCIAL INSTRUMENTS (CONTINUED)
g. Capital Management and Interest Rate Risk Management
The Group has bank loans outstanding of $6.9 million (refer Note 13) owing to Commerzbank globally. As at 31 December 2016
the Group was in breach of its minimum net tangible worth ratio covenant. Management remains confident that Commerzbank
will continue offering its facilities to the amount of EUR12.0 million (A$17.8 million) for the reasons outlined in Note 13.
However, the breach means all Commerzbank debt is required to be classified as current and may also result in an increase
in the interest rate applying to the debt.
h. Credit Risk Management
Credit risk refers to the risk that a counterparty will default on its contractual obligations resulting in financial loss to the
Group. The Group has adopted a policy of as far as possible dealing with creditworthy counterparties – an ideal not always
possible in a product development environment. The use of collateral or other contributions can act as a means of mitigating
the risk of financial loss from defaults. Credit exposure is controlled by limits that are continually reviewed.
The Group’s alloy sales to European customers are, for the most part, centralised through Magontec GmbH in Bottrop
Germany. Magontec GmbH has insurance cover in place to cover its exposure to debtors secured under the Commerzbank
facility. The insured percentage cover for ‘named’ debtors is 90% and for ‘unnamed’ debtors is 80% but with individual claims
in respect of ‘unnamed’ debtors limited to EUR 10,000.
The carrying amount of financial assets recorded in the financial statements, net of any allowances for losses, represents
the Group’s maximum exposure to credit risk without taking account of the value of any collateral obtained.
i. Liquidity Risk Management
The consolidated entity manages liquidity risk by maintaining adequate cash reserves and banking facilities by continuously
monitoring forecast and actual cash flows and matching the maturity profiles of financial assets and liabilities.
j. Fair Value of Financial Instruments
The directors consider that the carrying amounts of financial assets and financial liabilities recorded at amortised cost
in the financial statements approximate their fair values.
MAGONTEC LIMITED ANNUAL REPORT 2016
FINANCIAL REPORT
72
NO T E S T O T HE F IN A NCI A L S TAT EMEN T Scontinued
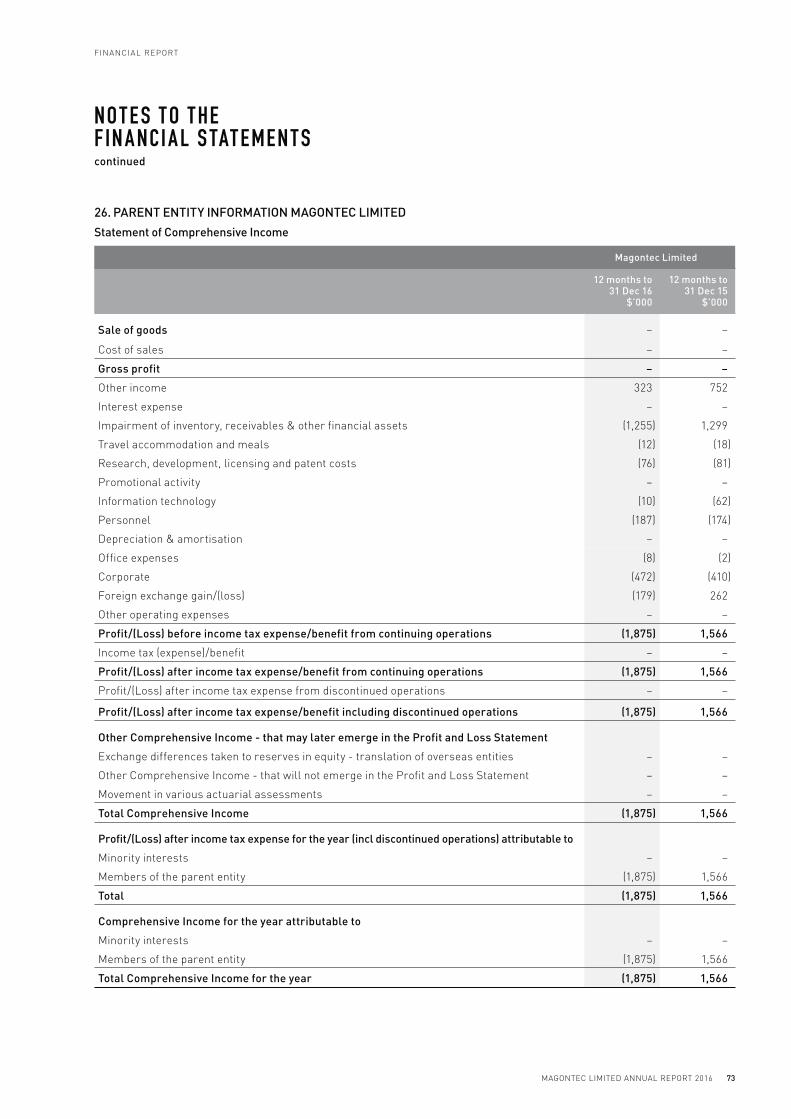
26. PARENT ENTITY INFORMATION MAGONTEC LIMITED
Statement of Comprehensive Income
Magontec Limited
12 months to 31 Dec 16
$’000
12 months to 31 Dec 15
$’000
Sale of goods – –
Cost of sales – –
Gross profit – –
Other income 323 752
Interest expense – –
Impairment of inventory, receivables & other financial assets (1,255) 1,299
Travel accommodation and meals (12) (18)
Research, development, licensing and patent costs (76) (81)
Promotional activity – –
Information technology (10) (62)
Personnel (187) (174)
Depreciation & amortisation – –
Office expenses (8) (2)
Corporate (472) (410)
Foreign exchange gain/(loss) (179) 262
Other operating expenses – –
Profit/(Loss) before income tax expense/benefit from continuing operations (1,875) 1,566
Income tax (expense)/benefit – –
Profit/(Loss) after income tax expense/benefit from continuing operations (1,875) 1,566
Profit/(Loss) after income tax expense from discontinued operations – –
Profit/(Loss) after income tax expense/benefit including discontinued operations (1,875) 1,566
Other Comprehensive Income - that may later emerge in the Profit and Loss Statement
Exchange differences taken to reserves in equity - translation of overseas entities – –
Other Comprehensive Income - that will not emerge in the Profit and Loss Statement – –
Movement in various actuarial assessments – –
Total Comprehensive Income (1,875) 1,566
Profit/(Loss) after income tax expense for the year (incl discontinued operations) attributable to
Minority interests – –
Members of the parent entity (1,875) 1,566
Total (1,875) 1,566
Comprehensive Income for the year attributable to
Minority interests – –
Members of the parent entity (1,875) 1,566
Total Comprehensive Income for the year (1,875) 1,566
FINANCIAL REPORT
73MAGONTEC LIMITED ANNUAL REPORT 2016
NO T E S T O T HE F IN A NCI A L S TAT EMEN T Scontinued

26. PARENT ENTITY INFORMATION MAGONTEC LIMITED (CONTINUED)
Balance Sheet
Magontec Limited
31 Dec 16 $’000
31 Dec 15 $’000
Cash and cash equivalents 1,241 1,168
Trade & other receivables 56 91
Other 77 94
Total current assets 1,374 1,353
Non-current assets
Intercompany loan receivables (net of provisioning) 17,190 18,430
Investment in shares of subsidiaries (net of provisioning) 11,718 11,718
Total non-current assets 28,907 30,148
Total assets 30,282 31,501
Current liabilities
Trade & other payables 47 95
Provisions – (38)
Total current liabilities 47 57
Non-current liabilities
Intercompany loan payables 4,768 4,285
Total non-current liabilities 4,768 4,285
Total liabilities 4,815 4,342
Net assets 25,467 27,159
Equity attributable to members of MGL
Share capital 58,616 58,433
Reserves 1,637 1,637
Accumulated losses (34,786) (32,911)
Equity attributable to minority interests
Share capital – –
Reserves – –
Accumulated losses – –
Total equity 25,467 27,159
MAGONTEC LIMITED ANNUAL REPORT 2016
FINANCIAL REPORT
74
NO T E S T O T HE F IN A NCI A L S TAT EMEN T Scontinued

26. PARENT ENTITY INFORMATION MAGONTEC LIMITED (CONTINUED)
Contingent Liabilities
The parent entity had no contingent liabilities as at 31 December 2016.
Capital Commitments - Property, Plant and Equipment
The parent entity had no capital commitments for property, plant and equipment as at 31 December 2016.
Significant Accounting Policies
The accounting policies of the parent entity are consistent with those of the consolidated entity, as disclosed in Note 1.
27. SUBSEQUENT EVENTS
To the best of the Company’s knowledge there have been no other material subsequent events that require disclosure.
28. ADDITIONAL COMPANY INFORMATION
Magontec Limited (MGL) is a listed public company and is incorporated in Australia. The Group operates globally including
subsidiaries in Australia, Europe and China.
Registered Office and Principal Place of Business
Suite 1.03
46A Macleay St
Potts Point, NSW 2011
Tel: 61 2 8005 4109
Fax: 61 2 9252 8960
The Directors declare as follows:
a. in the Directors’ opinion, there are reasonable grounds to believe that the Group will be able to pay its debts as and when they
become due and payable;
b. in the Directors’ opinion, the financial statements and notes thereto set out on pages 34 to 75 of this Annual Report, are in
accordance with the Corporations Act 2001, including:
i. section 296 of the Corporations Act 2001 so that they are in compliance with accounting standards; and
ii. section 297 of the Corporations Act 2001 so that they give a true and fair view of the financial position of the Company;
c. the Directors have been given the declarations required by s.295A of the Corporations Act 2001.
Signed in accordance with a resolution of the Directors made pursuant to s.295 of the Corporations Act 2001.
On behalf of the Board of Directors
Mr N Andrews Mr R Shaw
Executive Chairman Non-Executive Director
23 February 2017
DIREC T ORS’ DECL A R AT ION
FINANCIAL REPORT
75MAGONTEC LIMITED ANNUAL REPORT 2016
NO T E S T O T HE F IN A NCI A L S TAT EMEN T Scontinued

INDEPENDEN T AUDI T OR’S REPOR T
MAGONTEC LIMITED ANNUAL REPORT 2016
FINANCIAL REPORT
76
FINANCIAL REPORT
77MAGONTEC LIMITED ANNUAL REPORT 2016
INDEPENDEN T AUDI T OR’S REPOR Tcontinued
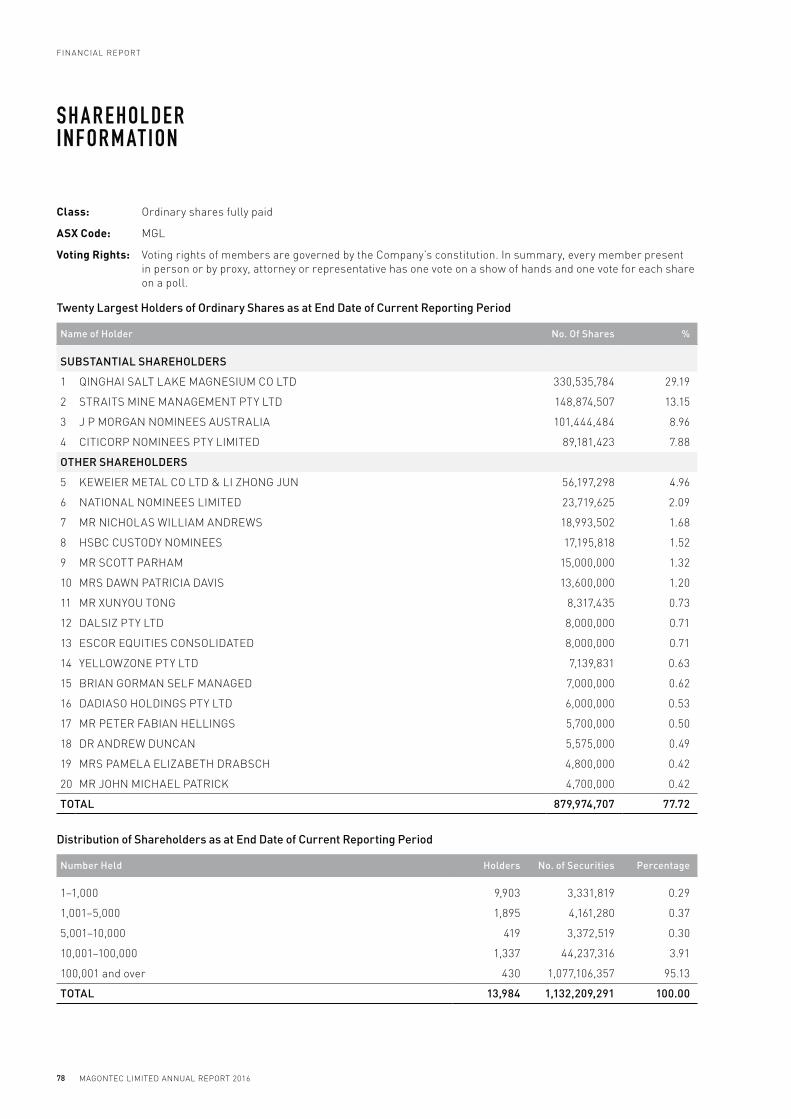
MAGONTEC LIMITED ANNUAL REPORT 2016
FINANCIAL REPORT
78
Class: Ordinary shares fully paid
ASX Code: MGL
Voting Rights: Voting rights of members are governed by the Company’s constitution. In summary, every member present
in person or by proxy, attorney or representative has one vote on a show of hands and one vote for each share
on a poll.
Twenty Largest Holders of Ordinary Shares as at End Date of Current Reporting Period
Name of Holder No. Of Shares %
SUBSTANTIAL SHAREHOLDERS
1 QINGHAI SALT LAKE MAGNESIUM CO LTD 330,535,784 29.19
2 STRAITS MINE MANAGEMENT PTY LTD 148,874,507 13.15
3 J P MORGAN NOMINEES AUSTRALIA 101,444,484 8.96
4 CITICORP NOMINEES PTY LIMITED 89,181,423 7.88
OTHER SHAREHOLDERS
5 KEWEIER METAL CO LTD & LI ZHONG JUN 56,197,298 4.96
6 NATIONAL NOMINEES LIMITED 23,719,625 2.09
7 MR NICHOLAS WILLIAM ANDREWS 18,993,502 1.68
8 HSBC CUSTODY NOMINEES 17,195,818 1.52
9 MR SCOTT PARHAM 15,000,000 1.32
10 MRS DAWN PATRICIA DAVIS 13,600,000 1.20
11 MR XUNYOU TONG 8,317,435 0.73
12 DALSIZ PTY LTD 8,000,000 0.71
13 ESCOR EQUITIES CONSOLIDATED 8,000,000 0.71
14 YELLOWZONE PTY LTD 7,139,831 0.63
15 BRIAN GORMAN SELF MANAGED 7,000,000 0.62
16 DADIASO HOLDINGS PTY LTD 6,000,000 0.53
17 MR PETER FABIAN HELLINGS 5,700,000 0.50
18 DR ANDREW DUNCAN 5,575,000 0.49
19 MRS PAMELA ELIZABETH DRABSCH 4,800,000 0.42
20 MR JOHN MICHAEL PATRICK 4,700,000 0.42
TOTAL 879,974,707 77.72
Distribution of Shareholders as at End Date of Current Reporting Period
Number Held Holders No. of Securities Percentage
1–1,000 9,903 3,331,819 0.29
1,001–5,000 1,895 4,161,280 0.37
5,001–10,000 419 3,372,519 0.30
10,001–100,000 1,337 44,237,316 3.91
100,001 and over 430 1,077,106,357 95.13
TOTAL 13,984 1,132,209,291 100.00
SH A R EHOLDER INFORM AT ION
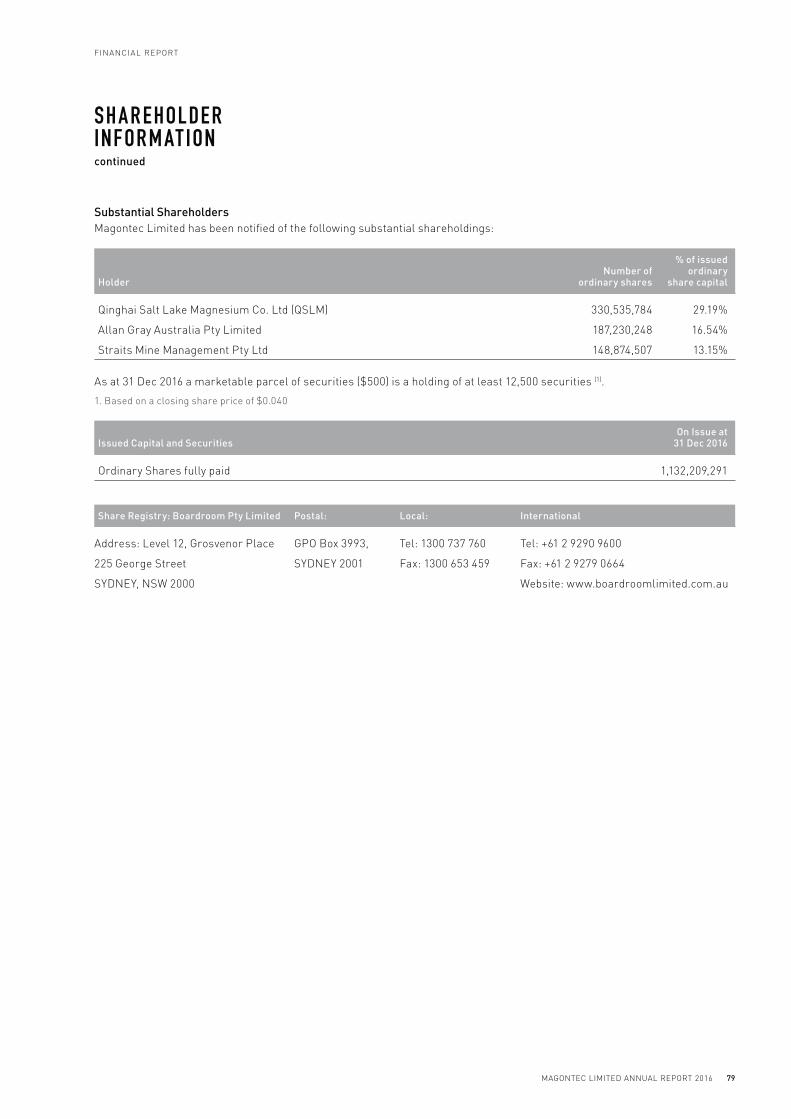
FINANCIAL REPORT
79MAGONTEC LIMITED ANNUAL REPORT 2016
Substantial Shareholders
Magontec Limited has been notified of the following substantial shareholdings:
HolderNumber of
ordinary shares
% of issued ordinary
share capital
Qinghai Salt Lake Magnesium Co. Ltd (QSLM) 330,535,784 29.19%
Allan Gray Australia Pty Limited 187,230,248 16.54%
Straits Mine Management Pty Ltd 148,874,507 13.15%
As at 31 Dec 2016 a marketable parcel of securities ($500) is a holding of at least 12,500 securities (1).
1. Based on a closing share price of $0.040
Issued Capital and SecuritiesOn Issue at
31 Dec 2016
Ordinary Shares fully paid 1,132,209,291
Share Registry: Boardroom Pty Limited Postal: Local: International
Address: Level 12, Grosvenor Place GPO Box 3993, Tel: 1300 737 760 Tel: +61 2 9290 9600
225 George Street SYDNEY 2001 Fax: 1300 653 459 Fax: +61 2 9279 0664
SYDNEY, NSW 2000 Website: www.boardroomlimited.com.au
SH A R EHOLDER INFORM AT IONcontinued

Suite 1.03 | 46A Macleay Street | Potts Point | 2011 NSW Australia
T. +61 2 8005 4109 | www.magontec.com


