Download - Lopez, S. Air Quality Assessment. 2010

8/7/2019 Lopez, S. Air Quality Assessment. 2010
http://slidepdf.com/reader/full/lopez-s-air-quality-assessment-2010 1/6
e- PRESERVATIONScience
published by M O R A N A RTD d.o.o.
Susana Lopez-Aparicio*, Terje Grøntoft, Elin Dahlin
AIR QUALITY ASSESSMENT IN CULTURAL
HERITAGE INSTITUTIONS USING EWO
DOSIMETERSFULL PAPER
This paper is based on a presentation at
the 9th Indoor Air Quality meeting (IAQ)
in Chalon-sur-Saône, France, 21-23
April 2010.
Guest editor:
Dr. Christian Degrigny.
NILU – Norwegian Institute for Air
Research, Instituttveien 18, Kjeller N-
2027, Norway
corresponding author:
received: 22.04.2010
accepted: 24.07.2010
key words:Cultural heritage, dosimetry, photo-oxi-
dizing effects, indoor environment, out-
door pollutants
e-PS, 2010, 7, 96-101
ISSN: 1581-9280 web edition
ISSN: 1854-3928 print edition
www.Morana-rtd.com
© by M O R A N A RTD d.o.o.
96
Since its development, the Early Warning dosimeter for
Organic materials (EWO dosimeter) has been used as both
a research and general measurement tool for the evaluation
of indoor air quality for preservation of cultural heritage
artefacts. The EWO dosimeter measures the integrated
degradation impact of the environment, comparable to that
observed on organic materials due to the synergistic
effects of gases (NO2 and O3) and climate (temperature /
RH, UV-light).
Measurements of impacts of air pollution on EWO dosime-ters were performed in different cultural heritage locations
as part of EU projects, other types of international projects
and as a service to individual institutions. In this study, the
indoor air quality in different microenvironments or loca-
tions is assessed based on the results obtained by EWO
dosimetry. Correlation between the type of location and the
dosimeter results has been observed. Indoor locations in
highly polluted cities showed higher dosimeter response
than more rural locations probably due to more infiltration
of outdoor generated pollutants such as NO2 and O3. In con-
trast, measurements performed inside enclosures (e.g.
showcases / microclimate frames) showed low response of
the dosimeter and hence low photo-oxidizing effects.
1 Introduction
Air pollution has become a main concern of our society due to its
adverse effects on health, materials and ecosystems. The study of the
effects of indoor air pollution on cultural heritage objects is receiving
an increasing interest that has over the last decade focussed on the
protection of items both in exhibition and storage. However, the eval-
uation of the environment and the risk assessment for the preventive
conservation of cultural heritage objects are complex exercises.
Damage observed on objects depends partly on the material which
the object is made from and partly on the indoor environment. Indoor
air contains a mixture of different types of gases which may vary in

8/7/2019 Lopez, S. Air Quality Assessment. 2010
http://slidepdf.com/reader/full/lopez-s-air-quality-assessment-2010 2/6
© by M O R A N A RTD d.o.o.
EWO Dosimetry in Heritage Institutions, e-PS, 2010, 7, x-y
space and time, as do values for climate parame-
ters such as temperature and relative humidity. In
addition, pollutants and climate parameters can
act in synergy to enhance the harmful effects on
the objects.
The selection of measurements to be performed isone of the primary steps and main concerns for the
evaluation of air quality. In addition, cultural her-
itage locations have specific needs compared with
other types of indoor locations. User friendly tech-
niques, aesthetically non invasive, reduced size
and low cost are some of the most common
requirements from cultural heritage professionals
interested in indoor air quality.
Measurement techniques can be divided between
those measuring single parameters such as tem-
perature, relative humidity or the concentration of
specific pollutants and those which measure theimpact of the environment. Concentrations of sin-
gle pollutants can be measured by passive diffu-
sion gas samplers,1 monitors or other types of
devices / sensors. In contrast, dosimeters or
impact sensors2 measure the degradation effects
of the total or parts of the total environment on the
objects of interest. For that reason, dosimeter
materials are often similar to the objects of study,
but should be more sensitive to provide quick
measurement (e.g. some months) of possible
degradation risks. However, museum collections
include different types of materials which respond
differently to the environment. A general division
into organic (i.e., paper, some types of pigments,
leather, textile, varnishes) versus inorganic mate-
rials (i.e. metals, some pigments, mineral speci-
mens) can be made based on the chemical com-
position.
A wide variety of dosimeters made from different
materials and analysed according to different
methodologies are available. Metals are common-
ly used as dosimeters (i.e. lead, copper, silver)
due to their quick response to the environment and
their sensitivity to compounds which are alsoharmful for cultural heritage objects.3-4 Other
materials that are used are synthetic polymers,
glass, varnishes and pigments (see ref. 5-7).
The objective of this study is to evaluate the indoor
air quality in different cultural heritage locations
based on the results of the Early Warning Organic
(EWO) dosimeter developed by the Norwegian
Institute for Air Research (NILU), in the EU project
MASTER8 and applied in the EU PROPAINT proj-
ect9 and other projects. The EWO dosimeter was
developed as a tool for assessing indoor air quali-
ty in museum, archives or historic buildings, togive guidance in the work to protect organic cul-
tural heritage items. Results from measurements
with the EWO dosimeter in different types of cul-
tural heritage locations (e.g. historic building,
enclosure, storeroom or archive) and geographical
location (e.g. urban or rural environments) are
compared and evaluated.
2 Methodology
2.1 The EWO Dosimeter
The EWO dosimeter is a synthetic polymer sensi-
tive to climate parameters (i.e. temperature, RH
and UV Light) and NO2 and O3, which are usually
emitted outdoors and ventilated or infiltrate into
the indoor environment. The environmental effect
on the dosimeter polymer film is measured by
spectrophotometry as the change in UV absorption
at 340 nm from before to after exposure. The rela-
tion between the EWO-response and the environ-ment is based on a non linear dose response func-
tion found from the statistical analysis of the
results obtained in a measurement campaign per-
formed in the MASTER project.8- 9 Two dose
response functions for indoor locations outside
(Equations 1) and inside enclosures (i.e. showcas-
es; Equation 2) were defined9 as it follows:
EWOG1000=8.7+eUV +eT (0.11[NO2]+0.1[O3]) Equation 1
EWOG1000=4.5+eT (0.16[NO2]+0.052[O3]) Equation 2
where UV represents ultraviolet radiation (mW m-2),
T represents temperature as ºC, and the gas con-centration is expressed as µg m-3.
An evaluation of recommended response levels for
the EWO as compared to effects on organic cultur-
al heritage objects was performed based on exist-
ing knowledge in conservation science about the
effects of the single environmental parameters on
the heritage objects.10 The results from measure-
ments with the dosimeter are reported as values of
increasing environmental impact ranging from one
to five. The evaluation of the indoor air quality is
performed for five different locations with different
degree of protection, from archive to external storewith no control.
2.2 Data sources
This paper reports data from measurements with
the EWO in research projects and as services
offered to Cultural Heritage professionals by the
Norwegian Institute for Air Research (NILU)
between 2008 and 2009. Table 1 shows the sites,
types of locations (e.g. historic building, enclo-
sure), geographical situation and types of environ-
ment (i.e. rural / urban). A total of 207 results from
EWO dosimeter measurements were analysed in
97

8/7/2019 Lopez, S. Air Quality Assessment. 2010
http://slidepdf.com/reader/full/lopez-s-air-quality-assessment-2010 3/6
www.e-PRESERVATIONScience.org
EWO Dosimetry in Heritage Institutions, e-PS, 2010, 7, x-y
98
this study to evaluate the response of the EWO
dosimeters in different locations with different
environments. The results obtained in workshops
were left out (i.e. three EWO results) and the
remaining 204 EWO results were divided accord-
ing to types of Cultural Heritage locations, as
“Historic Buildings”, “Storeroom / Archives”, “New
Buildings” and “Enclosures”, understanding for
enclosures as containers with relative small vol-
ume of air such as showcases or microclimate
frames. The highest number of EWO results
belongs to the class of measurements performed
inside enclosures followed by those performed in
historic buildings (Table 1; Figure 1).
3 Results and discussion
The EWO measurements were, on average, found
to be lower in locations classified as “Enclosures”
(EN) than those classified as “Historic Buildings”
(HB; Figure 1). These results indicate that enclo-
sures protect objects against degradation that can
be caused by the synergistic effects of outdoor
generated pollutants (i.e. NO2 and O3) and climate
parameters (i.e. temperature, RH and UV-light).
The protective effects of enclosures against exter-
nally generated pollutants such as NO2 and O3 has
been previously established based on the results
obtained by different types of dosimeters9 and the
evaluation of pollutant concentration measure-ments.11
The average of the measurements results for the
class of “Storeroom / Archive” (ST/AR) was also
very low, similar to the result obtained inside
enclosures (Figure 1). Some of the storerooms
and archives were air conditioned with low light
levels and low number of visitors. This may explain
the low EWO results values. The average of the
results obtained for the class “New Buildings” (NB)
is very similar to the average obtained for theclass “Historic Buildings” (Figure 1). However, the
results for the classes “New Buildings” and
“Storeroom / Archives” may be less representative
due to the low number of measurements (i.e.
ST/AR = 8; NB = 11; Figure 1).
The EWO results obtained in the different types of
indoor locations and in different geographical
areas were compared with punctual measurements
of NO2, O3 and acetic acid performed in the same
locations, where information was available. The
measurements of the pollutant gases were per-
formed simultaneously or following the EWO
measurements for some of the enclosures. NO2
and organic acids (acetic and formic acids) con-
centrations were measured by passive diffusion
gas samplers12 from the Norwegian Institute for Air
Research (NILU) and from Swedish Environmental
Institute (IVL) in the case of ozone concentration.
The linear correlations between the EWO
response and the concentration of NO2 and O3 are
low as expected, with R2 values equal to 0.38 and
0.29, respectively (Figure 2), as the EWO
response correlates with multiple parameters. The
R2 value for the multiple regression (Equation 1) is0.73,5 showing the value of the EWO dosimeter for
#
EWO
Geographical
Location
Location
Type
Urban /
Rural
23 Oslo, NO His to ric Bui ld ing, enc losure Urban
2 Akerhus, NO New building Rural
5 Copenhagen, DK Historic Building, enclosure Urban
16 Haslach, GE Historic Bui ld ing, enclosure Rural
13 Heraklion, GR Historic Building, enclosure Urban
20 Krakow, PO Historic Bui ld ing, enclosure Urban
24 London, UKHistoric Building, enclosure,
Storeroom, ArchiveUrban
7 Madrid, ES Workshop, enclosure Urban
2 Mexico City, MX Historic Building, enclosure Urban
16 Norfolk, UK Historic Bui ld ing, enclosure Rural
2 Nurberg, GE Historic Bui ld ing, enclosure Urban
10 Prague, CRHistoric Building, Storeroom,
ArchiveUrban
16 Rabat, ML Historic Bui ld ing, enclosure Rural
16 S tu ttgart , GE New bui ld ing, enc losure Urban
16 Trondheim, NO Historic Building, enclosure Urban
2 Valencia, ES Historic Building, enclosure Urban
16 Zakopane, PO Historic Building, enclosure Rural
1 Tokyo, JP Storeroom Urban
207 Total EWO dosimeter measurements
Table 1: Overview of the EWO results analysed in this study.
Figure 1: Average EWO response (*1000) in different heritage insti-tutions. EN: enclosure (i.e. showcase and / or microclimate frame),
ST/AR: Storeroom and archives, NB: new building, HB: historical
building. Vertical bars indicate standard deviation. n: number of
measurements.

8/7/2019 Lopez, S. Air Quality Assessment. 2010
http://slidepdf.com/reader/full/lopez-s-air-quality-assessment-2010 4/6
© by M O R A N A RTD d.o.o.
EWO Dosimetry in Heritage Institutions, e-PS, 2010, 7, x-y
the assessment of the combined effects of outdoor
pollutants (i.e. NO2 and O3) and climate parame-
ters (i.e. temperature, UV light). The correlations
of the EWO measurements with the NO2 and O3
concentrations show that the EWO dosimeter is a
good indicator for the presence of outdoor gener-
ated pollutants (Equation 1; Figure 2). The lack of sensitivity and thus of correlation of the EWO
dosimeter with acetic acid (Figure 2) is one of the
disadvantages of the dosimeter since organic
acids are common in indoor locations and may be
harmful for some items. Thus, in the EU project
PROPAINT a method for dosimetry combining the
EWO with another dosimeter sensitive to organic
acids was developed.6
The relation between the EWO response and the
NO2 concentration was used to illustrate and eval-
uate the EWO response in the different types of
locations (Figure 3). The category called historic
buildings shows the highest variance in NO2 con-
centration and EWO response (Figure 2). This
large variance may be explained by larger variabil-
ity of the environmental parameters between loca-
tions in this class, which may be due to different
regimes for the indoor climate and / or different
degrees of protection by the building against infil-
tration of outdoor generated pollutants (i.e. NO2
and O3). The climate control and effect of building
protection will depend on factors such as type of
ventilation systems, presence / absence of filtra-
tion systems for gases and particles, generalmaintenance of the building, indoor activities (i.e.
cooking / coffee activities) or on the geographical
location of the building (i.e. urban, traffic or rural
locations), among others.
Few measurements have been performed inside
storerooms and / or archives (i.e., n=8; Figure 3).
The concentrations of NO2 measured in these
locations and the EWO responses were low, indi-
cating low photo-oxidant effects and low infiltration
of outdoor generated pollutants.
The class named “Enclosures” includes a widevariety of enclosure locations with different dimen-
sions, construction materials, objects within the
enclosures and air exchange rates. Some show-
cases were exclusively made of glass or wood
whereas glass was combined with wood, metal
and / or cloth in other enclosures. Microclimate
frame enclosures are made from wood, glass,
metal and / or polycarbonate as the main con-
struction materials. Some of the enclosures were
empty whereas others included objects such as
paintings, textiles or wood items. Differences in
the size and the air exchange rate between the
enclosures are among the most significant. The
volumes vary from 0.01 to 70 m3, and air exchange
rate varies from 0.2 to 15 day -1. The different sizes
and air exchange rates of the enclosures will
strongly influence the amount of pollutants that are
99
Figure 2: EWO dosimeter responses versus NO2, O3 and acetic acid
measured with passive diffusion gas samplers.
8/7/2019 Lopez, S. Air Quality Assessment. 2010
http://slidepdf.com/reader/full/lopez-s-air-quality-assessment-2010 5/6
www.e-PRESERVATIONScience.org
EWO Dosimetry in Heritage Institutions, e-PS, 2010, 7, x-y
100
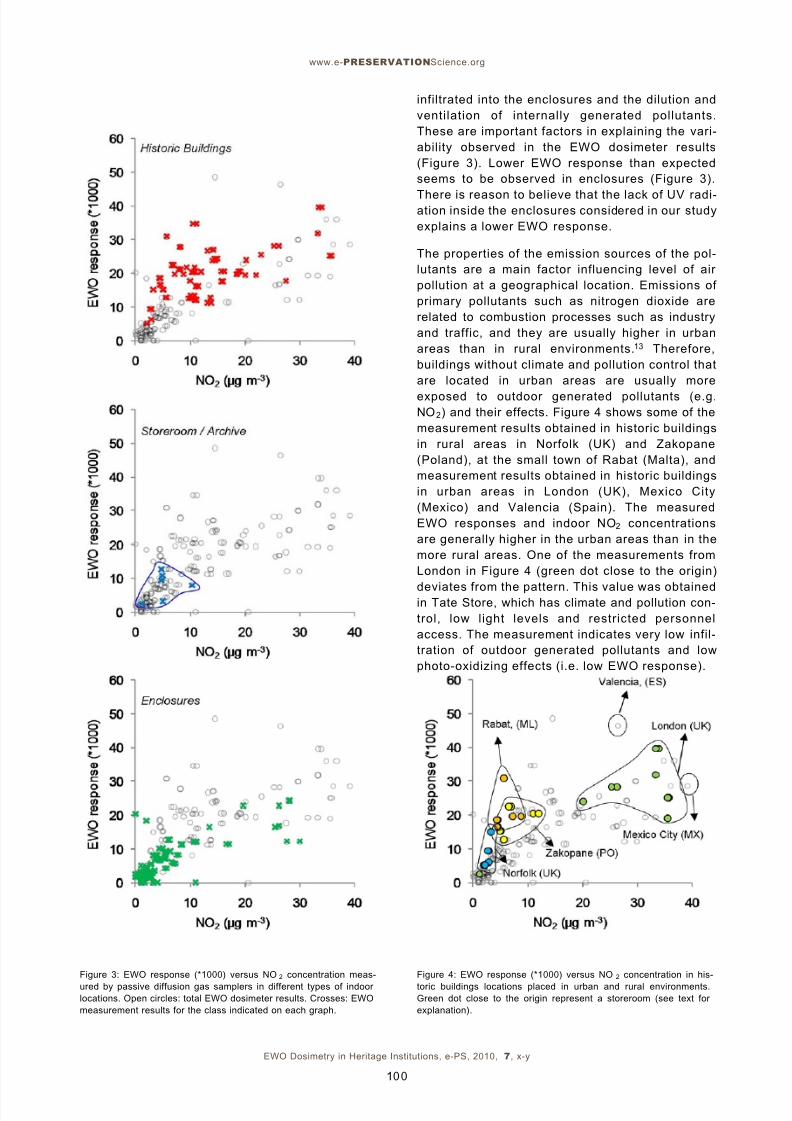
infiltrated into the enclosures and the dilution and
ventilation of internally generated pollutants.
These are important factors in explaining the vari-
ability observed in the EWO dosimeter results
(Figure 3). Lower EWO response than expected
seems to be observed in enclosures (Figure 3).
There is reason to believe that the lack of UV radi-ation inside the enclosures considered in our study
explains a lower EWO response.
The properties of the emission sources of the pol-
lutants are a main factor influencing level of air
pollution at a geographical location. Emissions of
primary pollutants such as nitrogen dioxide are
related to combustion processes such as industry
and traffic, and they are usually higher in urban
areas than in rural environments.13 Therefore,
buildings without climate and pollution control that
are located in urban areas are usually more
exposed to outdoor generated pollutants (e.g.
NO2) and their effects. Figure 4 shows some of the
measurement results obtained in historic buildings
in rural areas in Norfolk (UK) and Zakopane
(Poland), at the small town of Rabat (Malta), and
measurement results obtained in historic buildings
in urban areas in London (UK), Mexico City
(Mexico) and Valencia (Spain). The measured
EWO responses and indoor NO2 concentrations
are generally higher in the urban areas than in the
more rural areas. One of the measurements from
London in Figure 4 (green dot close to the origin)
deviates from the pattern. This value was obtainedin Tate Store, which has climate and pollution con-
trol, low light levels and restricted personnel
access. The measurement indicates very low infil-
tration of outdoor generated pollutants and low
photo-oxidizing effects (i.e. low EWO response).
Figure 3: EWO response (*1000) versus NO2 concentration meas-
ured by passive diffusion gas samplers in different types of indoor
locations. Open circles: total EWO dosimeter results. Crosses: EWO
measurement results for the class indicated on each graph.
Figure 4: EWO response (*1000) versus NO 2 concentration in his-
toric buildings locations placed in urban and rural environments.
Green dot close to the origin represent a storeroom (see text for
explanation).
8/7/2019 Lopez, S. Air Quality Assessment. 2010
http://slidepdf.com/reader/full/lopez-s-air-quality-assessment-2010 6/6
© by M O R A N A RTD d.o.o.
EWO Dosimetry in Heritage Institutions, e-PS, 2010, 7, x-y
The results from the EWO dosimeter and their
comparison allow us to establish that indoor air
quality in buildings without climate and pollution
control, which in addition are located in highly pol-
luted environments, may constitute a risk for the
preservation of cultural heritage assets in exhibi-
tion or storage.
4 Conclusions
The EWO measures the impact on organic materi-
als of pollutants that are usually generated out-
doors (i.e. NO2 and O3) and act in synergy with cli-
mate parameters (i.e. temperature / RH and UV
Light).
The analysis of a large number of EWO measure-
ment results obtained from different studies,
according to the types of locations where themeasurements were performed, shows clear corre-
lation between the EWO results and more (i.e.
enclosures, storerooms / archives) or less (i.e.
new buildings, historical buildings) protected loca-
tions. This shows that the type of indoor location
and its characteristics (i.e. type of ventilation sys-
tem, air exchange rate, etc) are important factors
for the indoor air quality and for possible imple-
mentation of climate and pollution control.
The EWO results showed that the risk of degrada-
tion of indoor cultural heritage due to air pollutants
is higher in buildings located in more pollutedurban environments than in less polluted rural
environments when the building does not provide
the needed climate and pollution protection. These
results are supported by measurement results for
NO2 concentrations obtained by passive diffusion
gas samplers. NO2 concentrations are in most
instances a good indicator of outdoor generated
pollutants subsequently infiltrated to the indoors.
This study shows the usefulness of the EWO for
indoor air quality screening studies in cultural her-
itage locations. If the EWO measurements show
non acceptable environments it is recommended
to do measurements of specific parameters (e.g.
temperature, relative humidity, light and / or single
pollutant concentration levels) to identify the prob-
lem and to decide the most effective abatement
strategies.
5 Conflict of Interest Statement
The authors have no commercial interest in the
subject matter under consideration in the manu-
script.
6 Literature
1. C.M. Grzywacz, Monitoring for Gaseous Pollutants in Museum
Environments (Tools for Conservation), Getty Conservation
Institute, Los Angeles, 2006.
2. M. Bacci, C. Cucci, A. Azelio Mencaglia, A.G. Mignani, Innovative
Sensors for Environmental Monitoring in Museums, Sensors, 2008,
8, 1984-2005.
3. W.A. Oddy, An unsuspected danger in display , Museums J.,
1973, 73, 27-28.
4. M. Ryhl-Svendsen, Corrosivity measurements of indoor museum
environments using lead coupons as dosimeters, J. Cult. Herit.,
2008, 9, 285-293.
5. M. Bacci; M. Picollo, S. Porcinai, B. Radicati, Tempera-painted
dosimeters for environmental indoor monitoring: a spectroscopic
and chemometric approach, Environ. Sci. Technol., 2000, 34, 2859
–2865.
6. E. Dahlin, T. Grøntoft, S. López-Aparicio, M. Odlyha, M. Scharff,
T. Larsen, A. Tabuenca García, A. Ortega, G. A ndrade, P. Mottner,
M. Obarzanowski, J. Czop, R. Kozłowski, M. P. Colombini, I.
Bonaduce, M. Ryhl-Svendsen, D. Thickett, S. Hackney, J. Wadum,
A. Haack Christensen, S. Jakieła, 2010 PROPAINT; Improved
Protection of Paintings During Exhibition, Storage And Transit.
PROPAINT Final Publishable Report . NILU report OR42/2010,
Kjeller, Norway.
7. M. Odlyha, C. Theodorakopoulos, D. Thicket, M. Ryhl-Svendsen,
J.M. Slater, R. Campana, Dosimeters for indoor microclimate moni-
toring for cultural heritage. In: T. Padfield, K. Borchersen (eds),
Museum Microclimates. Proc. Conference, Copenhagen, 19-
23/11/2007, National Museum of Denmark, 2007, 73-79.
8. T. Grøntoft, E. Dahlin, J. Henriksen, S. Rentmeister, M. Hanko, J.
Heinze, J. Taylor, N. Blades, M. Cassar, An Early Warning system
for organic materials in museums, historic buildings and archives,
in: M. Drdácký, M. Chapuis (Eds.), Proceedings of the 7 th European
Conference “SAUVEUR, Safeguarded Cultural Heritage” 2006,
Prague, Czech Republic, 2007, 2, 41-50.
9. T. Grøntoft, M. Odlyha, P. Mottner, E. Dahlin, S. Lopez-Aparicio,S. Jakiela, M. Scharff, G. Andrade, M. Obarzanowski, M. Ryhl-
Svendsen, D. Thickett, S. Hackney, J. Wadum, Pollution monitoring
by dosimetry and passive diffusion sampling for evaluation of envi-
ronmental conditions for paintings in microclimate frames , J. Cult.
Herit., in press, http://dx.doi.org/10.1016/j.culher.2010.02.004.
10. J. Tétrault, Airborne Pollutants in Museums, Galleries, and
Archives: Risk Assessment, Control Strategies and Preservation
Management , Ottawa, Canadian Conservation Institute, 2003.
11. S. López-Aparicio, T. Grøntoft, M. Odlyha, E. Dahlin, P. Mottner,
D. Thickett, M. Ryhl-Svendsen, N. Schmidbauer, M. Scharff,
Measurement of organic and inorganic pollutants in microclimate
frames for paintings, e-Preserv. Sci., 2010, 7, 59-70.
12. M. Ferm, A sensitive diffusional sampler , Swedish
Environmental Research Institute, Publ. IVL B-1020, 1991.
13. EIONET, 2010, AirBase, http://air-cli-
mate.eionet.europa.eu/databases/airbase/
101


