
RESEARCH ARTICLE Open Access
Longitudinal and nonlinear relations ofdietary and Serum cholesterol in midlifewith cognitive decline: results from EMCOAstudyYu An1, Xiaona Zhang1, Ying Wang1, Yushan Wang1, Wen Liu1, Tao Wang1, Zhongsheng Qin2 and Rong Xiao1*
Abstract
Background: Previous studies regarding the cholesterol-cognition relationship in midlife have generated conflictingresults. We thus investigated whether dietary and blood cholesterol were associated with cognitive decline.
Methods: Participants were drawn from a large cohort study entitled the Effects and Mechanism Investigation ofCholesterol and Oxysterol on Alzheimer’s disease (EMCOA) study. We included 2514 participants who completed aselection of comprehensive cognitive tests and were followed for an average of 2.3 years. Blood concentrations oftotal cholesterol (TC), high-density lipoprotein cholesterol (HDL-C), low-density lipoprotein cholesterol (LDL-C) andtriglycerides (TG) were assessed and dietary intakes were investigated by food frequency questionnaire (FFQ) atbaseline. Apolipoprotein E (APOE) was genotyped by Kompetitive Allele Specific PCR (KASP) sequencing. Non-high-density lipoprotein cholesterol (Non-HDL-C) and LDL-C/HDL-C ratio were calculated. The longitudinal effects ofdietary and blood cholesterol on risk of global cognitive decline (decrease in Montreal Cognitive Assessment(MoCA) > 2 points) were examined using Cox proportional hazards models. The nonlinear associations with globaland domain-specific cognitive decline was evaluated with mixed effect linear models.
Results: In Cox proportional hazards models, neither cholesterol nor egg intake was associated with a higher risk ofaccelerated global cognitive decline. In contrast, the higher serum concentrations of TC, LDL-C, non-HDL-C andLDL-C/HDL-C ratio were positively associated with accelerated global cognitive decline regardless of beingevaluated continuously or categorically while higher HDL-C was positively associated with accelerated globalcognitive decline only when being evaluated categorically (all P < 0.05). In mixed effect linear models, quadratic andlongitudinal relations of dietary cholesterol and egg intakes to global cognition, processing speed and executivefunction were observed. Moreover, there were inverted U-shaped relations of HDL-C, with processing speed andexecutive function but U-shaped relations of HDL-C and LDL-C/HDL-C ratio with verbal memory. Adverse linearassociations of higher LDL-C and LDL-C/HDL-C ratio with multiple cognitive comes were also revealed. Additionallyadjusting for APOE genotype did not modify cholesterol-cognition associations. Dietary and serum cholesterol hadvariable associations with global and domain-specific cognitive decline across educational groups.
Conclusion: Differential associations between dietary/serum cholesterol and cognitive decline across differentdomains of function were observed in a particular population of middle-aged and elderly Chinese.Interventions to improve cognitive reserve regarding dietary instruction and lipid management should betailored according to specific target.(Continued on next page)
© The Author(s). 2019 Open Access This article is distributed under the terms of the Creative Commons Attribution 4.0International License (http://creativecommons.org/licenses/by/4.0/), which permits unrestricted use, distribution, andreproduction in any medium, provided you give appropriate credit to the original author(s) and the source, provide a link tothe Creative Commons license, and indicate if changes were made. The Creative Commons Public Domain Dedication waiver(http://creativecommons.org/publicdomain/zero/1.0/) applies to the data made available in this article, unless otherwise stated.
* Correspondence: [email protected] of Public Health, Capital Medical University, No.10 Xitoutiao, You AnMen Wai, Beijing 100069, ChinaFull list of author information is available at the end of the article
An et al. Molecular Neurodegeneration (2019) 14:51 https://doi.org/10.1186/s13024-019-0353-1

(Continued from previous page)
Trial registration: EMCOA, ChiCTR-OOC-17011882, Registered 5th, July 2017-Retrospectively registered, http://www.medresman.org/uc/project/projectedit.aspx?proj=2610
Keywords: Cholesterol, Cognitive decline, Nonlinear
BackgroundAn extensive yet conflicting research has documented longi-tudinal associations between serum cholesterol and pro-spective cognitive decline [1]. Meanwhile, a sparse priorliterature has identified no associations between cholesterol/egg intakes and incident dementia or Alzheimer’s disease(AD) [2]. However, a recent article published in JAMA hasconcluded that higher consumption of cholesterol and eggswas significantly associated with higher risk of incident car-diovascular disease (CVD) in a dose-response manner [3].Since CVD are known to predict the risk of dementia [4],the role of dietary and serum cholesterol in cognitive func-tion and AD is not as clear cut.An updating meta-analysis of 17 studies indicated diver-
gent cholesterol–cognition associations [5]. When measuredin midlife, higher serum cholesterol levels were associatedwith an increased risk of late-life cognitive decline, AD andother dementia. However, this risk relationship has not beenextended to late life. Prior studies of increased late-lifeserum cholesterol and subsequent risk of incident cognitivedysfunction report either null results or protective associa-tions [6]. There is evidence that decreased cholesterol levelsmay be a manifestation of underlying dementia-relatedneuropathology [7]. Therefore, a non-linear pattern of bothhigh and low serum cholesterol is related to increased riskof cognitive decline or AD have been noted. Wendellet al. have observed non-linear longitudinal [8] andcross-sectional [9] associations between serum choles-terol levels and cognitive function in Baltimore Longi-tudinal Study of Aging. Our group have also reportedsuch similar sex-specific, non-linear, cross-sectional associa-tions [10]. Despite that, there was a lack of cohort data andhence we do not know if non-linear patterns were replicatedin longitudinal settings. With respect to dietary cholesterol,Vincent et al. [11] have indicated from meta-regression ana-lyses that there is a positive, nonlinear relation between thechanges in LDL-C and dietary cholesterol, suggesting acomplex network of interrelationships between dietary chol-esterol, serum cholesterol, which may obscure the role ofdietary cholesterol in cognitive function. Similar to serumcholesterol levels, associations of dietary cholesterol andcognitive impairment, AD or dementia are mixed, albeit lim-ited [2, 12], suggesting a need for nonlinear examination.The present study thus aimed to augment the current un-
derstanding of both serum and dietary cholesterol-cognitionnon-linear associations in our longitudinal settings—theEffects and Mechanism investigation of Cholesterol and
Oxysterol on Alzheimer’s disease (EMCOA) study [13].While the study serves as an extension of our group’s priorcross-sectional examination, to our knowledge, no priorstudy has directly addressed both serum and dietary choles-terol nonlinearly. We aimed to examine potential quadraticrelations of multiple serum cholesterol levels (TC, TG,HDL-C and LDL-C), cholesterol and egg intake to globaland domain-specific cognitive decline, which may be moresensitive and helpful to elucidate the impacts of cholesterolon brain integrity and function.
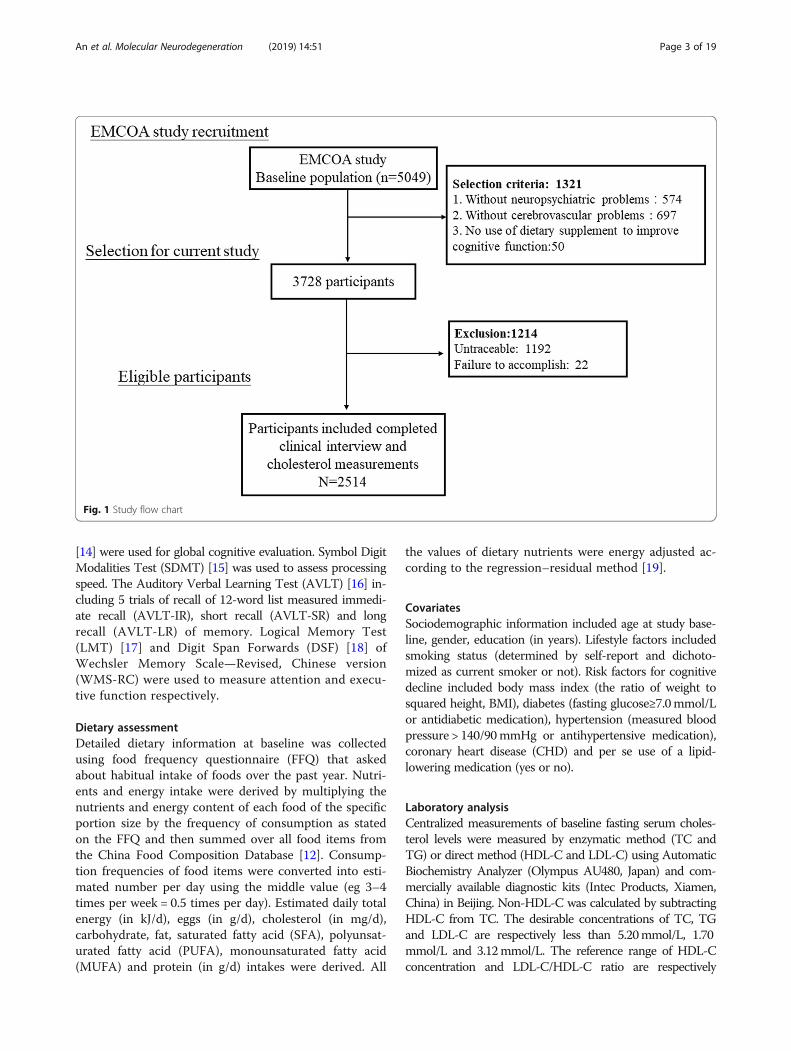
Materials and methodsParticipantsParticipants from the EMCOA study, a multicenter pro-spective study of community-dwelling volunteers initiatedby Capital Medical University in 2014, returned to the re-spective research center in three locations approximatelyevery 2 years. This study was registered at Chinese ClinicalTrial Registry as ChiCTR-OOC-17011882. Beginning in2014, participants between 50 to 70 years old were admin-istered face-to-face interviews with the collection of socio-demographic information (e.g. age, sex and educationyears), medical history of chronic diseases, neuropsycho-logical testing and dietary survey. Fasting venous bloodsamples were collected from the antecubital vein after a12-h fast during all the interviews, following standardizedprotocols for storage of blood samples. The exclusion cri-teria for the original study included suffering from severediseases or conditions known to affect cognitive function(e.g. depression, malignant tumors, a history of traumaticbrain injury, cerebral infarction or cerebrovascular disease,long-term frequency intake of drugs and medication ordietary supplement to improve cognitive function). Finally,longitudinal data from 2514 middle-aged and elderly par-ticipants entered the study and were used for this analysis(Fig. 1). Because the EMCOA used continuous enrollmentprocedures, participants have different numbers of visitsand follow times are also variable with a median time of2.3 years. The medical Ethics Committee of Capital Med-ical University (No. 2013SY35) approved the study proto-col and written informed consents were obtained from allsubjects.
Cognitive testsAt each study visit, standard cognitive tests were adminis-tered by trained study personnel in a standard order in aquiet room. The Montreal Cognitive Assessment (MoCA)
An et al. Molecular Neurodegeneration (2019) 14:51 Page 2 of 19
[14] were used for global cognitive evaluation. Symbol DigitModalities Test (SDMT) [15] was used to assess processingspeed. The Auditory Verbal Learning Test (AVLT) [16] in-cluding 5 trials of recall of 12-word list measured immedi-ate recall (AVLT-IR), short recall (AVLT-SR) and longrecall (AVLT-LR) of memory. Logical Memory Test(LMT) [17] and Digit Span Forwards (DSF) [18] ofWechsler Memory Scale—Revised, Chinese version(WMS-RC) were used to measure attention and execu-tive function respectively.
Dietary assessmentDetailed dietary information at baseline was collectedusing food frequency questionnaire (FFQ) that askedabout habitual intake of foods over the past year. Nutri-ents and energy intake were derived by multiplying thenutrients and energy content of each food of the specificportion size by the frequency of consumption as statedon the FFQ and then summed over all food items fromthe China Food Composition Database [12]. Consump-tion frequencies of food items were converted into esti-mated number per day using the middle value (eg 3–4times per week = 0.5 times per day). Estimated daily totalenergy (in kJ/d), eggs (in g/d), cholesterol (in mg/d),carbohydrate, fat, saturated fatty acid (SFA), polyunsat-urated fatty acid (PUFA), monounsaturated fatty acid(MUFA) and protein (in g/d) intakes were derived. All
the values of dietary nutrients were energy adjusted ac-cording to the regression–residual method [19].
CovariatesSociodemographic information included age at study base-line, gender, education (in years). Lifestyle factors includedsmoking status (determined by self-report and dichoto-mized as current smoker or not). Risk factors for cognitivedecline included body mass index (the ratio of weight tosquared height, BMI), diabetes (fasting glucose≥7.0mmol/Lor antidiabetic medication), hypertension (measured bloodpressure > 140/90mmHg or antihypertensive medication),coronary heart disease (CHD) and per se use of a lipid-lowering medication (yes or no).
Laboratory analysisCentralized measurements of baseline fasting serum choles-terol levels were measured by enzymatic method (TC andTG) or direct method (HDL-C and LDL-C) using AutomaticBiochemistry Analyzer (Olympus AU480, Japan) and com-mercially available diagnostic kits (Intec Products, Xiamen,China) in Beijing. Non-HDL-C was calculated by subtractingHDL-C from TC. The desirable concentrations of TC, TGand LDL-C are respectively less than 5.20mmol/L, 1.70mmol/L and 3.12mmol/L. The reference range of HDL-Cconcentration and LDL-C/HDL-C ratio are respectively
Fig. 1 Study flow chart
An et al. Molecular Neurodegeneration (2019) 14:51 Page 3 of 19

1.04–1.7mmol/L and 1.31–3.19. Less than 3.4mmol/L ofnon-HDL-C concentration is considered normal [20].
APOE genotypingIdentification and measurement of the APOE genotypewith none ε4 (ε2/ε3, ε2/ε2, ε3/ε3), one ε4 (ε3/ε4, ε2/ε4)and two ε4 (ε4/ε4) in this study were achieved throughthe KASP genotyping assay by BioMiao Biological Tech-nology, Beijing, China. In brief, leukocyte total genomicDNA was extracted from 400 μL of peripheral bloodsamples by using the Whole Blood DNA Extraction Kit(QIAamp® DNA Blood Mini Kit). DNA samples werethen randomly placed on batches of 96-well plate. Geno-typing of APOE was performed according to the manu-facturer’s instructions [21]. For the purpose of qualitycontrol, 5% of samples were repeated and non-templatecontrols were set in each plate.
Statistical analysisStatistical analyses were performed using STATA version13.0 (STATA, College Station, TX). Prior to analysis, thenormality of data distribution was checked. Continuousvariables were expressed as medians (interquartile ranges,IQR) when non-normally distributed or the mean ± stand-ard deviation (SD) when normally distributed. Analysis ofvariance (ANOVA) or the Kruskal-Wallis rank test wasused for continuous variables as appropriate. The energy-adjusted values according to the residual method for all ofthe nutrients and eggs were calculated. The differences infrequencies of the categorical variables were evaluated usingchi-square test or Fisher’s exact test. Dietary intakes ofcholesterol and eggs were categorized into quartiles. Theserum levels of cholesterol were categorized into two orthree groups according to reference value or range. Coxproportional hazards regression models were used to esti-mate hazards ratios (HRs) for accelerated cognitive decline(a decrease in MoCA > 2 points between follow-up andbaseline [22]) in baseline cholesterol and egg intakes as wellas serum cholesterol. Longitudinal associations of dietaryand serum cholesterol with global and domain-specificcognitive decline were estimated using linear mixed-effectmodels. We included quadratic terms in mixed-effectmodels when exploring the nonlinearity of the associationbetween continuous baseline dietary cholesterol and eggintake as well as serum cholesterol concentrations andsubsequent cognitive change. Each cognitive test was en-tered as a single outcome variable in separate mixed-effectsregression models.Covariates in the models were selected based on estab-
lished and previously published risk factors for AD orassociations with exposures in the current analysis.Model 1 included age, sex, years of education, BMI,smoking and drinking status, diabetes, hypertension andCHD history, per se use of lipid-lowering medication
and intakes of energy, protein, carbohydrates, fat, choles-terol, SFA, PUFA and MUFA. Model 2 was adjusted asfor model 1 and mutually for number of APOE ε4 allelesto test specially whether APOE genotype of the subjectshave an influence on the identified relationship betweencholesterol and various cognitive functions. Moreover,further subanalysis by four educational group, Elemen-tary school (≤6 years of education), Junior middle school(7–9 years of education), Senior middle school (10–12years of education) and College and above (at leastcollege or university; ≥13 years of education) [13], wereperformed taking generally lower educational back-ground into consideration. A two-sided P < 0.05 wereconsidered statistically significant.
ResultsOf 2514 participants, 54.0% were women. The medianage was 59 years and the median education years was 9years. Median cholesterol and egg intakes were respect-ively 282.83 mg/d and 45.21 g/d. Compared with thosewith a lower cholesterol intake, participants with ahigher cholesterol intake were less likely to be women,have hypertension and lipid-lowering medication per seuse, have lower energy and carbohydrates intakes, butmore educated, more likely to drink and have diabetes(all P < 0.05, Table 1). They also had higher protein, fat,SFA, PUFA, MUFA and egg intakes but lower serum TGconcentrations (P < 0.05). In regard to baseline cognitiveperformance, participants with higher cholesterol intakeperformed significantly better than that with lower in-take (all P < 0.05) except for AVLT-SR and AVLT-LR.No differences were observed with other covariates. Par-ticularly, no significant differences emerged with respectto APOE ε4 allele, the distribution of which with higherε2 and lower ε4 differed greatly from European andAmerican populations [23].During a median follow-up of 2.3 years, 546 partici-
pants (21.7%) were defined as accelerated cognitive de-cline. In multivariable Cox proportional hazardsregression model 1 adjusted for AD risk factors (Table 2),neither cholesterol nor egg intake was associated withrisk of accelerated cognitive decline regardless of beingevaluated continuously (cholesterol: HR: 1.0002; 95% CI:0.9995–1.0009; P = 0.590; egg: HR:1.002; 95% CI: 0.999–1.006; P = 0.128) or in quartiles (cholesterol: HR forhighest compared with lowest quartiles: 1.18; 95% CI:0.89–1.58; P = 0.256; egg: HR for highest compared withlowest quartiles: 1.04; 95% CI: 0.81–1.33; P = 0.786).With respect to serum cholesterol levels, additionalserum concentrations of TC, LDL-C, non-HDL-C andLDL-C/HDL-C ratio were significantly associated withaccelerated global cognitive decline when being evalu-ated continuously (HR for TC: 1.15, 95% CI: 1.06–1.26,P = 0.002; HR for LDL-C:1.26, 95% CI: 1.14–1.40, P <
An et al. Molecular Neurodegeneration (2019) 14:51 Page 4 of 19

Table 1 Baseline characteristics according to cholesterol intakes in 2514 participants in the EMCOA
Cholesterol intake quartile, mg/d P value
Q1(< 188) Q2 (188–283) Q3 (283–385) Q4 (> 385)
Demographic characteristics
Age 58 (56, 62) 59 (55, 62) 59 (55, 62) 59 (55, 62) 0.707
Women, n(%) 349 (55.57%) 362 (57.37%) 355 (56.71%) 291 (46.26%) < 0.001*
Education years 9 (9, 12) 9 (9, 12) 12 (9, 12) 12 (9, 12) 0.001*
BMI (kg/m2) 24.6 (22.9, 26.7) 24.6 (22.6, 26.6) 24.4 (22.6, 26.4) 24.5 (22.6, 26.5) 0.371
Lifestyle
Current smoker, n(%) 161 (25.64%) 151 (23.93%) 131 (20.93%) 154 (24.48%) 0.242
Current drinker, n(%) 143 (22.77%) 140 (22.19%) 151 (24.12%) 195 (31.00%) 0.001*
Medical History
Diabetes, n(%) 69 (10.99%) 73 (11.57%) 96 (15.34%) 140 (22.26%) < 0.001*
Hypertension, n(%) 235 (37.42%) 212 (33.60%) 195 (31.15%) 187 (29.73%) 0.022*
CHD, n(%) 79 (12.58%) 63 (9.98%) 52 (8.31%) 55 (8.74%) 0.051
vLipid-lowering medicationper se use, n(%)
80 (12.74%) 74 (11.73%) 52 (8.31%) 57 (9.06%) 0.030*
APOE genotype with 0/1/2 ɛ4risk alleles
0.473
0 (ε2/ε3, ε2/ε2, ε3/ε3) 525 (83.60%) 517 (81.93%) 515 (82.27%) 527 (83.78%)
1 (ε3/ε4, ε2/ε4) 98 (15.61%) 109 (17.27%) 102 (16.29%) 100 (15.90%)
2 (ε4/ε4) 5 (0.80%) 5 (0.79%) 9 (1.44%) 2 (0.32%)
Dietary intakes†
Energy, kJ/d 7165 (5732, 9169) 6477 (5005, 8524) 6927 (5691, 8135) 6823 (5159, 9034) < 0.001*
Carbohydrates, g/d 271.88 (231.75, 310.47) 245.47 (214.74, 278.66) 244.60 (213.94, 274.34) 224.99 (197.91, 251.91) < 0.001*
Protein, g/d 59.40 (52.85, 66.49) 63.22 (57.85, 69.18) 65.24 (59.68, 71.10) 71.69 (65.79, 80.71) < 0.001*
Fat, g/d 59.29 (44.18, 74.88) 67.37 (54.51, 79.38) 66.69 (55.59, 79.09) 70.34 (59.43, 80.46) < 0.001*
SFA, g/d 15.83 (12.50, 18.71) 18.63 (15.71, 21.42) 19.08 (16.56, 21.93) 21.87 (19.55, 24.87) < 0.001*
PUFA, g/d 25.27 (16.77, 33.38) 27.88 (20.90, 34.62) 26.16 (19.34, 33.59) 23.69 (16.41, 31.20) < 0.001*
MUFA, g/d 20.98 (15.27, 25.35) 24.16 (19.39, 28.39) 24.03 (20.06, 28.55) 27.68 (23.47, 32.52) < 0.001*
Eggs, g/d 12.01 (4.01, 20.75) 29.97 (23.47, 41.12) 58.00 (49.11, 61.11) 62.66 (57.16, 66.61) < 0.001*
Serum Cholesterol
TC, mmol/L 4.51 (3.79, 5.19) 4.50 (3.80, 5.23) 4.51 (3.74, 5.25) 4.67 (3.98, 5.34) 0.054
TC > 5.20 mmol/L, n(%) 150 (23.92%) 160 (25.36%) 170 (27.16%) 177 (28.27%) 0.308
TG, mol/L 1.50 (1.09, 2.08) 1.59 (1.11, 2.13) 1.40 (1.06, 2.00) 1.36 (0.99, 2.00) < 0.001*
TG > 1.70 mmol/L, n(%) 247 (39.39%) 277 (43.90%) 219 (34.98%) 224 (35.78%) 0.004*
HDL-C, mmol/L 1.24 (1.05, 1.48) 1.26 (1.10, 1.46) 1.30 (1.10, 1.50) 1.29 (1.10, 1.50) 0.06
HDL-C < 1.04 mmol/L, n(%) 146 (25.13%) 113 (19.25%) 111 (19.68%) 115 (20.35%) 0.052
HDL-C > 1.70 mmol/L, n(%) 46 (9.56%) 44 (8.49%) 62 (12.04%) 61 (11.94%) 0.166
LDL-C, mmol/L 2.77 (2.20, 3.31) 2.79 (2.20, 3.35) 2.72 (2.12, 3.31) 2.82 (2.30, 3.39) 0.438
LDL-C > 3.12 mmol/L, n(%) 206 (32.85%) 207 (32.81%) 209 (33.39%) 221 (35.30%) 0.762
Non-HDL, mmol/L 3.24 (2.62, 3.81) 3.20 (2.59, 3.92) 3.22 (2.58, 3.85) 3.35 (2.71, 3.93) 0.100
Non-HDL ≥ 3.40, n(%) 270 (43.06%) 262 (41.52%) 255 (40.73%) 296 (47.28%) 0.088
LDL-C/HDL-C 2.22 (1.68, 2.73) 2.20 (1.73, 2.71) 2.11 (1.72, 2.60) 2.18 (1.71, 2.71) 0.325
LDL-C/HDL-C≤ 1.31, n(%) 50 (8.85%) 53 (9.20%) 63 (10.92%) 54 (9.52%) 0.654
LDL-C/HDL-C≥ 3.19, n(%) 62 (10.75%) 55 (9.52%) 49 (8.70%) 59 (10.31%) 0.667
An et al. Molecular Neurodegeneration (2019) 14:51 Page 5 of 19

0.001; HR for non-HDL-C: 1.15, 95%CI: 1.05–1.27, P =0.004; HR for LDL-C/HDL-C ratio: 1.20, 95%CI: 1.07–1.34, P = 0.002). After being dichotomized, serum choles-terol was associated with an HR of 1.26 (95% CI: 1.04–1.53, P = 0.020) for TC higher than 5.20 mmol/L, 1.37(95%CI: 1.00–1.87, P = 0.048) for HDL-C higher than1.70 mmol/L, 1.60 (95% CI: 1.34–1.92, P < 0.001) forLDL-C higher than 3.12 mmol/L, 1.54 (95% CI: 1.29–1.84, P < 0.001) for non-HDL-C higher than 3.40 mmol/L and 1.54 (95% CI: 1.15–2.06, P = 0.003) for LDL-C/HDL-C ratio higher than 3.19 with significant adverseimpact on global cognitive decline (Fig. 2). Their effectsize changed only modestly without loss of significanceif APOE genotype was included in the model. Therefore,the number of APOE ε4 risk alleles did not modify theassociation of either cholesterol intake or serum choles-terol levels with risk of global cognitive decline (Table 2,Fig. 2).Table 3 demonstrated significant differences among
different educational groups regarding to cholesterol andegg intakes (P = 0.0001), serum TG (P = 0.0145), HDL-C(P = 0.0413) and ratio of LDL-C/HDL-C (P = 0.0089).Generally, subjects with more years of education hadmore dietary cholesterol and egg intake and higher ratioof LDL-C/HDL-C. Subanalysis were thus performed andthe whole population was stratified by different educa-tional groups (Table 4, Fig. 3). Table 4 showed thathigher serum cholesterol levels still increased risk ofaccelerated global cognitive decline generally but hadsome differences across different educational groups.Contrary to that, associations of dietary cholesterol andegg intake with cognitive decline in subanalysis differedfrom that in general analysis when being evaluated con-tinuously. Dietary cholesterol had a trend toward lower
risk of cognitive decline in Junior middle school groupbut higher risk in College and above group whereas eggintake was significantly associated with higher risk ofcognitive decline in both Senior middle school groupand College and above group.Findings from mixed-effects linear regression analyses
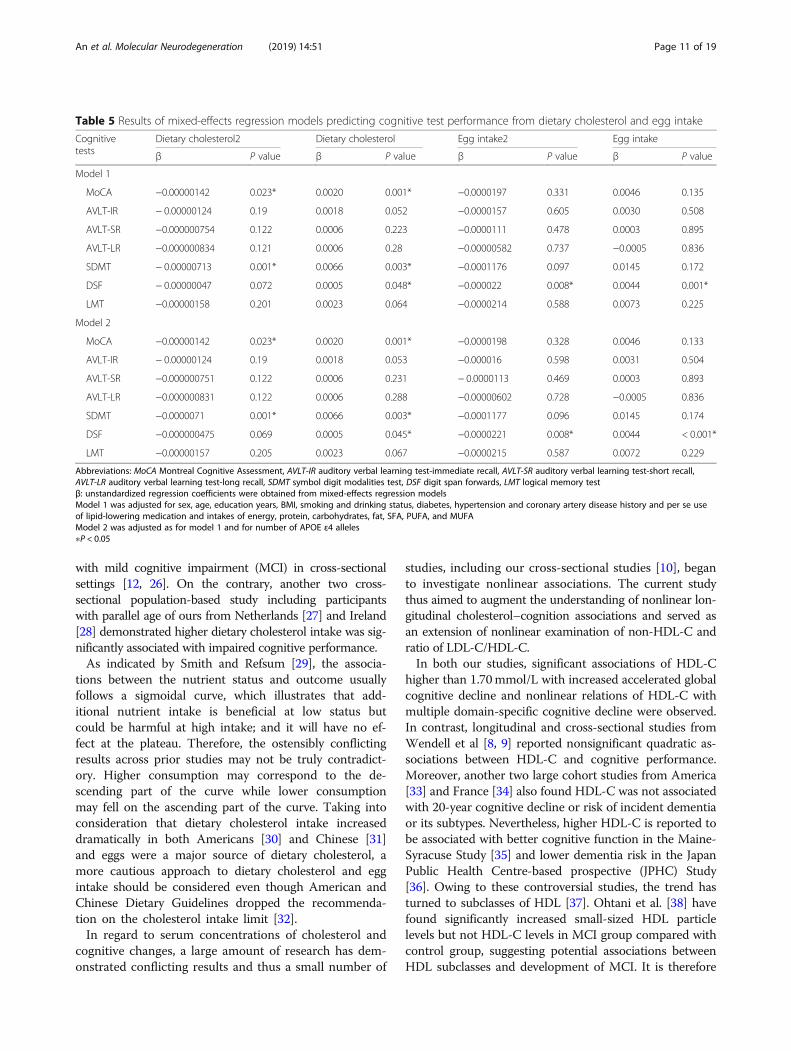
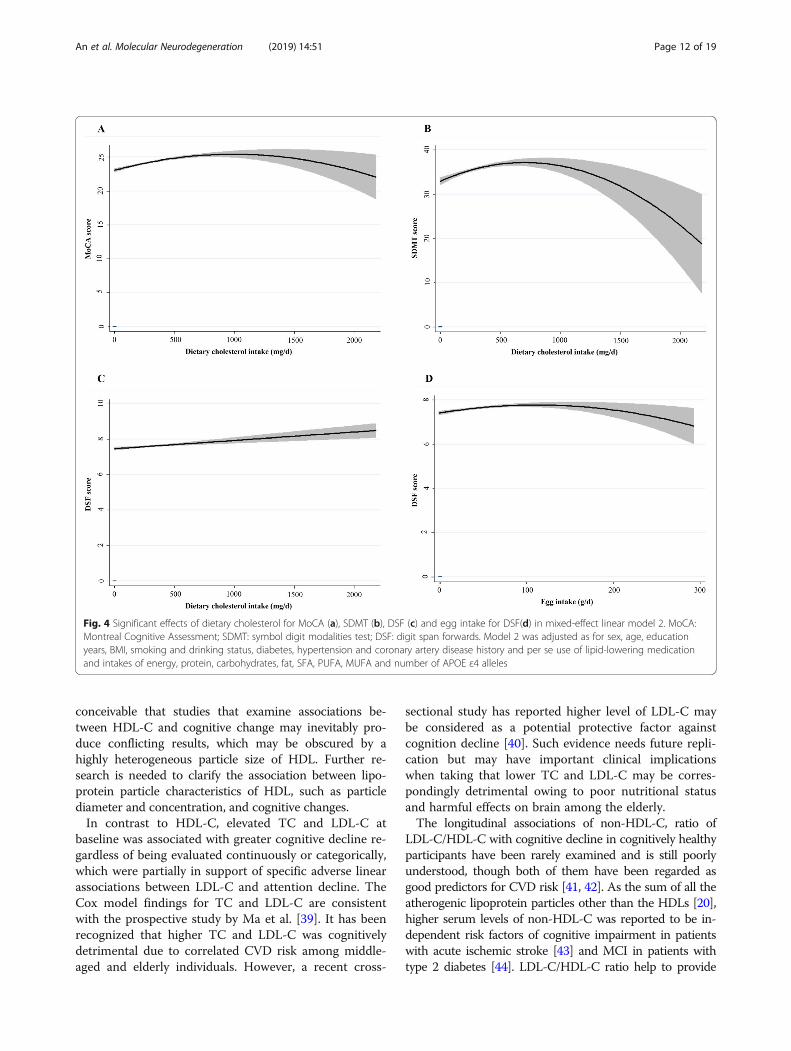
for dietary cholesterol and egg intake were shown inTable 5. Regarding nonlinear effects, significant longitu-dinal, quadratic effects of dietary cholesterol were identi-fied for MoCA (β = − 0.00000142, P = 0.023, Fig. 4a) andSDMT (β = − 0.00000713, P = 0.001, Fig. 4b) and egg intakefor DSF (β = − 0.000022, P = 0.008, Fig. 4d). Besides, posi-tive linear associations of dietary cholesterol were identifiedfor DSF (β = 0.005, P = 0.048, Fig. 4c). Table 6 demon-strated nonlinear or linear longitudinal associations ofserum cholesterol with cognitive outcomes. No quadraticassociations of TC, TG and Non-HDL-C with cognitivedecline were observed. When it comes to HDL-C, mixed-effect linear models revealed significant U-shaped effects ofHDL-C on AVLT-LR (β = 0.514, P = 0.045, Fig. 5a). Simi-larly, U-shaped patterns of ratio of LDL-C/HDL-C werealso identified for AVLT-SR (β = 0.054, P = 0.032, Fig. 5e)and AVLT-LR (β = 0.054, P = 0.032, Fig. 5f). Besides,inverted U-shaped effects of HDL-C for SDMT (β = −3.046, P = 0.004, Fig. 5b) and DSF (β = − 0.342, P = 0.006,Fig. 5c) were also identified, such that participants per-formed better at midrange HDL-C than at high and lowlevels. In Sion, the models also revealed adverse linearlongitudinal effects of LDL-C for LMT (β = − 1.099, P =0.028, Fig. 5g) and ratio of LDL-C/HDL-C for AVLT-IR(β = − 0.547, P = 0.047, Fig. 5d). Further adjustment ofnumber of APOE ε4 risk alleles did not modify theseassociations. No significant effects arose for the remain-der of serum cholesterol and cognitive tests.
Table 1 Baseline characteristics according to cholesterol intakes in 2514 participants in the EMCOA (Continued)
Cholesterol intake quartile, mg/d P value
Q1(< 188) Q2 (188–283) Q3 (283–385) Q4 (> 385)
Baseline Cognitive Performance
MoCA 24 (22, 26) 25 (22, 26) 25 (22, 27) 26 (24, 27) < 0.001*
AVLT-IR 14 (11, 18) 14 (11, 18) 15 (12, 18) 15 (12, 19) 0.004*
AVLT-SR 5 (3, 7) 5 (3, 7) 5 (3, 7) 5 (4, 7) 0.154
AVLT-LR 4 (2, 6) 4 (2, 6) 4 (2, 6) 4 (3, 6) 0.087
SDMT 32 (25, 40) 34 (28, 41) 34 (26, 42) 35 (29, 44) < 0.001*
DSF 8 (7, 8) 8 (7, 9) 8 (7, 9) 8 (7, 9) < 0.001*
LMT 9.5 (5.5, 14.0) 10.0 (6.0, 14.0) 11.0 (6.5, 15.0) 11.0 (7.5, 15.0) < 0.001*
Abbreviations: MoCA Montreal Cognitive Assessment, AVLT-IR auditory verbal learning test-immediate recall, AVLT-SR auditory verbal learning test-short recall,AVLT-LR auditory verbal learning test-long recall, SDMT symbol digit modalities test, LMT logical memory test, DSF digit span forwards, DSB digit span backwards,BMI body mass index, CHD coronary heart disease, TC total cholesterol, HDL-C high-density lipoprotein cholesterol, LDL-C low-density lipoprotein cholesterol, TGtriglycerides, Non-HDL-C non-high-density lipoprotein cholesterol, APOE apolipoprotein EData shown as median (interquartile range) were compared between 4 groups using Kruskal-Wallis rank test;Data shown as n (%) were compared between 4 groups using the chi-square test or Fisher’s exact test†All dietary nutrients and egg intake are energy adjusted according to the regression–residual method∗ P < 0.05
An et al. Molecular Neurodegeneration (2019) 14:51 Page 6 of 19

Subgroup analysis by educational groups differedgreatly from general analysis when it comes to nonlineareffects (Tables 7 and 8). U-shaped effects of serum mul-tiple cholesterol measurements (TC, TG, HDL-C, LDL-C and Non-HDL-C) for all the cognitive performanceexcept DSF were identified in Junior middle schoolgroup whereas only U-shaped effects of HDL-C and ra-tio of LDL-C/HDL-C for AVLT-SR and AVLT-LR
remain significant in Senior middle school group. More-over, only inverted U-shaped effects of HDL-C, LDL-Cand ratio of LDL-C/HDL-C for MoCA, AVLT-SR andSDMT were observed in College and above group. Nosignificant associations were demonstrated in Elemen-tary school group.To summarize the effects most clearly, plots (Fig. 4
and 5) were generated using the predicted cognitive test
Table 2 Risk of accelerated cognitive decline in dietary and serum cholesterol levels in 2514 participants in the EMCOA
Variables Model 1 Model 2
HR (95% CI) P value HR (95% CI) P value
Dietary cholesterol, mg/d 1.0002 (0.9995–1.0009) 0.59 1.0002 (0.9995–1.0009) 0.564
Q1(< 188) Ref Ref
Q2 (188–283) 0.93 (0.71–1.20) 0.558 0.93 (0.71–1.20) 0.569
Q3 (283–385) 1.08 (0.83–1.40) 0.571 1.10 (0.84–1.43) 0.488
Q4 (> 385) 1.18 (0.89–1.58) 0.256 1.19 (0.89–1.60) 0.231
Egg intake, g/d 1.002 (0.999–1.006) 0.128 1.003 (0.999–1.006) 0.111
Q1(< 21) Ref Ref
Q2 (21–45) 0.78 (0.61–1.01) 0.058 0.79 (0.61–1.02) 0.068
Q3 (45–60) 1.21 (0.95–1.55) 0.125 1.22 (0.96–1.56) 0.108
Q4 (> 60) 1.04 (0.81–1.33) 0.786 1.05 (0.82–1.35) 0.703
Serum cholesterol, mmol/L
TC, mmol/L 1.15 (1.06–1.26) 0.002* 1.15 (1.05–1.26) 0.002*
TC ≤ 5.20 mmol/L Ref Ref
TC > 5.20 mmol/L 1.26 (1.04–1.53) 0.020* 1.26 (1.03–1.53) 0.022*
TG, mol/L 0.96 (0.89–1.05) 0.382 0.96 (0.89–1.05) 0.377
TG≤ 1.70 mmol/L Ref Ref
TG > 1.70 mmol/L 1.02 (0.86–1.22) 0.798 1.02 (0.85–1.22) 0.818
HDL-C, mmol/L 1.31 (0.97–1.79) 0.083 1.31 (0.96–1.78) 0.088
1.70 ≥ HDL-C ≥ 1.04 mmol/L Ref Ref
HDL-C < 1.04 mmol/L 0.83 (0.66–1.05) 0.114 0.83 (0.66–1.05) 0.127
HDL-C > 1.70 mmol/L 1.37 (1.00–1.87) 0.048* 1.39 (1.02–1.90) 0.040*
LDL-C, mmol/L 1.26 (1.14–1.40) < 0.001* 1.26 (1.14–1.40) < 0.001*
LDL-C ≤ 3.12 mmol/L Ref Ref
LDL-C > 3.12 mmol/L 1.60 (1.34–1.92) < 0.001* 1.60 (1.34–1.92) < 0.001*
Non-HDL-C, mmol/L 1.15 (1.05–1.27) 0.004* 1.15 (1.05–1.27) 0.004*
Non-HDL-C < 3.4 mmol/L Ref Ref
Non-HDL-C ≥ 3.4 mmol/L 1.54 (1.29–1.84) < 0.001* 1.54 (1.29–1.84) < 0.001*
LDL-C/HDL-C 1.20 (1.07–1.34) 0.002* 1.20 (1.07–1.34) 0.002*
1.31 < LDL-C/HDL-C < 3.19 Ref Ref
LDL-C/HDL-C ≤ 1.31 1.10 (0.82–1.49) 0.521 1.11 (0.82–1.50) 0.506
LDL-C/HDL-C ≥ 3.19 1.54 (1.15–2.06) 0.003* 1.55 (1.16–2.07) 0.003*
Abbreviations: TC total cholesterol, HDL-C high-density lipoprotein cholesterol, LDL-C low-density lipoprotein cholesterol, TG triglycerides, Non-HDL-C non-high-density lipoprotein cholesterol, HR hazards ratioValues were obtained from Cox proportional hazards regression modelsModel 1 was adjusted for sex, age, education years, BMI, smoking and drinking status, diabetes, hypertension and coronary artery disease history and per se useof lipid-lowering medication and intakes of energy, protein, carbohydrates, fat, SFA, PUFA, and MUFAModel 2 was adjusted as for model 1 and for number of APOE ε4 alleles∗P < 0.05
An et al. Molecular Neurodegeneration (2019) 14:51 Page 7 of 19

scores associated with dietary cholesterol, egg intake andserum concentrations of cholesterol. Each graph depictedthe significant quadratic or linear, longitudinal relation-ship between cognitive performance and cholesterol levels.In general, the plots showed that both lower and highercholesterol/egg intakes were associated with poorercognitive performance of global cognition, processingspeed and executive function; serum concentrations ofHDL-C within reference range was associated withbetter processing speed and executive function. Add-itionally, short and long recall of verbal memory wasperformed best at high and low levels of HDL-C andLDL-C/HDL-C ratio than at midrange. Last but notleast, higher ratio of LDL-C/HDL-C and LDL-C levels
was adversely associated with immediate recall of ver-bal memory and attention decline.
DiscussionIn this prospective study of 2514 community-dwellingparticipants initially with normal cognitive performancein middle-aged and elderly, we showed that higher levelsof multiple cholesterol measurements were associatedwith higher risk of accelerated global cognitive decline.Moreover, we identified nonlinear or linear associationsof dietary and serum cholesterol with domain-specificcognitive decline. Distribution of APOE ε4 risk alleles inour Asian population did not modify their associations.Subanalysis by educational group further demonstrated
Fig. 2 Forest plot for Cox proportional hazards model1 and model 2. HR: hazards ratio; CI: confidence interval. Model 1 was adjusted for sex, age,education years, BMI, smoking and drinking status, diabetes, hypertension and coronary artery disease history and per se use of lipid-loweringmedication and intakes of energy, protein, carbohydrates, fat, SFA, PUFA, and MUFA. Model 2 was adjusted as for model 1 and for number ofAPOE ε4 alleles
Table 3 Comparison of dietary and serum cholesterol levels by different educational groups
Variables Elementary school(n = 418)
Junior middle school(n = 925)
Senior middle school(n = 764)
College and above(n = 407)
P value
Dietary cholesterol, mg/d 255.5 (160.3, 367.0) 262.2 (176.5, 370.2) 296.0 (207.8, 392.7) 327.7 (212.8, 412.2) 0.0001*
Egg intake, g/d 39.6 (18.3, 59.5) 35.8 (18.3, 59.0) 48.4 (23.7, 60.4) 52.8 (25.8, 60.9) 0.0001*
TC, mmol/L 4.61 (3.90, 5.20) 4.51 (3.80, 5.28) 4.53 (3.78, 5.20) 4.62 (3.83, 5.30) 0.518
TG, mol/L 1.40 (1.00, 1.90) 1.48 (1.02, 2.05) 1.49 (1.10, 2.15) 1.45 (1.07, 2.10) 0.0145*
HDL-C, mmol/L 1.30 (1.10, 1.50) 1.27 (1.10, 1.50) 1.24 (1.09, 1.43) 1.26 (1.10, 1.47) 0.0413*
LDL-C, mmol/L 2.80 (2.24, 3.30) 2.76 (2.13, 3.30) 2.76 (2.20, 3.39) 2.86 (2.27, 3.44) 0.0962
Non-HDL-C, mmol/L 3.29 (2.70, 3.83) 3.22 (2.61, 3.85) 3.25 (2.56, 3.88) 3.26 (2.72, 3.95) 0.5925
LDL-C/HDL-C 2.13 (1.72, 2.57) 2.15 (1.67, 2.67) 2.22 (1.73, 2.75) 2.25 (1.75, 2.77) 0.0089*
Abbreviations: TC total cholesterol, HDL-C high-density lipoprotein cholesterol, LDL-C low-density lipoprotein cholesterol, TG triglycerides, Non-HDL-C non-high-density lipoprotein cholesterolElementary school: ≤6 years of education; Junior middle school: 7–9 years of education; Senior middle school: 10–12 years of education; College and above: atleast college or university; ≥13 years of education)∗P < 0.05
An et al. Molecular Neurodegeneration (2019) 14:51 Page 8 of 19

Table
4Subanalysisforriskof
acceleratedcogn
itive
declinein
dietaryandserum
cholesterollevelsby
different
educationalg
roup
sVariables
Elem
entary
scho
ol(n=418)
Junior
middlescho
ol(n=925)
Senior
middlescho
ol(n=764)
College
andabove
(n=407)
HR(95%
CI)
Pvalue
HR(95%
CI)
Pvalue
HR(95%
CI)
Pvalue
HR(95%
CI)
Pvalue
Dietary
cholesterol,mg/d
1.002(0.9999–1.0034)
0.063
0.999(0.998–0.99998)
0.046*
1.001(0.999–1.003)
0.077
1.002(1.000–1.003)
0.041*
Q1(<188)
Ref
Ref
Ref
Ref
Q2(188–283)
1.16
(0.60–2.24)
0.666
1.12
(0.75–1.67)
0.57
0.67
(0.38–1.16)
0.153
0.66
(0.31–1.40)
0.276
Q3(283–385)
1.21
(0.60–2.43)
0.596
0.77
(0.49–1.22)
0.269
1.30
(0.78–2.16)
0.309
1.72
(0.90–3.27)
0.098
Q4(>
385)
1.97
(0.95–4.11)
0.07
0.90
(0.54–1.48)
0.667
1.47
(0.85–2.56)
0.171
1.49
(0.72–3.11)
0.287
Eggintake,g
/d1.006(0.998–1.014)
0.119
0.996(0.991–1.001)
0.155
1.008(1.002–1.014)
0.013*
1.010(1.001–1.018)
0.020*
Q1(<21)
Ref
Ref
Ref
Ref
Q2(21–45)
0.92
(0.47–1.80)
0.817
0.71
(0.48–1.04)
0.076
0.86
(0.50–1.46)
0.572
0.72
(0.37–1.41)
0.337
Q3(45–60)
1.72
(0.90–3.28)
0.103
0.87
(0.57–1.33)
0.527
1.50
(0.90–2.47)
0.116
1.02
(0.55–1.87)
0.96
Q4(>
60)
1.18
(0.61–2.26)
0.623
0.73
(0.48–1.10)
0.128
1.58
(0.95–2.62)
0.08
1.79
(0.97–3.29)
0.062
Serum
cholesterol,mmol/L
TC,m
mol/L
1.42
(1.10–1.82)
0.006*
1.06
(0.91–1.25)
0.433
1.08
(0.93–1.26)
0.313
1.258(1.002–1.578)
0.048*
TC≤5.20
mmol/L
Ref
Ref
Ref
Ref
TC>5.20
mmol/L
2.00
(1.25–3.21)
0.004*
0.97
(0.69–1.37)
0.868
1.10
(0.75–1.62)
0.638
1.82
(1.12–2.94)
0.015*
TG,m
ol/L
0.86
(0.68–1.08)
0.183
0.97
(0.85–1.10)
0.622
0.96
(0.82–1.13)
0.643
0.97
(0.80–1.19)
0.783
TG≤1.70
mmol/L
Ref
Ref
Ref
Ref
TG>1.70
mmol/L
0.94
(0.58–1.50)
0.786
0.95
(0.70–1.28)
0.742
1.13
(0.80–1.58)
0.491
0.91
(0.58–1.42)
0.669
HDL-C,m
mol/L
1.88
(0.95–3.74)
0.071
0.99
(0.60–1.64)
0.977
1.13
(0.61–2.09)
0.705
1.73
(0.78–3.82)
0.177
1.70
≥HDL-C≥1.04
mmol/L
Ref
Ref
Ref
Ref
HDL-C<1.04
mmol/L
1.28
(0.71–2.32)
0.414
0.98
(0.68–1.42)
0.922
0.62
(0.39–1.002)
0.051
0.67
(0.38–1.19)
0.169
HDL-C>1.70
mmol/L
2.29
(1.23–4.27)
0.009*
1.25
(0.75–2.08)
0.399
0.91
(0.43–1.94)
0.806
1.14
(0.47–2.76)
0.763
LDL-C,m
mol/L
1.56
(1.16–2.10)
0.003*
1.18
(0.98–1.42)
0.076
1.23
(1.03–1.45)
0.020*
1.32
(1.02–1.70)
0.032*
LDL-C≤3.12
mmol/L
Ref
Ref
Ref
Ref
LDL-C>3.12
mmol/L
2.71
(1.71–4.29)
<0.001*
1.34
(0.98–1.83)
0.07
1.57
(1.12–2.21)
0.009*
1.81
(1.16–2.82)
0.008*
Non
-HDL-C,m
mol/L
1.40
(1.06–1.85)
0.019*
1.08
(0.91–1.27)
0.394
1.09
(0.92–1.28)
0.325
1.25
(0.97–1.59)
0.081
Non
-HDL-C<3.4mmol/L
Ref
Ref
Ref
Ref
Non
-HDL-C≥3.4mmol/L
2.06
(1.29–3.31)
0.003*
1.28
(0.95–1.73)
0.098
1.55
(1.11–2.16)
0.010*
1.79
(1.16–2.77)
0.009*
LDL-C/HDL-C
1.30
(0.94–1.80)
0.108
1.23
(0.99–1.53)
0.065
1.18
(0.98–1.42)
0.077
1.13
(0.85–1.52)
0.405
1.31
<LD
L-C/HDL-C<3.19
Ref
Ref
Ref
Ref
LDL-C/HDL-C≤1.31
1.43
(0.66–3.09)
0.363
1.15
(0.73–1.80)
0.544
0.84
(0.42–1.71)
0.636
1.25
(0.57–2.73)
0.583
LDL-C/HDL-C≥3.19
1.89
(0.73–4.89)
0.19
2.02
(1.20–3.42)
0.008*
1.36
(0.83–2.21)
0.219
1.20
(0.62–2.30)
0.589
Abb
reviations:TCtotalcho
lesterol,H
DL-Chigh
-den
sity
lipop
rotein
cholesterol,LD
L-Clow-den
sity
lipop
rotein
cholesterol,TG
triglycerid
es,N
on-HDL-Cno
n-high
-den
sity
lipop
rotein
cholesterol,HRha
zardsratio
Values
wereob
tained
from
Cox
prop
ortio
nalh
azards
regression
mod
elsad
justed
forsex,ag
e,BM
I,sm
okingan
ddrinking
status,d
iabe
tes,hy
perten
sion
andcorona
ryartery
diseasehistoryan
dpe
rse
useof
lipid-lo
wering
med
icationan
dintakesof
energy
,protein,carbo
hydrates,fat,SFA
,PUFA
,MUFA
andnu
mbe
rof
APO
Eε4
alleles
Elem
entary
scho
ol:≤
6yearsof
education;
Junior
middlescho
ol:7
–9yearsof
education;
Senior
middlescho
ol:1
0–12
yearsof
education;
College
andab
ove:
atleastcollege
orun
iversity;≥
13yearsof
education)
∗P<0.05
An et al. Molecular Neurodegeneration (2019) 14:51 Page 9 of 19

education-specific associations between cholesterol andcognition. This is, to our knowledge, the first report ofnonlinear relations of both dietary and serum concentra-tions of cholesterol to longitudinal changes in cognitiveperformance.Since the 2015–2020 Dietary Guidelines for Americans
issued 2 seemingly contradictory statements concernedwith dietary cholesterol [24], the worldwide controversyof dietary cholesterol has intensified primarily due tosparse data from human studies as well as contradictoryconclusions resulting from between-study heterogeneity.It may not be applicable to follow the American dietaryguidelines without regard to native conditions. Underthe circumstances, the EMCOA study was conducted to
investigate the impacts of dietary and serum cholesterolin middle-aged and elderly Chinese.There are only two longitudinal human studies concern-
ing the impact of dietary cholesterol on cognitive dysfunc-tion but neither the risk of incident AD or dementia inKuopio Ischaemic Heart Disease Risk Factor Study (KIHD)[2] nor cognitive decline in the Chicago Health and AgingProject (CHAP) [25] was associated with dietary cholesterolintake. In line with the results from aforementioned cohortstudies, our longitudinal findings also report a non-significant association between dietary cholesterol/egg con-sumption and accelerated global cognitive decline with orwithout APOE adjustment. However, our previous studieshave shown a beneficial association of dietary cholesterol
Fig. 3 Forest plot of subanalysis for Elementary school (a), Junior middle school (b), Senior middle school (c), College and above (d) in Coxproportional hazards. HR: hazards ratio; CI: confidence interval
An et al. Molecular Neurodegeneration (2019) 14:51 Page 10 of 19
with mild cognitive impairment (MCI) in cross-sectionalsettings [12, 26]. On the contrary, another two cross-sectional population-based study including participantswith parallel age of ours from Netherlands [27] and Ireland[28] demonstrated higher dietary cholesterol intake was sig-nificantly associated with impaired cognitive performance.As indicated by Smith and Refsum [29], the associa-
tions between the nutrient status and outcome usuallyfollows a sigmoidal curve, which illustrates that add-itional nutrient intake is beneficial at low status butcould be harmful at high intake; and it will have no ef-fect at the plateau. Therefore, the ostensibly conflictingresults across prior studies may not be truly contradict-ory. Higher consumption may correspond to the de-scending part of the curve while lower consumptionmay fell on the ascending part of the curve. Taking intoconsideration that dietary cholesterol intake increaseddramatically in both Americans [30] and Chinese [31]and eggs were a major source of dietary cholesterol, amore cautious approach to dietary cholesterol and eggintake should be considered even though American andChinese Dietary Guidelines dropped the recommenda-tion on the cholesterol intake limit [32].In regard to serum concentrations of cholesterol and
cognitive changes, a large amount of research has dem-onstrated conflicting results and thus a small number of
studies, including our cross-sectional studies [10], beganto investigate nonlinear associations. The current studythus aimed to augment the understanding of nonlinear lon-gitudinal cholesterol–cognition associations and served asan extension of nonlinear examination of non-HDL-C andratio of LDL-C/HDL-C.In both our studies, significant associations of HDL-C
higher than 1.70mmol/L with increased accelerated globalcognitive decline and nonlinear relations of HDL-C withmultiple domain-specific cognitive decline were observed.In contrast, longitudinal and cross-sectional studies fromWendell et al [8, 9] reported nonsignificant quadratic as-sociations between HDL-C and cognitive performance.Moreover, another two large cohort studies from America[33] and France [34] also found HDL-C was not associatedwith 20-year cognitive decline or risk of incident dementiaor its subtypes. Nevertheless, higher HDL-C is reported tobe associated with better cognitive function in the Maine-Syracuse Study [35] and lower dementia risk in the JapanPublic Health Centre-based prospective (JPHC) Study[36]. Owing to these controversial studies, the trend hasturned to subclasses of HDL [37]. Ohtani et al. [38] havefound significantly increased small-sized HDL particlelevels but not HDL-C levels in MCI group compared withcontrol group, suggesting potential associations betweenHDL subclasses and development of MCI. It is therefore
Table 5 Results of mixed-effects regression models predicting cognitive test performance from dietary cholesterol and egg intake
Cognitivetests
Dietary cholesterol2 Dietary cholesterol Egg intake2 Egg intake
β P value β P value β P value β P value
Model 1
MoCA −0.00000142 0.023* 0.0020 0.001* −0.0000197 0.331 0.0046 0.135
AVLT-IR − 0.00000124 0.19 0.0018 0.052 −0.0000157 0.605 0.0030 0.508
AVLT-SR −0.000000754 0.122 0.0006 0.223 −0.0000111 0.478 0.0003 0.895
AVLT-LR −0.000000834 0.121 0.0006 0.28 −0.00000582 0.737 −0.0005 0.836
SDMT − 0.00000713 0.001* 0.0066 0.003* −0.0001176 0.097 0.0145 0.172
DSF − 0.00000047 0.072 0.0005 0.048* −0.000022 0.008* 0.0044 0.001*
LMT −0.00000158 0.201 0.0023 0.064 −0.0000214 0.588 0.0073 0.225
Model 2
MoCA −0.00000142 0.023* 0.0020 0.001* −0.0000198 0.328 0.0046 0.133
AVLT-IR − 0.00000124 0.19 0.0018 0.053 −0.000016 0.598 0.0031 0.504
AVLT-SR −0.000000751 0.122 0.0006 0.231 − 0.0000113 0.469 0.0003 0.893
AVLT-LR −0.000000831 0.122 0.0006 0.288 −0.00000602 0.728 −0.0005 0.836
SDMT −0.0000071 0.001* 0.0066 0.003* −0.0001177 0.096 0.0145 0.174
DSF −0.000000475 0.069 0.0005 0.045* −0.0000221 0.008* 0.0044 < 0.001*
LMT −0.00000157 0.205 0.0023 0.067 −0.0000215 0.587 0.0072 0.229
Abbreviations: MoCA Montreal Cognitive Assessment, AVLT-IR auditory verbal learning test-immediate recall, AVLT-SR auditory verbal learning test-short recall,AVLT-LR auditory verbal learning test-long recall, SDMT symbol digit modalities test, DSF digit span forwards, LMT logical memory testβ: unstandardized regression coefficients were obtained from mixed-effects regression modelsModel 1 was adjusted for sex, age, education years, BMI, smoking and drinking status, diabetes, hypertension and coronary artery disease history and per se useof lipid-lowering medication and intakes of energy, protein, carbohydrates, fat, SFA, PUFA, and MUFAModel 2 was adjusted as for model 1 and for number of APOE ε4 alleles∗P < 0.05
An et al. Molecular Neurodegeneration (2019) 14:51 Page 11 of 19
conceivable that studies that examine associations be-tween HDL-C and cognitive change may inevitably pro-duce conflicting results, which may be obscured by ahighly heterogeneous particle size of HDL. Further re-search is needed to clarify the association between lipo-protein particle characteristics of HDL, such as particlediameter and concentration, and cognitive changes.In contrast to HDL-C, elevated TC and LDL-C at
baseline was associated with greater cognitive decline re-gardless of being evaluated continuously or categorically,which were partially in support of specific adverse linearassociations between LDL-C and attention decline. TheCox model findings for TC and LDL-C are consistentwith the prospective study by Ma et al. [39]. It has beenrecognized that higher TC and LDL-C was cognitivelydetrimental due to correlated CVD risk among middle-aged and elderly individuals. However, a recent cross-
sectional study has reported higher level of LDL-C maybe considered as a potential protective factor againstcognition decline [40]. Such evidence needs future repli-cation but may have important clinical implicationswhen taking that lower TC and LDL-C may be corres-pondingly detrimental owing to poor nutritional statusand harmful effects on brain among the elderly.The longitudinal associations of non-HDL-C, ratio of
LDL-C/HDL-C with cognitive decline in cognitively healthyparticipants have been rarely examined and is still poorlyunderstood, though both of them have been regarded asgood predictors for CVD risk [41, 42]. As the sum of all theatherogenic lipoprotein particles other than the HDLs [20],higher serum levels of non-HDL-C was reported to be in-dependent risk factors of cognitive impairment in patientswith acute ischemic stroke [43] and MCI in patients withtype 2 diabetes [44]. LDL-C/HDL-C ratio help to provide
Fig. 4 Significant effects of dietary cholesterol for MoCA (a), SDMT (b), DSF (c) and egg intake for DSF(d) in mixed-effect linear model 2. MoCA:Montreal Cognitive Assessment; SDMT: symbol digit modalities test; DSF: digit span forwards. Model 2 was adjusted as for sex, age, educationyears, BMI, smoking and drinking status, diabetes, hypertension and coronary artery disease history and per se use of lipid-lowering medicationand intakes of energy, protein, carbohydrates, fat, SFA, PUFA, MUFA and number of APOE ε4 alleles
An et al. Molecular Neurodegeneration (2019) 14:51 Page 12 of 19

Table
6Results
ofmixed
-effectsregression
mod
elspred
ictin
gcogn
itive
testpe
rform
ance
from
serum
cholesterol
Cog
nitive
tests
TC2
TCTG
2TG
HDL-C2
HDL-C
LDL-C2
LDL-C
Non
-HDL-C2
Non
-HDL-C
LDL-C/HDL-C2
LDL-C/HDL-C
ββ
ββ
ββ
ββ
ββ
ββ
Mod
el1
MoC
A0.024
−0.210
−0.002
−0.020
0.208
−0.234
0.020
−0.179
0.007
−0.067
0.021
−0.269
AVLT-IR
0.016
−0.157
0.000
−0.012
0.353
−0.677
0.094
−0.748
0.018
−0.159
0.050
−0.547*
AVLT-SR
0.014
−0.163
0.005
−0.034
0.270
−0.619
0.038
−0.337
0.018
−0.169
0.054*
−0.415*
AVLT-LR
0.021
−0.213
0.002
0.007
0.514*
−1.362
0.038
−0.337
0.025
−0.200
0.06*
−0.401*
SDMT
−0.096
0.655
0.008
−0.130
−3.046*
8.662*
−0.248
1.181
−0.161
0.797
−0.147
0.311
DSF
−0.009
0.091
−0.002
0.010
−0.342*
1.008*
−0.015
0.096
−0.023
0.167
−0.019
0.084
LMT
0.071
−0.848
−0.011
0.171
0.661
−2.015
0.133
−1.099*
0.053
−0.544
0.023
−0.457
Mod
el2
MoC
A0.024
−0.216
−0.003
−0.018
0.209
−0.240
0.020
−0.183
0.008
−0.070
0.021
−0.269
AVLT-IR
0.018
−0.178
0.000
−0.009
0.358
−0.699
0.097
−0.767
0.020
−0.169
0.051
−0.553*
AVLT-SR
0.016
−0.183
0.005
−0.032
0.275
−0.640
0.041
−0.356
0.019
−0.180
0.055*
−0.423*
AVLT-LR
0.022
−0.230
0.002
0.009
0.518*
−1.380
0.048
−0.375
0.026
−0.209
0.061*
−0.409*
vSDMT
−0.094
0.620
0.008
−0.130
−3.036*
8.627*
−0.243
1.141
−0.160
0.780
−0.143
0.282
DSF
−0.009
0.092
−0.002
0.011
−0.343*
1.008*
−0.015
0.098
−0.023
0.167
−0.020
0.088
LMT
0.073
−0.868
−0.011
0.170
0.667
−2.036
0.136
−1.123*
0.054
−0.554
0.026
−0.474
Abb
reviations:M
oCAMon
trealC
ognitiv
eAssessm
ent,AVLT-IR
auditory
verbal
learning
test-im
med
iate
recall,AVLT-SR
auditory
verbal
learning
test-sho
rtrecall,AVLT-LR
auditory
verbal
learning
test-lo
ngrecall,SD
MT
symbo
ldigitmod
alities
test,D
SFdigitspan
forw
ards,LMTlogicalm
emorytest,TCtotalcho
lesterol,H
DL-Chigh
-den
sity
lipop
rotein
cholesterol,LD
L-Clow-den
sity
lipop
rotein
cholesterol,TG
triglycerid
es,N
on-HDL-C
non-
high
-den
sity
lipop
rotein
cholesterol
β:un
stan
dardized
regression
coefficientswereob
tained
from
mixed
-effects
regression
mod
els
Mod
el1was
adjusted
forsex,ag
e,ed
ucationyears,BM
I,sm
okingan
ddrinking
status,d
iabe
tes,hy
perten
sion
andcorona
ryartery
diseasehistoryan
dpe
rse
useof
lipid-lo
weringmed
icationan
dintakesof
energy
,protein,
carboh
ydrates,fat,SFA,P
UFA
,and
MUFA
Mod
el2was
adjusted
asformod
el1an
dfornu
mbe
rof
APO
Eε4
alleles
∗P<0.05
An et al. Molecular Neurodegeneration (2019) 14:51 Page 13 of 19
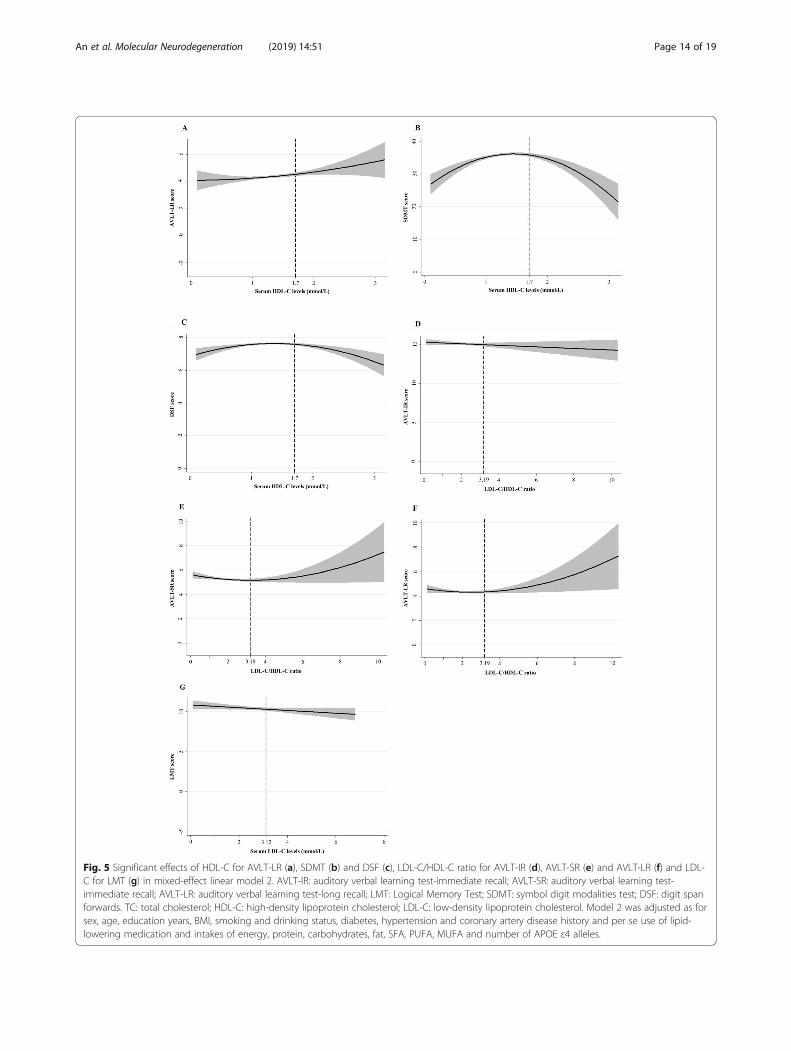
Fig. 5 Significant effects of HDL-C for AVLT-LR (a), SDMT (b) and DSF (c), LDL-C/HDL-C ratio for AVLT-IR (d), AVLT-SR (e) and AVLT-LR (f) and LDL-C for LMT (g) in mixed-effect linear model 2. AVLT-IR: auditory verbal learning test-immediate recall; AVLT-SR: auditory verbal learning test-immediate recall; AVLT-LR: auditory verbal learning test-long recall; LMT: Logical Memory Test; SDMT: symbol digit modalities test; DSF: digit spanforwards. TC: total cholesterol; HDL-C: high-density lipoprotein cholesterol; LDL-C: low-density lipoprotein cholesterol. Model 2 was adjusted as forsex, age, education years, BMI, smoking and drinking status, diabetes, hypertension and coronary artery disease history and per se use of lipid-lowering medication and intakes of energy, protein, carbohydrates, fat, SFA, PUFA, MUFA and number of APOE ε4 alleles.
An et al. Molecular Neurodegeneration (2019) 14:51 Page 14 of 19

an estimate of how much cholesterol is removed by HDLand delivered to plaques via LDL. We demonstrated in Coxmodels that both of non-HDL-C and ratio of LDL-C/HDL-C could act as readily available methods for estimating riskof accelerated global cognitive decline in middle-aged andelderly Chinese. Besides, we also revealed quadratic and
linear effects of LDL-C/HDL-C ratio with verbal memory,suggesting disordered cholesterol transport among athero-genic lipoprotein particles may be particularly detrimentalto verbal memory. Measurement of non-HDL-C and ratioof LDL-C/HDL-C can be calculated from a usual lipidpanel and consequently is simple and inexpensive. Where
Table 7 Subanalysis for results of mixed-effects regression models predicting cognitive test performance from dietary cholesteroland egg intake by different educational groups
Cognitivetests
Dietary cholesterol2 Dietary cholesterol Egg intake2 Egg intake
β P value β P value β P value β P value
Elementary school (n = 418)
MoCA 0.00000347 0.257 −0.004239 0.102 0.0000902 0.202 −0.020563 0.048*
AVLT-IR −0.00000105 0.746 −0.001233 0.654 0.0000432 0.56 −0.017803 0.107
AVLT-SR 0.00000115 0.501 −0.002667 0.067 0.0000348 0.375 −0.013017 0.026*
AVLT-LR 0.000000766 0.693 −0.002141 0.193 0.0000178 0.689 −0.011021 0.095
SDMT 0.00000511 0.519 −0.001092 0.87 0.0001744 0.342 −0.009431 0.726
DSF 0.000000705 0.537 −0.000568 0.557 0.00000138 0.958 −0.001005 0.796
LMT 0.00000044 0.933 −0.002083 0.641 0.0000577 0.624 −0.017358 0.328
Junior middle school (n = 925)
MoCA −0.00000223 0.064 0.002945 0.011* −0.0000345 0.167 0.0077031 0.087
AVLT-IR −0.00000349 0.062 0.004374 0.015* −0.0000191 0.622 0.0079525 0.255
AVLT-SR −0.00000199 0.038* 0.001977 0.032* −0.0000191 0.336 0.0032397 0.366
AVLT-LR −0.00000158 0.136 0.001501 0.138 −0.00000175 0.936 0.0001187 0.976
SDMT −0.0000127 0.002* 0.010674 0.005* −0.0001801 0.030* 0.0240724 0.108
DSF −0.000000446 0.378 0.000669 0.167 −0.000023 0.028* 0.0051033 0.007*
LMT −0.00000132 0.553 0.003593 0.091 −0.0000423 0.357 0.013091 0.114
Senior middle school (n = 764)
MoCA −0.00000155 0.075 0.002437 0.013* −0.00000089 0.988 0.0045697 0.483
AVLT-IR −0.00000141 0.336 0.002893 0.078 0.0000611 0.521 −0.001338 0.902
AVLT-SR −0.00000127 0.091 0.000801 0.342 −0.00000153 0.975 − 0.001089 0.845
AVLT-LR −0.00000132 0.112 0.000674 0.47 −0.0000122 0.822 0.0005769 0.926
SDMT −0.0000018 0.606 0.002899 0.459 0.00000761 0.973 0.0012421 0.962
DSF −0.000000936 0.011* 0.001025 0.013* − 0.0000315 0.184 0.0068822 0.011*
LMT −0.00000268 0.183 0.002725 0.226 0.0000091 0.944 0.0061439 0.679
College and above (n = 407)
MoCA −0.0000011 0.511 0.001583 0.309 −0.0001057 0.052 0.0134549 0.053
AVLT-IR −0.00000213 0.544 0.001039 0.75 − 0.0002722 0.016* 0.0243167 0.092
AVLT-SR 0.000000363 0.839 0.000177 0.915 −0.0000809 0.16 0.0097477 0.186
AVLT-LR 0.000000472 0.811 0.000178 0.923 −0.0000889 0.162 0.0101086 0.214
SDMT 0.00000371 0.662 −0.005496 0.486 − 0.0000766 0.778 − 0.012119 0.728
DSF −0.000000251 0.782 −0.000251 0.766 −0.0000345 0.241 0.0033226 0.378
LMT 0.00000291 0.47 −0.001744 0.639 −0.0001277 0.332 0.0196316 0.242
Abbreviations: MoCA Montreal Cognitive Assessment, AVLT-IR auditory verbal learning test-immediate recall, AVLT-SR auditory verbal learning test-short recall,AVLT-LR auditory verbal learning test-long recall, SDMT symbol digit modalities test, DSF digit span forwards, LMT logical memory testβ: unstandardized regression coefficients were obtained from mixed-effects regression models adjusted for sex, age, BMI, smoking and drinking status, diabetes,hypertension and coronary artery disease history and per se use of lipid-lowering medication, number of APOE ε4 alleles and intakes of energy, protein,carbohydrates, fat, SFA, PUFA, and MUFAElementary school: ≤6 years of education; Junior middle school: 7–9 years of education; Senior middle school: 10–12 years of education; College and above: atleast college or university; ≥13 years of education)∗P < 0.05
An et al. Molecular Neurodegeneration (2019) 14:51 Page 15 of 19

possible, their evaluation is needed as targets for interven-tion to reduce the risk of cognitive impairment.Genetic variability of APOE is dependent on three
alleles: ε2, ε3 and ε4, which combine to form six geno-types. It has been established that carriers of APOE ε4
have a greater risk of developing AD while APOE ε2 isconsidered protective [45]. However, the extent towhich APOE genotype modulates associations of diet-ary cholesterol/egg intakes and serum cholesterol levelswith cognitive decline remains relatively unknown. Our
Table 8 Subanalysis for results of mixed-effects regression models predicting cognitive test performance from serum cholesterol bydifferent educational groups
Cognitivetests
TC2 TC TG2 TG HDL-C2 HDL-C LDL-C2 LDL-C Non-HDL-C2 Non-HDL-C LDL-C/HDL-C2 LDL-C/HDL-C
β β β β β β β β β β β β
Elementary school (n = 418)
MoCA − 0.128 1.102 − 0.072 0.366 1.411 −3.634 − 0.208 1.016 − 0.191 1.103 − 0.099 0.232
AVLT-IR −0.027 0.205 0.037 − 0.287 0.071 0.002 −0.029 − 0.025 − 0.079 0.445 − 0.010 − 0.225
AVLT-SR − 0.055 0.503 0.011 − 0.036 − 0.525 1.604 − 0.053 0.266 − 0.100 0.646 − 0.030 0.042
AVLT-LR −0.061 0.599 − 0.018 0.115 −0.129 0.462 −0.102 0.630 −0.124 0.861 −0.044 0.208
SDMT 0.093 −1.779 − 0.210 0.802 −1.413 4.817 0.072 −1.138 0.026 −1.357 0.038 −1.229
DSF −0.030 0.254 −0.010 0.106 −0.127 0.271 −0.088 0.468 −0.065 0.419 −0.106 0.513
LMT 0.259 −2.713 −0.110 1.212 2.315 −7.679 0.265 −2.009 0.052 −0.485 0.043 −0.343
Junior middle school (n = 925)
MoCA 0.122* −1.150* −0.013 0.082 −0.108 0.598 0.149 −0.876 0.124* −0.869* 0.021 −0.241
AVLT-IR 0.164* −1.536* −0.010 0.149 0.936 −2.163 0.225 −1.515* 0.186* −1.306* 0.055 −0.646
AVLT-SR 0.083* −0.824* −0.001 0.058 0.762* −2.188* 0.143* −0.948* 0.101* −0.730* 0.155 −0.832*
AVLT-LR 0.067 −0.669 −0.008 0.164 0.935* −2.849* 0.149* −0.958* 0.095* −0.673* 0.177 −0.846
SDMT −0.011 −0.501 0.058* −0.833* −2.383 6.464 −0.167 0.455 −0.009 − 0.586 −0.418 1.403
DSF 0.010 −0.068 −0.004 0.005 −0.354 1.059 0.047 −0.223 −0.015 0.126 −0.014 0.081
LMT 0.104 −1.216 −0.017 0.148 0.927 −3.183 0.297* −1.925* 0.108 −0.940 −0.040 0.021
Senior middle school (n = 764)
MoCA 0.008 0.019 0.006 −0.037 0.080 −0.183 0.029 −0.194 − 0.036 0.364 0.026 −0.153
AVLT-IR 0.022 −0.195 0.004 0.040 1.178 −3.704 0.139 −1.063 −0.010 0.121 0.059 −0.432
AVLT-SR 0.037 −0.389 0.011 −0.109 1.560* −4.367* 0.038 −0.366 0.021 −0.184 0.062* −0.436*
AVLT-LR 0.061 −0.585 0.008 −0.001 1.712* −4.820* 0.062 −0.494 0.052 −0.348 0.069* −0.441
SDMT −0.133 1.337 −0.051 0.909 −1.483 3.480 −0.086 0.292 −0.303 2.237 −0.094 0.391
DSF 0.001 −0.010 −0.001 − 0.005 −0.192 0.654 −0.008 0.000 −0.018 0.121 −0.002 − 0.071
LMT 0.076 −0.858 −0.005 0.159 0.926 −2.362 0.142 −1.264 0.067 −0.624 0.095 −0.944
College and above (n = 407)
MoCA −0.026 0.237 0.025 −0.297 −0.796 2.968 −0.039 0.093 −0.031 0.140 −0.227* 0.747
AVLT-IR −0.173 1.613 −0.010 −0.145 −2.518 7.657 −0.168 0.901 −0.181 1.140 −0.325 1.223
AVLT-SR −0.084 0.790 −0.006 −0.047 −1.559* 4.756* −0.080 0.414 −0.080 0.499 −0.165 0.581
AVLT-LR −0.061 0.500 0.005 −0.196 −0.524 1.999 −0.044 0.150 −0.068 0.326 −0.047 − 0.051
SDMT −0.281 2.907 −0.105 0.899 −8.171* 23.727* −0.802* 4.809* −0.323 2.387 −1.086* 4.840
DSF −0.039 0.425 0.017 −0.130 −0.698 2.184* −0.065 0.454 −0.026 0.213 −0.069 0.338
LMT −0.006 −0.113 0.075 −0.658 −1.188 4.261 −0.108 0.327 0.014 −0.394 −0.460 1.599
Abbreviations: MoCA: Montreal Cognitive Assessment; AVLT-IR: auditory verbal learning test-immediate recall; AVLT-SR: auditory verbal learning test-short recall;AVLT-LR: auditory verbal learning test-long recall; SDMT: symbol digit modalities test; DSF: digit span forwards; LMT: logical memory test; TC: total cholesterol;HDL-C: high-density lipoprotein cholesterol; LDL-C: low-density lipoprotein cholesterol; TG: triglycerides; Non-HDL-C: non- high-density lipoprotein cholesterolβ: unstandardized regression coefficients were obtained from mixed-effects regression models adjusted for sex, age, BMI, smoking and drinking status, diabetes,hypertension and coronary artery disease history and per se use of lipid-lowering medication, number of APOE ε4 alleles and intakes of energy, protein,carbohydrates, fat, SFA, PUFA, and MUFAElementary school: ≤6 years of education; Junior middle school: 7–9 years of education; Senior middle school: 10–12 years of education; College and above: atleast college or university; ≥13 years of education)∗P < 0.05
An et al. Molecular Neurodegeneration (2019) 14:51 Page 16 of 19

step-wise investigation of potential role of confounderand modifier examined how the cholesterol-cognitionassociations may vary by APOE ε4. Similar to studies in1259 middle-aged and older men from Eastern Finland[2], the identified associations of cholesterol and cogni-tive decline were conserved after further adjusting forAPOE ε4 among a middle-aged and elderly Chinese,possibly due to prominent distribution of APOE ε3.The quantity of dietary cholesterol intake and serum
lipid profiles may be affected by socio-economic factors[46, 47]. Our analysis provided such evidence that chol-esterol/egg intakes and some serum cholesterol were notuniformly distributed across educational groups. Withrespect to consumption patterns, subjects with moreyears of education had more dietary cholesterol and eggintakes, which was different from older Australians withcomparable age (55–65) reported by Thorpe et al [48].They found those with higher consumption of red andprocessed meat had a lower level of education. When itcomes to serum cholesterol, the population with higherlevels of education presented a higher prevalence of al-tered cholesterol, inconsistent with Brazilian adult popula-tion aged 45 years old and older [49]. It may be attributedto the fact that participants aged 50–70 with lower educa-tion levels in our country, generally considered as lowersocioeconomic status, were more likely to do physicallyintensive jobs while those with higher education levelswere less likely to do physically active jobs and may beadapting unhealthy lifestyles. The subanalysis thus showeddifferential associations between cholesterol and cognitivefunction for different educational groups, which would behelpful to promote specific dietary instruction and lipidmanagement according to educational background.Strengths of this study include its longitudinal design,
analysis of nonlinear effects of both dietary and serumcholesterol with consideration of multiple fractions, useof extensive cognitive tests and including data on theAPOE genotype as well as per se use of a lipid-loweringmedication for participants and examination measuredin midlife, despite the fact that the median age of thiscohort was much younger than the usual age of onsetfor MCI from nearly any cause including AD. Besides,the limitation of this investigation also includes its rela-tively shorter follow-up.
ConclusionOur findings highlight the complicated roles of dietaryand serum cholesterol on cognitive decline in a particu-lar population of middle-aged and elderly Chinese. Dif-ferent cholesterol measurement appears to have varyingdegrees of associations for domain-specific achievementof better cognitive reserve. Therefore, interventions andpolicies regarding dietary instruction and lipid manage-ment must be tailored to address the specific challenges.
AbbreviationsAD: Alzheimer’s disease; APOE: Apolipoprotein E; AVLT: Auditory VerbalLearning Test; BMI: Body mass index; CHD: Coronary heart disease; DSF: DigitSpan Forward; EMCOA: Effects and Mechanism investigation of Cholesteroland Oxysterol on Alzheimer’s disease; FFQ: Food frequency questionnaire;HDL-C: High-density lipoprotein cholesterol; LDL-C: Low-density lipoproteincholesterol; LMT: Logical Memory Test; MoCA: Montreal CognitiveAssessment; non-HDL-C: Non-high-density lipoprotein cholesterol;SDMT: Symbol Digit Modalities Test; TC: Total cholesterol; TG: Triglycerides;WMS-RC: Wechsler Memory Scale—Revised, Chinese version
AcknowledgementsThe authors are indebted to Deqiang Zheng from Department ofEpidemiology and Health Statistics of Capital Medical University for theirstatistical advice.
Author contributionRX conceived and designed the study, YA performed the analyses and wrotethe manuscript. XZ, YW, YW, WL, TW and ZQ helped collect and analyze thedata. All authors read and approved the final manuscript.
FundingThis work was supported by the State Key Program of the National NaturalScience Foundation of China (Grant No. 81330065) and National NaturalScience Foundation of China (Grant No. 81673149).
Availability of data and materialsThe datasets during and/or analyzed during the current study available fromthe corresponding author on reasonable request.
Ethics approval and consent to participateThe study design was ethically approved by the Ethics Committee of CapitalMedical University (2013SY35). All participants were provided writteninformed consent at the beginning of the study.
Consent for publicationAll the co-authors and participants have given their consent for publicationin Molecular Neurodegeneration.
Competing interestsThe authors declare that they have no competing interests.
Author details1School of Public Health, Capital Medical University, No.10 Xitoutiao, You AnMen Wai, Beijing 100069, China. 2Jincheng People’s Hospital, Jincheng, China.
Received: 9 May 2019 Accepted: 16 December 2019
References1. Loera-Valencia R, Goikolea J, Parrado-Fernandez C, Merino-Serrais P, Maioli S.
Alterations in cholesterol metabolism as a risk factor for developingAlzheimer's disease: potential novel targets for treatment. J Steroid BiochemMol Biol. 2019;190:104–14.
2. Ylilauri MP, Voutilainen S, Lonnroos E, Mursu J, Virtanen HE, Koskinen TT,Salonen JT, Tuomainen TP, Virtanen JK. Association of dietary cholesteroland egg intakes with the risk of incident dementia or Alzheimer disease:the Kuopio Ischaemic heart disease risk factor study. Am J Clin Nutr. 2017;105(2):476–84.
3. Zhong VW, Van Horn L, Cornelis MC, Wilkins JT, Ning H, Carnethon MR,Greenland P, Mentz RJ, Tucker KL, Zhao L, et al. Associations of dietarycholesterol or egg consumption with incident cardiovascular disease andmortality. JAMA. 2019;321(11):1081–95.
4. de Bruijn RF, Ikram MA. Cardiovascular risk factors and future risk ofAlzheimer's disease. BMC Med. 2014;12:130.
5. Anstey KJ, Ashby-Mitchell K, Peters R. Updating the evidence on theassociation between serum cholesterol and risk of late-life dementia: reviewand meta-analysis. J Alzheimers Dis. 2017;56(1):215–28.
6. van Vliet P. Cholesterol and late-life cognitive decline. J Alzheimers Dis.2012;30(Suppl 2):S147–62.
An et al. Molecular Neurodegeneration (2019) 14:51 Page 17 of 19

7. Toro P, Degen C, Pierer M, Gustafson D, Schroder J, Schonknecht P.Cholesterol in mild cognitive impairment and Alzheimer's disease in a birthcohort over 14 years. Eur Arch Psychiatry Clin Neurosci. 2014;264(6):485–92.
8. Wendell CR, Waldstein SR, Zonderman AB. Nonlinear longitudinaltrajectories of cholesterol and neuropsychological function.NEUROPSYCHOLOGY. 2014;28(1):106–12.
9. Wendell CR, Zonderman AB, Katzel LI, Rosenberger WF, Plamadeala VV, HoseyMM, Waldstein SR. Nonlinear associations between plasma cholesterol levelsand neuropsychological function. Neuropsychology. 2016;30(8):980–7.
10. Lu Y, An Y, Yu H, Che F, Zhang X, Rong H, Xi Y, Xiao R. Sex-specificnonlinear associations between serum lipids and different domains ofcognitive function in middle to older age individuals. Metab Brain Dis. 2017;32(4):1089–97.
11. Vincent MJ, Allen B, Palacios OM, Haber LT, Maki KC. Meta-regressionanalysis of the effects of dietary cholesterol intake on LDL and HDLcholesterol. Am J Clin Nutr. 2019;109(1):7–16.
12. Lu Y, An Y, Guo J, Zhang X, Wang H, Rong H, Xiao R. Dietary intake ofnutrients and lifestyle affect the risk of mild cognitive impairment in theChinese elderly population: a cross-sectional study. Front Behav Neurosci.2016;10:229.
13. An Y, Feng L, Zhang X, Wang Y, Wang Y, Tao L, Lu Y, Qin Z, Xiao R. Patternsof cognitive function in middle-aged and elderly Chinese adults-findingsfrom the EMCOA study. Alzheimers Res Ther. 2018;10(1):93.
14. Nasreddine ZS, Phillips NA, Bedirian V, Charbonneau S, Whitehead V, Collin I,Cummings JL, Chertkow H. The Montreal cognitive assessment, MoCA: abrief screening tool for mild cognitive impairment. J Am Geriatr Soc. 2005;53(4):695–9.
15. Price KL, DeSantis SM, Simpson AN, Tolliver BK, McRae-Clark AL, Saladin ME,Baker NL, Wagner MT, Brady KT. The impact of clinical and demographicvariables on cognitive performance in methamphetamine-dependentindividuals in rural South Carolina. Am J Addict. 2011;20(5):447–55.
16. Ma J, Zhang Y, Guo Q. Comparison of vascular cognitive impairment--no dementia by multiple classification methods. Int J Neurosci. 2015;125(11):823–30.
17. Wang C, An Y, Yu H, Feng L, Liu Q, Lu Y, Wang H, Xiao R. Associationbetween exposure to the Chinese famine in different stages of early lifeand decline in cognitive functioning in adulthood. Front Behav Neurosci.2016;10:146.
18. Miu J, Negin J, Salinas-Rodriguez A, Manrique-Espinoza B, Sosa-Ortiz AL,Cumming R, Kowal P. Factors associated with cognitive function in olderadults in Mexico. Glob Health Action. 2016;9:30747.
19. Forouhi NG, Sharp SJ, Du H, van der A, DL HJ, Schulze MB, TjonnelandA, Overvad K, Jakobsen MU, Boeing H, et al. Dietary fat intake andsubsequent weight change in adults: results from the Europeanprospective investigation into Cancer and nutrition cohorts. Am J ClinNutr. 2009;90(6):1632–41.
20. Jacobson TA, Ito MK, Maki KC, Orringer CE, Bays HE, Jones PH, McKenneyJM, Grundy SM, Gill EA, Wild RA, et al. National lipid associationrecommendations for patient-centered management of dyslipidemia: part1--full report. J Clin Lipidol. 2015;9(2):129–69.
21. Zhang L, He S, Li Z, Gan X, Li S, Cheng X, Yang N, Zheng F. ApolipoproteinE polymorphisms contribute to statin response in Chinese ASCVD patientswith dyslipidemia. Lipids Health Dis. 2019;18(1):129.
22. Mrkobrada M, Chan M, Cowan D, Spence J, Campbell D, Wang CY, Torres D,Malaga G, Sanders RD, Brown C, et al. Rationale and design for thedetection and neurological impact of cerebrovascular events in non-cardiacsurgery patients cohort evaluation (NeuroVISION) study: a prospectiveinternational cohort study. BMJ Open. 2018;8(7):e21521.
23. Rajabli F, Feliciano BE, Celis K, Hamilton-Nelson KL, Whitehead PL, AdamsLD, Bussies PL, Manrique CP, Rodriguez A, Rodriguez V, et al. Ancestralorigin of ApoE epsilon4 Alzheimer disease risk in Puerto Rican and AfricanAmerican populations. PLoS Genet. 2018;14(12):e1007791.
24. Williams KS, Krause AJ, Shearer S, Devries S. The 2015 dietary guidelinesadvisory committee report concerning dietary cholesterol. Am J Cardiol.2015;116(9):1479–80.
25. Morris MC, Evans DA, Bienias JL, Tangney CC, Wilson RS. Dietary fat intakeand 6-year cognitive change in an older biracial community population.Neurology. 2004;62(9):1573–9.
26. Zhao X, Yuan L, Feng L, Xi Y, Yu H, Ma W, Zhang D, Xiao R. Association ofdietary intake and lifestyle pattern with mild cognitive impairment in theelderly. J Nutr Health Aging. 2015;19(2):164–8.
27. Kalmijn S, van Boxtel MP, Ocke M, Verschuren WM, Kromhout D, Launer LJ.Dietary intake of fatty acids and fish in relation to cognitive performance atmiddle age. Neurology. 2004;62(2):275–80.
28. Salerno-Kennedy R, Cashman KD. The relationship between nutrient intakeand cognitive performance in people at risk of dementia. Ir J Med Sci. 2007;176(3):193–8.
29. Smith AD, Refsum H. Homocysteine, B vitamins, and cognitive impairment.Annu Rev Nutr. 2016;36:211–39.
30. Xu Z, McClure ST, Appel LJ. Dietary Cholesterol Intake and Sources amongU. S Adults: Results from National Health and Nutrition Examination Surveys(NHANES), 2001(−)2014. Nutrients. 2018;10(6).
31. Su C, Jia X, Wang Z, Wang H, Zhang B. Trends in dietary cholesterol intakeamong Chinese adults: a longitudinal study from the China health andnutrition survey, 1991-2011. BMJ Open. 2015;5(6):e7532.
32. Zhu H, Chen ZY. Do we no longer need to worry about dietary cholesterol?J Agric Food Chem. 2017;65(46):9931–3.
33. Power MC, Rawlings A, Sharrett AR, Bandeen-Roche K, Coresh J, BallantyneCM, Pokharel Y, Michos ED, Penman A, Alonso A, et al. Association ofmidlife lipids with 20-year cognitive change: a cohort study. AlzheimersDement. 2018;14(2):167–77.
34. Schilling S, Tzourio C, Soumare A, Kaffashian S, Dartigues JF, Ancelin ML,Samieri C, Dufouil C, Debette S. Differential associations of plasma lipidswith incident dementia and dementia subtypes in the 3C study: alongitudinal, population-based prospective cohort study. PLoS Med. 2017;14(3):e1002265.
35. Crichton GE, Elias MF, Davey A, Sullivan KJ, Robbins MA. Higher HDLcholesterol is associated with better cognitive function: the Maine-Syracusestudy. J Int Neuropsychol Soc. 2014;20(10):961–70.
36. Svensson T, Sawada N, Mimura M, Nozaki S, Shikimoto R, Tsugane S. Theassociation between midlife serum high-density lipoprotein and mildcognitive impairment and dementia after 19 years of follow-up. TranslPsychiatry. 2019;9(1):26.
37. Verdoia M, Schaffer A, Suryapranata H, De Luca G. Effects of HDL-modifierson cardiovascular outcomes: a meta-analysis of randomized trials. NutrMetab Cardiovasc Dis. 2015;25(1):9–23.
38. Ohtani R, Nirengi S, Nakamura M, Murase N, Sainouchi M, Kuwata Y, TakataM, Masuda Y, Kotani K, Sakane N. High-density lipoprotein subclasses andmild cognitive impairment: study of outcome and aPolipoproteins indementia (STOP-dementia)1. J Alzheimers Dis. 2018;66(1):289–96.
39. Ma C, Yin Z, Zhu P, Luo J, Shi X, Gao X. Blood cholesterol in late-life andcognitive decline: a longitudinal study of the Chinese elderly. MolNeurodegener. 2017;12(1):24.
40. Zhou F, Deng W, Ding D, Zhao Q, Liang X, Wang F, Luo J, Zheng L, Guo Q,Hong Z. High low-density lipoprotein cholesterol inversely relates todementia in community-dwelling older adults: the Shanghai aging study.Front Neurol. 2018;9:952.
41. Carr SS, Hooper AJ, Sullivan DR, Burnett JR. Non-HDL-cholesterol andapolipoprotein B compared with LDL-cholesterol in atheroscleroticcardiovascular disease risk assessment. Pathology. 2019;51(2):148–54.
42. Greene CM, Zern TL, Wood RJ, Shrestha S, Aggarwal D, Sharman MJ, VolekJS, Fernandez ML. Maintenance of the LDL cholesterol: HDL cholesterol ratioin an elderly population given a dietary cholesterol challenge. J Nutr. 2005;135(12):2793–8.
43. Lu D, Li P, Zhou Y, Xu X, Zhang H, Liu L, Tian Z. Association between serumnon-high-density lipoprotein cholesterol and cognitive impairment inpatients with acute ischemic stroke. BMC Neurol. 2016;16(1):154.
44. Niu MJ, Yin FZ, Liu LX, Fang Y, Xuan XM, Wu GF. Non-high-densitylipoprotein cholesterol and other risk factors of mild cognitiveimpairment among Chinese type 2 diabetic patients. J DiabetesComplicat. 2013;27(5):443–6.
45. Wong M, Braidy N, Crawford J, Pickford R, Song F, Mather KA, Attia J,Brodaty H, Sachdev P, Poljak A. APOE genotype differentially modulatesplasma lipids in healthy older individuals, with relevance to brain health. JAlzheimers Dis. 2019.
46. Micha R, Khatibzadeh S, Shi P, Fahimi S, Lim S, Andrews KG, Engell RE, PowlesJ, Ezzati M, Mozaffarian D. Global, regional, and national consumption levels ofdietary fats and oils in 1990 and 2010: a systematic analysis including 266country-specific nutrition surveys. BMJ. 2014;348:g2272.
47. Dathan-Stumpf A, Vogel M, Rieger K, Thiery J, Hiemisch A, Kiess W. Serumlipid levels were related to socio-demographic characteristics in a Germanpopulation-based child cohort. Acta Paediatr. 2016;105(8):e360–7.
An et al. Molecular Neurodegeneration (2019) 14:51 Page 18 of 19
48. Thorpe MG, Milte CM, Crawford D, McNaughton SA. A comparison of thedietary patterns derived by principal component analysis and clusteranalysis in older Australians. Int J Behav Nutr Phys Act. 2016;13:30.
49. Malta DC, Szwarcwald CL, Machado IE, Pereira CA, Figueiredo AW, Sa A,Velasquez-Melendez G, Santos F, Souza JP, Stopa SR, et al. Prevalence ofaltered total cholesterol and fractions in the Brazilian adult population:National Health Survey. Rev Bras Epidemiol. 2019;22(Suppl 02):E190002–5.
Publisher’s NoteSpringer Nature remains neutral with regard to jurisdictional claims inpublished maps and institutional affiliations.
An et al. Molecular Neurodegeneration (2019) 14:51 Page 19 of 19


![Longitudinal Analysis of Serum Autoantibody-Reactivities ...€¦ · glaucoma types primary open angle glaucoma (POAG) is the most common form with a global prevalence of 3% [4, 5]](https://cdn.vdocuments.site/doc/165x107/5ff59a32c2b6af268a0fdba7/longitudinal-analysis-of-serum-autoantibody-reactivities-glaucoma-types-primary.jpg)


