
Fish Fauna Composition of Batang Kayan and Its Tributaries, Lundu, Sarawak
Timothy Henry Lansing (22545)
Bachelor of Science with Honours
(Aquatic Resource Science and Management)
2011
Faculty of Resource Science and Technology
LOGO UNIMAS
Fish Fauna Composition of Batang Kayan and Its Tributaries, Lundu, Sarawak
Timothy Henry Lansing
This project is submitted in partial fulfillment of the requirement for Degree of Bachelor of
Science with Honours (Aquatic Resource Science and Management)
Supervisor: Associate Professor Dr Lee Nyanti
Faculty of Resource Science and Technology
Universiti Malaysia Sarawak
2011

i
ACKNOWLEDGEMENT
Firstly, I would like to thank God for making all this possible. In particular, I wish
to express my sincere appreciation and thanks to my supervisor, Associate Professor Dr.
Lee Nyanti @ Janti ak Chukong for his encouragement, guidance, suggestions, advices,
motivation, and critics in finishing this project.
Thank you to Mr. Jongkar Grinang for his guidance and help in the fieldwork. My
sincere appreciation also extends to my colleagues Alvina Griffin, Michelle Christine,
Muhammad Omar Khaliffa bin Saiful Abdul Malik, Mohammad Hafifi Hafiz bin Ariffin,
and Nurul Hanim binti Adanan for being a great help during the fieldtrips and in giving
opinions, advices and moral support during the completion of this project. Of course, none
of my fieldwork would have been possible without the help of Mr. Mustafa Kamal and Mr.
Richard Toh, Department of Aquatic Science lab assistants and also Mr. Jiet, our boatman.
Without the help from all those mentioned, this project would not be completed in time.
A word of thousand thanks and gratitude to my family, especially my mother,
Marcella Christianus for the motivation, encouragement, inspiration and support in term of
moral and financial since I started this project especially during times of ups and downs. I
also would like to express my gratitude to Jessica Sylvester, for being understanding,
supportive and much more of a help during the completion of this project from the
beginning to the end. Not forgetting my housemates which supported me and being
understanding especially during the writing of this project.
Finally, a sincere gratitude to all that I might have forgotten to mention here who
have contributed directly or indirectly to the completion of this project.

ii
DECLARATION
No portion of the work referred to in this dissertation has been submitted in support of an
application for another degree qualification of this any other university or institution of
higher learning.
Timothy Henry Lansing
Aquatic Resource Science and Management Programme
Department of Aquatic Science
Faculty of Resource Science and Technology
Universiti Malaysia Sarawak

iii
TABLE OF CONTENTS
Acknowledgement…………………………………………………………………....... i
Declaration……………………………………………………………………………... ii
Table of Contents………………………………………………………………………. iii
List of Tables…………………………………………………………………………... iv
List of Figures………………………………………………………………………….. v
Abstract………………………………………………………………………………… vi
1.0 Introduction…………………………………………………………………... 1
1.1 Freshwater Habitat…………………………………………………. 1
1.2 Threats of Deforestation…………………………………………… 3
2.0 Literature Review……………………………………………………………. 5
2.1 Stream Ecology ……………………………………………………. 5
2.2 Fish Fauna Diversity ………………………………………………. 6
2.3 Land Use Impacts………………………………………………….. 8
3.0 Materials and Methods………………………………………………………. 9
3.1 Study Site…………………………………………………………... 9
3.2 Sample Collection………………………………………………….. 11
3.3 Sample Preservation……………………………………………….. 11
3.4 Sample Identification………………………………………………. 11
3.5 Indices…………………………………………………………….... 12
3.6 Statistical Analysis…………………………………………………. 13
4.0 Results………………………………………………………………………... 14
4.1 Study Site Description……………………………………………... 14
4.2 Fish Fauna………………………………………………………….. 15
4.3 Fish Indices………………………………………………………… 20
4.4 Sorensen’s Index…………………………………………………… 21
5.0 Discussions………………………………………………………………....... 22
6.0 Conclusion…………………………………………………………………… 27
7.0 References……………………………………………………………………. 28

iv
LIST OF TABLES
Table 1: Location and coordinate for every station………………………….. 9
Table 2: Habitat descriptions of sampling station……………………………. 14
Table 3: List of family, species and number of individuals (N) caught at
Batang Kayan, Lundu………………………………………………. 16
Table 4: List of family, species, number caught (N), total length (TL),
standard length (SL), body weight (BW), and standard deviation
(SD) at each station…………………………………………………. 18
Table 5: List of species present in each station………………………………. 20
Table 6: Species diversity, species richness and species evenness at each
station……………………………………………………………….. 21
Table 7: Sorensen’s index value based on the number of species at each
station……………………………………………………………….. 21
v
LIST OF FIGURES
Figure 1: Sampling stations for fish fauna survey at Batang Kayan, Lundu… 10
Figure 2: Standard length and total length………………………………….... 12
Figure 3: Percentage of fish caught at each station…………………………... 17
Figure 4: Percentage of fish family based on total number of individuals
caught at all stations ………………………………………………. 17
Figure 5: Percentage of fish genera based on total number of individuals
caught at all stations ………………………………………………. 17

vi
Fish Fauna Composition of Batang Kayan and Its Tributaries, Lundu, Sarawak
Timothy Henry Lansing
Aquatic Resource Science and Management
Faculty of Resource Science and Technology
Universiti Malaysia Sarawak
ABSTRACT
This study was done to document the fish fauna composition of Batang Kayan and its tributaries. The study
was carried out at five selected stations located at the mouth of five tributaries of Batang Kayan namely
Sungai Tangilang, Sungai Stenggang, Sungai Bawang, Sungai Tong Senggi and Sungai Stom Lundu.
Sampling method used was gill nets of various mesh sizes and three layer gill nets. A total of 324 individuals
of fish were caught comprising of 25 species, 17 genera, and 8 families. Among the 8 families, the most
dominant family is Cyprinidae. The most dominant species is Chela laubuca with a total of 57 individuals.
Four species are present at all stations namely Hemibagrus nemurus, Chela laubuca, Hampala
macrolepidota, and Osteochilus waandersii. The station with the largest number of individuals caught is
from station 4 with a total of 87 individuals meanwhile the station with lowest number caught is at station 2
with a total of 47 individuals. Species diversity and richness is highest at station 1 which is located at the
most upstream of the study site with a value of 1.038 and 7.860 respectively. The fish fauna composition is
mainly affected by the habitat characteristics of the river.
Keyword: fish, diversity, Sarawak, freshwater, composition
ABSTRAK
Kajian ini dijalankan untuk mendokumentasikan komposisi fauna ikan di Batang Kayan dan anak-anak
sungainya. Kajian ini dilakukan di lima stesen terpilih yang terletak di muara lima anak sungai Batang
Kayan iaitu Sungai Tangilang, Sungai Stenggang, Sungai Bawang, Sungai Tong Senggi, dan Sungai Stom
Lundu. Kaedah persampelan yang digunakan ialah pukat insang berbagai saiz mata jaring dan pukat tiga
lapis. Sebanyak 324 ekor ikan telah ditangkap yang terdiri daripada 25 spesis, 17 genera, dan 8 famili.
Daripada 8 famili, famili yang paling dominan ialah famili Cyprinidae. Spesis yang paling dominan ialah
Chela laubuca dengan jumlah 57 individu. Empat spesis boleh ditemui di kesemua stesen iaitu Hemibagrus
nemurus, Chela laubuca, Hampala macrolepidota, dan Osteochilus waandersii. Stesen dengan bilangan
individu yang paling banyak ditangkap ialah pada stesen 4 dengan jumlah 87 individu dan stesen dengan
bilangan individu paling sedikit ditangkap ialah pada stesen 2 dengan jumlah sebanyak 47 individu. Nilai
kepelbagaian dan kekayaan spesis paling tinggi pada stesen 1 dengan nilai sebanyak 1.038 dan 7.860
masing-masing dan stesen ini merupakan anak sungai yang paling hulu. Komposisi ikan lebih dipengaruhi
oleh ciri-ciri habitat sungai tersebut.
Kata kunci: ikan, kepelbagaian, Sarawak, air tawar, komposisi
1
1.0 INTRODUCTION
1.1 Freshwater Habitat
The freshwater habitat is a part of Malaysia’s diverse ecosystem consisting of
riverine, lacustrine and palustrine habitats (World Wide Fund Malaysia, 2002). There are
about 1,500 rivers which stretch at a length of 35,000 kilometers in Malaysia (Anonymous,
1998). Among the 1,500 rivers found in Malaysia, 94 rivers are considered as major
importance and out of the 94 rivers, 21 rivers are located in Sarawak (Yap, 1992). These
rivers are the habitats of the freshwater fishes and are crucial in determining some of the
most crucial attribute in distribution and diversity of these fishes.
Habitat comes in many forms and generally can be divided into two categories,
which is lentic and lotic ecosystem. Lentic ecosystem is the non-flowing or stagnant water
body such as lakes, swamps and paddy fields meanwhile lotic ecosystem is the flowing
water body which consists of streams, irrigation canals, and rivers (Mohsin & Ambak,
1990). These forms mold most of the freshwater fish distribution in an ecosystem. Lakes
such as Tasik Chini is a closed ecosystem and the balance of its ecosystem is fragile and
usually lower order fish (primary consumer) is abundant in lake ecosystem than the higher
order fish (secondary consumer) (Kutty, 2009). In river ecosystem on the other hand, the
freshwater fish distribution is mostly depending on the stream order and the migration of
fish.
Any water body comes with different characteristics which determine the types of
freshwater fish that can flourish in the desired environment. In a well developed stream or
2
river, the distribution of freshwater fish can be divided into the rhithron (lower order
stream) and potamon (high order stream) (Wootton, 1992). The distribution of fish within
the stream order of a river is according to the feeding nature of the fishes. The source of
carbon for fishes may exist either from autochthonous which is source of food originating
from the river system such as phytoplankton and zooplankton and also from allochthonous
which the food source are not originating or comes from outside of the river system such
as particulate organic matters (Webster et al., 1999; Hein et al., 2003). The allochthonous
materials usually are abundant at the rhithron region because of the riparian cover and the
great quantity of organic matter at the river banks meanwhile autochthonous materials are
usually abundant near to the potamon region which sunlight is present to supply energy for
the phytoplankton. Due to this feature, fish are distributed according to the feeding habit it
possess whether they consume autochthonous or allochthonous materials.
Freshwater fish are seasonal and free moving and do not usually stays at an area for
a long period of time. This is due to migration in river which is associated with the
spawning season or the existence of new feeding ground due to the inundation of the river
as a result of seasonal changes (Wootton, 1992). Migration may also caused by other
factors such as refuge-seeking migrations and post-displacement movements,
recolonisation and exploratory type of migration (Lucas et al., 2001). Migration influences
the distribution of freshwater fish in a river system especially during the monsoon season.
Topography also influences the distribution of fish fauna. For instance, high altitude retain
less and only specialized adapted fish can thrive in such a habitat than lower and middle
zone altitude (Nyanti, 1995).

3
Habitats of freshwater fish can also be associated with the diversity of fish fauna.
Long-term ecological isolation caused by the great difference of hydrological elements
such as flow speed and sediment may cause the differentiation of species with each species
having formed its own morphology (Chu and Zhou, 1989).
1.2 Threats of Deforestation
Total freshwater fish in Southeast Asia is approximated at 900 to 1,000 species
(Kottelat et al., 1993) and Malaysia has been estimated to hold more than 400 – 500
species (Bishop, 1973; Ali, 1992; Khan & Yeo, 1993; National Conservation Strategy,
1993; Ministry of Science, Technology and Environment, 1997; Zakaria-Ismail, 1997). But
this number could decrease up to 58% from the present if habitat alteration and destruction
continues at its present rate (Dennis & Aldhous, 2004; Salam & Gopinath, 2006). For
example, Singapore has faced the extinction of a total of 19 species in 30 years (Mohsin &
Ambak, 1990). A study done in Pusu River of Klang River Basin has shown that more than
40% of the native species is lost due to the adjacent development activities in the past few
years (Zakaria-Ismail, 1997). It is a big issue because it is estimated that tropical countries
are losing 127,300 km2 of forest annually, another 55,000 km
2 of tropical forest are logged
each year and a rough estimation of 30,000 km2 more is burnt each year (Chapman &
Chapman, 2002) which will affect the vegetations adjacent to the streams. Other than that,
the upper reaches are the least known habitat which means more species are to be
discovered and the rate of endemism is also high (Kottelat & Whitten, 1996; Hui, 2009).
The deforestation process may contribute to the loss of freshwater habitats and at the same
time encouraging the extinction of some sensitive freshwater fish species especially in

4
Sarawak which fish inventory of rivers in Sarawak is not much documented (Salam &
Gopinath, 2006).
At the same time, Sarawak cannot run from deforestation activities because the
replacement of forest areas into developments is required to support the greatly increasing
population needs. The areas are utilized into aquaculture farm for food security, residential
area for the growing population, industrial operation, timber harvesting or logging area to
cope with the lumber industry, and agricultural conversion especially oil palm plantation
which took up 4.2 million hectare of land in Malaysia in 2005 and will continue to grow
(Fitzherbert et al., 2008). All these developments are leading to deforestation which is a
big issue in the pursuit of development as it directly and indirectly alters the biodiversity of
an area not only the forest itself but also the river nearby the area (Ali, 1992; Kouamelan et
al., 2003; Salam & Gopinath, 2006; Fitzherbert et al., 2008). For instance, deforestation
reduces the riparian forest cover thus give serious impact to the growth and survival of
allochthonous stream fish species which rely on the particulate organic matter for food
from the forest and also reducing the shady areas for the juvenile fish to get its protection
(Raghavan et al., 2008).
It is a challenge for economists and biologists to achieve a well balanced
environment between development of agricultural activity and biodiversity richness
especially in Sarawak. This is a problem as there are not many studies done on the fish
fauna composition in Sarawak especially to assess the fish fauna composition (Meijaard et
al., 2005; Salam & Gopinath, 2006). Overall, the main objective of this study was to
record the fish composition at Batang Kayan and its tributaries.

5
2.0 LITERATURE REVIEW
2.1 Stream Ecology
The general habitat characteristics for most freshwater fish is fast flowing water,
shaded area, substrate either consist of mud, silt, rocky and sandy bottom (Lee & Ng,
1994). Apart from this, there are also some environmental factors that affect the patterns of
fish distribution in streams or rivers such as nutrients, aquatic plants, canopy closure,
depth, width, temperature, pH level, total dissolved solid (TDS) and dissolved oxygen
(DO) (Samat, 1990; Kouame et al., 2008).
One of the most important factors is nutrient. As nutrients support the vegetation of
a river or stream, the vegetation may also support the population of fish in term of
protection, reproduction and food supply (Zakaria et al., 1999). The overhanging
vegetation plays a role in the determination of temperature, determination of the primary
production and determination of the physico-chemistry within a river or stream (Kouame
et al., 2008). Substrate may also contribute to the growth and abundance of vegetation
either at the bank or the subsurface (Zakaria et al., 1999) and also gives protection to fish
in term of camouflage from predators. Other than that, low total dissolved solid (TDS) and
high dissolved oxygen (DO) favor almost all species of fish (Shah et al., 2009). The width
of river influence the number of fish species as it increase the diversity of habitat type,
while providing a larger area to accommodate more fish species and results in the different
rates of immigration (Angermeier & Schlosser, 1989). Depth of a river or stream also plays
a role in contributing the distribution of fish but it depends on the size and the feeding
habits of the fish (Kouame et al., 2008).
6
Species composition tends to increase from the river mouth to the upstream area
(Koumelan et al., 2003). This matter is true for a pristine river as there is no disturbance
but for a disturbed river, the species composition and diversity will be different from the
downstream to the upstream according to the level of disturbance. In addition, altitude also
plays a very important role in the species composition. Species are likely to be found
abundant at low altitude region compared to high altitude region (Nyanti, 1995).
2.2 Fish Fauna Diversity
Little attention has been given to the freshwater fish fauna of Malaysia since the
earliest days of ichthyological exploration in the region (Roberts, 1989) which have
actually started in the mid-19th
century (Zakaria-Ismail, 1991) and most of them have been
conducted in Peninsular Malaysia (Salam & Gopinath, 2006). Perhaps the most
comprehensive study in East Malaysia is done by Inger & Chin (1962) and Kottelat & Lim
(1995). However, most of the Malaysian river systems have never been studied intensively.
Most of the previous study only concerned on species checklist, fisheries status (Khan &
Yeo, 1993; Ali, 2000) and ichthyofaunal study (Ho & Tan, 1997; Yap et al., 1997;
Zakaria-Ismail & Salleh, 1997) but all the available studies are considered as incomplete
because the study is being carried out in a short term period and lack of monitoring have
been done to follow up the changes in distribution and habitats (Zakaria-Ismail, 1987).
Despite all the study done, no researcher has been able to give or list the actual or
reliable number of freshwater fish present in Malaysia (Zakaria-Ismail, 1991; Ng et al.,
1992; Ali, 2000). According to available literatures, it is generally estimated that there are
over 300 species of freshwater fish in Malaysia (Bishop, 1973; Ali, 1992; Khan & Yeo,

7
1993; Zakaria-Ismail, 1997). Other sources of number of freshwater species in Malaysia is
from National Conservation Strategy (1993) which stated that there are 546 species
including the 160 species in East Malaysia and Ministry of Science, Technology and
Environment (1997) mentioned that a total of 449 freshwater fish species are present in
Malaysia.
In East Malaysia especially Sarawak, the ichthyological survey has not been
extensive (Salam & Gopinath, 2006). The earliest known survey done in Sarawak was
carried out by the Department of Agriculture in three major rivers which are Sungai
Rajang, Batang Ai, and Sungai Baram in 1985. The study reported that 59 species found in
Sungai Rajang, 31 species in Batang Ai and 43 species can be found in Sungai Baram.
This ichthyological survey however, was considered incomplete due to its confinement in a
small geographical area (Salam & Gopinath, 2006). Another study has been done by
Kottelat & Lim (1995) which covers throughout Sarawak and Brunei and listed a total of
249 freshwater fish species. Rahim et al. (2009) also have been doing studies at Batang
Kerang, Balai Ringin, Sarawak and have reported different composition at two different
water with 36 species in the brown water meanwhile in the black water, there are only 12
species can be found. But then again, the study is only focuses to the Balai Ringin area.
Cyprinidae dominates almost 30% of species population for both Peninsular and
Borneo while Channidae and Anabantidae comprise another 26% and the remainders are
distributed amongst the nine other families (Salam & Gopinath, 2006). Among the most
common cyprinids can be found includes sebarau (Hampala macrolepidota) and lampam
sungai (Barbodes schwanefeldii). Other than that is the Bagridae family which are baung

8
(Mystus spp.) (Tweedie & Harrison, 1954). Alongside with the population of the native
species of Malaysia freshwater fish, there is also the presence of invasive alien species.
Some of them are Barbodes gonionotus, Trichogaster pectoralis and Osphronemus
goramy. These species were introduced into Malaysian waters in the early 20th
century
(Ang et al., 1989).
2.3 Land Use Impacts
Rivers are one of the most degraded ecosystems in Malaysia which give impacts on
fish populations through land clearing especially caused by oil palm plantation and habitat
encroachment (Ali, 1992; Kouame et al., 2008). In the past years, there is reduction in the
number of freshwater fish caught in Malaysia and it is believed that devastation of their
natural habitats is the main factor for the decline (Khan et al., 1996). No buffer zone
between the disturbed area and the stream or river will contribute to sedimentation problem
(Shah et al., 2009). Deforestation and habitat degradation lead to a decline in exogenous
food sources including insects and their larvae as well as reduction in leaf debris due to
shade loss and reduce protection from the canopy (Raghavan et al., 2008).
9
3.0 MATERIALS AND METHODS
3.1 Study Site
The study site is at Batang Kayan, Lundu, 52 km from the town of Kuching,
Sarawak. Four fieldtrips have been carried out on 3-4 August 2010, 28-29 October 2010,
1-2 December 2010 and 9-10 February 2011. The stations of the study are selected
according to the accessibility of the sampling site. Since Batang Kayan is near to
agricultural conversion land, most of the tributaries are inaccessible due to obstacles such
as abandoned logs, woods, and fallen trees and trunks resulting from the land clearing
activity. In addition, the shallow and narrow characteristics of the tributaries also were a
problem. Due to these factors, most of the stations are located at the mouth of the
tributaries near to the main Batang Kayan. The fish fauna survey was carried out at five
stations as shown in Table 1 and Figure 1.
Table 1: Location and coordinate for every station.
Station Coordinates Location
Station 1 N 01º 31.735’
E 109º 58.454’
Elevation: ±3.66 metres
Sungai Tangilang
Station 2 N 01º 31.731’
E 109º 58.450’
Elevation: ±3.66 metres
Sungai Stenggang
10
Station 3 N 01º 30.774’
E 109º 57.799’
Elevation: ±4.57 metres
Sungai Bawang
Station 4 N 01º 30.324’
E 109º 57.573’
Elevation: ±3.96 metres
Sungai Tong Senggi
Station 5 N 01º 30.277’
E 109º 55.378’
Elevation: ±4.88 metres
Sungai Stom Lundu
Figure 1: Sampling stations for fish fauna survey at Batang Kayan, Lundu.

11
3.2 Sample Collection
Monofilament gill nets with different mesh sizes and three layers gill net were used
in this study. The mesh sizes of the monofilament gill nets used include 2.5 cm and 7.6 cm
of mesh sizes. A total of three nets which consists of a 2.5 cm monofilament gill net, a 7.6
cm monofilament gill net and a three layers gill net were deployed at each station. The
monofilament gill nets and three layers gill net were left at the stations overnight before
being retrieved the next day.
3.3 Sample Preservation
Fish samples were fixed at the field by using 10% formalin and were left in the
laboratory for approximately 72 hours. After 72 hours, the samples were washed, rinsed
and soaked in tap water before transferred and kept into 70% ethanol solution for further
laboratory analysis and preservation purpose.
3.4 Sample Identification
The fish samples were identified using the taxonomy method according to Roberts
(1989), Mohsin & Ambak (1990), Gunther (1993), Kotellat et al. (1993), Inger & Chin
(2002), and Tan (2006). The total length and standard length were measured by using
Wildco measuring board with steel caliper which are fixed with graduated centimeter scale
for measurement. The total length was measured from the anteriormost of the head or
mouth to the most end of the caudal fin, with lobe squeezed together. The standard length
was taken from the anteriormost of the head or snout to the end of fleshy caudal peduncle
and is taken straight and not according to the curve of body (Figure 2) (Mohsin & Ambak,
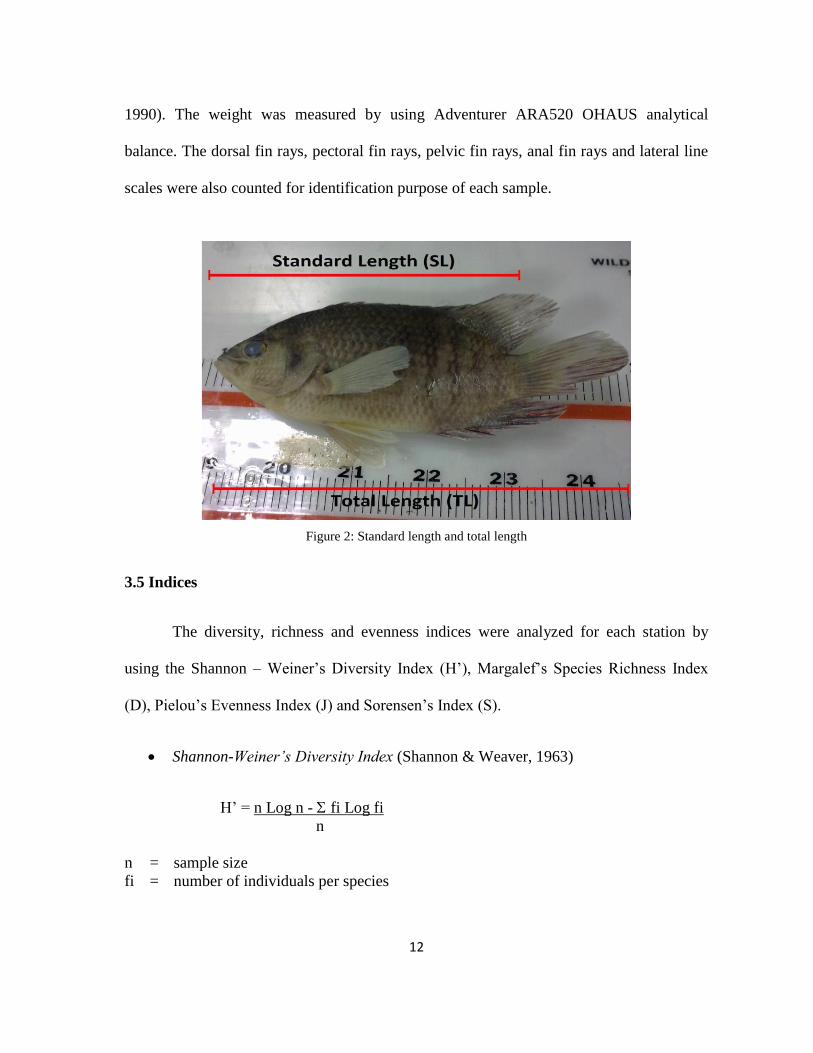
12
1990). The weight was measured by using Adventurer ARA520 OHAUS analytical
balance. The dorsal fin rays, pectoral fin rays, pelvic fin rays, anal fin rays and lateral line
scales were also counted for identification purpose of each sample.
Figure 2: Standard length and total length
3.5 Indices
The diversity, richness and evenness indices were analyzed for each station by
using the Shannon – Weiner’s Diversity Index (H’), Margalef’s Species Richness Index
(D), Pielou’s Evenness Index (J) and Sorensen’s Index (S).
Shannon-Weiner’s Diversity Index (Shannon & Weaver, 1963)
H’ = n Log n - fi Log fi
n
n = sample size
fi = number of individuals per species
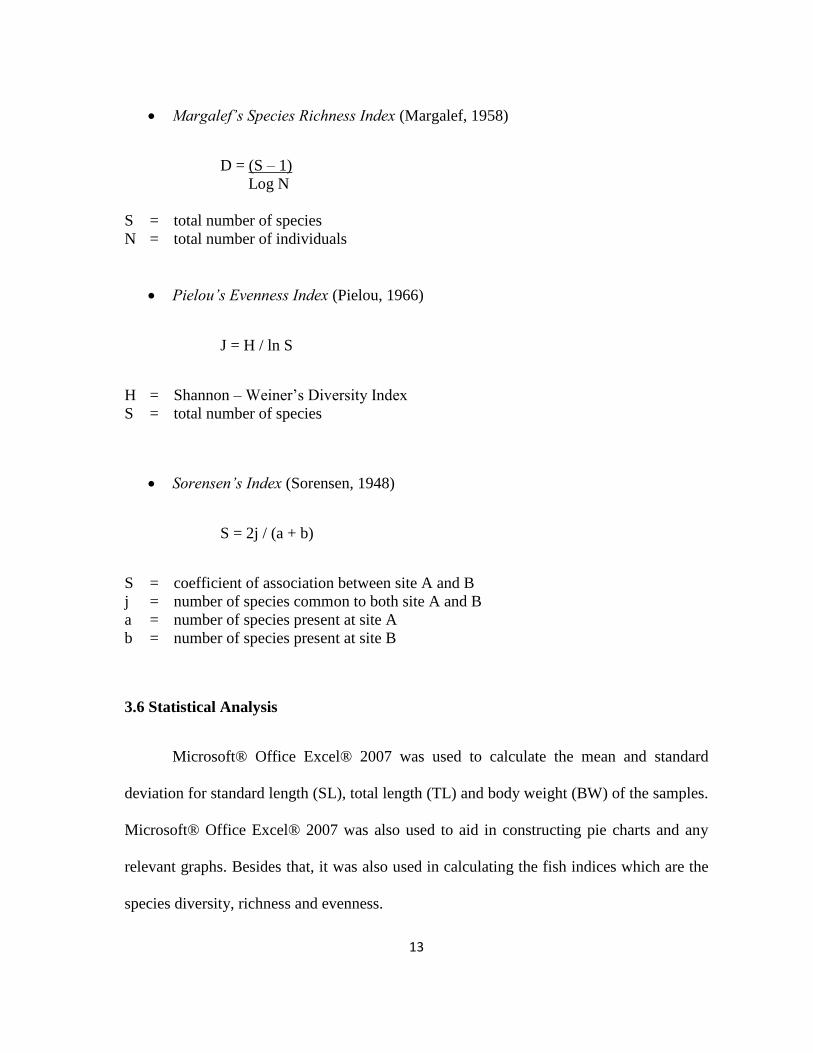
13
Margalef’s Species Richness Index (Margalef, 1958)
D = (S – 1)
Log N
S = total number of species
N = total number of individuals
Pielou’s Evenness Index (Pielou, 1966)
J = H / ln S
H = Shannon – Weiner’s Diversity Index
S = total number of species
Sorensen’s Index (Sorensen, 1948)
S = 2j / (a + b)
S = coefficient of association between site A and B
j = number of species common to both site A and B
a = number of species present at site A
b = number of species present at site B
3.6 Statistical Analysis
Microsoft® Office Excel® 2007 was used to calculate the mean and standard
deviation for standard length (SL), total length (TL) and body weight (BW) of the samples.
Microsoft® Office Excel® 2007 was also used to aid in constructing pie charts and any
relevant graphs. Besides that, it was also used in calculating the fish indices which are the
species diversity, richness and evenness.

14
4.0 RESULTS
4.1 Study Site Description
Most of the stations along Batang Kayan have been disturbed due to anthropogenic
factors. Station 2 and station 4 which are Sg. Stenggang and Sg. Tong Senggi respectively
have been disturbed by oil palm plantation activities. The forest at station 1 and station 3
which are Sg. Tangilang and Sg. Bawang respectively had just recently been cleared.
Station 5 or Sg. Stom Lundu has been experiencing human anthropogenic especially from
the boat’s engine and nearby access by road. The habitat description of every station is
shown in Table 2.
Table 2: Habitat descriptions of sampling station.
Stations Habitat Description
Station 1
(Sg. Tangilang)
The tributary was fully shaded with branches from small trees along
its bank. Slight erosion could be seen at the banks of the tributaries
with the muddy soil at the top of sandy soil. The bottom substrate
was muddy and a bit sandy and the water was brownish white. Logs
and trunks could be observed and no access to the upstream of Sg.
Tangilang from the river mouth.
Station 2
(Sg. Stenggang)
Sg. Stenggang was partially shaded. No erosion was observed as
aquatic macrophytes grow along the bank. The bottom substrate was
sandy and the water was brownish. The river was accessible to the
upstream area but too shallow during low water level. The water
was fast flowing.
Station 3
(Sg. Bawang)
The vegetation along the river bank was bushes and no shade is
provided to the river. There was also no erosion seen as the bushes
gives good support to the river bank. The bottom substrate was
muddy and the water was humic red nearly to black in color.
Upstream area was impassible as the water depth was too shallow.

15
Station 4
(Sg. Tong Senggi)
Sg. Tong Senggi is the river where palm oil mill effluent is
occasionally discharge. The river was fully shaded. Slight erosion
could be seen occurring at the river bank. The bottom substrate was
sandy and the water is dark. Logs and tree trunks limits the access to
the upstream area.
Station 5
(Sg. Stom Lundu)
This tributary was fully shaded and erosion could be observed along
its bank. The bottom substrate was sandy and muddy at some area.
The color of the water was light brown. Sg. Stom Lundu could be
very shallow during the low water level or drought season which can
expose the riverbed and small channel of flowing water could be
seen.
4.2 Fish Fauna
A total of 324 individuals were caught at five different stations belonging to 25
species, 17 genera and 8 families (Table 3). The highest number of fish caught can be
observed at station 4 with a total of 87 individuals (26.9%) followed by station 1 with the
total of 81 individuals (25.0%), station 5 with 61 individuals (18.8%), station 3 with 48
individuals (14.8%) and the least number of fish caught is at station 2 with the total of 47
individuals (14.5%) (Figure 3).

16
Table 3: List of family, species and number of individuals (N) caught at Batang Kayan, Lundu.
No. Family Species N
1 Anabantidae Osphronemus goramy 3
Trichogaster pectoralis 1
2 Bagridae Hemibagrus micracanthus 13
Hemibagrus nemurus 13
Leiocassis micropogon 7
3 Clariidae Clarias leiacanthus 1
4 Cyprinidae Barbonymus gonionotus 13
Barbonymus schwanenfeldii 4
Chela laubuca 57
Cyclocheilichthys apogon 53
Cyclocheilichthys armatus 10
Cyclocheilichthys repasson 10
Hampala macrolepidota 17
Osteochilus waandersii 16
Puntius binotatus 1
Puntius sealei 1
Rasbora argyrotaenia 9
Rasbora caudimaculata 35
5 Eleotridae Oxyeleotris urophthalmus 1
6 Mastacembelidae Mastacembelus erythrotaenia 3
7 Nandidae Pristolepis grootii 4
8 Siluridae Kryptopterus apogon 10
Kryptopterus limpok 1
Kryptopterus platypogon 40
Pangasius micronemus 1
Total Individuals 324


