
1
LINEAR IC’S &PULSES CIRCUITS LABORATORY
MANUAL (EEE-318)
(III/IV EEE Ist Semester)
DEPARTMENT OF ELECTRONICS AND COMMUNICATION ENGINEERING
ANIL NEERUKONDA INSTITUTE OF TECHNOLOGY & SCIENCES (Affiliated to AU, Approved by AICTE & Accredited by NBA)
SANGIVALASA-531 162, Bheemunipatnam Mandal, Visakhapatnam District
Phone: 08933-225083/84/87 Fax : 226395

2
Linear IC’s and Pulse Circuit Laboratory
III/IV EEE Ist semester (CODE - EEE 318)
DEPARTMENT OF
ELECTRONICS & COMMUNICATION ENGINEERING
LABORATORY MANUAL
Prepared By: Approved By:
Mrs.P.S.M.Veena Dr.V.Rajya Lakshmi,
Assistant Professor, Professor & HOD,
Department of ECE. Department of ECE,ANITS
ANIL NEERUKONDA INSTITUTE OF TECHNOLOGY & SCIENCES (Affiliated to Andhra University)
Sangivalasa-531162, Bheemunipatnam Mandal, Visakhapatnam.
Phone:089335084,226395

3
INTRODUCTION
In pulse circuits lab students will be able to analyze and design
different linear and non-linear waveforms with different time constants and
different types of inputs, with and without reference voltages using linear
and non-linear wave shaping circuits. Design, analysis and voltage
regulators circuits will be done.
In Integrated circuits lab Design and analysis of linear and non-
linear circuits using operational amplifiers, 1st & 3rd order active filters,
voltage regulators, multivibrators using timers, Schmitt trigger circuits will
be done. Identification, verification and applications of ICs like LM741, 555
timer and three terminal regulators (7805, 7808 etc) will be taught. With
this knowledge students will be able to do the mini-projects with the help
of integrated circuits.

4
LINEAR INTEGRATED CIRCUITS & PULSE AND DIGITAL CIRCUITS LABORATORY
EEE 318 Credits : 2
Instruction : 3 Periods / Week Sessional Marks : 50
End Exam : 3 Hours End Exam Marks : 50
Prerequisites:
1. Pulse and Digital Circuits (EEE 313)
2. Linear IC’s and Applications (EEE 314)
Course Objectives:
At the end of the course students should understand:
To understand the linear and non-linear applications of operational amplifiers(741)
To familiarize with theory and applications of 555 timers.
To design and construct waveform generation circuits using Op-Amp
Understand the response of linear circuits for different signals.
Determine the voltage transfer characteristics of non linear circuits and also learn
about comparators
Understand different energy resources
Electrical energy generation by using different types of plants.
Utilization of generated electrical energy for various purposes.
Electric heating, welding, illumination are known
Course Outcomes:
Mapping of course outcomes with program outcomes:
PO PSO
1 2 3 4 5 6 7 8 9 10 11 12 1 2
CO
1 1 1 3 3 1 1 0 0 2 1 0 0 1 0
2 1 1 3 1 1 1 0 0 2 1 0 0 1 0
3 1 1 3 2 1 1 0 0 2 1 0 0 1 0
4 1 1 3 3 1 1 0 0 2 1 0 0 1 0
5 1 1 3 1 1 1 0 0 2 1 0 0 1 0
At the end of the course student should be able to:
1. Design the circuits using op-amps for various applications like adder, subtractor,
integrator, differentiator and Schmitt trigger
2. Design active filters for the given specifications and obtain their frequency response
characteristics.
3. Design and analyze multi vibrator circuits using op-amp, Transistor and 555Timer
4. Design application based on linear and nonlinear circuits
5. Understand the operation & application of Bootstrap circuit
Formatted: Not Highlight
Formatted: Indent: Hanging: 0.55"
Formatted: Font: Not Bold, Not Highlight
Formatted: Font: Not Bold, Not Highlight
Formatted: List Paragraph, Indent: Left: 0.94", Hanging: 0.19", Don't add spacebetween paragraphs of the same style, Linespacing: single, Outline numbered + Level: 4 +Numbering Style: 1, 2, 3, … + Start at: 1 +Alignment: Left + Aligned at: 2.5" + Tab after: 3" + Indent at: 3", Tab stops: Not at 3"
Formatted: Font: Not Bold, Not Highlight
Formatted: Not Highlight
Formatted: Indent: Hanging: 0.49"
Formatted: Indent: Left: 0.31", Hanging: 0.19"
Formatted: Not Highlight
Formatted: Font: Bold, Not Highlight
Formatted: Not Highlight
Formatted: Not Highlight

5
TEN EXPERIMENTS BASED ON EEE 313 & EEE 314 SYLLABI
Formatted: Normal, No bullets or numbering

6
Linear IC’s and Pulse Circuit Laboratory
III/IV EEE Ist semester
(CODE - EEE 318)
List of Experiments Page No.
1. Applications Of Operational Amplifier 6
2. Linear Wave Shaping 13
Non- Linear Wave Shaping
3. Clipper Circuits 17
4. Clamper Circuits 22
5. Schmitt Trigger 25
6. IC Voltage Regulator 30
7. UJT As A Relaxation Oscillator 34
8. Astable Multivibrator Using 555 Timers 37
9. Bistable Multivibrator 41
10. Frequency Response Of A Active Filter 44
11. IC Op-Amp Boot-Strap Ramp Generator 48

7
EXPERIMENT NO: 1 APPLICATIONS OF OPERATIONAL AMPLIFIER
AIM : To realize Summing Amplifier, Subtracting Amplifier, Integrator and Differentiator by using 741 Op-Amp. APPARATUS: 1. Op-Amp LM 741 2. Resistors – 1KΩ (4), 100KΩ (1), 10KΩ (1) 3. Capacitors – 0.01µf(1), 330pf(1) 4. Function Generator 5. TRPS 6. CRO & CRO Probes 7. Bread Board 8. Connecting Wires. THE IDEAL OP AMP: An ideal op amp would exhibit the following electrical characteristics. 1. Infinite voltage gain A. 2. Infinite input resistance Ri so that almost any signal source can drive it and there is no
loading of the preceding stage. 3. Zero output resistance R0 so that output can drive an infinite number of other devices. 4. Zero output voltage when input voltage is zero. 5. Infinite bandwidth so that any frequency signal from 0 to ∞ Hz can be amplified without
attenuation. 6. Infinite common mode rejection ratio so that output common – mode noise voltage is zero. 7. Infinite slew rate so that output voltage changes occur simultaneously with input voltage
changes.
APPLICATIONS OF OP AMP:
1. Summing Amplifier:
Op amp may be used to design a circuit whose output is the sum of several input signals. Such a circuit is called a summing amplifier or a summer. If V1, V2 are two input signals given to the inverting terminal, then
Vo = - RF (V1 + V2) R
8
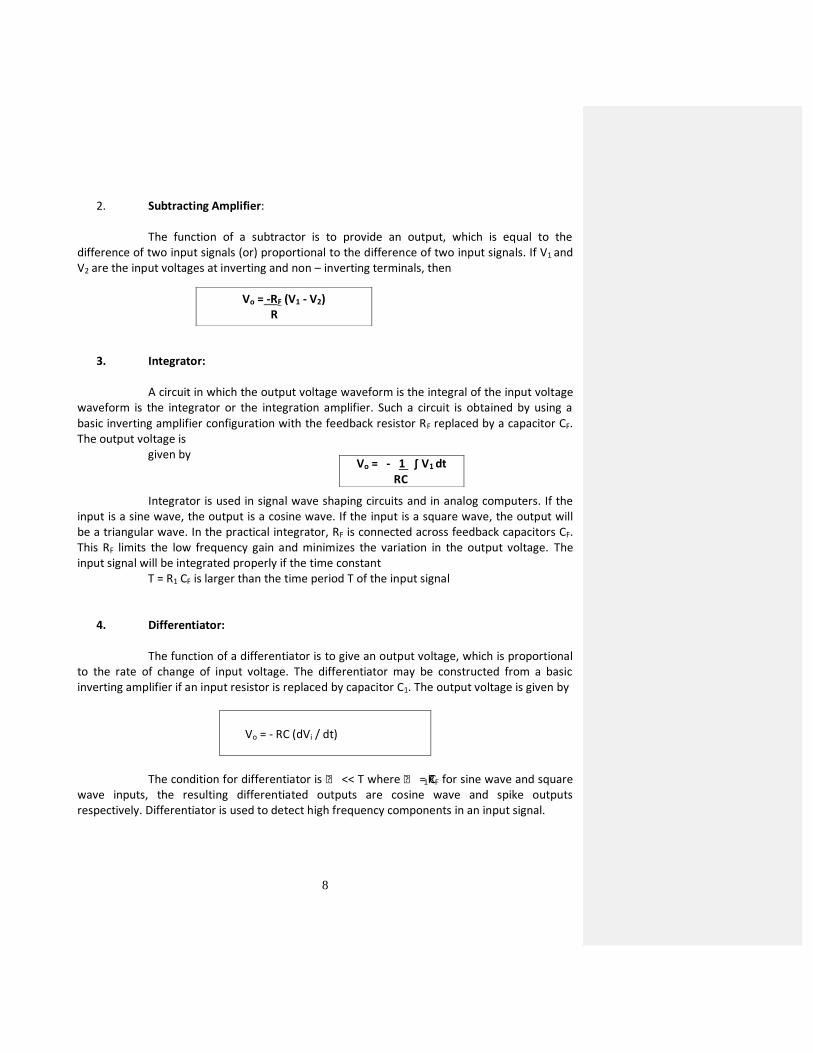
2. Subtracting Amplifier:
The function of a subtractor is to provide an output, which is equal to the difference of two input signals (or) proportional to the difference of two input signals. If V1 and V2 are the input voltages at inverting and non – inverting terminals, then
3. Integrator:
A circuit in which the output voltage waveform is the integral of the input voltage waveform is the integrator or the integration amplifier. Such a circuit is obtained by using a basic inverting amplifier configuration with the feedback resistor RF replaced by a capacitor CF. The output voltage is
given by
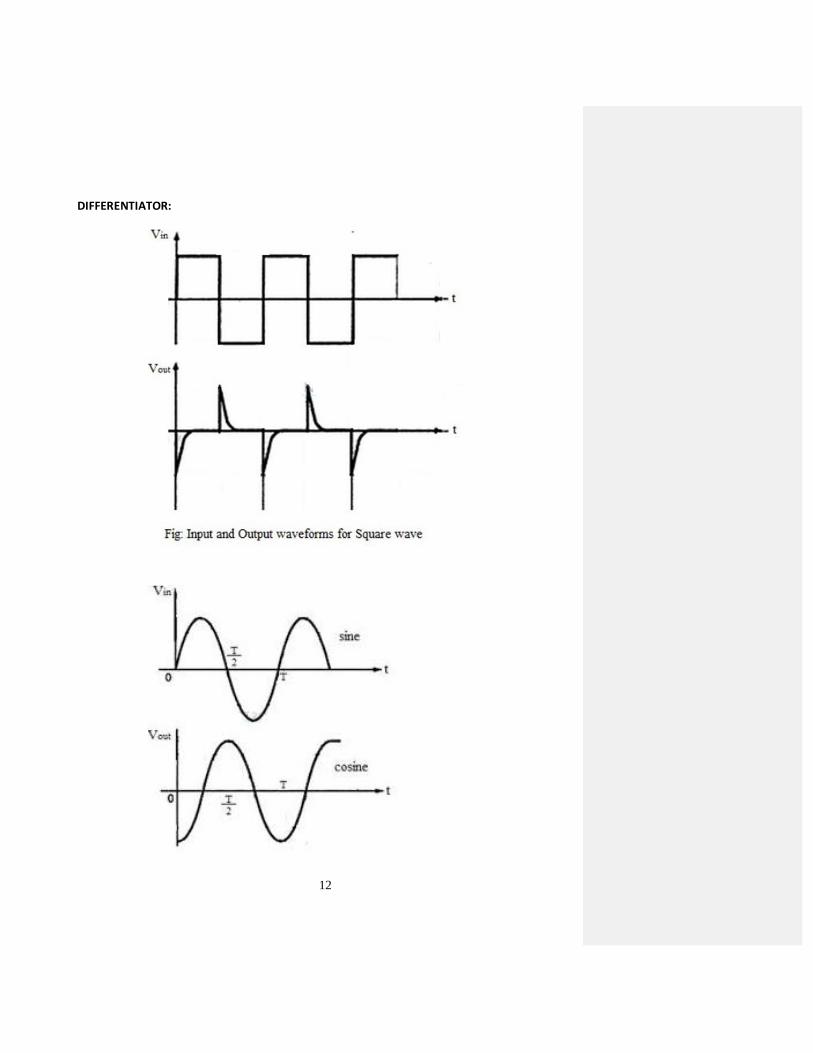
Integrator is used in signal wave shaping circuits and in analog computers. If the input is a sine wave, the output is a cosine wave. If the input is a square wave, the output will be a triangular wave. In the practical integrator, RF is connected across feedback capacitors CF. This RF limits the low frequency gain and minimizes the variation in the output voltage. The input signal will be integrated properly if the time constant
T = R1 CF is larger than the time period T of the input signal
4. Differentiator:
The function of a differentiator is to give an output voltage, which is proportional to the rate of change of input voltage. The differentiator may be constructed from a basic inverting amplifier if an input resistor is replaced by capacitor C1. The output voltage is given by
Vo = - RC (dVi / dt)
The condition for differentiator is << T where = C1RF for sine wave and square wave inputs, the resulting differentiated outputs are cosine wave and spike outputs respectively. Differentiator is used to detect high frequency components in an input signal.
Vo = -RF (V1 - V2) R
Vo = - 1 ∫ V1 dt RC
9
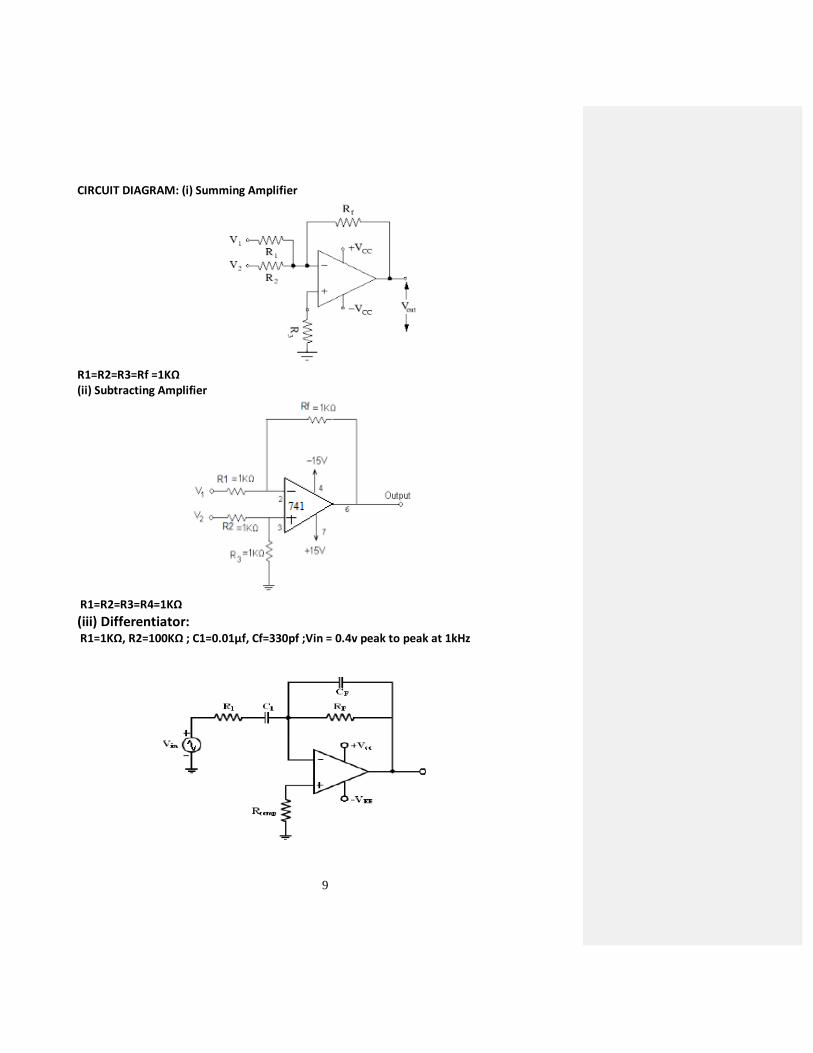
CIRCUIT DIAGRAM: (i) Summing Amplifier
R1=R2=R3=Rf =1KΩ (ii) Subtracting Amplifier
R1=R2=R3=R4=1KΩ
(iii) Differentiator: R1=1KΩ, R2=100KΩ ; C1=0.01µf, Cf=330pf ;Vin = 0.4v peak to peak at 1kHz

10
(iv)Integrator:
R=10KΩ, Rf=100KΩ, C=0.01µf, Vs = 4v peak to peak at 10kHz
PROCEDURE: I. Summing Amplifier: 1. Connections are made as per the circuit diagram. 2. Input voltages V1 and V2 are given and the corresponding output voltage Vo is measured
from CRO. 3. Output varies as Vo = - (V1 + V2), since RF = R.
II. Subtracting Amplifier: 1. Connections are made as per the circuit diagram. 2. Input voltage V1 and V2 are given to the inverting and non – inverting terminals
respectively and corresponding output voltage is measured from CRO. 3. Output varies as Vo = V2 – V1.
III Differentiator: 1. Connections are made as per the circuit diagram. 2. A square wave input of 4V (p-p) and frequency of 1KHZ is applied from function generator. 3. Output waveform is observed. Corresponding amplitude and time period is observed and
frequency is calculated. 4. With the above data plot the output graphs with time on X-axis and voltage on Y-axis.
IV. Integrator: 1. Connections are made as per the circuit diagram. 2. By using a function generator, a square wave input 4Vp-p is given. 3. The frequency applied is 10 KHz. 4. A perfect triangular wave is obtained. The peak-to-peak voltage and the time period of
input and output waves are measured from CRO. 5. The waveforms are plotted.

11
MODEL GRAPHS: INTEGRATOR:
12
DIFFERENTIATOR:

13
PRECAUTIONS:
1. Loose and wrong connections are to be avoided. 2. Waveforms should be obtained without any distortion.
Conclusion: RESULT: Viva questions
1. What are the ideal characteristics of an OP-AMP? 2. Define OP-AMP. 3. What do you mean by CMRR? 4. Define slew rate. 5. What are the applications of differentiator? 6. What are the applications of integrator? 7. What is a difference between inverting and non-inverting amplifier?

14
EXPERIMENT NO: 2 LINEAR WAVE SHAPPING AIM: To observe the process of linear wave shaping for square wave input for high pass RC
circuit and low pass RC circuit. APPARATUS: 1. Resistors – 1KΩ (1) & 10KΩ (1) 2. Capacitors – 1µf(1) & 0.01µf(1) 3. Function Generator 4. TRPS 5. CRO & CRO probes 6. Bread Board and connecting wires. CIRCUIT DIAGRAM:
+ +
- -
CC
Vi R10V (P-P)
High Pass RC Circuit
Vo
R=10KΩ, C=1µf
Low Pass RC Circuit
-
R
C10V (P-P) Vi
+ +
Vo
-
R=1KΩ, C=0.01µf
High pass RC Circuit: The reactance of a capacitor decreases with increasing frequency; the higher frequency components in input signal appear at the output with less attenuation than do the lower frequency components. At very high frequency the capacitor acts almost as a short circuit and virtually all the input appears at the output. This is behavior accounts for the designation ‘High Pass Filter ‘. Square wave responses of a high pass RC circuit. The dashed curve represents the output if RC >> T.
V11 = V1 exp(-T1/ RC) V1
1- V2 = V
V2
1= V2 exp(-T2/ RC) V1 - V2
1 = V

15
A symmetrical square wave is one for which T1 = T2 = T/2. Because of symmetry V1 = - V2 and V1
1= -V21
V1 = V / (1+exp-T / 2RC)
V11
= V / (1+exp T / 2RC) Peaking of square wave resulting from a time constant small compared with T.
The high pass RC circuit acts as a differentiator if time constant is very small in comparisons with the time required for the input signal to make an appreciable change. Low Pass R-C Circuit: The low pass RC circuit passes low frequencies readily but attenuates high frequencies because the reactance of capacitor decreases with increasing frequency. At high frequencies, the capacitor acts as a virtual short circuit and output falls to zero. Square wave input (b-d) , output of low pass RC circuit. The time constant is smallest for (b) and largest for (d). Equation of rising portion V 01 = V 1 + ( V1 - V 1 ) exp (-t / RC) V1 = initial value of output voltage . Equation of falling portion V02 = V 11 + ( V2 - V
11) exp - ( t – T1)/ RC
The low pass RC circuit acts as an integrator if time constant is very large in comparison with time required for the input signal to make an appreciable change. PROCEDURE:
1. Connections are made as per the circuit diagram. 2. To the high pass circuit a square wave input of amplitude 10V (p-p) is given. 3. The time period of waveform is adjusted such that RC << T, RC = T and RC >> T to get
spikes and tilted output respectively. The time period and amplitude are noted. 4. Now to the low pass circuit a square wave input of amplitude 10V (p-p) is given. 5. The time period of input signal is adjusted with the help of a function generator such that
RC << T and RC >> T to get the corresponding waveforms. The time period and amplitude are noted.
6. Graphs are plotted for both input and output waveforms of both the circuits when RC << T and RC >> T.

16
Observation Table:
High Pass RC Circuit
RC<<T RC==T RC >> T
V1 V2 V1 V2 V’1 V’2 V1 V2 V’1 V’2
Theoretical
Calculations
Practical
Calculations
Low Pass RC Circuit
RC<<T RC==T RC >> T
V1 V2 V1 V2 V1 V2
Theoretical Calculations
Practical
Calculations

17
MODEL GRAPHS: High pass circuit Low Pass Circuit
PRECAUTIONS: 1. Loose and wrong connections are to be avoided. 2. The output waveforms should be obtained without and distortion 3. Parallax error should be avoided. Conclusion: RESULT: Viva questions
1. What is linear wave shaping? 2. How low pass RC circuit works as an integrator? 3. How low pass RC circuit works as differentiator? 4. Define time constant. 5. Define tilt. 6. Explain the output wave forms of high pass and low pass circuit for different conditions.

18
EXPERIMENT NO:3 CLIPPER CIRCUITS
AIM: To observe the waveforms of clipper circuits using
a. Positive clipper b. Negative clipper c. Two level clipper or slicer circuit.
APPARATUS: 1. 1N 4007 diodes (2) 2. Resistor-10K (1) 3. TRPS 4. Function Generator 5. Bread board and connecting wires 6. CRO with CRO probes. CIRCUIT DIAGRAM: Shunt Clippers Negative clipper: R =10KΩ

19
Series Clippers : R1=10KΩ

20
Two level clipper: R1=10KΩ
CIRCUIT OPERATION: Clippers are used to select a part of signal waveform above or below a reference
voltage for transmission. Negative Clipper: For Vi < VR +Vr , The diode D is OFF ,since it is reverse biased and hence does not contact. Since no current flows, there is no voltage drop across R. VO = Vi for Vi < VR + Vr
Where Vr is Cut-in voltage of the diode. For Vi > VR + Vr , the diode D is ON, Since it is forward biased and the potential barrier is overcome Vo = VR+ Vr Transfer characteristic Equation: Vo= Vi for Vi < VR + Vr
Vo= VR + Vr for Vi > VR + Vr Positive Clipper: When Vi > VR + Vr the diode is forward biased and hence it conducts since it is ON it is short circuited .It is obvious that Vo= VR + Vr Whatever the comment.

21
When Vi < VR + Vr the diode is reverse biased and hence it is OFF. It acts as an open Circuit. Vo= Vi Transfer Characteristic Equation: Vo= Vi for Vi < VR + Vr
Vo= VR + Vr for Vi > VR + Vr
Procedure: 1. Connections are made as per the circuit diagram
2. For the positive clipper the diode is connected along with reference voltage as
shown by applying the input and the output is observed on the C.R.O.
3. For the negative clipper the directions of diode and the reference voltage are
reversed and by giving the input, the output is observed on the C.R.O.
4. For the Slicer Circuit has two Diodes along with reference voltages are connected as
shown and output is observed on the C.R.O.
5. A sinusoidal input 10V (p-p) 1KHZ is given to positive clipper, negative clipper and
slicer circuit and corresponding output is observed.
OBSERVATIONS:
Name Of the Clipper
Negative Clipper O/P
Output waveform
Wave Form Positive peak
Negative peak
Amplitude (p-p)
Time Period
Name Of the Clipper
Positive Clipper O/P
Output waveform
Wave Form Positive peak
Negative peak
Amplitude (p-p)
Time Period

22
Name Of the Clipper
2-Level Clipper O/P
Output waveform
Wave Form Positive peak
Negative peak
Amplitude (p-p)
Time Period
PRECAUTIONS: 1. Loose and wrong connections are to be avoided. 2. The output waveforms should be obtained without distortion. 3. Parallax error should be avoided Conclusion: RESULT: Viva questions.
1. What is meant by non linear wave shaping? 2. What is clipper? What are the different types of clippers? 3. What are the different applications of clipper? 4. What is two level clipper 5. Explain the operation of positive and negative clipper?

23
EXPERIMENT NO:4 CLAMPER CIRCUITS AIM: To observe the waveforms of the Positive and Negative clamping circuits. APPARATUS:
1) Capacitor 4.7μf - 1 2) IN4007 diode - 1 3) Resistor 1M Ω - 1 4) Function Generator 5) Bread board 6) CRO and CRO probes 7) Connecting wires.
Circuit Diagrams:
10V
Negative Clamper
1N4007 R
1KHz
C+ -
+
-Vi(P-P)
(CRO)Vo
C=4.7μf , R=1M Ω
1KHz
1N4007
C
-
R
-
(CRO)
Positive Clamper
Vi
+
Vo
+
(P-P)
10V
C=4.7μf, R=1M Ω

24
Model Graph:
PROCEDURE:
1. The circuits are connected as per the circuit diagram. 2. The input signal Vi of (10V p-p) frequency (1KHz) is applied to each of the circuits. 3. The corresponding output waveforms are noted from the C.R.O. 4. The input and output waveform are plotted on the graph sheets.
OBSERVATIONS:
Name Of the Clamper
Negative Clamper
O/P
Output waveform
Wave Form Positive
peak Negative
peak
Amplitude (p-p)
Time Period

25
Name Of the Clamper Positive Clamper
O/P
Output waveform
Wave Form Positive
peak Negative
peak
Amplitude (p-p)
Time Period
PRECAUTIONS: 1. Loose and wrong connections are to be avoided. 2. The output waveforms should be obtained without and distortion. 3. Parallax error should be avoided Conclusion: RESULT: Viva questions
1. What do mean by clamper? 2. What are the different types of clamping circuits? 3. What are the different applications of clampers? 4. Why clamper is called DC inserter? 5. Explain the operation of positive clamper and negative clamper?

26
EXPERIMENT NO: 5 SCHMITT TRIGGER
AIM: To observe the output waveform of a Schmitt trigger circuit and to note down the hysteresis voltage VHY with the reference of VUT and VLT . Apparatus: 1) IC 741 OP-AMP -1NO 2) Resistors 2.2KΩ -2, 10kΩ -1 3) Function Generator 4) TRPS 5) CRO, Bread Board and connecting wires. Theory: The circuit shown is known as the Schmitt trigger or Squaring Circuit. It shows an working comparator with positive feedback. This circuit converts an irregular shaped waveform to a square wave hence it is called as a square wave generator. If positive feedback is added to a basic comparator circuit, Gain can be increased greatly. The input voltage Vin triggers the output Vo every time it exceeds certain voltage levels called upper threshold voltage VUT and lower threshold voltage VLT The threshold voltages are obtained by using the voltage divider R1 - R2 where the voltage across R1 is fed back to the (+) input. The voltage across R1 is variable reference threshold voltage that depends on the value the polarity of the output voltage V0 . When V0 = + VSAT the voltage across R1 is called the upper threshold Voltage VUT
The input voltage VIN must be slightly more positive than VUT in order to cause the output Vo to switch from + VSAT to - VSAT as long as VIN < VUT , VO is at +VSAT VUT = R1 (+VSAT) R1+R2
VLT = R1 (-VSAT) R1+R2
27
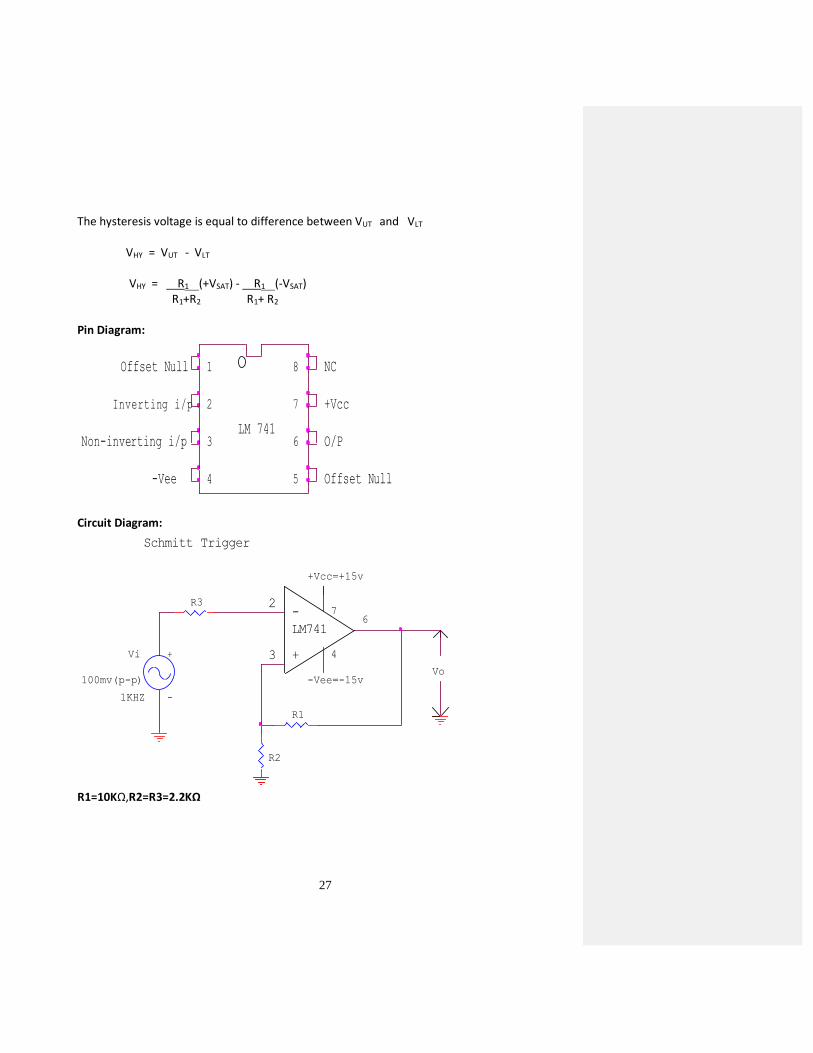
The hysteresis voltage is equal to difference between VUT and VLT
VHY = VUT - VLT
VHY = R1 (+VSAT) - R1 (-VSAT) R1+R2 R1+ R2
Pin Diagram:
1
Offset Null
O/P
4 5
6
7Inverting i/p
8
2 +Vcc
Non-inverting i/p 3
Offset Null
-Vee
LM 741
NC
Circuit Diagram:
+Vcc=+15v
Vo-Vee=-15v
72R3
-
100mv(p-p)
3 4Vi
LM7416
R1
-
1KHZ
+
R2
+
Schmitt Trigger
R1=10KΩ,R2=R3=2.2KΩ

28
MODEL GRAPHS: Input and output waveform of Schmitt trigger:
V0 versus Vin plot of hysteresis voltage:

29
PROCEDURE: 1. The circuit for Schmitt trigger is connected as per the given circuit diagram. 2. A sinusoidal input of 1 KHz is applied with the help of function generator. 3. A square wave output is obtained for the corresponding input for which the positive peak voltage (+Vsat) and negative peak voltage (-Vsat) are noted. 4. The upper threshold voltage (VUT) and lower threshold voltage (VLT) are calculated for the corresponding output. 5. The shift angle (θ) is calculated using the formula VUT= Vp Sinθ
Sinθ=VUT/ Vp
θ= Sin-1 (VUT/ Vp )
6. The hysteresis voltage (VH) is calculated using the formula VHY = VUT –VLT
Observations: Input applied: Vi (p-p mV) =
F=
T=
Output obtained: +Vsat =
-Vsat =
T=
F=
Calculations: Upper threshold voltage: VUT = R1 (+VSAT) R1+R2
Lower threshold voltage: VLT = R1 (-VSAT) R1+R2
Hysteresis voltage VHY = VUT –VLT
Shift angle θ = Sin-1 (VUT/ Vp)

30
Tabular Form:
Amplitude Time period
Input applied Vi (p-p) =
output applied +Vsat=
-Vsat =
PRECAUTIONS:
1. Loose and wrong connections are to be avoided. 2. The output waveforms should be obtained without and distortion. 3. Parallax error should be avoided.
Conclusion:
RESULT:
Viva questions 1. What do mean by Schmitt trigger? 2. What are the different applications Schmitt triggers? 3. What is meant by Hysteresis voltage? 4. What is meant by threshold voltage?
31
EXPERIMENT: 6 IC VOLTAGE REGULATOR
Aim: To obtain the voltage regulation of a 3-terminal fixed IC voltage regulator. Apparatus:
1) IC 7808 2) Capacitor 1µF, 0.1 µF 3) Voltmeter (0-10) V 4) Ammeter (0-100) mA 5) Decade resistance box (DRB) 6) TRPS 7) Bread board 8) Connecting wires.
Theory: A voltage regulator is an electronic device that provides a stable dc voltage independent
of load current, temperature and a.c voltage variations. Figure shows a regulated power supply
using discrete components. The circuit consists of following parts.
1. Reference voltage circuit
2. Error amplifier
3. Series pass transistor
4. Feedback network.
It can be seen from the figure that the power transistor Q1 is in series with the un-
regulated dc voltage Vin and the regulated output voltage Vo so it must absorb the difference
between these two voltages whenever any fluctuation in output voltage Vo occurs
The transistor Q1 is also connected as an emitter follower and therefore provides
sufficient current gain to drive the load. The output voltage is sampled by R1-R2 divider and
feedback to the negative input terminal of op-amp error amplifier sample the output voltage.
This sampled voltage is compared with the reference voltage Vref. The output voltage Vo’ of the
error amplifier drives the transistor Q1.

32
Internal Diagram:
-
+
-
3
26
74
Ro
RL
+A
+VEE
R2
IMZ 5.1
LM 307(error amp)power supply
R1
-VEE
BC 107Series pass transistor
78XX series are three terminal positive fixed voltage regulators. There are seven voltage
options available such as 5, 6, 8,12,15,18 and 24V. In 78XX series the last two numbers indicate
the output voltage. For example 7808 indicates 8V regulator.
79 series are also 3-terminal IC regulator with fixed output negative voltage regulator.
In the standard representation of monolithic voltage regulator a capacitor ‘C’ is usually
connected between input terminal and ground to cancel the inductive effect due to long
distribution leads.
CIRCUIT DIAGRAM:
3
2
MC
C112V C2
++
V-
+
(0-10V)
(0-100mA)
MC
3-Terminal Fixed Voltage Regulator
A-
-DRB
1 7808Regulator
C1 = 1µF , C2 = 0.1 µF

33
Procedure: 1. Connections are made as per the circuit diagram. 2. By adjusting the Voltage across RPS to 12V, the load terminals open circuited, the
voltmeter reading is noted. This gives the no load voltage. 3. The load is varied from 10KΩ to 50Ω with the help of decade resistance box the
corresponding voltmeter and ammeter reading are noted. 4. A graph is drawn between % voltage regulation on y-axis and load resistance on x-axis.
% voltage Regulation =
Tabular form VNL =
RL (Ω) I (mA) V (Volts) % Regulation
10KΩ
to
100Ω

34
Model Graph: % Regulation
RL in Ohms
PRECAUTIONS: 1. Loose and wrong connections are to be avoided. 2. The output waveforms should be obtained without and distortion. 3. Parallax error should be avoided Conclusion: RESULT: Viva questions
1. What do mean by voltage regulator? 2. What is error amplitude? 3. What is meant by error amplitude? 4. What is meant by threshold voltage?

35
EXPERIMENT: 7 UJT AS A RELAXATION OSCILLATOR
AIM: To obtain a saw tooth waveform using UJT and test its performance as an oscillator APPARATUS: 1) UJT-2N 2646 - 1 2) Resistors- 100 Ω -2 15 K Ω -1 3) Capacitors- 0.01 µf -1 4) TRPS -1 5) CRO -1 6) Bread board CRO probes and connecting wires ANALYSIS OF UJT: The voltage VBB is applied between B1 and B2. If IE=0, then voltage drop across RB1 is given by,
V1=
The ratio is termed as Intrinsic stand off ratio and is denoted by ɳ.
V1 = ɳVBB The value of emitter voltage, which makes the diode conduct, is termed as peak voltage and is given by
VP = VD + V1
VP = VD +ɳVBB
Expression for frequency of oscillation: F =1/T
=1/RC ln (1/1-ɳ)

36
MODEL GRAPHS: T1 T2 Vp Across C Vv t(ms) Vp Across RB1
Vr t(ms)
Across RB2 Vp Vr t(ms)
100Ω
(CRO)
CIRCUIT DIAGRAM
C1 100Ω
15KΩ
0.01µf
B2
VB2
VB1 B1
UJT2N2646 E
12V
VC
(CRO)
(CRO)

37
Observations:
Vv Vp T1 T2
Across C
Across RB1
Across RB2
T1----charging time period T2 ----discharging time period F -----frequency of oscillations F=1/T F=1/[RC ln [ (1/(1- η))] η =RB1/(RB1+RB2) PROCEDURE:
1. The circuit is connected as per the circuit diagram. 2. A supply of VBB =12v is applied to the circuit with the help of TRPS. 3. The output waveforms across capacitor, resistor R B1 and resistor RB2 are obtained from
the CRO. 4. The frequency of the corresponding signals is noted and the waveforms are plotted on
the graph sheet. PRECAUTIONS:
1) Loose and wrong connections must be avoided. 2) Parallax error should be avoided while taking the readings.
Conclusion: RESULT: Viva questions
1. What do mean by Intrinsic standoff ratio? 2. Why the wave form of RB2 is getting negative spikes? 3. What is meant by base bias resistor?

38
EXPERIMENT: 8
ASTABLE MULTIVIBRATOR USING 555 IC AIM:
To obtain a symmetric square wave output by maintaining certain duty cycle by using 555 IC.
APPARATUS:
1) 555 IC 2) Resistors 3.3 KΩ 3) Capacitors 0.1μF, 0.01μF 4) 10KΩ Potentiometer 5) TRPS 6) Diode 1N4007 1 7)CRO and CRO Probes
CIRCUIT DIAGRAM:
5
TIMER 1
2
1 0.1µfD
2
6
0.01µfD
7
RA 8
RB
4
Vcc =12v
3.3K
Output
10K
555 3
1N 4007

39
PIN DIAGRAM:
Ground
Trigger
Output
Reset
+Vcc
Discharge2
Threshold
Control voltage
1
3
5
6
4
7
8
555
MODEL GRAPHS:

40
Duty cycle: The capacitor voltage for a low pass RC circuit subjected to a step input of Vcc
volts is given by
Vc = Vcc (1- exp (-t/ RC))
The time t1 taken by the circuit to charge from 0 to 2/3 Vcc is,
2/3 Vcc = Vcc (1- exp (-t1/ RC))
t1 = 1.09 RC
The time t2 to charge from 0 to 1/3 Vcc is,
1/3 Vcc = Vcc (1- exp (-t2/ RC))
t2 = 0.405 RC
So the time to charge from 1/3 Vcc to 2/3 Vcc is
tHIGH = t1 - t2 = 1.09 RC - 0.405 RC = 0.69 RC
So, for the given circuit,
tHIGH =0.69 (RA+ RB) C
The output is low while the capacitor discharges from 2/3 Vcc to 1/3 Vcc and the voltage
across the capacitor is given by
1/3 Vcc = 2/3 Vcc (exp (-t/RC))
tLOW = 0.69 RC
For the given circuit, tLOW = 0.69 RBC
Total time period, T = tHIGH + tLOW = 0.69 (RA+2RB) C
Duty cycle = tHIGH /T = (RA+ RB)/ (RA+ 2RB)
For the modified circuit Duty cycle = RA / (RA+ RB )
41
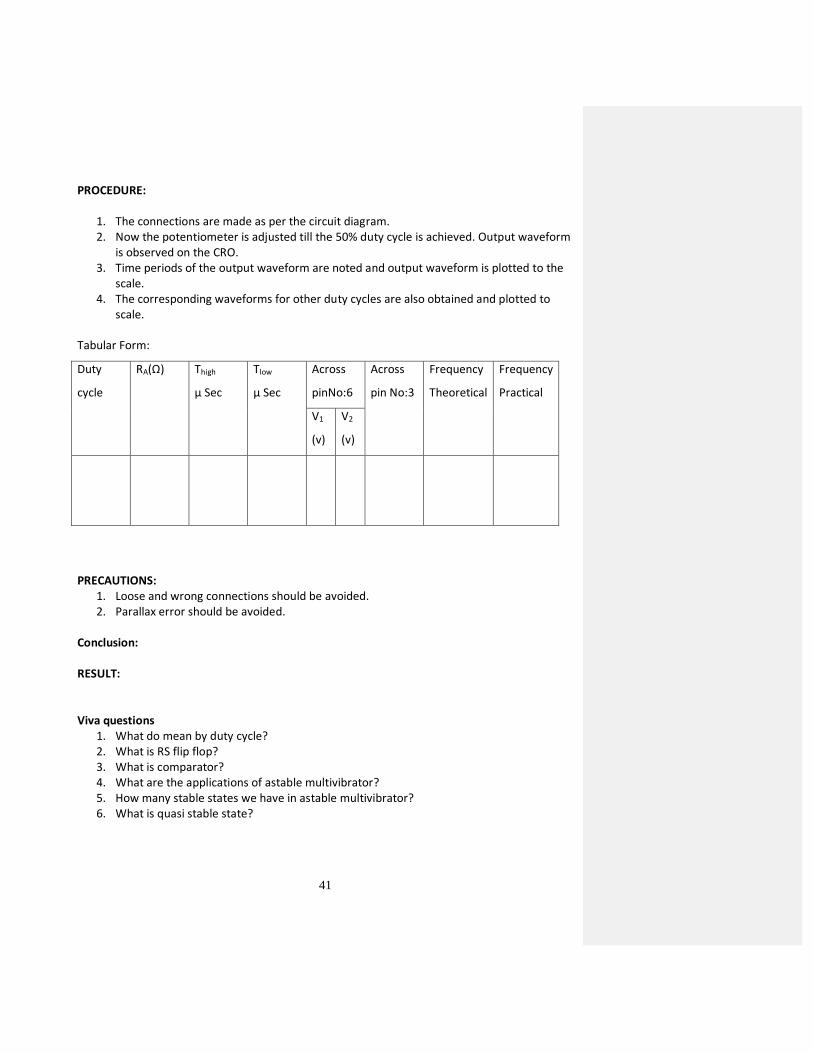
PROCEDURE:
1. The connections are made as per the circuit diagram. 2. Now the potentiometer is adjusted till the 50% duty cycle is achieved. Output waveform
is observed on the CRO. 3. Time periods of the output waveform are noted and output waveform is plotted to the
scale. 4. The corresponding waveforms for other duty cycles are also obtained and plotted to
scale.
Tabular Form:
Duty
cycle
RA(Ω) Thigh
µ Sec
Tlow
µ Sec
Across
pinNo:6
Across
pin No:3
Frequency
Theoretical
Frequency
Practical
V1
(v)
V2
(v)
PRECAUTIONS: 1. Loose and wrong connections should be avoided. 2. Parallax error should be avoided.
Conclusion:
RESULT:
Viva questions
1. What do mean by duty cycle? 2. What is RS flip flop? 3. What is comparator? 4. What are the applications of astable multivibrator? 5. How many stable states we have in astable multivibrator? 6. What is quasi stable state?

42
EXPERIMENT: 9 BISTABLE MULTIVIBRATOR AIM: To design and study the Fixed Bistable multivibrator using transistors. APPARATUS:
1) Transistors BC 107 –2 2) Resistors 100KΩ –2 2.2KΩ -2 15kΩ -2 3) Light emitting diodes -2 4) Regulated power supply-1 5) Bread board and connecting wires 6) Digital multi meter (0-20V) -1 DESIGN OF A BISTABLE MULTIVIBRATOR: For the given Vcc, VBB, hfe (min), Ic (sat) it is possible to compute the values of Rc1, R1 and R2. The following assumptions are made in order to design the bistable fixed bias multivibrator.
1. If Q1 and Q2 are identical silicon transistors, the junction voltages are assumed as VCE (sat) = 0.3 V and VBE (sat) = 0.7 V.
2. The base current of the ON transistor is taken as 1.5 times of the minimum value of base current.
IB = 1.5 IB (min) Where IB (min) = Ic (sat) / hfe (min)
3. The current through R2 of the ON transistor is taken as one tenth of IC. If Q2 ON, I4 =IC2/10. 4 The current through R1 is ignored since it is quite small in comparison with the collector current of ON transistor. To find RC: RC=VCC-VD/I2=VCC –VCE (sat)/IC (sat)
RC1=RC2 To find R2: The current though R2 is I4, where I4=IC2/10=IC(sat)/10. R2=[VB- (-VBB)]/I4

43
To find R1:
The current through R1 is I’ I’=IB2+I4
IB2=1.5 IB(min) Where IB(min)=IC(sat)/hfe(min).
I1=I’ I1=VCC-VB/RC1+R1
R1=[VCC-VBE(SAT)/I1]-RC1
CIRCUIT DIAGRAM:
LED1 LED2
Q1
-VBB(-15v)
Q2
3
2
1
A B
2.2k
C
2.2k
D
+VCC(+15v)
15k 15k
100k
3
2
1
100k
BC107 BC107

44
PROCEDURE: 1. The connections are made as per the circuit diagram. 2. The supply is switched on and it is observed that one LED is ON whereas the other is OFF. 3. Now the base voltages of both the transistors VB1 and VB2 and collector voltages VC1 and VC2
are noted. 4. A negative trigger is given at the base of the ON transistor to change the states of the transistors. 5. In this steady state the base voltages of both the transistors VB1 and VB2 and also the collector voltages VC1 and VC2 are noted. PRECAUTIONS:
1. Loose and wrong connections should be avoided. 2. Parallax error should be avoided.
Conclusion:
RESULT: Viva questions
1. What is stable state? 2. Name the types of multivibrators? 3. What is quasi stable state? 4. How many stable states are there in binary? 5. What is the need of triggering 6. What are the types of triggering are there in multivibrator?

45
EXPERIMENT: 10 FREQUENCY RESPONSE OF ACTIVE FILTER
AIM:
To obtain the response of active filters by varying the frequency. APPARATUS: 1) OP-AMP LM 741C –2 2) Resistors 10kΩ –4
16 KΩ -3 3) Capacitors –0.01µf –3 4) Function generator
5) TRPS 6) CRO & CRO Probes
7) Connecting wires & bread board THEORY: Filters are frequency selective networks, which can allow desired range of frequencies and attenuates other frequencies. Filters are classified: 1. Passive and Active filters 2. Analog and Digital Filters Depending on the type of the elements used as resistor, capacitor, and inductor such a type of filter is called as passive filters. By using op-amp and transistor on addition to passive elements, they are called as active filters. Depending on the range of frequencies the active filters can be classified as low pass, band pass, high pass, all pass, band reject filters. CIRCUIT DIAGRAM:
6
741C
4
- 7
+
HIGH PASS BUTTERWORTH FILTER
16K
Circuit diagram
0.01MFD
Vi(100 mv) P-P
10K +VCC(+15V)
-VEE(-15V)
Vo
2
10K
3

46
LOW PASS BUTTERWORTH FILTER
MODEL GRAPHS: HGIH PASS BUTTERWORTH FILTER
LOW PASS BUTTERWORTH FILTER

47
DESIGN: Design of I order Butter worth filter: Given the cut off frequency FL, AO,
FL =1/2RC Assume C and then substituting the value in the above formula Find R, using AO and assuming R1 find RF PROCEDURE: 1. The circuit is connected as per the circuit diagram 2. The Frequency of the input signal is varied and the Corresponding out put voltage is noted. The magnitude of the input Signal is kept constant through out the experiment. 3. The gain for each frequency is calculated using the formula
Gain in dB=20 log (VO/VI). 4. A graph for gain v/s frequency is plotted which is known as Frequency response.
TABULAR FORM: INPUT VOLTAGE:100 mv (p-p) HGIH PASS BUTTERWORTH FILTER
Frequency (Hz)
Out Put Voltage(V)
Gain=20log(v0/vi) (dB)
100Hz
to
1M Hz

48
LOW PASS BUTTERWORTH FILTER
Frequency (Hz)
Out Put Voltage(V)
Gain=20log(v0/vi) (dB)
100Hz
to
1M Hz
PRECAUTIONS: 1. Loose and wrong connections should be avoided.
2. Parallax error should be avoided. Conclusion:
RESULT:
Viva questions 1. What is filter? 2. What is an active filter? 3. What is high pass filters & low pass filters? 4. Name the types of filtes? 5. What is butter worth filter?

49
EXPERIMENT: 11 IC OP-AMP BOOT STRAP RAMP GENERATOR
AIM: To generate a ramp wave forms by maintaining constant current conditions by using a boot strap ramp generator with an op-amp 741IC as voltage follower.
APPARATUS:
1. Diode 1N4007 - 1 2. Op-amp: LM 741C -1 3. Capacitors --33kpf -1 0.02µf -1 2.2 µf -1 4. Resistors - 47kΩ, 470kΩ, 10kΩ 5. Transistors-BC107 6. Function Generator. 7. TRPS 8. Bread Board & Connecting Wires
9. CRO & CRO Probes DESIGN: For a given Maximum diode current is IR =3µA Allowing 1% non linearity due to IR I1=100 IR C1=I1 ( Ramp time/VP)
Assume VP =8V VR1=VCC-VD1-VCE (sat) R1=VR1/I1
For 1% non-linearity due to C3 discharge: VC3=VCC
VC3=1% of Vcc C3 discharges current I1 C3=I1 ( t / VCC ) Calculation of C2: Minimum Ic of Q1= 10 I1
IB=IC/hfe
I=VCC-V1/RB where RB=VCC-VBE/IB
C2=I ( t/ V)

50
PIN DIAGRAM
Output
-offset null
1
2
LM 741C
3
4
+Offset null
Inverting input
5
6Non inverting input
7
-VEE
8 No connection
+VCC
10K
4
47K
7
1N4006
3
Vcc
2.2µF
+Vcc
+
(+15V)
-
1
2
(-15V)
-
BC107
2
+ 6
-
(+15V) CIRCUIT DIAGRAM
2V
3
2
1
1KHZ
0.02µF
RL
741C
-VEE 33KPF
470K

51
MODEL GRAPHS: input Vi t ms output Vi VCE
(SAT) t ms PROCEDURE: 1. The circuit is connected as per the circuit diagram. 2. A square wave of 2V (p-p), 1 KHz is applied with the help of function generator to the base
of a transistor. 3. The corresponding input and output waveforms are noted from the CRO 4. The graphs are plotted for the input and output waveforms.

52
OBSERVATION
VCE =
Output Voltage Vo =
Sweep time Ts =
PRECAUTIONS: 1. Loose and wrong connections should be avoided. 2. Parallax error should be avoided. RESULT: Viva questions
1. What is sweep circuit? 2. How the Op-amp acts as a emitter follower? 3. How the current constant is maintained in Boot strap? 4. Name different types of ramp generator?

53
MAJOR EQUIPMENT IN LINEAR IC’S & PULSES CIRCUITS LABORATORY
S.NO DESCRIPTION MAKE QUANTITY
1. 20 MHz DUAL TRACE OSCILLOSCOPE AP LAB
/SCIENTIFIC
21
20 MHz DIGITAL STORAGE OSCILLOSCOPE FALCON
2. 1 MHz FUNCTION GENERATOR WITH
DIGITAL DISPLAY
AP LAB/
PACIFIC
18
3. TRPS 0-30V, 2A DUAL CHANNEL ITL/PACIFIC
/FALCON
20
4. DC MICRO & MILLI AMMETERS MECO/HI-
Q/AQUILA
46
5. DC MICRO VOLTMETER MECO/HI-
Q/AQUILA
18

54
6. BENCH TOP DIGITAL MULTIMETER METRAVI/
MECO
15
7. 5KVA SERVO CINTROLLED STABILIZER ITL 01
TOTAL EXPENDITURE OF LABORATORY: Rs: 6,30,679.71/-


