
Letting Down the Team? Social Effects of Team Incentives
Philip Babcock, Kelly Bedard, Gary Charness, John Hartman, and Heather Royer
Department of Economics University of California, Santa Barbara
September 9, 2014 Abstract: This paper estimates social effects of incentivizing people in teams. In three field experiments featuring exogenous team formation and opportunities for repeated social interactions, we find large team effects that operate through social channels. In particular, assignment to a team treatment increases productivity by 9 to 17 percent relative to an individual incentive treatment, even though the individual incentive yields a higher private return. Further, we find that in a choice treatment individuals overwhelmingly prefer the individual incentive to the team incentive, despite the latter being more effective. These results are most consistent with the team effects operating through guilt or social pressure as opposed to pure altruism. JEL Classifications: B49, C93, J01, J33 Keywords: Field experiment, team incentives, social effects Acknowledgements: We would like to thank Ted Bergstrom, Tom Chang, Uri Gneezy, Michael Kuhn, Peter Kuhn, Justin Sydnor, and participants at the Southwest Economic Theory Conference 2011, Southern California Conference in Applied Microeconomics 2011, the Society for Labor Economics 2011, University of Stavanger Conference on Work and Family, and Yale University for helpful comments. We particularly thank Chris Clontz for assistance with UCSB Recreation Center usage information and Mac Brown for assistance running the third round of this experiment. We would also like to thank Sabrina Benyammi, Luke Bodendorfer, Morgan Carpenter, Kevin Cornea, Stefanie Fischer, Jack Giuliano, Laurie Ho, Ryan Knefel, Jennifer Milosch, Ruth Morales, Bonnie Queen, Ryan Smart, Carina Rammelkamp, George Tam, Iwunze Ugo, Kevin Welding, and Allison Witman for excellent research assistance. Contact: Kelly Bedard, [email protected], Gary Charness, [email protected], John Hartman, [email protected], Heather Royer, [email protected].

1
1. Introduction
Recent interest in incentives to elicit effort or alter behavior is pervasive and growing,
particularly in the domains of education and health.1 One common feature of these incentive programs is
their use of individual-based incentives; that is, an individual’s payment is tied to his/her own behavior.
But can we elicit more effort by changing the structure of these incentives? In particular, a vibrant but
separate literature suggests that peers influence one another through social interactions or social pressure.2
Incentive structures, then, that take advantage of the full potential of these social influences may be quite
effective.
Some believe that team compensation accomplishes this. One can imagine that peer influences
are magnified when teammates’ incentives are linked. In real-world environments such as firms, the
military, and health and wellness programs, it is not uncommon to see team-based incentives.3 A best-
selling management consultant goes so far as to argue that team incentives are more effective than any
other policy, and that the effectiveness derives from social factors: “More than any policy or system, there
is nothing like the fear of letting down respected teammates that motivates people to improve their
performance.”4
To understand the impact of team incentives, we analyze the results of three separate field
experiments in a university setting, two featuring pay-for-studying, which incentivized attendance at a
study room in the library and the other featuring pay-for-exercise, which incentivized gym attendance.
We study the effect of team-based incentives, focusing primarily how they work relative to individual-
1 In the context of schooling, Angrist, Lang, and Oreopoulos (2009), Kremer, Miguel, and Thornton (2009), Barrow et al. (2012), Bettinger (2012), and Fryer (2011) study how incentives affect students’ performance. Charness and Gneezy (2009), Volpp et al. (2009), Acland and Levy (2011), John et al. (2011), Royer, Stehr, and Sydnor (2012), and Babcock and Hartman (2012) show that financial incentives can potentially promote healthy behaviors such as exercise, weight loss, and smoking cessation. 2 References include Sacerdote, 2001, Zimmerman 2003, Bandiera, Barankay, and Rasul, 2005, 2010, 2013, Falk and Ichino 2005, Boisjoly et al, 2006, Foster 2006, Lyle, 2007, Kremer and Levy, 2008, Carrell, Fullerton, and West, 2009, Mas and Moretti, 2009, and Carrell, Hoekstra, and West, 2011. 3 As a small snapshot of examples, see http://businessfinancemag.com/article/tailored-team-compensation-0501, http://compensationmaster.com/articles/tips-for-compensating-teams.html, http://www.teambuildinginc.com/article_incentives.htm, http://smallbusiness.chron.com/advantages-offering-teambased-incentive-pay-plan-21644.html, and http://www.mbaknol.com/human-resource-management/team-based-compensation-system/. 4 Lencioni (2002), p. 213.

2
based incentives. These are two settings in which the power of peers has been emphasized and provide
controlled environments in which to learn about social effects related to effort elicitation.5
In both settings, subjects were randomly assigned to (a) a control group, which received either no
incentives or minimal incentives,6 (b) an individual-incentive group, which earned incentives based on
their own behavior, or (c) a team-incentive group, which was subject to the same-sized monetary
incentives as the individual incentive group but whose payment was mainly contingent on the behaviors
of a randomly-assigned and known teammate. Our primary interest was to contrast how individuals
behaved in the team-incentive versus in the individual-incentive group. Under our incentive schemes,
individuals could earn a $25 bonus for attending the gym at least 5 times or the library at least 4 times,
during a specified two-week period. However, under the team incentive, the bonus was dependent on
whether both partners went the required number of times.7 The goal of our experimental design is to tease
out the social effects of incentives. To be clear, we define such effects as those that are related in a direct
way to the utility an individual derives from interacting with others, including but not limited to effects
from altruism, guilt, shame, embarrassment, commitment devices, social pressure, or a desire to be liked
or respected.
Despite the pervasiveness of the perception about the effectiveness of team incentives and their
prevalence, especially in the workplace, there is a scarcity of empirical research. In a series of papers on
workplace incentives among fruit pickers, Bandiera, Barankay, and Rasul (2005, 2010, 2013) emphasize
the value of social-type incentives. Bandiera, Barankay, and Rasul (2005) contrast piece rate and relative
pay schemes. In the relative pay scheme, a worker’s productivity is compared to the average productivity
of his/her co-workers. If he/she is more productive, he/she earns more. Bandiera, Barankay, and Rasul
(2010) test the value of social connections in an observational design to test whether workers are more
5 The new Go4Life campaign funded by the National Institute on Aging (http://go4life.niapublications.org/) to encourage physical activity for older Americans allows participants to sign up with a buddy to increase motivation. The website (http://www.exercisefriends.com/home.aspx) allows individuals to find others with whom to exercise. 6 In the case of studying, we incentivized attendance to a study room in the library. Since we would not be able to monitor the attendance of students who did not receive incentives, the control group in the study experiment earned $2 per visit up to a certain number of visits. 7 Subjects in the individual- and team-incentive groups both earned $2 per visit up to a certain number of visits.
3
productive if they have more social ties to their co-workers. Bandiera, Barankay, and Rasul (2013)
contrast piece rates, rank incentives, and tournaments among endogenously-chosen teams but do not
compare them to individually-based incentive schemes. In the domain of education, Fryer et al (2012) is
primarily interested in how loss aversion can be exploited to harness the power of incentives but they
have an individual versus team component in their experiment. Teachers received a $4,000 incentive
payment at the beginning of the year but were forced to pay it back if performance measures were not
met. For those in the team treatment, the performance measure was based on the team’s average
performance. In an environment more closely related to our own, Kullgren et al (2013) compares how
well individual-based incentives for weight loss work relative to team-based incentives, but teammates
are unknown. Generally speaking, these studies conclude that team-based incentives and social
connections can improve task performance.
Several features of our incentive scheme make this study unique. First, the potential payout under
both the individual and team incentive schemes is the same. In Kullgren et al (2013), those in the team
treatment can earn more than those in the individual treatment; team members who are successful earn
more than individual-treatment subjects when their teammates are unsuccessful. Second, the success of
one’s teammate exhibits a positive externality on oneself whereas the opposite is true in Bandiera,
Barankay, and Rasul (2005) and Kullgren at al (2013). Third, our tasks involve minimal production
complementarities. In most research, the possibility of production complementarities is significant. For
example, for workers at a garment factory (Hamilton, Nickerson, and Owan, 2003) or teachers (Fryer et
al., 2012), complementarities in the form of specialization, knowledge transfer, or other factors could lead
to team incentives being particularly effective. Fourth, unlike in Fryer et al. (2012), our team incentive
structure precludes free riding.8
8 This nonlinear incentive structure is similar in spirit to Holmstrom’s (1982) “forcing contracts” except that effort here is observable.
4
While the last two features of our experiment may make the study less generalizable to real-world
settings,9 we view them as assets of this study. Since social effects can arise for many reasons (e.g.,
production complementarities, free riding, knowledge transfer), closing off these channels helps to
uncover the mechanisms behind why team incentives may work. We have set up our experiment in an
attempt to isolate the social pressures aspect of team incentives. Kandel and Lazear (1992) argue that
many practices at firms have more to do with creating social pressure in the form of “empathy, loyalty,
and guilt” than with improving the production process in a direct way. Understanding why team
incentives may work can help in ascertaining when and in which environments team incentives may be
effective.
In an effort to understand our reduced-form treatment effects, we develop and estimate a simple
structural model. In this model, if there is no social component to utility and there is some nonzero
probability of default by one’s partner, then attendance will be higher for those in the individual treatment
than for those in the team treatment. But if attendance is higher (or even the same) in the team treatment,
we interpret this as evidence of the existence of social effects. We leverage differences across the
different treatments to estimate the size of the social effect.
We try to unpack the social effect further using results from two other treatments. In the first
round of the studying experiment, we included an anonymous team treatment arm, which was identical to
the team treatment but the teammate was unknown. In such a setting, we would expect the social effect to
be less strong except in the presence of strong altruism or guilt (i.e., social-component utility being
equally strong in the presence of strangers or known persons). In the second round of the studying
experiment we included a choice treatment arm in which subjects could choose between the individual-
incentive treatment and the team-incentive treatment. In this treatment, those who chose team incentives
were assigned a partner at random from the class. The inclusion of the choice treatment helps us to
9 In the military, for example, it is common in boot camp for individuals to be incentivized in much the same manner as in our experiment: When one fails, all members of the team are punished. Kandel and Lazear (1992) argue that “Guilt, in the form of loyalty to… comrades, provides incentives that operate even in the absence of observability. Thus the military spends much time and money creating loyalty and team spirit” (p.807).

5
understand whether the social effect we estimate is better interpreted as altruism or social pressure. The
social-pressure model, as in DellaVigna, List, and Malmendier (2012) for example, posits that people
dislike the pressure of making others fail, rather than genuinely caring about others.
This study adds to the growing literature on the effects of social pressure and guilt. Perhaps the
earliest work is Asch (1951), who found that subjects in a perceptual task were dramatically swayed by
the estimations of their peers. More recently, experimental work by Falk and Ichino (2006) shows that
people work differently when a peer is present in the same room and working on the same task; peer
effects raise the mean of productivity and reduce its variance. Mas and Moretti (2009) consider peer
effects in the workplace, using data on worker productivity from a large supermarket chain. They find
strong evidence of positive productivity spillovers from the introduction of highly productive check-out
personnel into a shift. Charness, Rigotti, and Rustichini (2007) and Andreoni and Bernheim (2009)
observe strong effects from being observed by an audience of one’s peers. In the realm of guilt, Charness
and Dufwenberg (2006, 2011) find strong evidence of guilt aversion, where one feels guilty to the extent
that one believes that one has not met another party’s expectations.10
Our analysis points to several interesting results. First, to our surprise, the team treatment
outperformed the individual treatment. Specifically, in the pay-for-study intervention, the average
visitation rate for subjects in the team treatment was 20 percent higher than that for subjects in the
individual treatment. We estimate similar but slightly more nuanced effects for the gym study. Second, if
the partner was unknown as in the anonymous treatment, the treatment worked less well. Subjects in the
anonymous team treatment visited the study room 29 percent less often than those in the individual
treatment. Thus, any social component of utility – either through altruism or guilt – is less likely to
operate when the teammate is unidentifiable. Third, when given the choice between the team and
individual treatments, nearly all individuals (97 percent) chose the individual treatment. This suggests that
the estimated social effects operate through guilt rather than altruism.
10 Battigali and Dufwenberg (2007, 2009) provide theoretical models of guilt aversion.
6
An interesting side point of the study compares subjects in the choice treatment with subjects who
were assigned to the individual treatment. We find that those assigned to the choice treatment had a
visitation rate that was 27 percent higher than for the individual treatment group. This difference cannot
possibly be explained by selection since only 3 percent of the subjects chose the team treatment. Previous
studies have found that people who select into an activity perform that activity better, but these
differences could be due to both choice and selection. Because we have essentially no selection, the
present study is one of the first clean demonstrations that per se choosing one’s environment can have a
beneficial effect on one’s performance.11
We view our study as a first step to developing programs to address the lingering issues of
obesity and poor academic success. To be clear, the purpose of our study is to develop effective incentive
structures that alter studying and exercising behaviors. We believe that the length of these interventions is
too short to observe effects on downstream outcomes such as educational outcomes and health. But given
a link between studying and exercise behaviors and educational outcomes and obesity, it is possible that
more intensive versions of our intervention could lead to improvements in these long-run outcomes.
2. Conceptual Framework
To fix ideas, it is worth developing a simple framework to track benefits and costs for the
incentive schemes in our experiment. Consider a program analogous to our own in which individuals
receive a bonus pay-off for completing an effort-intensive task. We imagine two incentive schemes. In the
individual treatment, person i gains utility Ui = Vi + B - Ci from completing the task, where V is the
intrinsic value i has for completing the task, B is the utility derived from the bonus earned for completing
11 Dal Bó, Foster, and Putterman (2010) and Sutter, Haigner, and Kocher (2010) do make very serious attempts at dealing with the selection problem, but the results are nevertheless not as pure as in our study. Corgnet, McCarter, and Hernan (2014) assign people to a setting in which the internet is turned off in the first part of the experiment, while people vote on whether to do so in the second part. All but one group voted to turn off the internet, with production (at least for the subjects who used the Internet in the first half of the experiment) larger with voting. Herbst, Konrad, and Morath (2014) compare behavior of individuals who self-select into teams to behavior in exogenously-formed teams. They find that choice leads to higher efforts than assignment to teams, even though, in their experiment, selection works against this effect.
7
the task, and C is the effort cost of completing the task.12 If person i does not complete the task, he earns
zero. In the second treatment, there is an additional condition: The individual is assigned a teammate j and
receives the bonus only if his teammate also completes the task. We define pj as the probability that
person i assigns to his/her partner (person j) completing the task and θ as the magnitude of the social
effect. This is the degree to which enabling person j to earn the bonus enters person i’s utility function.
We emphasize that this is not, strictly speaking, an altruism parameter, though it could be due in part to
altruism and enters the utility function in the way traditionally used to capture altruism. (It could instead
capture guilt, embarrassment, fear of social punishment, commitment and other subtle social responses
that will be discussed in Section 5.). Lastly, imagine there is also a control group that receives no external
compensation for completing the task and whose utility for completion, Ui = Vi - Ci, is based entirely on
the intrinsic benefit and cost. The conditions under which various subjects complete the task are then:
(1a) Control Group: Undertake the action if: 0
(1b) Individual Treatment: Undertake the action if 0 (1c) Team Treatment: Undertake the action if: 0.
There are, of course, other ways of modelling these behaviors. An alternative view on the team
treatment is to consider that an individual receives no social utility gain when his/her partner is
successful. Instead, an individual loses utility if his/her partner is successful and she/he is not. This
follows in spirit from the DellaVigna, List, and Malmendier (2012) social-pressure model. In this case,
the analog to (1c) is equivalently:
(1c’) Team Treatment: Undertake the action if:
12 We make the simplifying assumption that all individuals receive the same benefit.
8
where is expected utility loss if the task is not completed.13 One should note that the condition
simplifies to (1c) when . While the structural estimation is therefore unchanged, the welfare
implications are different.
We use the choice treatment to shed light on which explanation is more important. Under (1c),
only individuals with large pj and/or large would choose the team treatment. Under (1c’), no one would
ever choose the team treatment. Of course, these predictions assume that the parameters of the utility
function do not change when one is forced to perform an action as opposed to when one chooses to
perform an action.
We model the decision to undertake the action in the team treatment for person i to be
independent of the cost of effort for person j (his/her partner) and we also consider that pj is exogenous to
person i. Person i takes j’s effort level as given, ex ante. The decision to abstract from strategic behavior
is motivated by the fact that it would be difficult or nearly impossible to model such interactions without
information about beliefs. Also, we do not allow for strategic behavior in the form of side payments
between teammates. We monitored teammates closely when the assignment of teammates occurred and
subsequently when payments were delivered. We observed no evidence of threats or negotiation of side
payments. In fact, at the time of payment, most teammates seemed unaware of the degree of their
partner’s attendance.
Overall, if there is no social component to utility ( = 0) and the probability of partner default is
greater than 0, then individuals are more likely to undertake the action under the individual treatment than
under the team treatment. If incentives work at least as effectively in the team treatment as in the
individual treatment, we will interpret this as evidence that social effects exist and are large enough to
compensate for lowered expectations of monetary gain. Leveraging the three treatments in the
experimental design will also allow us to estimate , and quantify the magnitude of the social effect
13 We thank the editor, Stefano Della Vigna, for suggesting this.
9
relative to the direct pecuniary effect. At the end of the paper, we will consider several different
behavioral mechanisms and speculate about which are most consistent with our findings.
3. Experimental Design and Sampling
A. Experimental Design, Pay for Studying
In the pay-for-studying part of the experiment, subjects were recruited in several classes in two
separate rounds at University of California, Santa Barbara in fall 2011 and fall 2013. We summarize the
design here and relegate further details to the appendix. Each round of the experiment consisted of two
phases: (1) a recruitment phase involving the completion of a paper survey at the beginning of class, and
(2) following class (and outside of the classroom), informing participants of their treatment status.
At the beginning of class, we asked students to fill out a short survey. Most students present in
class filled out this survey. Each survey had a unique identifier that determined the treatment arm but
which students were unable to decipher. In fact, few (if any) students were cognizant of the presence of
the identifier.14 At the end of class, we organized students into groups based on each individual’s unique
identifier. Then, we informed each of these groups of their treatment assignment. We had a separate
member of the research team describe the treatment to each group. To induce students to show up at the
end of class, we told them of their opportunity to earn additional money and of their eligibility to win one,
or more, $50 raffles (large classes were allocated more than one prize). Participation rates were high (68
percent or higher).15 It is also important to note that essentially everyone who came outside to participate
in the experiment stayed through the assignment of treatments and the raffle; four individuals left during
treatment assignment in 2011 and six people left during treatment assignment in 2013. In other words,
this type of attrition is always less than one percent. For descriptive ease, we refer to the students who
14 We varied the scheme mapping the identifier to treatment assignment across classes as described in the appendix. 15 Participation rates are defined as the fraction of students filling out the survey at the beginning of class that showed up after class to participate in the experiment.
10
decided to participate in the after-class part of the experiment as participants throughout the paper. These
participants form our main estimation sample.16
Participants were incentivized to attend the 24-hour study room in the UCSB library over a two-
week period during the fall quarter.17 We required students to attend at least 40 consecutive minutes
between the hours of 11am and 7pm on Monday-Friday. Visits at the study room were supervised by a
member of the research team; the research team did not divulge the attendance record of others when
subjects inquired. Further details on data collection are discussed in the appendix. Subjects could receive
credit for no more than one visit in a day. The treatment groups and control group were as follows:
Control: Subjects were eligible to earn $2 per visit (up to 4 visits).
Individual Treatment: Subjects were eligible to earn $2 per visit (up to 4 visits), but also received an
additional bonus of $25 for attendance equal to or exceeding 4 visits ($33 in total possible earnings).
Team Treatment: Subjects were eligible to earn $2 per visit (up to 4 visits), but also received an additional
bonus of $25 if and only if both team members accumulated four or more eligible visits. Team members
were randomly assigned via unique identifiers on their initial in-class survey. Team members were not
required to attend the study room at the same time. As it could be important that team members had a
chance to meet and talk, we had teammates stand next to each other during the second phase of the
experiment (i.e., the sign-up process outside of class) and exchange names by filling out their partner’s
name and email on a sheet of paper.
16 Online Appendix Tables 1 and 2 report the distribution of enrollment sizes, the number of in-class surveys collected, and the number of experiment participants in fall 2011 and 2013. The difference between the survey completion rates and the rates of showing up after class of roughly 30 percent is not large when gauged against other field experiments (e.g., Card, Mas, Moretti, and Saez, 2012). The difference between enrollment size and survey response reflects almost entirely differences in class attendance, late arrival, and subjects enrolled in multiple classes used in this study. While exact class attendance is unknown on the day of recruitment, the vast majority of students present in class completed the survey. Online Appendix Table 3 reports the analogous information for the Rec Center experiment described later. 17 During the first round the study-room dates were October 10-21, 2011, and during the second round they were October 28 - November 8, 2013.

11
Anonymous Team Treatment: Subjects were eligible to earn $2 per visit (up to 4 visits), but also received
an additional bonus of $25 if and only if both team members accumulated four or more eligible visits.
Differently from the team treatment, the teammate was randomly assigned but unknown (i.e., a member
of a different class). This treatment was included in the fall 2011 round only.
Choice Treatment: During the sign-up process, subjects assigned to this treatment were told about both
the team and individual treatments. They then had the choice of either one. Subjects were clearly told that
they would not learn the identity of their partner until after choosing between the treatment options. This
treatment was included in the fall 2013 round only.
Several aspects of the experimental design warrant comment. First, the “control” subjects were
paid a minimal incentive of $2 per visit. This was done because absent our experiment, study room usage
is not recorded. In all treatments, students can earn $2 per visit. Thus, the experiment offers variation in
bonus size ($0 versus $25) and the method of earning the bonus (either dependent on one’s own behavior
or the combined behavior of oneself and a randomly-assigned partner). Second, to encourage studying we
emphasized that it was a study room and we monitored subjects. Students appeared to be studying rather
than socializing. Third, since subjects in the team treatment are in the same class and we conducted the
experiment mid-way through the quarter, the experiment was designed to allow for repeated interaction
between teammates. To ensure treatment salience, subjects were reminded via email of their treatment at
the end of the recruitment week. In addition, subjects were informed that payments would be made with
several weeks left in the quarter. Thus, there was ample time for social interaction after team members
received information (i.e., payment) that potentially revealed whether they had “let down the team.”
B. Experimental Design, Pay for Exercise
For the pay-for-exercise part of the experiment, subjects were recruited at several classes at
University of California-Santa Barbara during the second summer session in 2010. The sign-up process
12
was similar to that for the library experiment except that there was no anonymous team treatment or
choice treatment. All details are the same as in the library experiment, except as stated below.18
In this part of the experiment, subjects were incentivized to attend the UCSB Recreation Center
(“Rec Center”) from August 7-20, 2010. The Rec Center is the on-campus student gym, which is free for
registered students. The Rec Center collects electronic data of ID card swipes. Note, unlike in the
studying experiment, we do not require that students spend a specified amount of time at the Rec Center,
but it should be noted that the Rec Center is located sufficiently far away from the academic buildings
that Rec Center attendance incurs substantial time cost.
As in the studying experiment, all subjects were eligible for the $50 raffle. Unlike in the pay-for-
study experiment, control subjects were not paid for visits. This is because the Rec Center, unlike the
library, requires subjects to sign in and records their logins. Subjects were randomly assigned to one of
the following groups:
Control: Subjects were not eligible for extra payment.
Individual Treatment: Subjects were eligible to earn $2 per visit (up to 5 visits), but also received an
additional bonus of $25 for attendance equal to and exceeding 5 visits ($35 in total possible earnings).
Team Treatment: Subjects were eligible to earn $2 per visit (up to 5 visits), but also received an additional
bonus of $25 if and only if both team members accumulated 5 or more eligible visits.
4. Empirical Results – Pay for Studying
We divide the discussion of the empirical results in two sections. We first describe the results for
the pay-for-studying experiment and then describe the results for the pay-for-exercise experiment.
18 As in the pay-for-studying set-up, attrition during treatment assignment was less than one percent, only three people left during this process.
13
A. Pre-Treatment Descriptive Statistics
Table 1 shows the sample means of self-reported characteristics (gender, age, and pre-treatment
library usage) by treatment status for participants in the pay-for-studying experiment. Columns (2) – (6)
report the differences in mean characteristics between the control group and each of the other treatment
groups. Age, gender, and pre-treatment library usage do not differ significantly between the control and
treatment groups as indicated by the p-values reported in the table.
B. Results
The primary treatment effect finding is easily seen graphically. Figure 1 shows the distribution of
study room visits during the treatment period, by treatment group. The data are pooled across the two
rounds. The top category, four visits, includes all participants with four or more visits. Notice the stark
rightward shift of the distribution for all treatments relative to the control group. For our purposes, the
most important contrast is between the individual and team treatments. While both incentive schemes
produced an effect, the team treatment resulted in more visits. This is in spite of the fact that within the
team treatment the risk of a partner’s default (not making four or more visits and hence making their
partner ineligible for the bonus) was 54 percent. It is clear, then, even at first glance, that large, team-
related social effects are implied, because the visitation rate in the team treatment is 22 percent higher
than in the individual treatment.
We formalize the analysis using the following simple regression specification:
(2) ijjChoice
ijAnon
ijTeam
ijAny
ijij TTTTY 43210 ,
where Yij is an attendance outcome for individual i in round j (either 2011 or 2013), TAny is an indicator
variable for having been randomized into any of the four treatment groups, TTeam is an indicator variable
for being in the team treatment, TAnon is an indicator variable for being in the anonymous treatment, TChoice
is an indicator variable for being in the choice treatment, is an indicator for 2013, and ε is the usual
error term. The coefficient of primary interest is β2, as this captures the difference between team and
14
individual treatment effects. In the absence of social effects, we would expect β2 to be negative (i.e., the
team treatment to do worse).
We examine three attendance outcomes: (1) the number of study room visits during the treatment
period; (2) whether the subject went at least once to the study room during the treatment period; (3)
whether the subject used the study room on four or more different days during the treatment period
(which is the threshold for receiving the $25 bonus).19
The baseline results for equation (2) using each of the three outcome measures defined above are
reported in columns (1) – (3) in Table 2.20 The individual treatment estimates, reported in the first row,
show that subjects responded strongly to the direct individual pecuniary incentive. Specifically, subjects
in the individual treatment made about 0.9 more visits to the study room during the treatment period than
did controls, were 18 percentage points more likely to have gone to the study room at least once, and were
more than twice as likely (24 percentage points) to have met the 4-visit bonus payment threshold. All
these differences are statistically significant at the 5 percent level. It is clear that subjects eligible for a
bonus for study room visits visited more often.
The primary focus of this paper is the difference between the individual and team treatments.
Participants randomized into the team-incentive scheme made 0.4 more visits to the study room during
the treatment period, were 11 percentage points more likely to have gone to the study room at least once,
and were not significantly less likely to meet the 4-visit threshold compared to those in the individual
treatment, despite the substantial risk of default by their partner.
Perhaps more surprisingly, participants assigned to the choice treatment also exerted more effort
than the individual treatment. This is despite the fact 97 percent of participants assigned to the choice
treatment selected the individual treatment option over the team treatment option (see Figure 2).21 On
19 For the first round of the studying experiment, we also had administrative data on grades. However, because the intervention was so short and almost half of the participants were transfer students (for whom we have no pre-treatment grades), the treatment effects are noisy, partially due to the fact that we cannot control for previous term grades. 20 Online Appendix Tables 4 and 5 show the estimates separately for the two years of the studying experiment – 2011 and 2013. 21 For completeness, Online Appendix Table 6 includes separate indicators for choice treatment subjects who chose the team treatment and choice treatment subjects who chose the individual incentive. The chose the team treatment group includes the five subjects who chose the team option and three people moved from the control group to partner with them. The odd numbers are
15
average, the choice treatment group made 0.5 more visits to the study room, were 12 percentage points
more likely to go to the study room at least once, and were 10 percentage points more likely to attain the 4
visit bonus payment threshold than the individual treatment despite facing the same incentives. This
finding is not driven by selection since nearly everyone chose the individual treatment. It must therefore
be the case that simply having made it a choice to be in the individual treatment spurred this increase in
effort. While there are a number of experimental studies (see footnote 10) that find that people who select
an activity outperform those who are assigned to an activity, the two populations in these studies typically
differ in important ways due to selection; here they are essentially identical. To the best of our
knowledge, we are one of the first to demonstrate this pure choice effect. This effect may arise because
people feel more committed to engaging in an activity when they have chosen it; this might be a form of
self-signaling (Prelec and Bodner, 2003; Benabou and Tirole, 2006; Grossman, 2011).
In contrast, subjects paired with an anonymous partner put forth more effort than those in the
control group (0.3 more visits), but the anonymous treatment was less effective than the individual
treatment (0.6 fewer visits), and much less effective than the team treatment in which subjects met their
partners (1.0 fewer visits). Looking back at the conceptual model, one would expect the anonymous
treatment to be weaker than the team treatment if and/or pj is small. Thus, the results are consistent with
the social effect being smaller in the anonymous case, but are also consistent with the same social effect
and a larger ex ante estimate of partner default. Either way, knowing the identity of one’s partner (and
knowing that said partner also knew one’s identity, etc.) seems to be important.
Columns (4) – (6) add controls for age, gender, pre-treatment library, and class fixed effects. Not
surprisingly, the results are very similar in all cases.
The cost per study room visit is reported at the bottom of Table 2. Not only is the team treatment
more effective, it also costs less because it includes subjects who put forth effort to meet the threshold but
did not get paid the bonus (due to a teammate defaulting). The average per visit cost in the team treatment
due to a matching error; in one instance two choice subjects opting for the team treatment were accidently paired. All results are the same if they are excluded from the sample.

16
was $4.87, whereas the average cost for the same outcome in the individual treatment was $6.86. The cost
per visit for the choice treatment is similar to the cost for the individual treatment at $6.83 per visit. At the
other end of the spectrum, the cost per visit for the anonymous treatment is only $2.90 because the partner
default rate is very high (67 percent). At least two caveats warrant comment. First, the above costs are for
a one-time interaction. If this experiment was repeated multiple times, with the same partners, the cost
estimates would certainly differ as individuals learn of their partner’s probability of default over time.
Second, the cost calculations do not include any non-monetary (perhaps emotional) costs associated with
avoiding letting down the team. If we interpret the social parameter as arising mainly through guilt
aversion these un-monetized costs may be non-trivial.
In the next subsection we use the model of Section 2 to separate out pecuniary and social effects,
and to estimate their relative magnitudes.
C. The Social Effect
How large is the social effect implied by these results? The decision to complete the task and earn
a $25 bonus for person i is given by equations (1a), (1b) and (1c) in the model of Section 2, if she is
assigned to the control, individual, or team treatments, respectively. For the moment, we restrict the
analysis to these treatments, and do not consider the anonymous or choice treatments. In the discussion
below, if (1c’) is the appropriate characterization for the team treatment, then our estimates of should be
interpreted as guilt aversion rather than a pro-social effect. In particular, following the guilt/shame
characterization of (1c’), our estimates of would be equivalent to estimates of .
We estimate the components of utility described in Section 2, allowing individuals to vary in their
tastes and predicted behavior based on observable characteristics. First, we model the utility that
individual i derives from his/her partner completing the task. Second, we use the generated probability of
individual i’s partner completing the task, based on the first step as an input in the utility model for
individual i (along with the treatment status and individual characteristics). More formally, this non-linear
model featuring a set of probit regressions is as follows:
17
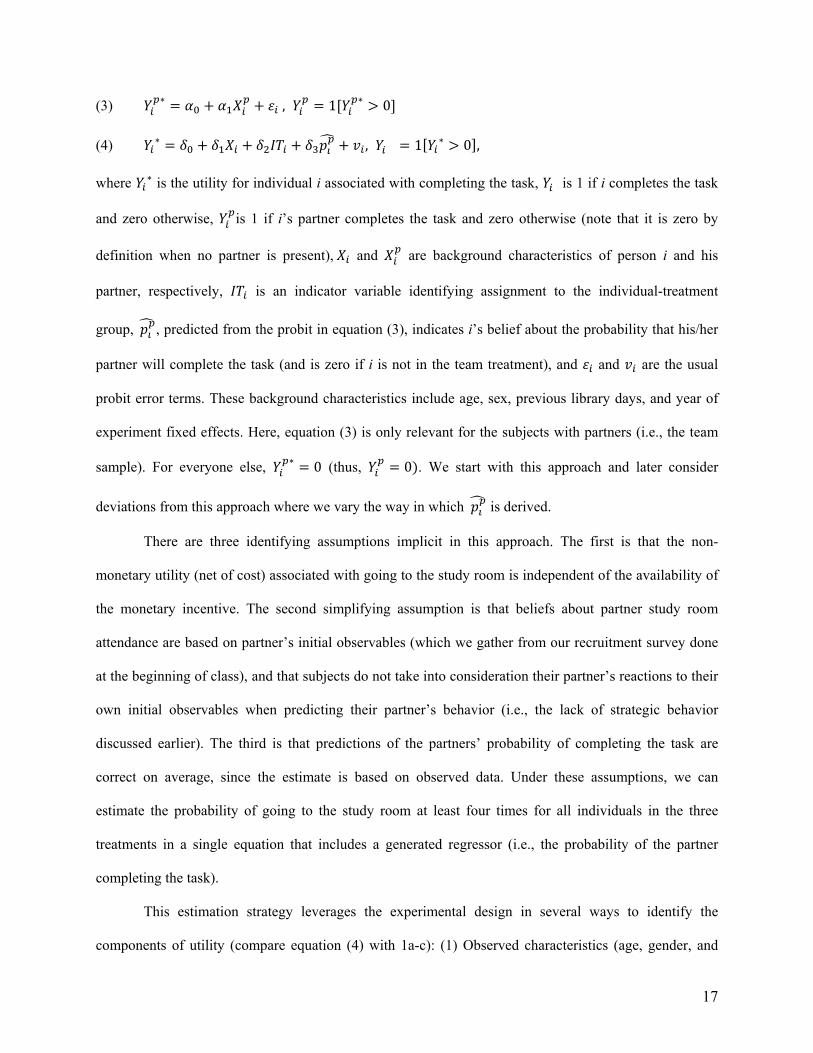
(3) ∗ , 1 ∗ 0
(4) ∗ , 1 ∗ 0 ,
where ∗ is the utility for individual i associated with completing the task, is 1 if i completes the task
and zero otherwise, is 1 if i’s partner completes the task and zero otherwise (note that it is zero by
definition when no partner is present), and are background characteristics of person i and his
partner, respectively, is an indicator variable identifying assignment to the individual-treatment
group, , predicted from the probit in equation (3), indicates i’s belief about the probability that his/her
partner will complete the task (and is zero if i is not in the team treatment), and and are the usual
probit error terms. These background characteristics include age, sex, previous library days, and year of
experiment fixed effects. Here, equation (3) is only relevant for the subjects with partners (i.e., the team
sample). For everyone else, ∗ 0 (thus, 0 . We start with this approach and later consider
deviations from this approach where we vary the way in which is derived.
There are three identifying assumptions implicit in this approach. The first is that the non-
monetary utility (net of cost) associated with going to the study room is independent of the availability of
the monetary incentive. The second simplifying assumption is that beliefs about partner study room
attendance are based on partner’s initial observables (which we gather from our recruitment survey done
at the beginning of class), and that subjects do not take into consideration their partner’s reactions to their
own initial observables when predicting their partner’s behavior (i.e., the lack of strategic behavior
discussed earlier). The third is that predictions of the partners’ probability of completing the task are
correct on average, since the estimate is based on observed data. Under these assumptions, we can
estimate the probability of going to the study room at least four times for all individuals in the three
treatments in a single equation that includes a generated regressor (i.e., the probability of the partner
completing the task).
This estimation strategy leverages the experimental design in several ways to identify the
components of utility (compare equation (4) with 1a-c): (1) Observed characteristics (age, gender, and

18
pre-treatment library usage) identify intrinsic benefits and costs associated with study room visits without
compensation ( ); (2) The difference between observationally similar subjects in
control and individual treatments identifies utility gains associated with own pecuniary benefits ( );
(3) a comparison of observationally-similar subjects in individual and team treatments identifies social
effects related to partners’ payoff ( 1 →
1). One interpretation of the is the
utility derived from one’s partner obtaining the bonus (interpretation consistent with equation (1c)).
Under the alternative interpretation, equation (1c’), where individuals are subject to a utility loss due to
shame or guilt if their partner does not achieve the bonus, our estimate of is equivalent to an estimate of
, i.e., the utility loss as a result of shame or guilt divided by the utility gain from one achieving the
bonus.
We bootstrap to account for the presence of the generated regressor. Table 3 displays the results.22
The estimates imply that subjects received a utility gain of 0.68 utils from their own pecuniary benefit of
being paid $25 (i.e., the estimate in the individual treatment indicator row), and received a utility gain of
1.85 utils from pecuniary and social benefits together (i.e., the estimate from the predicted partner bonus
status row). Bootstrapped confidence intervals indicate that both estimates are distinguishable from zero
at the 5 percent level. Thus, our estimate of the social parameter , is 1.72, and is also statistically
distinguishable from zero at the 5 percent level. The implied social impact of team compensation is very
large; 1.72 times as large as the effect of own pecuniary compensation. Importantly, we emphasize that
one cannot infer from the findings that agents care more about others than about themselves. We have
captured a broad social effect, rather than simple altruism, and will attempt to interpret it more carefully
in the next subsection.
The coefficient of 1.72 in Table 3, derived from a model in which agents use information to
predict teammates’ choices, is our preferred estimate of . However, it could be argued that subjects have
22 Online Appendix Tables 7 and 8 display the analogous estimates for the two years of the experiment – 2011 and 2013, separately.
19
difficulty estimating their partners’ probability of meeting the payment threshold, given observables. For
example, one might question whether previous library usage is observable.23 We therefore explore the
robustness of the social-parameter estimate to different beliefs about the probability of partner default.
Panel B of Table 3 displays alternative estimates of , given two different focal beliefs about
teammate performance. First, we consider what happens under the scenario where subjects are correct on
average but lack the ability to make finer distinctions between individuals, based on observables (i.e.,
they use the unconditional team-treatment mean). The estimated is 1.70, very close to our preferred
estimate in Panel A. Second, we consider the case of perfect foresight; they perfectly predict what their
partner will do. This also yields a similar estimate of the social effect parameter, = 1.57.
We can also consider the implied social effect under the anonymous treatment. The structural
model of equations (3) and (4) is inappropriate for the anonymous treatment because a subject cannot
observe the characteristics of his/her teammate and use them to predict default probability. But it is
possible in the anonymous treatment for subjects to form estimates of teammate default probability based
on group means or possible focal beliefs. Panel C shows estimates of in the anonymous treatment
assuming subjects use (1) the unconditional anonymous treatment mean and (2) the unconditional team
treatment mean. Under both assumptions we fail to reject the null hypothesis of 0.
D. Evidence on Potential Mechanisms
The parameter is intended to capture incentive effects due to social factors. It is an umbrella
term covering a number of potential mechanisms. We now turn our attention to which of some
commonly-posited classes of mechanisms are consistent or inconsistent with the evidence at hand.
23 One might also be concerned that subjects consider how their partners will react to their own observables when they form their estimates of their partners’ probability of completing the task. The simultaneous two-person game that could be used to represent the team treatment is a simple coordination game with two pure-strategy Nash equilibria and a mixed-strategy Nash equilibrium. We do not argue that agents find their way to the mixed-strategy Nash equilibrium in this one-shot game (which depends on the form of their utility functions) but map out scenarios consistent with a range of beliefs.
20
1) Altruism, guilt, shame, fear of social punishment. There are a number of different forms of social
motivations that could come into play in our environment. One such motivation is altruism, in which the
payoff of another person (or persons) enters into one’s own utility function regardless of circumstances,
beliefs, actions, etc. But it bears emphasizing that social motivations come in many other flavors, and that
θ in our framework could capture any of these.24 For example, guilt aversion involves an individual
feeling guilty about disappointing the expectations of people who act favorably on one’s behalf; the more
one believes that other people expect one to perform favorably, the more guilty one would feel from non-
performance. Shame involves negative feelings about one’s behavior, regardless of the expectations of or
observation by others. It is also possible that subjects feel neither altruism, nor guilt, nor shame, but
simply wish to avoid reprisal and social punishment from peers they disappoint.
Two of our treatments can give further evidence on this point. Our finding that participants in the
anonymous team treatment exert less effort than those in the individual treatment makes it less likely that
strong altruism or guilt with respect to strangers is a primary driver. The fact that almost no one in the
choice treatment opted for the team treatment suggests that the social parameter in our model may be best
interpreted as social pressure or guilt avoidance rather than altruism. While opting not to have a partner
does not rule out the possibility that if forced to have a partner one would then behave altruistically, it
does hint that responding to social pressure may be the more likely explanation.
The exit-survey data further support the social-pressure interpretation. A few weeks after each
experimental round we invited all participants to complete an online survey. To incentivize participation,
we entered all participants with completed surveys in a random draw for $100 in the 2011 round and an
iPad mini in the 2013 round. Response rates did not significantly differ across groups. Participants who
attended the study room four or more times were asked why they went four or more times. They could
check as many answers as applied. These statistics are only suggestive as the rates of attending the study
room differed across the treatments, and thus, the sample is selected on an endogenous outcome. Table 4
24 Recent papers investigating forms of social preferences include Loewenstein, Bazerman, and Thompson (1989), Bolton (1991), Fehr and Schmidt (1999), Bolton and Ockenfels (2000), and Charness and Rabin (2002). See Charness and Kuhn (2011) for a survey of the literature on these (and other) social motivations.
21
displays the mean response rates for each question by treatment group. By and large, the responses are
similar across groups. The key exception is the fraction of participants who say that they went four times
so as not to disappoint their partner: 55 percent of team-treatment members indicate this reason as do 28
percent of anonymous-team-treatment members.25
2) Production Complementarities. The potential for production complementarities has been the
dominant justification for the construction of teams in the workplace. Lazear (2000) asserts that
production complementarities are absolutely necessary for team incentives to be effective, and that teams
should not be used when these are not present. Production complementarities could explain the large
estimate of if subjects put forth more effort in the team treatment because studying is more valuable or
productive (or even more fun) when done jointly.
Online Appendix Table 9 suggests that almost no teams coordinated study room attendance
because they enjoyed studying together. Only four percent of the team treatment group report that at least
part of the reason they attended the study room four or more times was that they enjoyed studying with
their partner. Online Appendix Table 10 corroborates this by comparing the percentage of times team
treatment pairs attend the study room at the same time compared to placebo pairs (randomly-assigned
placebo partners from the team treatment in the same class). We estimate 29 extra same time visits
(arrival within 10 minutes of each other) for teammates compared to placebo pairs. This accounts for 0.07
visits per participant. Since the difference in visits between team and individual treatment groups was
0.40 visits per subject, coordination of this type could explain approximately 18 percent of the difference.
3) Self-control and pre-commitment. In models of self-control and pre-commitment, individuals fail to
meet goals because the present self lacks the ability to bind itself to a plan of action that would benefit the
25 One person in the choice treatment who chose the individual treatment incorrectly responded that he/she did not want to disappoint his/her partner even though he/she did not have a partner. Also, one subject in the anonymous treatment incorrectly responded that he/she liked going to the study room with his/her partner when she/he did not know his/her partner.
22
future self; the present self would instead rather engage in a more-immediately-pleasurable activity.26
Having a partner could remedy this problem, even if the individual does not value the teammate’s payoff.
Individuals who have been jointly incentivized may use each other to devise commitment mechanisms.
While our ability to say much about these issues is limited, we have some evidence pointing
towards this self-control mechanism operating through coordination. Looking at the coordination of visits
in Online Appendix Table 10, we see that for 28.6 percent of pairs both team members completed 4+
visits compared to only 21.5 percent of placebo pairs. At the same time 20.6 percent of team pairs both
completed 0 visits compared to 16.5 percent of placebo pairs. This suggests that some fraction of team
pairs coordinated.
In summary, we find some evidence that teammates coordinated their visits, but not enough to
fully explain the difference in visits. There is evidence to suggest that it might be reasonable to interpret
the results more as social pressure (or guilt avoidance) as opposed to altruism. But, there is little evidence
to support a case for guilt or altruism towards strangers (i.e., pure altruism).
Distinguishing more finely between these subtle channels is a subject for future research. One
might imagine that manipulation of subjects’ interaction with their teammates may be an interesting line
of study. For instance, a face-to-face meeting with a teammate may have a larger effect on inducing effort
than an online meeting. Understanding how these effects operate is useful—for example, workers at a
workplace may not necessarily have in-person meetings with their co-workers but instead be in different
physical environments.
Are the observed social effects an artifact of the pay-for-study environment? In any field
experiment, generalizability is a concern. It is worth investigating, then, whether there is evidence of
social effects of team incentives in other effort-elicitation contexts, beyond the library. Our pay-for-
26 For some models of self-control and commitment, see Laibson (1997), O’Donoghue and Rabin (1999, 2001), Gul and Pesendorfer (2001), Bénabou and Tirole (2004), Fudenberg and Levine (2006), and Ozdenoren, Salant, and Silverman (2012). For empirical and experimental work on this topic, see DellaVigna and Malmendier (2006), Ashraf, Karlan, and Yin (2006), Burger, Charness, and Lynham (2011), and Houser, Schunk, Winter, and Xiao (2009).

23
exercise field experiment, the results of which are reported in the next section, parallels the analysis above
in a different context.
5. Empirical Results – Pay for Exercise
A. Pre-Treatment Descriptive Statistics
Table 5 shows sample means of baseline characteristics (gender, age, self-reported exercise,
previous gym visits) by treatment status for participants in the pay-for-studying experiment. Self-reported
exercise is the number of times per week that individuals claim to have exercised during the previous
month and previous gym visits is the number of times subjects went to the Rec Center in the week prior to
the treatment period, based on data provided by the Rec Center. Columns (2) and (3) report the
differences in mean characteristics between the control group and the individual and team treatment
groups. Average age, self-reported exercise, and previous Rec Center visits do not differ significantly
between the control group and either the individual or team treatment groups. In contrast, the
randomization was such that more males ended up in the team treatment group than in either of the other
two groups. However, conclusions from regressions reported in the remainder of the paper are not
sensitive to the inclusion or omission of gender controls.
B. Results
As in the pay-for-studying case, the primary findings are easily seen graphically. Figure 3 shows the
distribution of Rec Center visits during the treatment period, by treatment group. The top category, five
visits, includes all participants with five or more visits. Notice the stark rightward shift of the distribution
for both treatments relative to the control group. While both incentive schemes produced an effect, the
team treatment induced more visits: Average visits for the control, individual, and team treatment groups
were 2.1, 3.8, and 4.2, respectively. This is in spite of the fact that within the team treatment the risk that
one’s partner would not reach the threshold for the bonus was 44 percent.
Again we formalize the analysis using a simple regression specification:

24
(5) iTeam
iAny
ii TTY 210 ,
where Yi is an attendance outcome for individual i, TAny is an indicator variable for having been
randomized into one of the two treatment groups (individual or team), TTeam is an indicator variable for
being in the team treatment, and ε is the usual error term.
Table 6, analogous to Table 2, reports the results for equation (5). Unlike in the study room
experiment, the rate at which a bonus was earned in the team treatment was about the same as in the
individual treatment in the Rec Center case. But this similar task completion rate across individual and
team treatments again hints at the existence of a social effect. Despite the high risk of teammate default,
subjects in teams were just as likely to put forth effort to earn bonuses as subjects for whom there was no
default risk (i.e., those who had no teammate). While this is consistent with a sizeable social effect,
ultimately, we will not be able to rule out the absence of a social effect under all focal beliefs about
partner gym attendance.
In the exercise experiment, participants may have had fairly good ex-ante measures of Rec Center
attendance, as observable physical fitness may have given subjects a good indication of their partner’s
propensity to exercise. Moreover, subjects could have inquired about their partner’s past Rec Center
usage, which is a strong predictor of their use of the incentives. In contrast, propensity to study may have
been harder for subjects to observe. Thus, it is not surprising the effects of the intervention are different
across the two studied settings.
If gym-going propensity is indeed easily observed, then one might imagine there could be
heterogeneous treatment effects, by type and partner type. In Table 7 we show heterogeneous effects—
dividing individuals into “active” types, who visited the Rec Center in the pre-treatment period, and
“inactive” types, who did not. On balance, the coefficients on team treatment in Panels B and C reveal
that active types go to the Rec Center more when incentivized as individuals and inactive types show up
more when incentivized in the team setting.

25
We further investigate differences between active types and inactive types by partner type in
Panels D and E. We should not make strong conclusions from this Table as the sample sizes are smaller in
the subgroup analysis and we are testing multiple hypotheses simultaneously. In Panel D, the point
estimates on team treatment for the actives are all negative, indicating that active types go to the Rec
Center less when incentivized in teams than when incentivized as individuals, regardless of partner type.
For actives, responses to changes in expected own monetary payoff appear to dominate social effects.
Panel E, however, tells a very different story for the inactive types—individuals who are less
likely, ex ante, to go to the Rec Center. Focusing on the specification with no controls (columns 1-3),
inactive types with active types as partners go to the Rec Center 1.49 more times, are 21.6 percentage
points more likely to go at least once, and are 25.5 percentage points more likely to meet the 5-visit bonus
threshold than inactive types incentivized as individuals. This occurs despite the fact that the expected
monetary pay-off is lower than in the individual treatment. A large non-pecuniary effect and/or strong
beliefs that the partner will be successful may explain this finding. However, interestingly, inactive types
randomly partnered with inactive types do not behave in this way. The team treatment is less strong when
an inactive type is matched with another inactive as opposed to being matched to an active type. We take
this as evidence that subjects estimate the probability of default by their partners, based on observables.
One’s own expected payout matters, but so too do social factors.
C. The Social Effect
Exactly as in the analysis of the study-room experiment, we use the model defined by equations
(3) and (4) to estimate pecuniary and social components of utility for the exercise experiment. Table 8
displays the results. The estimates imply that subjects received a utility gain of 1.29 utils from their own
pecuniary benefit of being paid the $25 bonus, and received a utility gain of 2.17 utils from pecuniary and
social benefits together. Bootstrapped confidence intervals indicate that both estimates are distinguishable
from zero at the 5 percent level. The social parameter, , is estimated to be 0.68 and is statistically
distinguishable from zero at the 5 percent level. Subjects choose their effort as if they valued a marginal
26
dollar of compensation for their teammate as much as they value 68 cents of compensation for
themselves. The social impact of team compensation, then, is large enough to compensate for the 44
percent teammate default rate, and is two thirds as large as the effect of own pecuniary compensation.
Panel B of Table 8 displays the estimate of , given two different focal beliefs about teammate
performance. First, we consider what happens under the scenario where subjects are correct on average
but lack the ability to make finer distinctions between individuals, based on observables. The estimated
is 0.70, very close to our preferred estimate in Panel A. Second, we consider the case of perfect foresight;
subjects can perfectly predict what their partner will do. In this case, the estimated social-effect parameter
is much smaller at = 0.17. The difference between the baseline estimate of and the perfect foresight
estimate reflects the fact a very high percentage of subjects achieve the bonus threshold regardless of
what their partner does (see Online Appendix Table 12). In particular, 44 percent of subjects whose
partner does not attend the Rec Center a sufficient number of times to earn the bonus themselves do
attend five or more times. Like the pay-for-studying experiment, we see very little coordination in gym
attendance on the dimensions of timing or visit distribution (see Online Appendix Tables 11 and 12).
7. Conclusion
There is a vast and growing literature on the role of incentives in altering behavior. However,
there is limited empirical work on behavioral interventions that compensate individuals for team behavior.
Management consultants allege that team compensation harnesses a powerful social mechanism, in that
individuals will be more likely perform actions for their team than they would be strictly for themselves.
If this is true, in part or in total, then it should be taken into account in designing interventions that seek to
elicit effort.
A first step is to observe the effect in simple settings that allow for rigorous causal inference but
also preserve the possibility of repeated social interactions over time. Our primary contribution is that we
demonstrate the existence of a social effect of team compensation: We observe people in two real-world
settings raising their effort level because a teammate’s payoff is at stake. Findings indicate that the
magnitude of this effect can be large. In addition, the team-incentive scheme in our experiment was 26

27
percent to 29 percent more cost effective than individual incentives. We caution against extrapolating
these effects to exist in an environment with long-run interactions. Over time, individuals are likely to be
cognizant of their partner’s ability or inability to complete a task, potentially affecting the effectiveness of
the team treatment.
Ultimately, this study examines a crucial issue related to the optimal structure of incentive
schemes and how best to use incentives to elicit behaviors at lowest cost. We have just scratched the
surface on this crucial issue. Future work will help to understand more fully the mechanisms and the
environments under which team incentives are most effective.

28
References
Acland, Daniel, and Matthew Levy. (2011). “Habit Formation, Naiveté, and Projection Bias in Gym Attendance,” mimeo.
Andreoni, James, and B. Douglas Bernheim. (2009). “Social Image and the 50-50 Norm: A Theoretical
and Experimental Analysis of Audience Effects,” Econometrica, 77(5), 1607–1636. Angrist, Joshua, Daniel Lang, and Philip Oreopoulos. (2009). “Incentives and Services for College
Achievement: Evidence from a Randomized Trial.” American Economic Journal: Applied Economics, 1(1): 136-63.
Asch, S.E. (1951). “Effects of group pressure on the modification and distortion of judgments.” In H.
Guetzkow (Ed.), Groups, leadership and men (pp. 177–190). Pittsburgh, PA: Carnegie Press. Ashraf, Nava, Dean Karlan, and Wesley Yin. (2006). “Tying Odysseus to the Mast: Evidence from a
Commitment Savings Product in the Philippines,” Quarterly Journal of Economics 121(2): 635-672.
Babcock, Philip, and John Hartman. (2012). “Networks and Workouts: Treatment Size and Status
Specific Peer Effects in a Randomized Field Experiment,” NBER Working Paper 16581. Bandiera, Oriana, Iwan Barankay, and Imran Rasul. (2005). “Social Preferences and the Response to
Incentives: Evidence From Personnel Data, Quarterly Journal of Economics, 120: 917-62. Bandiera, Oriana, Iwan Barankay, and Imran Rasul. (2010). “Social Incentives in the Workplace,” Review
of Economics Studies 77(2): 417-458. Bandiera, Oriana, Iwan Barankay, and Imran Rasul. (2013). “Team Incentives: Evidence from a Firm
Level Experiment,” Journal of European Economic Association 11(5): 1079-1114. Barrow, Lisa, Lashawn Richburg-Hayes, Cecilia Elena Rouse, and Thomas Brock. (2012). “Paying for
Perfomance: The Educational Impacts of a Community College Scholarship Program for Low-Income Adults.Federal Reserve Bank of Chicago Working Paper No. 2009-13.
Battigalli, Pierpaolo, and Martin Dufwenberg. (2007). “Guilt in Games,” American Economic Review
Papers & Proceedings 97(2): 170-76. Battigalli, Pierpaolo, and Martin Dufwenberg. (2009). “Dynamic Psychological Games,” Journal of
Economic Theory 144(1): 1-35. Bénabou, Roland, and Jean Tirole. (2004). “Willpower and personal rules,” Journal of Political Economy
112: 848-886. Bénabou, Roland, and Jean Tirole. (2006). Incentives and prosocial behavior. American Economic Review
96, 1652-1678. Bettinger, Eric. (2012). “Paying to Learn: The Effect of Financial Incentives on Elementary School Test
Scores,” Review of Economics and Statistics 94(3): 686-698.
29
Bolton, Gary. (1991). “A comparative model of bargaining: Theory and evidence,” American Economic Review 81(5): 1096-1136.
Bolton, Gary, and Axel Ockenfels. (2000). “ERC: A theory of equity, reciprocity and competition,”
American Economic Review 90(1): 166-193. Boisjoly, Johanne, Greg J. Duncan, Michael Kremer, Dan M. Levy, and Jacque Eccles. (2006). “Empathy
or Antipathy? The Impact of Diversity,” American Economic Review 96(5): 1890-1905. Burger, Nicholas, Gary Charness, and John Lynham. (2011). “Field and Online Experiments on Self-
Control,” Journal of Economic Behavior and Organization, 77(3), 393-404. Card, David, Alexandre Mas, Enrico Moretti, and Emmanuel Saez. (2012). “Inequality at Work: The
Effect of Peer Salaries on Job Satisfaction,” American Economic Review 102(6): 2981-3003. Carrell, Scott E., Richard L. Fullerton, and James E. West. (2009). "Does Your Cohort Matter? Measuring
Peer Effects in College Achievement," Journal of Labor Economics, 27(3): 439-464. Carrell, Scott E., Mark Hoekstra, and James E. West. (2011). “Is Poor Fitness Contagious?: Evidence
From Randomly Assigned Friends,” Journal of Public Economics 95(7-8): 657-663. Charness, Gary, and Matthew Rabin. (2002). “Understanding Social Preferences with Simple Tests,”
Quarterly Journal of Economics, 117(3): 817-869. Charness, Gary, and Martin Dufwenberg. (2006). “Promises and Partnership,” Econometrica, 74(6):
1579-1601. Charness, Gary, and Martin Dufwenberg. (2011). “Participation,” American Economic Review, 101(4):
1211-1237. Charness, Gary, and Uri Gneezy. (2009). “Incentives to Exercise,” Econometrica 77(3): 909–931. Charness, Gary, and Peter Kuhn. (2011). “Lab Labor: What Can Labor Economists Learn from the Lab?”
in the Handbook of Labor Economics, Volume 4, edited by Orley Ashenfelter and David Card, North Holland, 1st edition.
Charness, Gary, Luca Rigotti, and Aldo Rustichini. (2007). “Individual Behavior and Group
Membership,” American Economic Review, 97(4): 1340-1352. Corgnet, Brice, Matthew McCarter, and Roberto Hernan. (2014). “The Effect of Participative and
Autocratic Leadership in Workgroup Social Dilemmas: An Examination of Cyberloafing in a Virtual Organization,” forthcoming in Management Science.
Dal Bó, Pedro, Andrew Foster, and Louis Putterman. (2010). “Institutions and Behavior: Experimental
Evidence on the Effects of Democracy,” American Economic Review 100: 2205-2229. DellaVigna, Stefano, and Ulrike Malmendier. (2006). “Paying Not To Go To the Gym,” American
Economic Review 96(3): 694-719. Dufwenberg, Martin, and Uri Gneezy. (2000). “Measuring Beliefs in an Experimental Lost Wallet
Game,” Games and Economic Behavior 30(2): 163-82.

30
Falk, Armin, and Andrea Ichino. (2006). “Clean Evidence on Peer Effects,” Journal of Labor Economics
24(1): 39-58. Fehr, Ernst, and Klaus Schmidt. (1999). “A Theory of Fairness, Competition and Cooperation,” Quarterly
Journal of Economics 114(3): 817-868. Foster, Gigi. (2006). “It’s Not Your Peers, and It’s Not Your Friends: Some Progress Toward
Understanding the Educational Peer Effect Mechanism,” Journal of Public Economics 90(8-9): 1455-1475.
Fudenberg, Drew and David Levine. (2006). “A Dual-Self Model of Impulse Control,” American
Economic Review 96: 1449-1476. Fryer, Roland, Jr. (2011) “Financial Incentives and Student Achievement: Evidence From Randomized
Trials,” Quarterly Journal of Economics 126(4): 1755-1798. Fryer Jr, Roland G., Steven D. Levitt, John List, and Sally Sadoff. (2012). “Enhancing the Efficacy of
Teacher Incentives Through Loss Aversion: A Field Experiment” NBER Working Paper 18237. Grossman, Zachary. (2011). “Self-Signaling and Social-Signaling in Giving,” mimeo. Gul, Faruk and Wolfgang Pesendorfer. (2001). “Temptation and Self-Control,” Econometrica 69: 1403–
1435. Hamilton, Barton, Jackson Nickerson, and Hideo Owan. (2003). “Team Incentives and Worker
Heterogeneity: An Empricial Analysis of the Impact of Teams on Productivity and Participation,” Journal of Political Economy 111(3): 465-497.
Herbst, Luisa, Kai Konrad, and Florian Morath. (2014). “Endogenous group formation in experimental
contests,” mimeo. Holmstrom, Bengt. (1982). “Moral Hazard in Teams,” Bell Journal of Economics 13(2): 324-340. Houser, Daniel, Daniel Schunk, Joachim Winter, and Erte Xiao. (2009), “Temptation, Commitment, and
Self-control in the Laboratory,” mimeo, ICES, George Mason University. John, LK, G Loewenstein, AB Troxel, L Norton, JE Fassbender, Kevin Volpp. (2011), “Financial
Incentives for Extended Weight Loss: A Randomized, Controlled Trial,” Journal of General Internal Medicine.
Kandel, Eugene, and Edward Lazear. (1992). “Peer Pressure and Partnerships,” Journal of Political
Economy 100(4): 801-817. Kremer, Michael, and Dan Levy. (2008). “Peer Effects and Alcohol Use among College Students,”
Journal of Economic Perspectives 22(3): 189-206. Kremer, Michael, Edward Miguel, and Rebecca Thornton. (2009). “Incentives to Learn.” The Review of
Economics and Statistics 91(3): 437-456.

31
Kullgren, Jeffrey T., Andrea B. Troxel, George Loewenstein, David A. Asch, Laurie A. Norton, Lisa Wesby, Yuanyuan Tao, Jingsan Zhu, and Kevin G. Volpp. (2013). "Individual-Versus Group-Based Financial Incentives for Weight Loss: A Randomized, Controlled Trial." Annals of internal medicine 158(7): 505-514.
Laibson, David. (1997). “Golden Eggs and Hyperbolic Discounting,” Quarterly Journal of Economics
112: 443-477. Lazear, Edward P. (2000) “Personnel Economics and Economic Approaches to Incentives,” HKCER
Letters, 61. Lencioni, Patrick. (2002). “The Five Dysfunctions of a Team: A Leadership Fable,” Jossey-Bass, 1st
edition. Loewenstein, George, Max Bazerman, and Leigh Thompson. (1989). “Social Utility and Decision
Making in Interpersonal Contexts,” Journal of Personality and Social Psychology 57: 426-441. Lyle, David S. (2007). “Estimating and Interpreting Peer and Role Model Effects from Randomly
Assigned Social Groups at West Point,” Review of Economics and Statistics 89(2): 289-299. Mas, Alexandre, and Enrico Moretti. (2009). “Peers at Work,” American Economic Review 99(1): 112-
145. O’Donoghue, Ted, and Matthew Rabin. (1999). “Doing it Now or Later,” American Economic Review
89(1): 103-124. O’Donoghue, Ted, and Matthew Rabin. (2001). “Choice and Procrastination,” Quarterly Journal of
Economics 116(1): 121-160. Ozdenoren, Emre, Stephen Salant, and Daniel Silverman. (2012). “Willpower and the Optimal Control of
Visceral Urges,” Journal of the European Economic Association 10(2): 342-368. Prelec, Drazen, and Ronit Bodner. (2003). “Self-signaling and self-control,” Time and Decision, George
Loewenstein, Daniel Read, and Roy Baumeister, editors, Russell Sage Press: New York. Royer, Heather, Mark Stehr, and Justin Sydnor. (2012). “Incentives, Commitments and Habit Formation
in Exercise: Evidence from a Field Experiment with Workers at a Fortune-500 Company,” NBER Working Paper 18580.
Sacerdote, Bruce. (2001). “Peer Effects with Random Assignment: Results for Dartmouth Roommates,” Quarterly Journal of Economics 116(2): 681-704. Sutter, Matthias, Stefan Haigner, and Martin Kocher. (2010). “Choosing the carrot or the stick?
Endogenous institutional choice in social dilemma situations,” Review of Economic Studies 77(4), 1540-1566
Volpp, Kevin, AB Troxel, Mark V. Pauly, Henry Glick, Andrea Puig, David Asch, R Galvin, J Zhu, F
Wan, J DeGuzman, E Corbett, J Weiner, J Audrain-McGovern. (2009) “A Randomized Controlled Trial of Financial Incentives for Smoking Cessation,” The New England Journal of Medicine, 360:699-709.

32
Zimmerman, David J. (2003). “Peer Effects in Academic Outcomes: Evidence from a Natural Experiment,” Review of Economics and Statistics 85(1): 9-23.
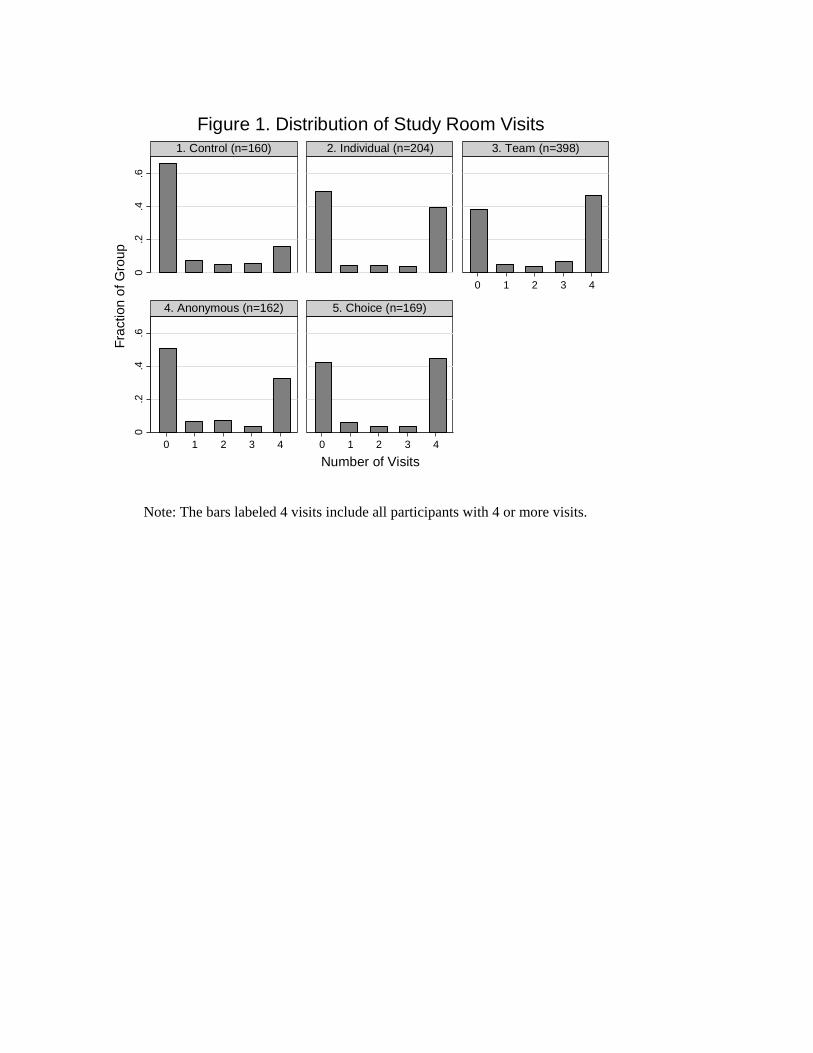
Note: The bars labeled 4 visits include all participants with 4 or more visits.
0.2
.4.6
0.2
.4.6
0 1 2 3 4
0 1 2 3 4 0 1 2 3 4
1. Control (n=160) 2. Individual (n=204) 3. Team (n=398)
4. Anonymous (n=162) 5. Choice (n=169)
Fra
ctio
n o
f Gro
up
Number of Visits
Figure 1. Distribution of Study Room Visits
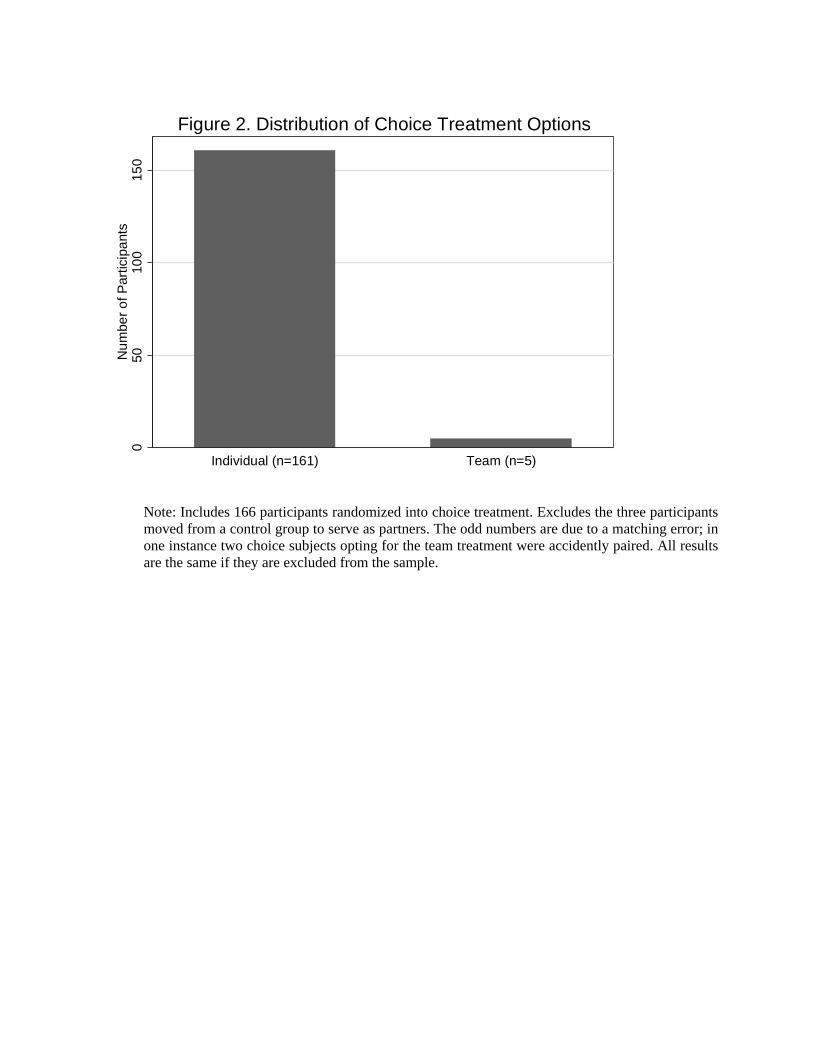
Note: Includes 166 participants randomized into choice treatment. Excludes the three participants moved from a control group to serve as partners. The odd numbers are due to a matching error; in one instance two choice subjects opting for the team treatment were accidently paired. All results are the same if they are excluded from the sample.
050
100
150
Nu
mbe
r o
f Par
ticip
ant
s
Individual (n=161) Team (n=5)
Figure 2. Distribution of Choice Treatment Options

Note: The bars labeled 5 visits include all participants with 5 or more visits.
0.2
.4.6
0.2
.4.6
0 1 2 3 4 5
0 1 2 3 4 5
1. Control (n=87) 2. Individual (n=87)
3. Team (n=190)
Fra
ctio
n o
f Gro
up
Number of Visits
Figure 3. Distribution of Rec Center Visits
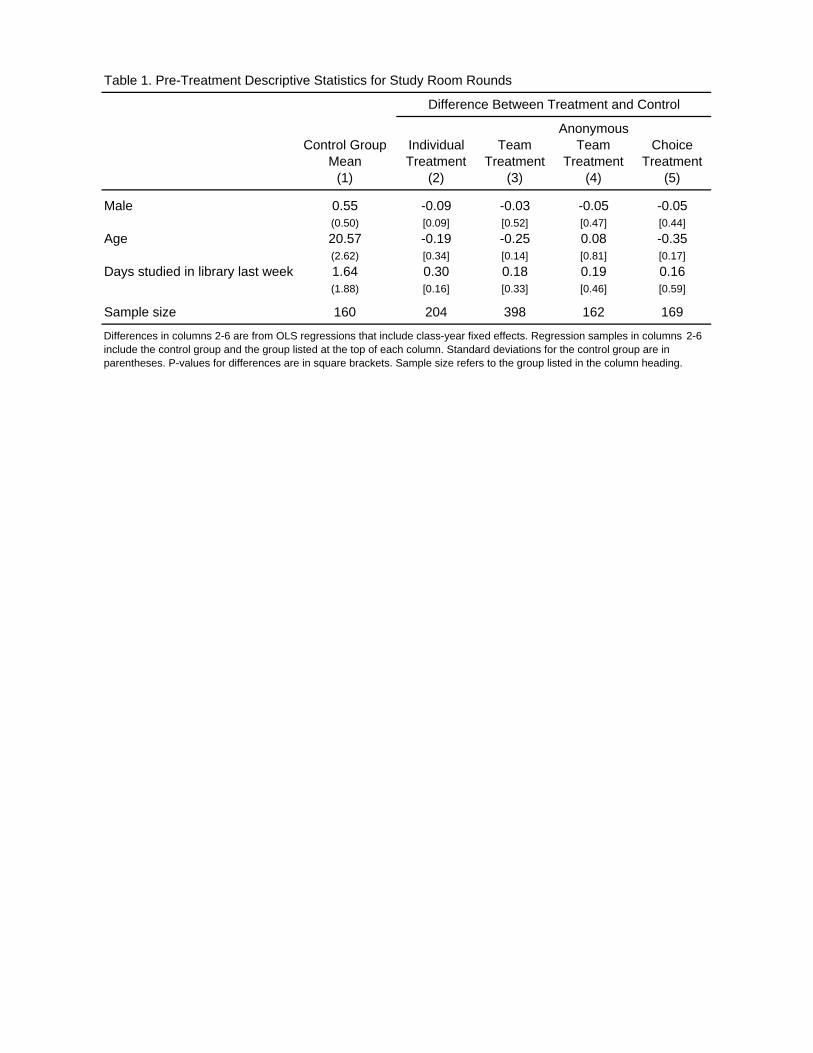
Table 1. Pre-Treatment Descriptive Statistics for Study Room Rounds
AnonymousControl Group Individual Team Team Choice
Mean Treatment Treatment Treatment Treatment(1) (2) (3) (4) (5)
Male 0.55 -0.09 -0.03 -0.05 -0.05(0.50) [0.09] [0.52] [0.47] [0.44]
Age 20.57 -0.19 -0.25 0.08 -0.35(2.62) [0.34] [0.14] [0.81] [0.17]
Days studied in library last week 1.64 0.30 0.18 0.19 0.16(1.88) [0.16] [0.33] [0.46] [0.59]
Sample size 160 204 398 162 169
Differences in columns 2-6 are from OLS regressions that include class-year fixed effects. Regression samples in columns 2-6 include the control group and the group listed at the top of each column. Standard deviations for the control group are in parentheses. P-values for differences are in square brackets. Sample size refers to the group listed in the column heading.
Difference Between Treatment and Control

Table 2. Study Room Visits by Treatment Status
Number Numberof Visits ≥1 Visit ≥4 Visits of Visits ≥1 Visit ≥4 Visits
(1) (2) (3) (4) (5) (6)
Any treatment 0.900** 0.176** 0.243** 0.842** 0.170** 0.242**(0.211) (0.051) (0.045) (0.212) (0.051) (0.045)
Team treatment 0.397** 0.109** 0.069 0.428** 0.110** 0.072(0.197) (0.044) (0.044) (0.193) (0.044) (0.044)
Anonymous team treatment -0.579** -0.088 -0.133** -0.612** -0.102* -0.147**(0.238) (0.055) (0.053) (0.234) (0.055) (0.052)
Choice treatment 0.542** 0.127** 0.103* 0.550** 0.121** 0.095*(0.167) (0.054) (0.053) (0.237) (0.055) (0.055)
Male -0.116 -0.026 -0.022(0.138) (0.032) (0.031)
Age 20 -0.122 -0.040 -0.037(0.194) (0.047) (0.045)
Age 21 -0.133 -0.018 -0.032(0.209) (0.050) (0.050)
Age 22 -0.326 -0.047 -0.132(0.269) (0.062) (0.058)
Age 23+ -0.045 -0.030 -0.025(0.274) (0.062) (0.064)
Library days 0.162** 0.033** 0.020**(0.036) (0.008) (0.008)
Year is 2013 -0.637** -0.129** -0.114** -- -- --(0.167) (0.037) (0.037)
Constant 1.432** 0.406** 0.217** -- -- --(0.176) (0.043) (0.036)
Includes year-specific No No No Yes Yes Yes
class fixed effects
R-Squared 0.06 0.05 0.06 0.12 0.11 0.11
Cost per Visit
Control Individual Team Anonymous ChoiceGroup Treatment Treatment Team Treatment
Treatment
Average visits per participant 1.09 1.95 2.37 1.75 2.23Cost per visit $1.77 $6.86 $4.87 $2.90 $6.65
Sample size is 1093. Standard errors are clustered at the group level (i.e., in case of team treatment, the pair level) and reported in parentheses. ** (*) indicates statistically significance at the 5 (10) percent level. Columns 4-6 also include indicators for missing age and sex.
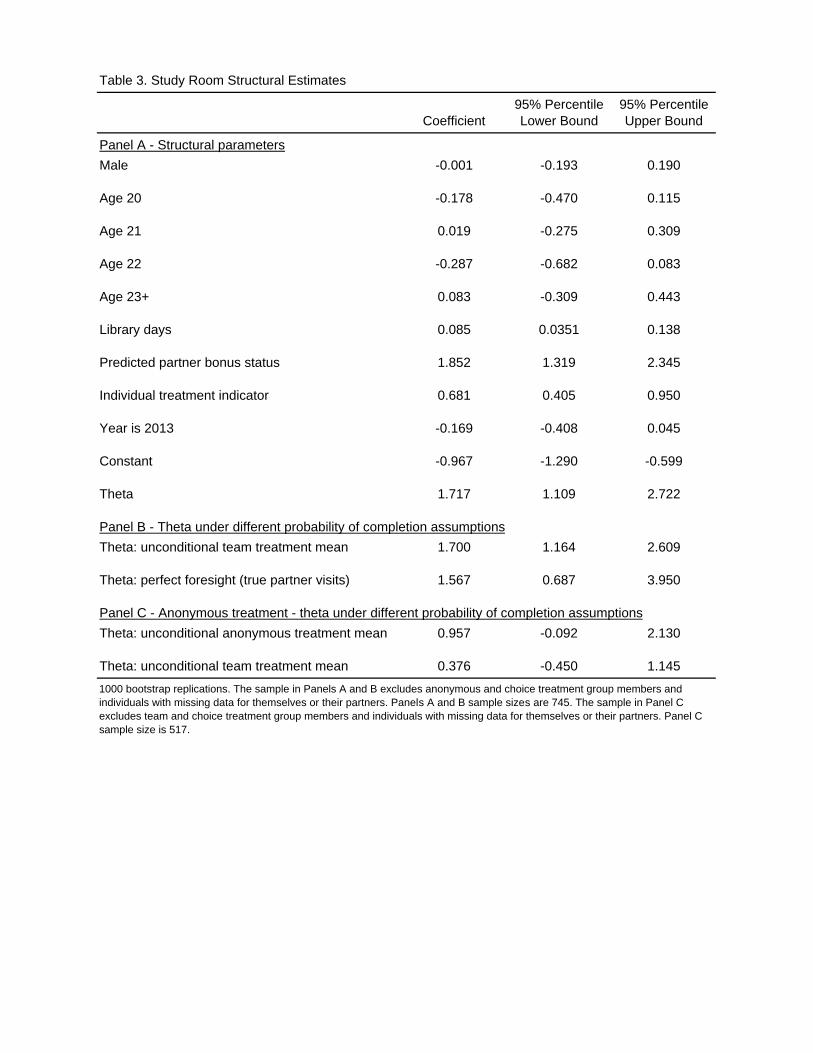
Table 3. Study Room Structural Estimates
95% Percentile 95% PercentileCoefficient Lower Bound Upper Bound
Panel A - Structural parameters
Male -0.001 -0.193 0.190
Age 20 -0.178 -0.470 0.115
Age 21 0.019 -0.275 0.309
Age 22 -0.287 -0.682 0.083
Age 23+ 0.083 -0.309 0.443
Library days 0.085 0.0351 0.138
Predicted partner bonus status 1.852 1.319 2.345
Individual treatment indicator 0.681 0.405 0.950
Year is 2013 -0.169 -0.408 0.045
Constant -0.967 -1.290 -0.599
Theta 1.717 1.109 2.722
Panel B - Theta under different probability of completion assumptions
Theta: unconditional team treatment mean 1.700 1.164 2.609
Theta: perfect foresight (true partner visits) 1.567 0.687 3.950
Panel C - Anonymous treatment - theta under different probability of completion assumptions
Theta: unconditional anonymous treatment mean 0.957 -0.092 2.130
Theta: unconditional team treatment mean 0.376 -0.450 1.145
1000 bootstrap replications. The sample in Panels A and B excludes anonymous and choice treatment group members and individuals with missing data for themselves or their partners. Panels A and B sample sizes are 745. The sample in Panel C excludes team and choice treatment group members and individuals with missing data for themselves or their partners. Panel C sample size is 517.
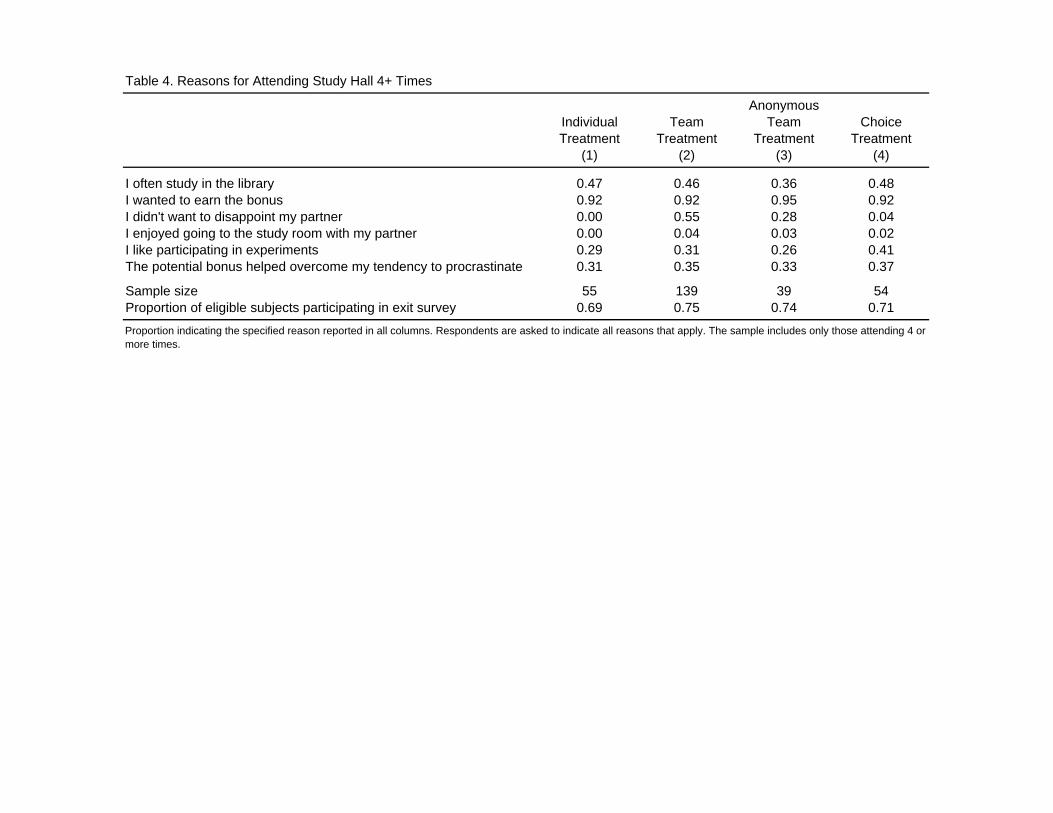
Table 4. Reasons for Attending Study Hall 4+ Times
AnonymousIndividual Team Team ChoiceTreatment Treatment Treatment Treatment
(1) (2) (3) (4)
I often study in the library 0.47 0.46 0.36 0.48I wanted to earn the bonus 0.92 0.92 0.95 0.92I didn't want to disappoint my partner 0.00 0.55 0.28 0.04I enjoyed going to the study room with my partner 0.00 0.04 0.03 0.02I like participating in experiments 0.29 0.31 0.26 0.41The potential bonus helped overcome my tendency to procrastinate 0.31 0.35 0.33 0.37
Sample size 55 139 39 54Proportion of eligible subjects participating in exit survey 0.69 0.75 0.74 0.71
Proportion indicating the specified reason reported in all columns. Respondents are asked to indicate all reasons that apply. The sample includes only those attending 4 or more times.
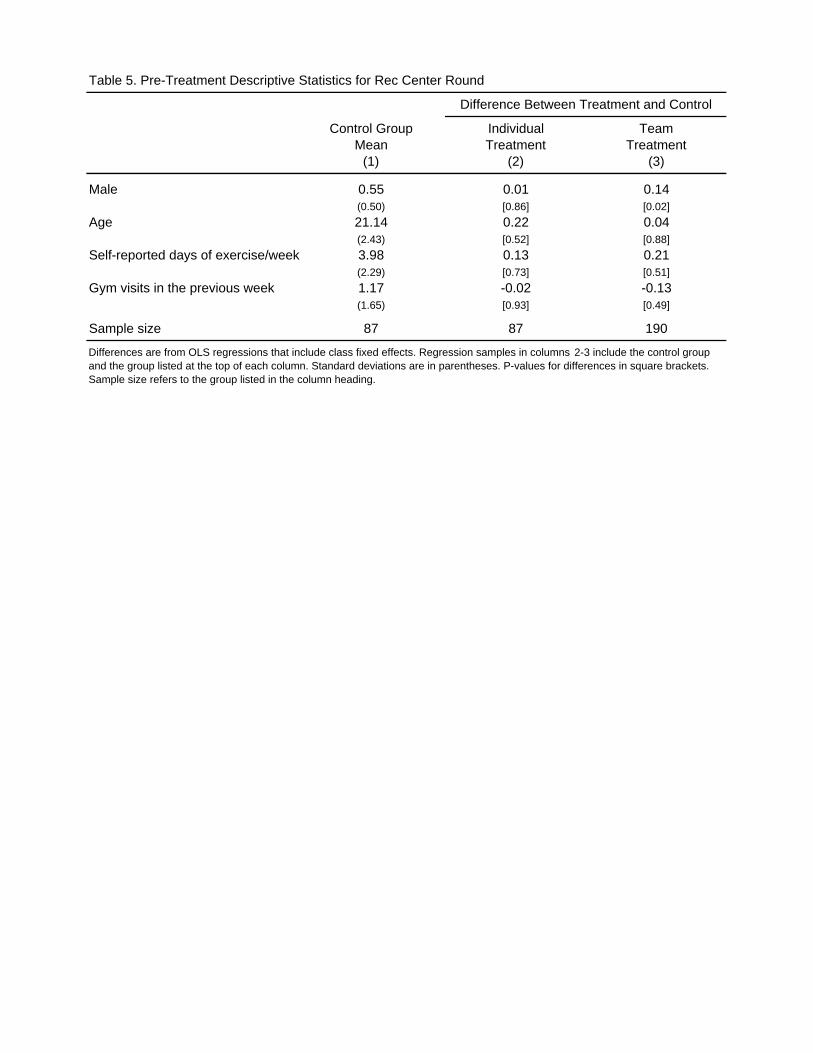
Table 5. Pre-Treatment Descriptive Statistics for Rec Center Round
Control Group Individual TeamMean Treatment Treatment
(1) (2) (3)
Male 0.55 0.01 0.14(0.50) [0.86] [0.02]
Age 21.14 0.22 0.04(2.43) [0.52] [0.88]
Self-reported days of exercise/week 3.98 0.13 0.21(2.29) [0.73] [0.51]
Gym visits in the previous week 1.17 -0.02 -0.13(1.65) [0.93] [0.49]
Sample size 87 87 190
Differences are from OLS regressions that include class fixed effects. Regression samples in columns 2-3 include the control group and the group listed at the top of each column. Standard deviations are in parentheses. P-values for differences in square brackets. Sample size refers to the group listed in the column heading.
Difference Between Treatment and Control
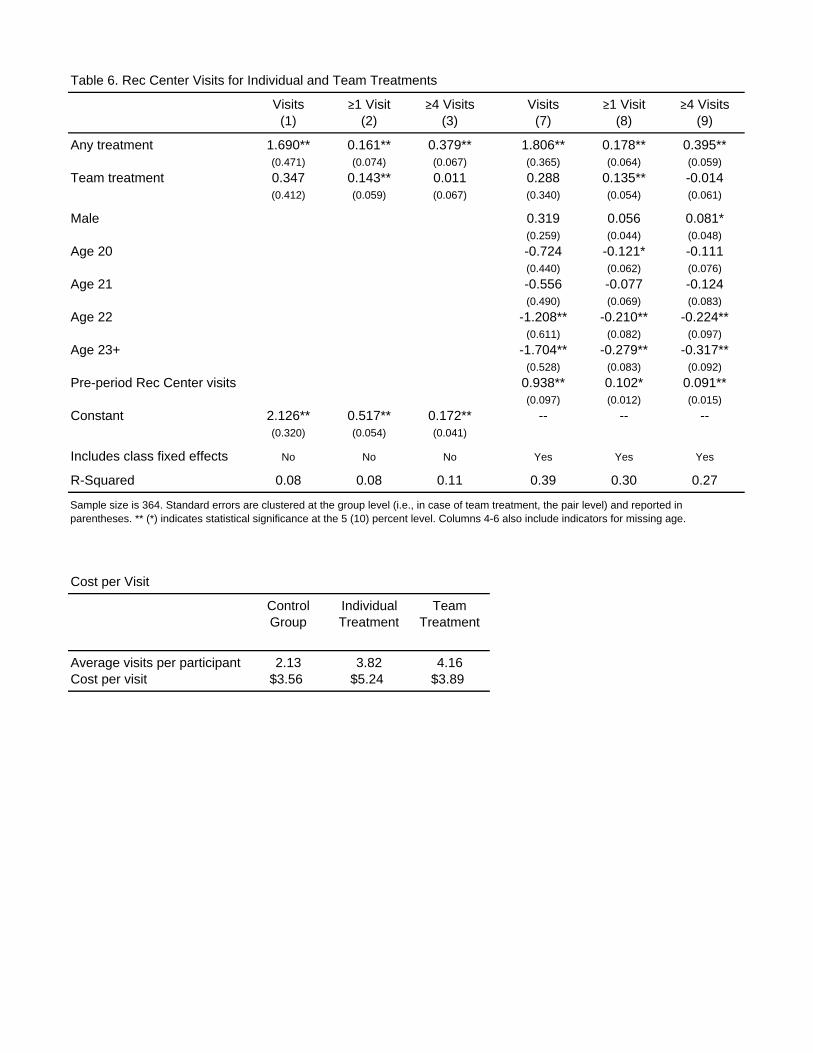
Table 6. Rec Center Visits for Individual and Team Treatments
Visits ≥1 Visit ≥4 Visits Visits ≥1 Visit ≥4 Visits(1) (2) (3) (7) (8) (9)
Any treatment 1.690** 0.161** 0.379** 1.806** 0.178** 0.395**(0.471) (0.074) (0.067) (0.365) (0.064) (0.059)
Team treatment 0.347 0.143** 0.011 0.288 0.135** -0.014(0.412) (0.059) (0.067) (0.340) (0.054) (0.061)
Male 0.319 0.056 0.081*(0.259) (0.044) (0.048)
Age 20 -0.724 -0.121* -0.111(0.440) (0.062) (0.076)
Age 21 -0.556 -0.077 -0.124(0.490) (0.069) (0.083)
Age 22 -1.208** -0.210** -0.224**(0.611) (0.082) (0.097)
Age 23+ -1.704** -0.279** -0.317**(0.528) (0.083) (0.092)
Pre-period Rec Center visits 0.938** 0.102* 0.091**(0.097) (0.012) (0.015)
Constant 2.126** 0.517** 0.172** -- -- --(0.320) (0.054) (0.041)
Includes class fixed effects No No No Yes Yes Yes
R-Squared 0.08 0.08 0.11 0.39 0.30 0.27
Cost per Visit
Control Individual TeamGroup Treatment Treatment
Average visits per participant 2.13 3.82 4.16Cost per visit $3.56 $5.24 $3.89
Sample size is 364. Standard errors are clustered at the group level (i.e., in case of team treatment, the pair level) and reported in parentheses. ** (*) indicates statistical significance at the 5 (10) percent level. Columns 4-6 also include indicators for missing age.

Table 7. Rec Center Visits for Individual and Team Treatments - Restricted Samples
Visits ≥1 Visit ≥4 Visits Visits ≥1 Visit ≥4 Visits Sample Size(1) (2) (3) (4) (5) (6)
Panel A 364
Any treatment 1.690** 0.161** 0.379** 1.806** 0.178** 0.395**(0.471) (0.074) (0.067) (0.365) (0.064) (0.059)
Team treatment 0.347 0.143** 0.011 0.288 0.135** -0.014(0.412) (0.059) (0.067) (0.340) (0.054) (0.061)
Panel B: Sample restricted to actives 164
Any treatment 1.759** 0.023 0.409** 1.862** 0.031 0.443**(0.679) (0.059) (0.106) (0.625) (0.061) (0.099)
Team treatment -0.883 -0.022 -0.122 -0.634 -0.020 -0.129(0.539) (0.050) (0.089) (0.502) (0.045) (0.092)
Panel C: Sample restricted to inactives 200
Any treatment 1.782** 0.286** 0.372** 1.811** 0.308** 0.380**(0.444) (0.091) (0.072) (0.428) (0.090) (0.072)
Team treatment 1.047** 0.240** 0.088 0.711 0.188** 0.036(0.486) (0.086) (0.088) (0.464) (0.084) (0.086)
Panel D: Sample restricted to actives 164
Any treatment 1.759** 0.023 0.409** 1.877** 0.030 0.443**(0.682) (0.059) (0.106) (0.628) (0.061) (0.099)
Team treatment: Inactive partner -0.887 -0.033 -0.160 -0.400 -0.029 -0.133(0.667) (0.063) (0.110) (0.603) (0.061) (0.110)
Team treatment: Active partner -0.881 -0.016 -0.099 -0.797 -0.014 -0.127(0.584) (0.057) (0.102) (0.530) (0.050) (0.106)
Panel E: Sample restricted to inactives 200
Any treatment 1.782** 0.286** 0.372** 1.840** 0.309** 0.390**(0.445) (0.092) (0.072) (0.427) (0.091) (0.072)
Team treatment: Inactive partner 0.818 0.252** 0.002 0.450 0.183** -0.055(0.542) (0.094) (0.097) (0.480) (0.089) (0.089)
Team treatment: Active partner 1.490** 0.216** 0.255** 1.235* 0.199* 0.217*(0.612) (0.106) (0.108) (0.651) (0.109) (0.115)
Includes control variables No No No Yes Yes Yes
Includes class fixed effects No No No Yes Yes Yes
R-Squared 0.08 0.08 0.11 0.39 0.30 0.27
Sample size is 364. Standard errors are clustered at the group level (i.e., in case of team treatment, the pair level) and reported in parentheses. ** (*) indicates statistical significance at the 5 (10) percent level. Columns 4-6 also include indicators for missing age.
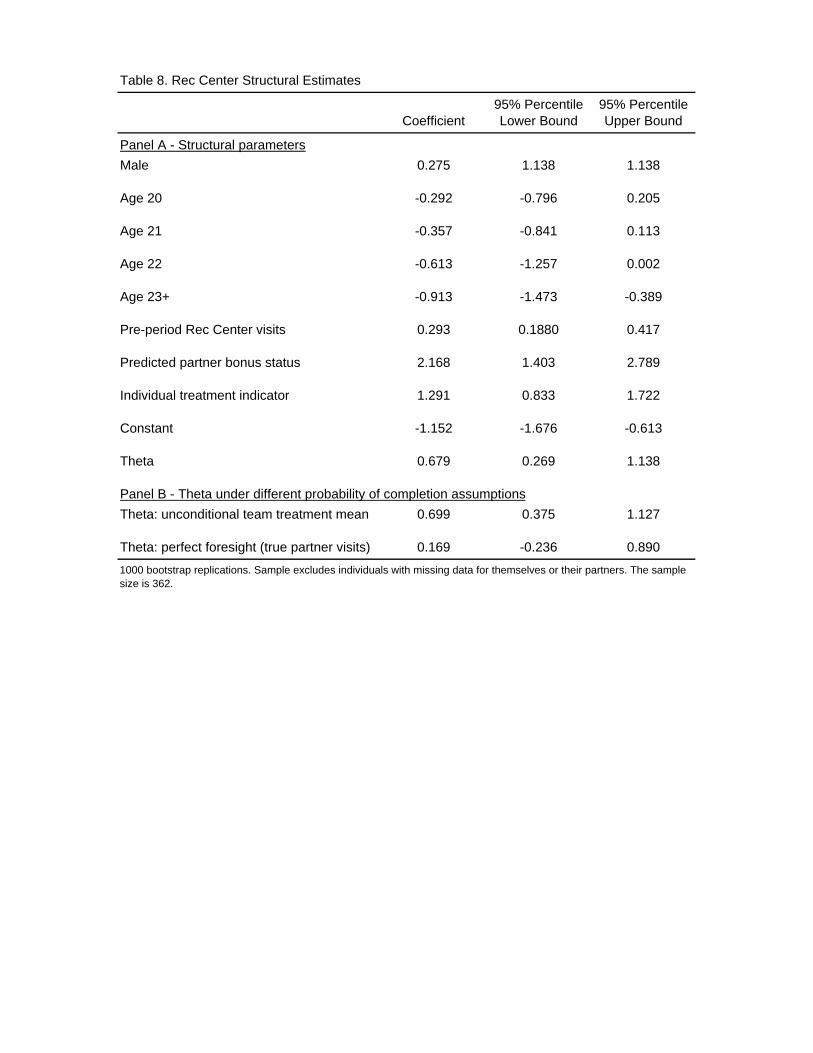
Table 8. Rec Center Structural Estimates
95% Percentile 95% PercentileCoefficient Lower Bound Upper Bound
Panel A - Structural parameters
Male 0.275 1.138 1.138
Age 20 -0.292 -0.796 0.205
Age 21 -0.357 -0.841 0.113
Age 22 -0.613 -1.257 0.002
Age 23+ -0.913 -1.473 -0.389
Pre-period Rec Center visits 0.293 0.1880 0.417
Predicted partner bonus status 2.168 1.403 2.789
Individual treatment indicator 1.291 0.833 1.722
Constant -1.152 -1.676 -0.613
Theta 0.679 0.269 1.138
Panel B - Theta under different probability of completion assumptions
Theta: unconditional team treatment mean 0.699 0.375 1.127
Theta: perfect foresight (true partner visits) 0.169 -0.236 0.890
1000 bootstrap replications. Sample excludes individuals with missing data for themselves or their partners. The sample size is 362.
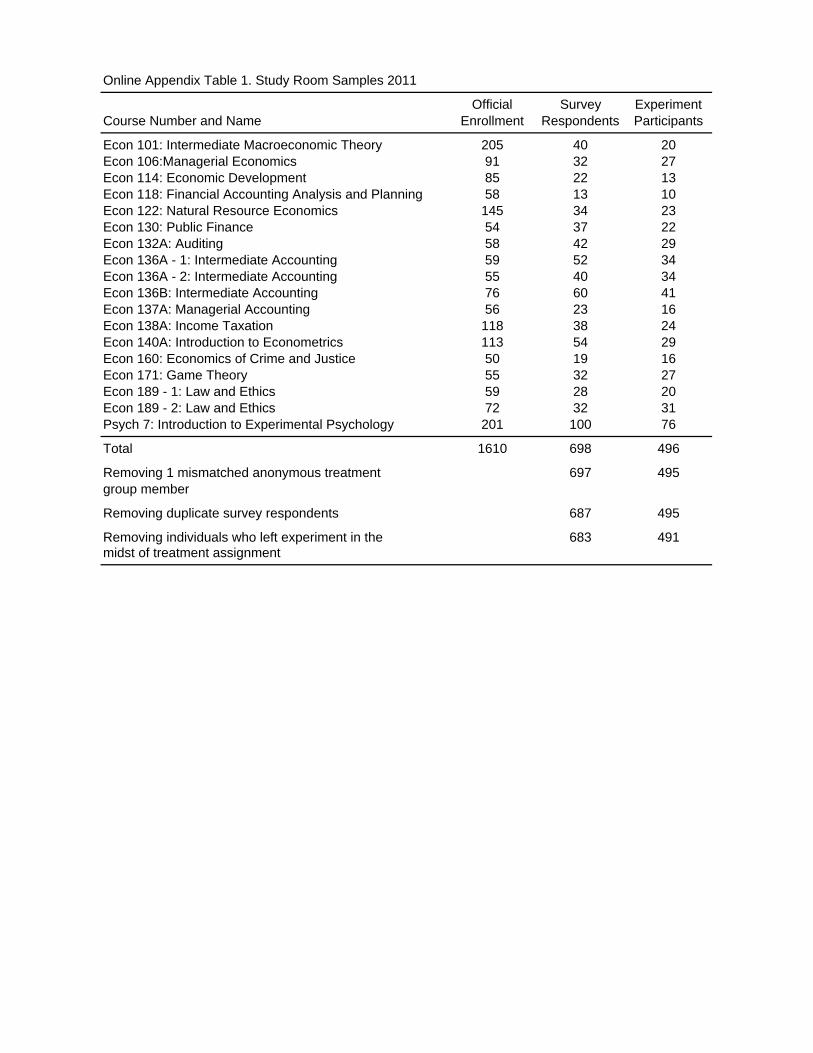
Online Appendix Table 1. Study Room Samples 2011
Official Survey ExperimentCourse Number and Name Enrollment Respondents Participants
Econ 101: Intermediate Macroeconomic Theory 205 40 20Econ 106:Managerial Economics 91 32 27Econ 114: Economic Development 85 22 13Econ 118: Financial Accounting Analysis and Planning 58 13 10Econ 122: Natural Resource Economics 145 34 23Econ 130: Public Finance 54 37 22Econ 132A: Auditing 58 42 29Econ 136A - 1: Intermediate Accounting 59 52 34Econ 136A - 2: Intermediate Accounting 55 40 34Econ 136B: Intermediate Accounting 76 60 41Econ 137A: Managerial Accounting 56 23 16Econ 138A: Income Taxation 118 38 24Econ 140A: Introduction to Econometrics 113 54 29Econ 160: Economics of Crime and Justice 50 19 16Econ 171: Game Theory 55 32 27Econ 189 - 1: Law and Ethics 59 28 20Econ 189 - 2: Law and Ethics 72 32 31Psych 7: Introduction to Experimental Psychology 201 100 76
Total 1610 698 496
Removing 1 mismatched anonymous treatment 697 495group member
Removing duplicate survey respondents 687 495
Removing individuals who left experiment in the 683 491midst of treatment assignment
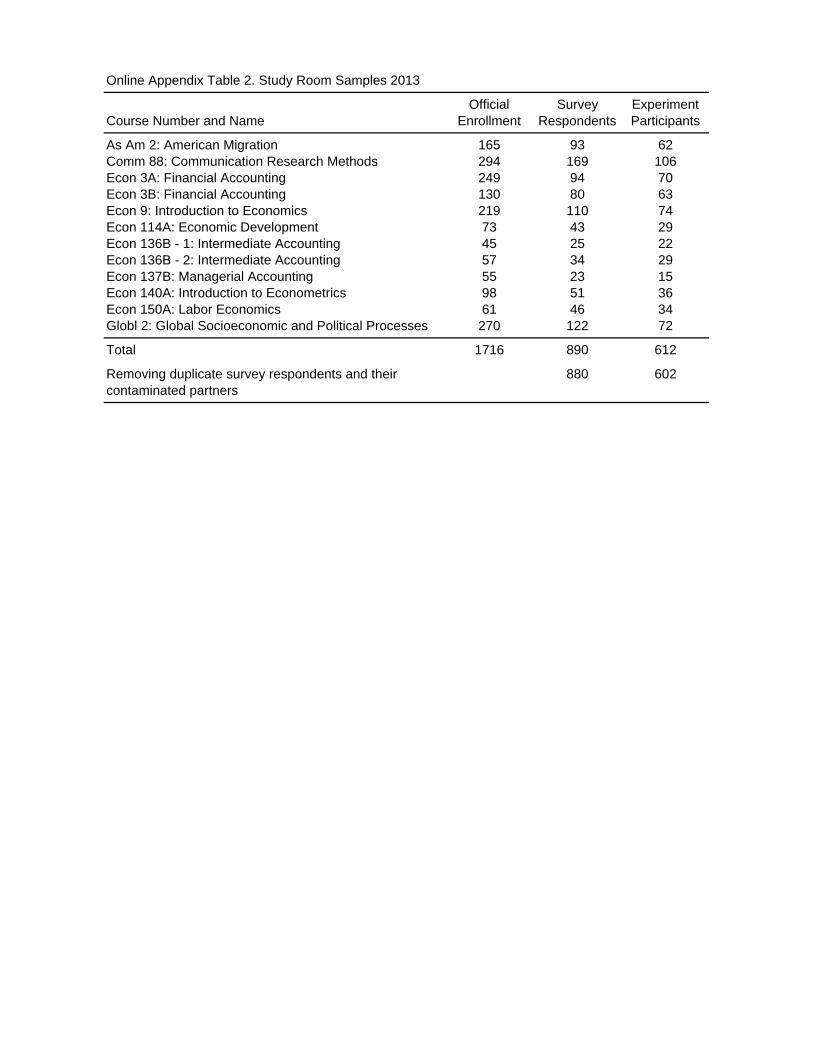
Online Appendix Table 2. Study Room Samples 2013
Official Survey ExperimentCourse Number and Name Enrollment Respondents Participants
As Am 2: American Migration 165 93 62Comm 88: Communication Research Methods 294 169 106Econ 3A: Financial Accounting 249 94 70Econ 3B: Financial Accounting 130 80 63Econ 9: Introduction to Economics 219 110 74Econ 114A: Economic Development 73 43 29Econ 136B - 1: Intermediate Accounting 45 25 22Econ 136B - 2: Intermediate Accounting 57 34 29Econ 137B: Managerial Accounting 55 23 15Econ 140A: Introduction to Econometrics 98 51 36Econ 150A: Labor Economics 61 46 34Globl 2: Global Socioeconomic and Political Processes 270 122 72
Total 1716 890 612
Removing duplicate survey respondents and their 880 602contaminated partners
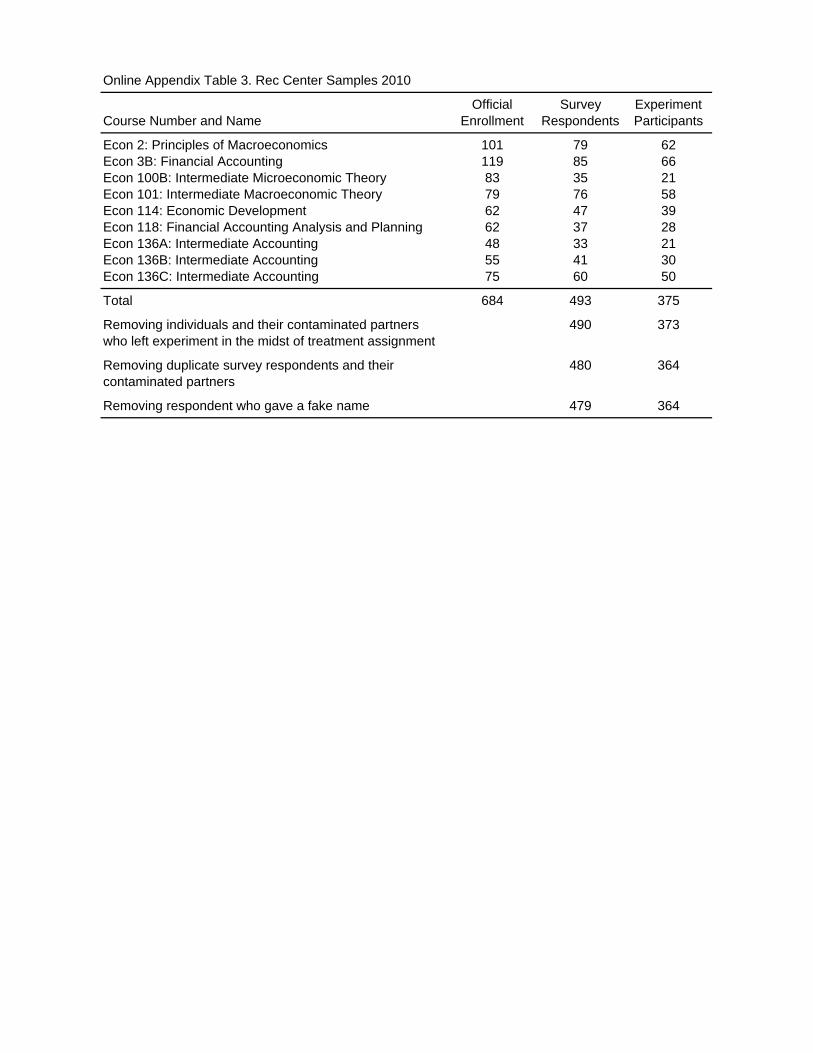
Online Appendix Table 3. Rec Center Samples 2010
Official Survey ExperimentCourse Number and Name Enrollment Respondents Participants
Econ 2: Principles of Macroeconomics 101 79 62Econ 3B: Financial Accounting 119 85 66Econ 100B: Intermediate Microeconomic Theory 83 35 21Econ 101: Intermediate Macroeconomic Theory 79 76 58Econ 114: Economic Development 62 47 39Econ 118: Financial Accounting Analysis and Planning 62 37 28Econ 136A: Intermediate Accounting 48 33 21Econ 136B: Intermediate Accounting 55 41 30Econ 136C: Intermediate Accounting 75 60 50
Total 684 493 375
Removing individuals and their contaminated partners 490 373who left experiment in the midst of treatment assignment
Removing duplicate survey respondents and their 480 364contaminated partners
Removing respondent who gave a fake name 479 364
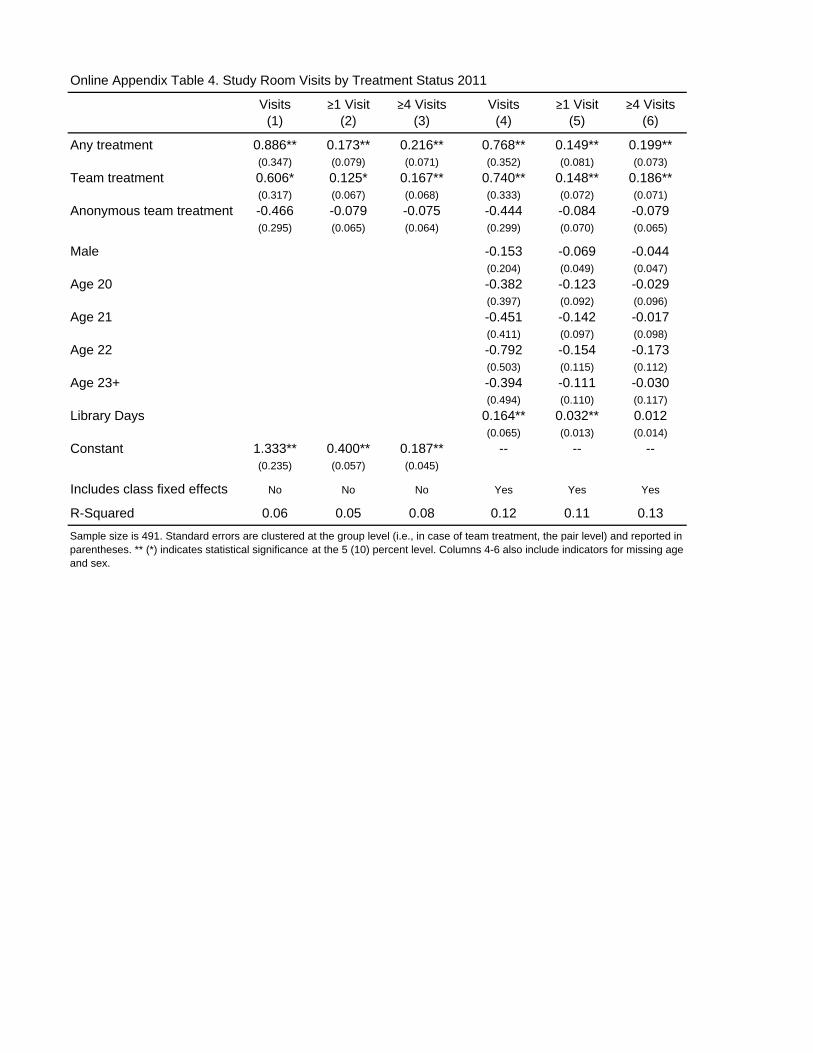
Online Appendix Table 4. Study Room Visits by Treatment Status 2011
Visits ≥1 Visit ≥4 Visits Visits ≥1 Visit ≥4 Visits(1) (2) (3) (4) (5) (6)
Any treatment 0.886** 0.173** 0.216** 0.768** 0.149** 0.199**(0.347) (0.079) (0.071) (0.352) (0.081) (0.073)
Team treatment 0.606* 0.125* 0.167** 0.740** 0.148** 0.186**(0.317) (0.067) (0.068) (0.333) (0.072) (0.071)
Anonymous team treatment -0.466 -0.079 -0.075 -0.444 -0.084 -0.079(0.295) (0.065) (0.064) (0.299) (0.070) (0.065)
Male -0.153 -0.069 -0.044(0.204) (0.049) (0.047)
Age 20 -0.382 -0.123 -0.029(0.397) (0.092) (0.096)
Age 21 -0.451 -0.142 -0.017(0.411) (0.097) (0.098)
Age 22 -0.792 -0.154 -0.173(0.503) (0.115) (0.112)
Age 23+ -0.394 -0.111 -0.030(0.494) (0.110) (0.117)
Library Days 0.164** 0.032** 0.012(0.065) (0.013) (0.014)
Constant 1.333** 0.400** 0.187** -- -- --(0.235) (0.057) (0.045)
Includes class fixed effects No No No Yes Yes Yes
R-Squared 0.06 0.05 0.08 0.12 0.11 0.13
Sample size is 491. Standard errors are clustered at the group level (i.e., in case of team treatment, the pair level) and reported in parentheses. ** (*) indicates statistical significance at the 5 (10) percent level. Columns 4-6 also include indicators for missing age and sex.
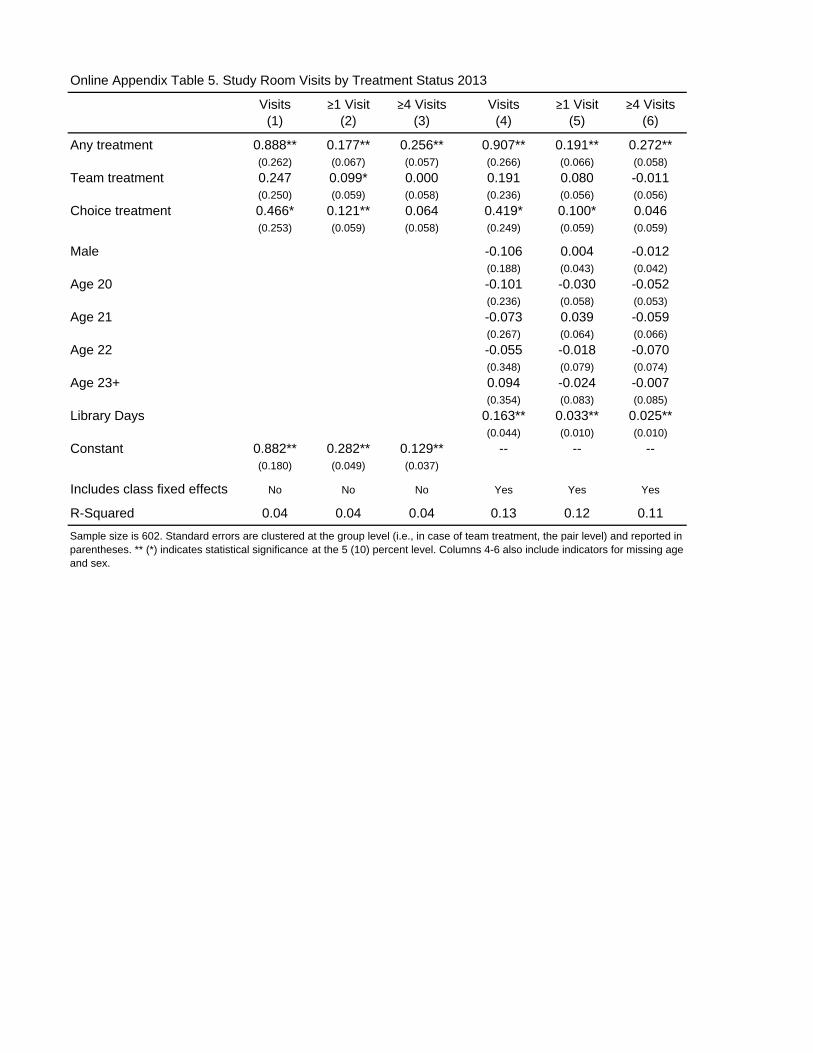
Online Appendix Table 5. Study Room Visits by Treatment Status 2013
Visits ≥1 Visit ≥4 Visits Visits ≥1 Visit ≥4 Visits(1) (2) (3) (4) (5) (6)
Any treatment 0.888** 0.177** 0.256** 0.907** 0.191** 0.272**(0.262) (0.067) (0.057) (0.266) (0.066) (0.058)
Team treatment 0.247 0.099* 0.000 0.191 0.080 -0.011(0.250) (0.059) (0.058) (0.236) (0.056) (0.056)
Choice treatment 0.466* 0.121** 0.064 0.419* 0.100* 0.046(0.253) (0.059) (0.058) (0.249) (0.059) (0.059)
Male -0.106 0.004 -0.012(0.188) (0.043) (0.042)
Age 20 -0.101 -0.030 -0.052(0.236) (0.058) (0.053)
Age 21 -0.073 0.039 -0.059(0.267) (0.064) (0.066)
Age 22 -0.055 -0.018 -0.070(0.348) (0.079) (0.074)
Age 23+ 0.094 -0.024 -0.007(0.354) (0.083) (0.085)
Library Days 0.163** 0.033** 0.025**(0.044) (0.010) (0.010)
Constant 0.882** 0.282** 0.129** -- -- --(0.180) (0.049) (0.037)
Includes class fixed effects No No No Yes Yes Yes
R-Squared 0.04 0.04 0.04 0.13 0.12 0.11
Sample size is 602. Standard errors are clustered at the group level (i.e., in case of team treatment, the pair level) and reported in parentheses. ** (*) indicates statistical significance at the 5 (10) percent level. Columns 4-6 also include indicators for missing age and sex.
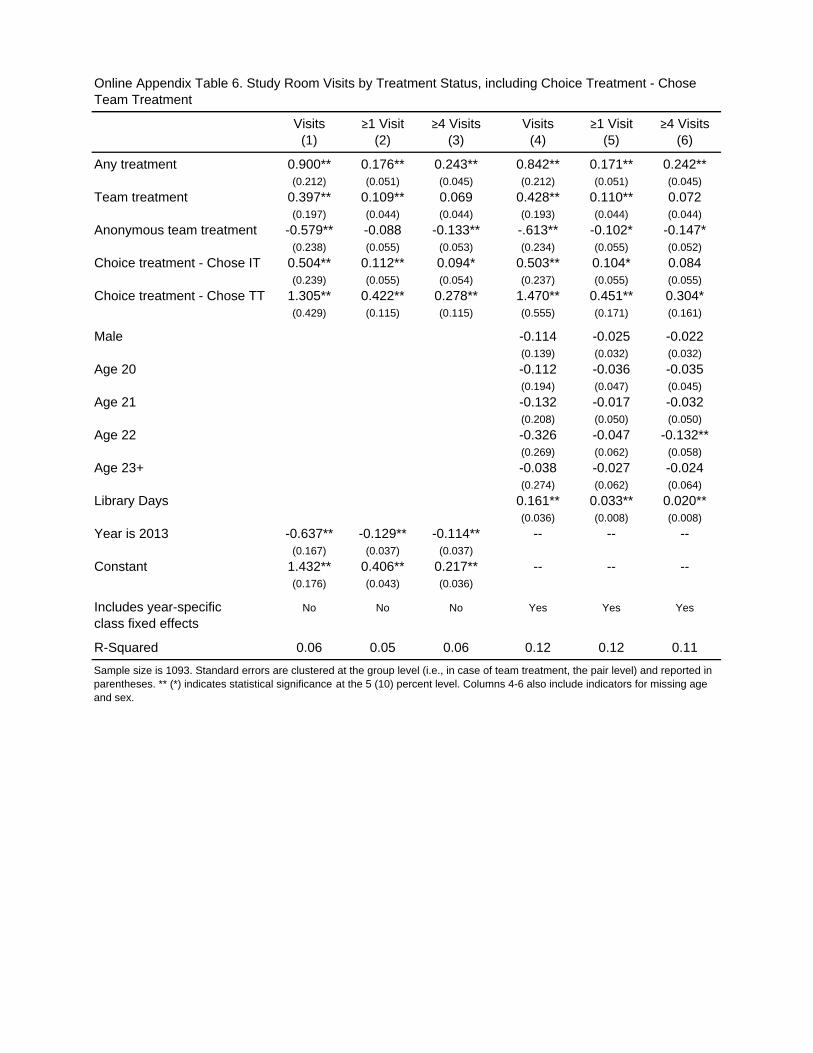
Visits ≥1 Visit ≥4 Visits Visits ≥1 Visit ≥4 Visits(1) (2) (3) (4) (5) (6)
Any treatment 0.900** 0.176** 0.243** 0.842** 0.171** 0.242**(0.212) (0.051) (0.045) (0.212) (0.051) (0.045)
Team treatment 0.397** 0.109** 0.069 0.428** 0.110** 0.072(0.197) (0.044) (0.044) (0.193) (0.044) (0.044)
Anonymous team treatment -0.579** -0.088 -0.133** -.613** -0.102* -0.147*(0.238) (0.055) (0.053) (0.234) (0.055) (0.052)
Choice treatment - Chose IT 0.504** 0.112** 0.094* 0.503** 0.104* 0.084(0.239) (0.055) (0.054) (0.237) (0.055) (0.055)
Choice treatment - Chose TT 1.305** 0.422** 0.278** 1.470** 0.451** 0.304*(0.429) (0.115) (0.115) (0.555) (0.171) (0.161)
Male -0.114 -0.025 -0.022(0.139) (0.032) (0.032)
Age 20 -0.112 -0.036 -0.035(0.194) (0.047) (0.045)
Age 21 -0.132 -0.017 -0.032(0.208) (0.050) (0.050)
Age 22 -0.326 -0.047 -0.132**(0.269) (0.062) (0.058)
Age 23+ -0.038 -0.027 -0.024(0.274) (0.062) (0.064)
Library Days 0.161** 0.033** 0.020**(0.036) (0.008) (0.008)
Year is 2013 -0.637** -0.129** -0.114** -- -- --(0.167) (0.037) (0.037)
Constant 1.432** 0.406** 0.217** -- -- --(0.176) (0.043) (0.036)
Includes year-specific No No No Yes Yes Yes
class fixed effects
R-Squared 0.06 0.05 0.06 0.12 0.12 0.11
Sample size is 1093. Standard errors are clustered at the group level (i.e., in case of team treatment, the pair level) and reported in parentheses. ** (*) indicates statistical significance at the 5 (10) percent level. Columns 4-6 also include indicators for missing age and sex.
Online Appendix Table 6. Study Room Visits by Treatment Status, including Choice Treatment - Chose Team Treatment

Online Appendix Table 7. Study Room Structural Estimates 2011
95% Percentile 95% PercentileCoefficient Lower Bound Upper Bound
Panel A - Structural parameters
Male 0.013 -0.316 0.314
Age 20 -0.123 -0.714 0.512
Age 21 0.171 -0.418 0.760
Age 22 -0.200 -0.902 0.560
Age 23+ 0.189 -0.481 0.956
Library days
Predicted partner bonus status 1.642 1.000 2.277
Individual treatment indicator 0.542 0.111 0.929
Constant -0.976 -1.637 -0.389
Theta 2.030 0.967 5.805
Panel B - Theta under different probability of completion assumptions
Theta: unconditional team treatment mean 1.910 1.076 4.506
Theta: perfect foresight (true partner visits) 3.282 -19.003 21.994
Panel C - Anonymous treatment - theta under different probability of completion assumptions
Theta: unconditional anonymous treatment mean 0.900 -0.452 2.390
Theta: unconditional team treatment mean 0.086 -0.668 1.005
1000 bootstrap replications. The sample in Panels A and B excludes anonymous and choice treatment group members and individuals with missing data for themselves or their partners. Panels A and B sample sizes are 745. The sample in Panel C excludes team and choice treatment group members and individuals with missing data for themselves or their partners. Panel C sample size is 517.
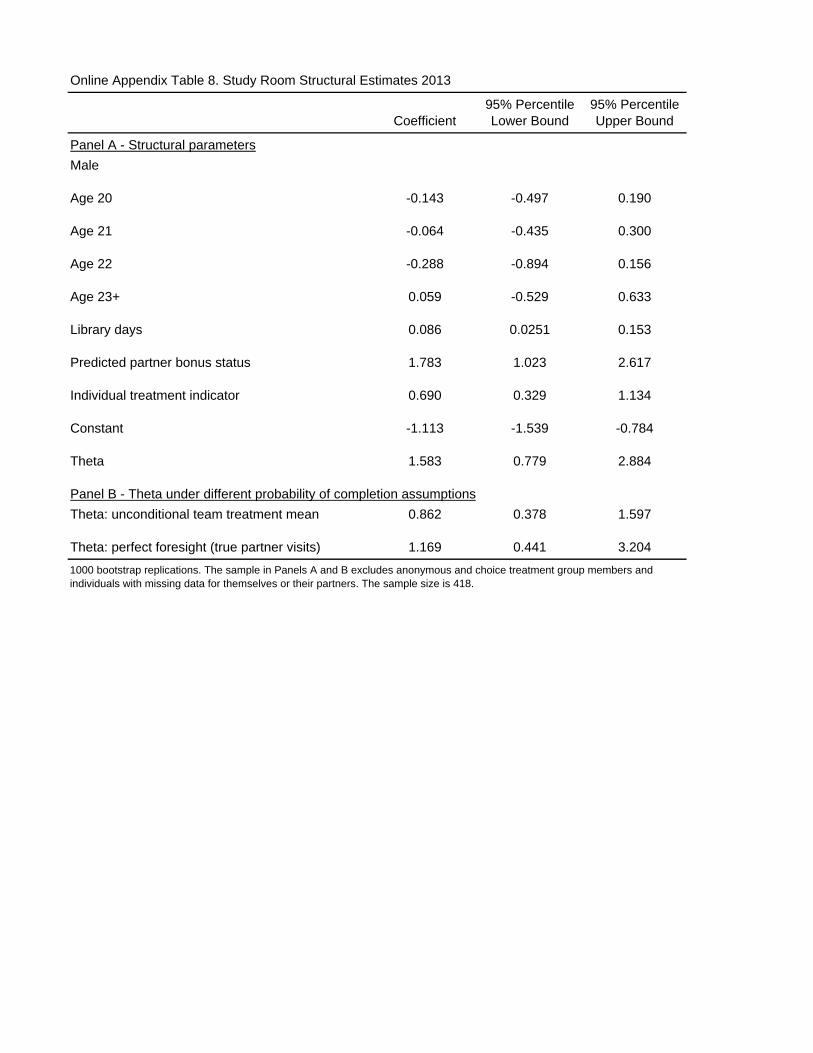
Online Appendix Table 8. Study Room Structural Estimates 2013
95% Percentile 95% PercentileCoefficient Lower Bound Upper Bound
Panel A - Structural parameters
Male
Age 20 -0.143 -0.497 0.190
Age 21 -0.064 -0.435 0.300
Age 22 -0.288 -0.894 0.156
Age 23+ 0.059 -0.529 0.633
Library days 0.086 0.0251 0.153
Predicted partner bonus status 1.783 1.023 2.617
Individual treatment indicator 0.690 0.329 1.134
Constant -1.113 -1.539 -0.784
Theta 1.583 0.779 2.884
Panel B - Theta under different probability of completion assumptions
Theta: unconditional team treatment mean 0.862 0.378 1.597
Theta: perfect foresight (true partner visits) 1.169 0.441 3.204
1000 bootstrap replications. The sample in Panels A and B excludes anonymous and choice treatment group members and individuals with missing data for themselves or their partners. The sample size is 418.

Online Appendix Table 9. Percent of Pairs Visiting the Study Room Together
Number of Same Actual Random Actual Random Actual Random Actual RandomTime Visits Partner Partner Partner Partner Partner Partner Partner Partner
0 95.0 97.5 92.5 95.5 90.0 93.4 86.9 91.61 3.0 2.3 4.5 4.1 7.0 5.8 9.1 7.22 1.0 0.2 2.0 0.4 2.0 0.6 3.0 1.13 0.0 0.1 0.0 0.1 0.0 0.1 0.0 0.2
4+ 1.0 0.0 1.0 0.0 1.0 0.0 1.0 0.0
Same Time = +/- 5 Minutes Same Time = +/- 10 Minutes Same Time = +/- 20 Minutes Same Time = +/- 30 Minutes
Random pairs randomly matched within class within the team treatment (true partners are excluded). Random pairs redrawn 1000 times.
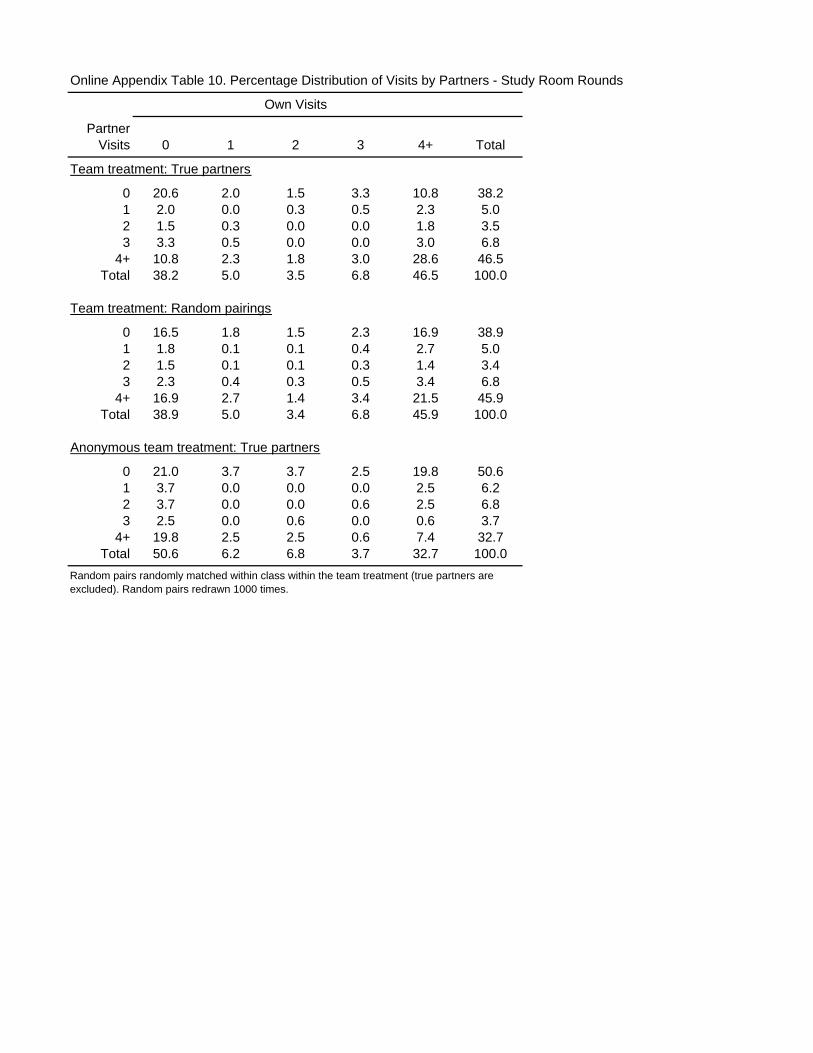
Online Appendix Table 10. Percentage Distribution of Visits by Partners - Study Room Rounds
PartnerVisits 0 1 2 3 4+ Total
Team treatment: True partners
0 20.6 2.0 1.5 3.3 10.8 38.21 2.0 0.0 0.3 0.5 2.3 5.02 1.5 0.3 0.0 0.0 1.8 3.53 3.3 0.5 0.0 0.0 3.0 6.8
4+ 10.8 2.3 1.8 3.0 28.6 46.5Total 38.2 5.0 3.5 6.8 46.5 100.0
Team treatment: Random pairings
0 16.5 1.8 1.5 2.3 16.9 38.91 1.8 0.1 0.1 0.4 2.7 5.02 1.5 0.1 0.1 0.3 1.4 3.43 2.3 0.4 0.3 0.5 3.4 6.8
4+ 16.9 2.7 1.4 3.4 21.5 45.9Total 38.9 5.0 3.4 6.8 45.9 100.0
Anonymous team treatment: True partners
0 21.0 3.7 3.7 2.5 19.8 50.61 3.7 0.0 0.0 0.0 2.5 6.22 3.7 0.0 0.0 0.6 2.5 6.83 2.5 0.0 0.6 0.0 0.6 3.7
4+ 19.8 2.5 2.5 0.6 7.4 32.7Total 50.6 6.2 6.8 3.7 32.7 100.0
Own Visits
Random pairs randomly matched within class within the team treatment (true partners are excluded). Random pairs redrawn 1000 times.
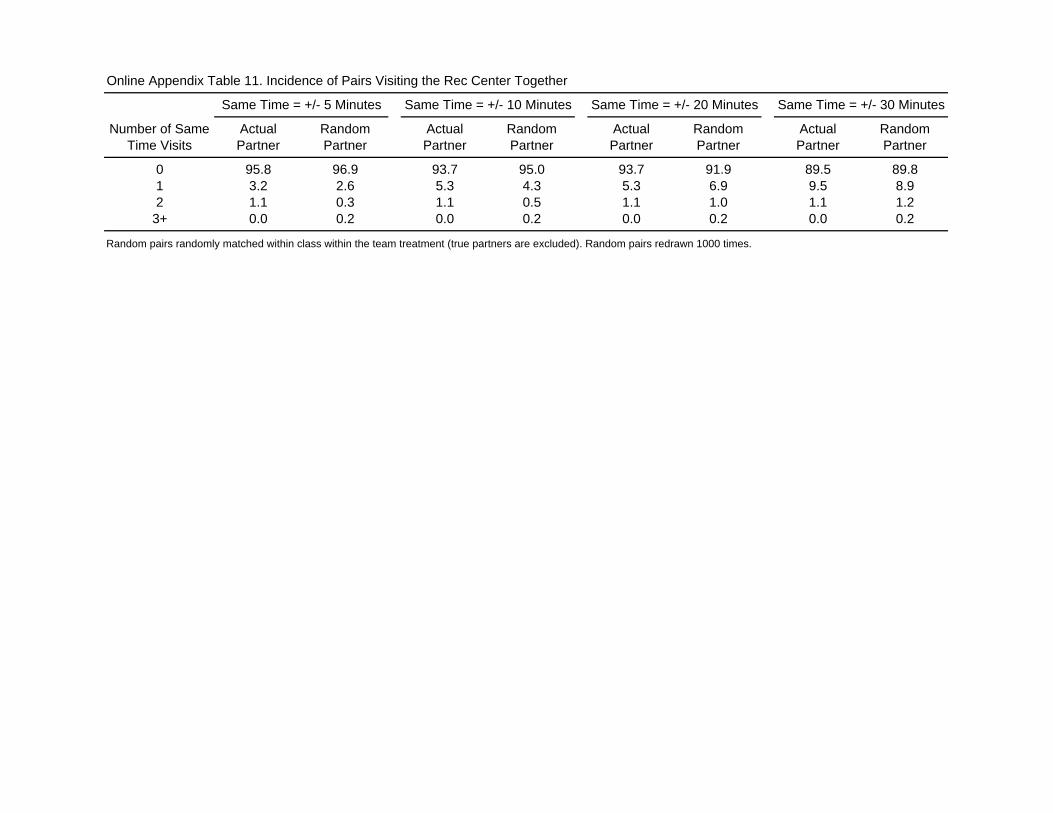
Online Appendix Table 11. Incidence of Pairs Visiting the Rec Center Together
Number of Same Actual Random Actual Random Actual Random Actual RandomTime Visits Partner Partner Partner Partner Partner Partner Partner Partner
0 95.8 96.9 93.7 95.0 93.7 91.9 89.5 89.81 3.2 2.6 5.3 4.3 5.3 6.9 9.5 8.92 1.1 0.3 1.1 0.5 1.1 1.0 1.1 1.2
3+ 0.0 0.2 0.0 0.2 0.0 0.2 0.0 0.2
Same Time = +/- 5 Minutes Same Time = +/- 10 Minutes Same Time = +/- 20 Minutes Same Time = +/- 30 Minutes
Random pairs randomly matched within class within the team treatment (true partners are excluded). Random pairs redrawn 1000 times.

Online Appendix Table 12. Percentage Distribution of Visits by Partners - Rec Center Round
PartnerVisits 0 1 2 3 4 5+ Total
True partners
0 6.3 1.6 0.5 1.1 0.5 7.9 17.91 1.6 1.1 0.5 1.6 0.5 1.6 6.92 0.5 0.5 0.0 0.5 0.5 2.1 4.23 1.1 1.6 0.5 1.1 0.5 1.6 6.34 0.5 0.5 0.5 0.5 0.0 6.3 8.4
5+ 7.9 1.6 2.1 1.6 6.3 36.8 56.3Total 17.9 6.9 4.2 6.3 8.4 56.3 100.1
Random pairings
0 3.4 1.8 0.6 1.1 1.4 9.6 8.21 1.8 0.5 0.3 0.4 0.5 3.5 3.32 0.6 0.3 0.3 0.3 0.3 2.5 1.73 1.1 0.4 0.3 0.3 0.7 3.6 2.74 1.4 0.5 0.3 0.7 0.7 5.1 8.4
5+ 9.6 3.5 2.5 3.6 5.1 32.0 56.3Total 17.8 6.9 4.2 6.3 8.4 56.3 43.6
Own Visits
Notes: Random pairs randomly matched within class within the team treatment (true partners are excluded). Random pairs redrawn 1000 times.

Appendix A: Details of Experimental Design
Pay for Studying Experiment
Subjects were recruited at the beginning of 17 Economics classes and 1 Psychology class at
University of California Santa Barbara (UCSB) during the fall quarter of 2011 and at the
beginning of 12 undergraduate classes (9 from Economics and 1 each from Asian American
Studies, Global Studies, and Communication) at UCSB during fall quarter 2013. All sign-ups for
the experiment occurred about two (four) weeks into the quarter in 2011 (2013). This translates
to October 3-7 in 2011 and October 17-24 in 2013. The first stage of recruitment involved asking
students to fill out a brief survey at the beginning of each lecture (Appendix B contains an in-
class survey).1 Students were told that they would be entered in a draw to win $50 if they filled
out the survey.2 In order to claim the $50 they were also told that they would have to bring the
bottom portion of their survey (which they were instructed to tear off and keep) and be present at
the drawing that would take place outside the lecture hall after class.
All surveys had a unique identification code. From the perspective of the students this appeared
to be an alphanumeric code for the lottery to be held after class. For our purposes, it was a
random code that identified treatment group and, in the case of the team treatment, potential
partners. Survey identification codes included an A, B, C, D, E, or F as the first character,
followed by a number. The letter indicated group assignment. For example, A might indicate
control group, B individual treatment, C and D anonymous treatment, and E and F team
treatment. We rotated the letter-experimental group match across classes to ensure that students
in subsequent classes could not successfully inform their friends about what specific letters
meant. The letter codes were not explained to students prior to their arrival after class and were
designed to look like a random raffle identifier, or even go unnoticed, until described after class.
There is no evidence that students were able to infer their treatment status from these codes or
that the codes influenced their decision to participate: There were no significant differences in
participation rates between treatment groups.
Subjects were informed of their treatment status both verbally at the end of class and via email.
The study room seats about 100 people, so the researchers can visibly see who arrives and leaves
the room.
Assignment of Team Treatment
To facilitate rapid pairing, the in-class team treatment surveys had a built-in paring; for example,
if subjects with sign-up forms with letters C and D in their alphanumeric code, students with the
same number would automatically be matched with each other. For example, if C8 and D8 both
1 All surveys, for all treatment groups, came from a randomized pile. This ensured that subjects did not know with
whom they were matched until after lecture, and that subjects were not sitting near their potential partner (except by
random chance). 2 Due to larger class sizes in 2013, the number of $50 winners depended on class size; it ranged from 1-4 drawings.
show up after class, they would be matched together. Subjects with a “partner” who did not show
up after lecture were randomly re-matched with another subject without a “partner.”3
B. Experimental Design, Pay for Exercise
Subjects were recruited during and after lectures in all nine Economics classes at University of
California Santa Barbara (UCSB), during the second six-week summer session in 2010. All sign-
ups for the experiment occurred during week one (August 3-6). The sign-up process only
differed slightly from that for the library experiment.
Assignment of Team Treatment
Subjects with the same alphanumeric code were matched when possible (e.g. C1 and C1*), with
random re-matching when the potential partner did not show up outside.
Subjects were informed that payments would be made in week five of the six-week session. Just
as in the library study, we wanted to ensure that subjects in the team treatment knew that they
would potentially see their partners after the partner knew if the bonus threshold was reached.
C. Measuring Visits
One benefit of the library experimental design is that it allows for study room visits to be
supervised by a researcher or research assistant. Logs were kept every day to determine who
studied at the study room each day. Identities were checked by photo identification at check-in.
When a subject asked if another subject had visited the study room, the person with access to the
daily log would deny the subject’s request.
In the case of Rec Center attendance, we used electronic collection. Whenever anyone wishes to
enter the Rec Center the attendant at the front desk takes her or his student photo ID card and
electronically scans it. The time, date, and student card barcode of every gym entry is stored
electronically. The Rec Center generously provided us with data that included all gym visits for
every in-class survey respondent from July 21 through August 20, 2010. Because the Rec Center
has the universe of student names and identification numbers they also verified for us that every
student who filled out an in-class survey was in their database. In other words, there are no cases
in which we are confounding non-attendance with an incorrect name and/or student identification
number.
3 This was done by matching in ascending sequential order. If C10 showed up but not D10 and the next unmatched
group treatment number was C12, we matched C10 and C12. This preserves randomization since surveys were
distributed randomly in class. In the few circumstances in which this process left a group treatment participant
without a partner, we randomly selected a control group member to pair with her/him.
Appendix B
Survey and Consent Forms
Pay-For-Study - 2011
1. In-Class Consent Form and Survey
2. Participant Consent Forms
a. Control Group
b. Individual Treatment
c. Team Treatment
d. Anonymous Treatment
Pay-For-Study - 2013
1. In-Class Consent Form and Survey
2. Participant Consent Forms
a. Control Group
b. Individual Treatment
c. Team Treatment
d. Choice Treatment
Pay-For-Exercise – Summer 2010
1. In-Class Consent Form and Survey
2. Participant Consent Forms
a. Control Group
b. Individual Treatment
c. Team Treatment
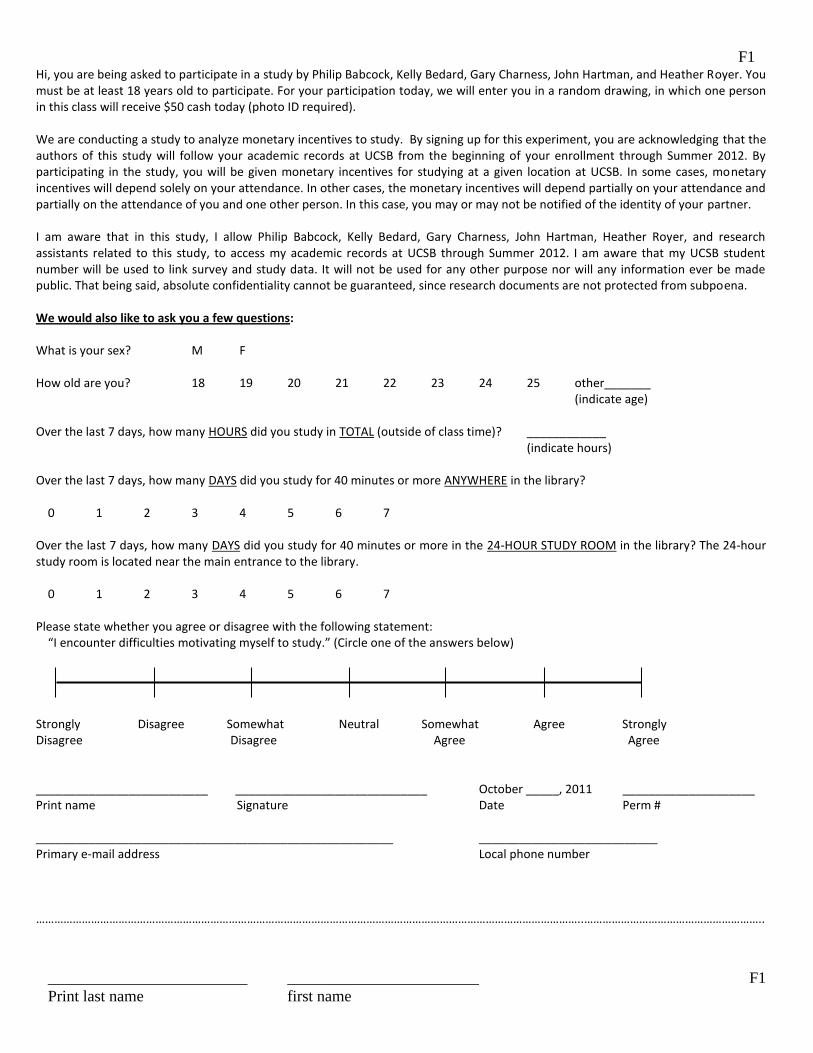
F1
_________________________ ________________________ F1
Print last name first name
Hi, you are being asked to participate in a study by Philip Babcock, Kelly Bedard, Gary Charness, John Hartman, and Heather Royer. You must be at least 18 years old to participate. For your participation today, we will enter you in a random drawing, in which one person in this class will receive $50 cash today (photo ID required). We are conducting a study to analyze monetary incentives to study. By signing up for this experiment, you are acknowledging that the authors of this study will follow your academic records at UCSB from the beginning of your enrollment through Summer 2012. By participating in the study, you will be given monetary incentives for studying at a given location at UCSB. In some cases, monetary incentives will depend solely on your attendance. In other cases, the monetary incentives will depend partially on your attendance and partially on the attendance of you and one other person. In this case, you may or may not be notified of the identity of your partner. I am aware that in this study, I allow Philip Babcock, Kelly Bedard, Gary Charness, John Hartman, Heather Royer, and research assistants related to this study, to access my academic records at UCSB through Summer 2012. I am aware that my UCSB student number will be used to link survey and study data. It will not be used for any other purpose nor will any information ever be made public. That being said, absolute confidentiality cannot be guaranteed, since research documents are not protected from subpoena. We would also like to ask you a few questions: What is your sex? M F How old are you? 18 19 20 21 22 23 24 25 other_______ (indicate age) Over the last 7 days, how many HOURS did you study in TOTAL (outside of class time)? ____________ (indicate hours) Over the last 7 days, how many DAYS did you study for 40 minutes or more ANYWHERE in the library? 0 1 2 3 4 5 6 7 Over the last 7 days, how many DAYS did you study for 40 minutes or more in the 24-HOUR STUDY ROOM in the library? The 24-hour study room is located near the main entrance to the library. 0 1 2 3 4 5 6 7 Please state whether you agree or disagree with the following statement: “I encounter difficulties motivating myself to study.” (Circle one of the answers below)
Strongly Disagree Somewhat Neutral Somewhat Agree Strongly Disagree Disagree Agree Agree __________________________ _____________________________ October _____, 2011 ____________________ Print name Signature Date Perm # ______________________________________________________ ___________________________ Primary e-mail address Local phone number ……………………………………………………………………………………………………………………………………………………………..…………………………………………………..

You have been selected to earn additional money for attendance at the 24-hour study room in the library. You will receive $2 per study visit for up to 4 visits in the specified 2-week treatment period. Only one visit per day is eligible for payment. In order for a study visit to count, students must log in with a researcher posted in the 24-hour study room and remain in the study room for at least 40 minutes before logging out with the researcher. We will man the 24-hour study room from 11:00am to 7:00pm Monday through Friday from October 10-21, 2011. Students must log in by 6:20pm for the visit to qualify. We will pay you for qualifying study room visits in approximately four weeks. You will receive an e-mail in about three weeks with more information. Your participation is voluntary. There will be no repercussions should you decide not to participate. Please note that you may withdraw your participation at any time, and you will be paid based on your attendance at the study room up to the point that you withdraw from participating. If you have any questions, you may contact Philip Babcock at [email protected] or 805-893-4823, or John Hartman at [email protected]. If you have any questions concerning any matter relating to your participation, you may also call the University of California Santa Barbara Human Subjects committee at 805-893-3807. By signing below, I acknowledge the above information.
Signature_____________________________________ Print name____________________________________
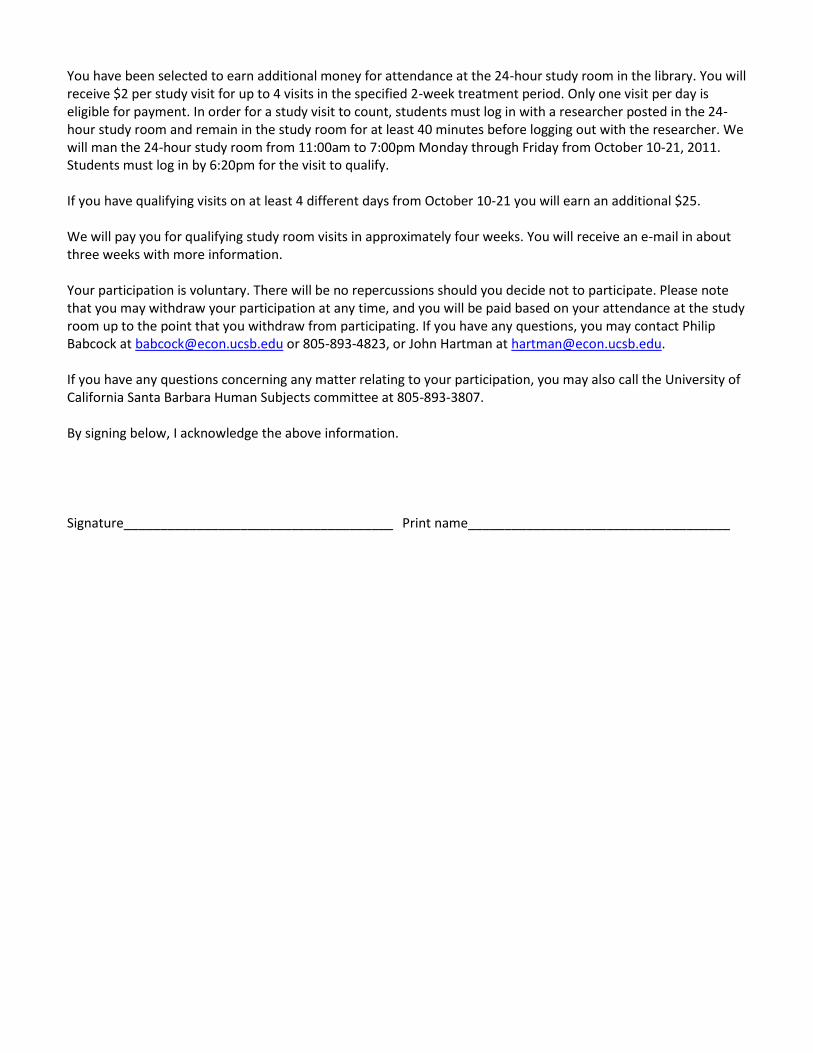
You have been selected to earn additional money for attendance at the 24-hour study room in the library. You will receive $2 per study visit for up to 4 visits in the specified 2-week treatment period. Only one visit per day is eligible for payment. In order for a study visit to count, students must log in with a researcher posted in the 24-hour study room and remain in the study room for at least 40 minutes before logging out with the researcher. We will man the 24-hour study room from 11:00am to 7:00pm Monday through Friday from October 10-21, 2011. Students must log in by 6:20pm for the visit to qualify. If you have qualifying visits on at least 4 different days from October 10-21 you will earn an additional $25. We will pay you for qualifying study room visits in approximately four weeks. You will receive an e-mail in about three weeks with more information. Your participation is voluntary. There will be no repercussions should you decide not to participate. Please note that you may withdraw your participation at any time, and you will be paid based on your attendance at the study room up to the point that you withdraw from participating. If you have any questions, you may contact Philip Babcock at [email protected] or 805-893-4823, or John Hartman at [email protected]. If you have any questions concerning any matter relating to your participation, you may also call the University of California Santa Barbara Human Subjects committee at 805-893-3807. By signing below, I acknowledge the above information.
Signature_____________________________________ Print name____________________________________
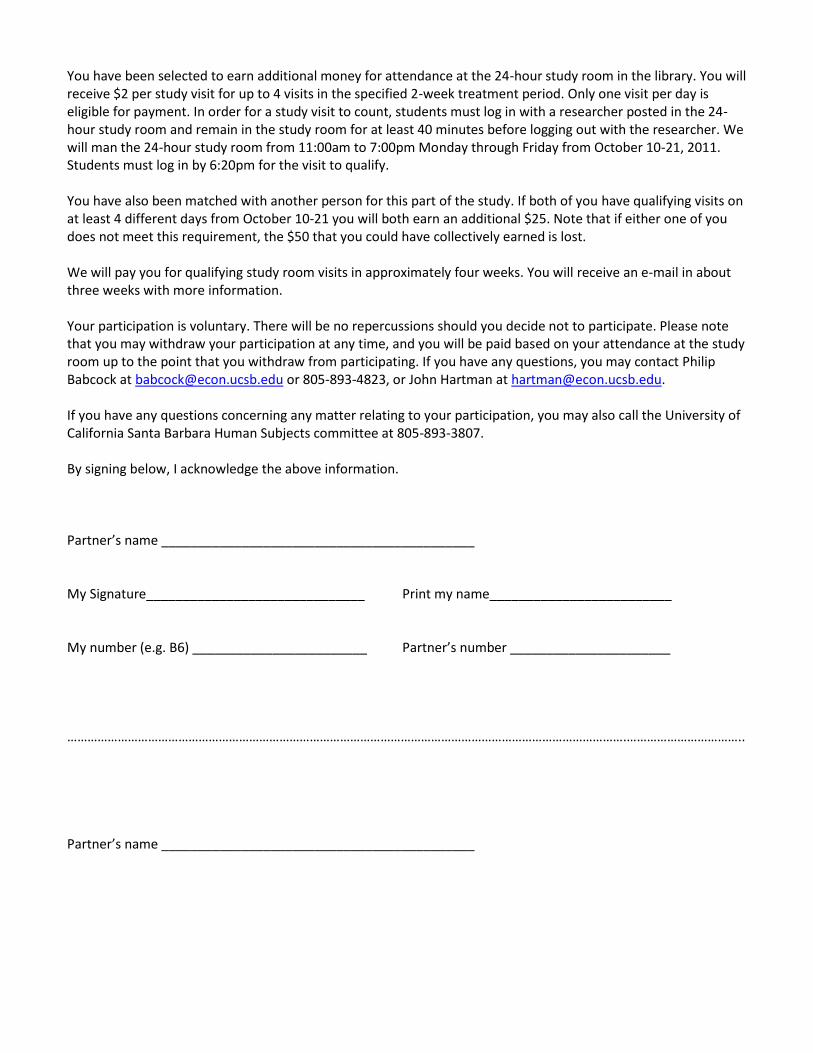
You have been selected to earn additional money for attendance at the 24-hour study room in the library. You will receive $2 per study visit for up to 4 visits in the specified 2-week treatment period. Only one visit per day is eligible for payment. In order for a study visit to count, students must log in with a researcher posted in the 24-hour study room and remain in the study room for at least 40 minutes before logging out with the researcher. We will man the 24-hour study room from 11:00am to 7:00pm Monday through Friday from October 10-21, 2011. Students must log in by 6:20pm for the visit to qualify. You have also been matched with another person for this part of the study. If both of you have qualifying visits on at least 4 different days from October 10-21 you will both earn an additional $25. Note that if either one of you does not meet this requirement, the $50 that you could have collectively earned is lost. We will pay you for qualifying study room visits in approximately four weeks. You will receive an e-mail in about three weeks with more information. Your participation is voluntary. There will be no repercussions should you decide not to participate. Please note that you may withdraw your participation at any time, and you will be paid based on your attendance at the study room up to the point that you withdraw from participating. If you have any questions, you may contact Philip Babcock at [email protected] or 805-893-4823, or John Hartman at [email protected]. If you have any questions concerning any matter relating to your participation, you may also call the University of California Santa Barbara Human Subjects committee at 805-893-3807. By signing below, I acknowledge the above information. Partner’s name ___________________________________________ My Signature______________________________ Print my name_________________________ My number (e.g. B6) ________________________ Partner’s number ______________________ ………………………………………………………………………………………………………………………………………………….…………………………….. Partner’s name ___________________________________________
You have been selected to earn additional money for attendance at the 24-hour study room in the library. You will receive $2 per study visit for up to 4 visits in the specified 2-week treatment period. Only one visit per day is eligible for payment. In order for a study visit to count, students must log in with a researcher posted in the 24-hour study room and remain in the study room for at least 40 minutes before logging out with the researcher. We will man the 24-hour study room from 11:00am to 7:00pm Monday through Friday from October 10-21, 2011. Students must log in by 6:20pm for the visit to qualify. You will be matched with another person from another class for this part of the study. The identity of your partner will not be revealed to you or your partner – it is entirely anonymous. If both of you have qualifying visits on at least 4 different days from October 10-21 you will both earn an additional $25. Note that if either one of you does not meet this requirement, the $50 that you could have collectively earned is lost. We will pay you for qualifying study room visits in approximately four weeks. You will receive an e-mail in about three weeks with more information. Your participation is voluntary. There will be no repercussions should you decide not to participate. Please note that you may withdraw your participation at any time, and you will be paid based on your attendance at the study room up to the point that you withdraw from participating. If you have any questions, you may contact Philip Babcock at [email protected] or 805-893-4823, or John Hartman at [email protected]. If you have any questions concerning any matter relating to your participation, you may also call the University of California Santa Barbara Human Subjects committee at 805-893-3807. By signing below, I acknowledge the above information. Signature______________________________ Print name_________________________
E1
_________________________ ________________________ E1
Print last name first name
Hi, you are being asked to participate in a study by Kelly Bedard, Gary Charness, John Hartman, and Heather Royer. You must be at least 18 years old to participate. For your participation today, we will enter you in a random drawing, in which one person in this class will receive $50 cash today (photo ID required). We are conducting a study to analyze monetary incentives to study. By participating in the study, you will be given monetary incentives for studying at a specific location at UCSB. In some cases, monetary incentives will depend solely on your attendance. In other cases, the monetary incentives will depend partially on your attendance and partially on the attendance of you and one other person. I am aware that in this study, I allow Kelly Bedard, Gary Charness, John Hartman, Heather Royer, and research assistants related to this study, to collect information about my participation in this study. I am aware that my UCSB student number will be used to link survey and study data. It will not be used for any other purpose nor will any identifiable information ever be made public. That being said, absolute confidentiality cannot be guaranteed, since research documents are not protected from subpoena. We would also like to ask you a few questions: What is your sex? M F How old are you? 18 19 20 21 22 23 24 25 other_______ (indicate age) Are you Hispanic/Latino? Yes No What is your race? White Black Asian Other Over the last 7 days, how many HOURS did you study in TOTAL (outside of class time)? ____________ (indicate hours) Over the last 7 days, how many DAYS did you study for 40 minutes or more in the library? 0 1 2 3 4 5 6 7 Please state whether you agree or disagree with the following statement: “I encounter difficulties motivating myself to study.” (Circle one of the answers below)
Strongly Disagree Somewhat Neutral Somewhat Agree Strongly Disagree Disagree Agree Agree __________________________ _____________________________ October _____, 2013 ____________________ Print name Signature Date Perm # ______________________________________________________ ___________________________ Primary e-mail address Local phone number ……………………………………………………………………………………………………………………………………………………………..…………………………………………………..

You have been selected to earn additional money for attendance at the “experimental study area” in the library. The experimental study area will be located on the second floor of the library near the elevators. You will receive $2 per study visit for up to 4 visits in the specified 2-week treatment period. Only one visit per day is eligible for payment. In order for a study visit to count, students must log in with a researcher posted in the experimental study area and remain in the area for at least 40 minutes before logging out with the researcher. We will man the experimental study area from 11:00am to 7:00pm Monday through Friday from October 28 – November 8, 2013. Students must log in by 6:20pm for the visit to qualify. We will pay you for qualifying study area visits in approximately four weeks. You will receive an e-mail in about three weeks with more information. Your participation is voluntary. There will be no repercussions should you decide not to participate. Please note that you may withdraw your participation at any time, and you will be paid based on your attendance at the study room up to the point that you withdraw from participating. If you have any questions, you may contact Kelly Bedard at (805) 893-5571 or [email protected]. If you have any questions regarding your rights and participation as a research subject, please contact the Human Subjects Committee at (805) 893-3807 or [email protected]. Or write to the University of California, Human Subjects Committee, Office of Research, Santa Barbara, CA 93106-2050. By signing below, I acknowledge the above information.
Signature_____________________________________ Print name____________________________________

You have been selected to earn additional money for attendance at the “experimental study area” in the library. The experimental study area will be located on the second floor of the library near the elevators. You will receive $2 per study visit for up to 4 visits in the specified 2-week treatment period. Only one visit per day is eligible for payment. In order for a study visit to count, students must log in with a researcher posted in the experimental study area and remain in the study area for at least 40 minutes before logging out with the researcher. We will man the experimental study area from 11:00am to 7:00pm Monday through Friday from October 28 – November 8, 2013. Students must log in by 6:20pm for the visit to qualify. If you have qualifying visits on at least 4 different days from October 28 – November 8 you will earn an additional $25. We will pay you for qualifying study area visits in approximately four weeks. You will receive an e-mail in about three weeks with more information. Your participation is voluntary. There will be no repercussions should you decide not to participate. Please note that you may withdraw your participation at any time, and you will be paid based on your attendance at the study room up to the point that you withdraw from participating. If you have any questions, you may contact Kelly Bedard at (805) 893-5571 or [email protected]. If you have any questions regarding your rights and participation as a research subject, please contact the Human Subjects Committee at (805) 893-3807 or [email protected]. Or write to the University of California, Human Subjects Committee, Office of Research, Santa Barbara, CA 93106-2050. By signing below, I acknowledge the above information.
Signature_____________________________________ Print name____________________________________

You have been selected to earn additional money for attendance at the “experimental study area” in the library. The experimental study area will be located on the second floor of the library near the elevators. You will receive $2 per study visit for up to 4 visits in the specified 2-week treatment period. Only one visit per day is eligible for payment. In order for a study visit to count, students must log in with a researcher posted in the experimental study area and remain in the study area for at least 40 minutes before logging out with the researcher. We will man the experimental study area from 11:00am to 7:00pm Monday through Friday from October 28 – November 8, 2013. Students must log in by 6:20pm for the visit to qualify. You have also been matched with another person for this part of the study. If both of you have qualifying visits on at least 4 different days from October 28 – November 8 you will both earn an additional $25. Note that if either one of you does not meet this requirement, the $50 that you could have collectively earned is lost. We will pay you for qualifying study area visits in approximately four weeks. You will receive an e-mail in about three weeks with more information. Your participation is voluntary. There will be no repercussions should you decide not to participate. Please note that you may withdraw your participation at any time, and you will be paid based on your attendance at the study room up to the point that you withdraw from participating. If you have any questions, you may contact Kelly Bedard at (805) 893-5571 or [email protected]. If you have any questions regarding your rights and participation as a research subject, please contact the Human Subjects Committee at (805) 893-3807 or [email protected]. Or write to the University of California, Human Subjects Committee, Office of Research, Santa Barbara, CA 93106-2050. By signing below, I acknowledge the above information. Partner’s name ___________________________________________ My Signature______________________________ Print my name_________________________ My number (e.g. B6) ________________________ Partner’s number ______________________ ………………………………………………………………………………………………………………………………………………….…………………………….. Partner’s name ___________________________________________
You have been selected to earn additional money for attendance at the “experimental study area” in the library. The experimental study area will be located on the second floor of the library near the elevators. You will receive $2 per study visit for up to 4 visits in the specified 2-week treatment period. Only one visit per day is eligible for payment. In order for a study visit to count, students must log in with a researcher posted in the experimental study area and remain in the study area for at least 40 minutes before logging out with the researcher. We will man the experimental study area from 11:00am to 7:00pm Monday through Friday from October 28 – November 8, 2013. Students must log in by 6:20pm for the visit to qualify. You have also been selected to be given the opportunity to choose between two options for earning an additional $25:
(1) If you (on your own) have qualifying visits on at least 4 different days from October 28 – November 8 you will earn an additional $25.
(2) You will be matched with another person from this class, but not from this group. If both of you have
qualifying visits on at least 4 different days from October 28 – November 8 you will both earn an additional $25. Note that if either one of you does not meet this requirement, the $50 that you could have collectively earned is lost. Also note that you will not learn the identity of your partner until after choosing between options (1) and (2), and you will only be matched if you choose option (2).
We will pay you for qualifying study area visits in approximately four weeks. You will receive an e-mail in about three weeks with more information. Your participation is voluntary. There will be no repercussions should you decide not to participate. Please note that you may withdraw your participation at any time, and you will be paid based on your attendance at the study room up to the point that you withdraw from participating. If you have any questions, you may contact Kelly Bedard at (805) 893-5571 or [email protected]. If you have any questions regarding your rights and participation as a research subject, please contact the Human Subjects Committee at (805) 893-3807 or [email protected]. Or write to the University of California, Human Subjects Committee, Office of Research, Santa Barbara, CA 93106-2050. Please mark your choice with and X: I choose option (1) _________________ I choose option (2) _________________ By signing below, I acknowledge the above information. Signature______________________________ Print name_________________________
A1*
A1 _______________ _______________
Print last name first name *
Hi, you are being asked to participate in a study by Philip Babcock, Kelly Bedard, Gary Charness, John Hartman,
and Heather Royer. You must be at least 18 years old to participate. For your participation today, we will enter you
in a random drawing, in which one person in this class will receive $50 cash today (subject to presentation of photo
ID).
We are conducting a study to analyze monetary incentives to exercise. By signing up for this experiment, you are
acknowledging that the authors of this study will follow your attendance at the UCSB Recreation Center (“Rec
Center”) for June through September 2010. By participating in the study, you may be randomly selected to earn
money for attending the Rec Center. In some cases, the monetary incentives will depend solely on your attendance.
In other cases, the monetary incentives will depend partially on your attendance and partially on the attendance of
you and one other person (whom you will be notified about if you are selected).
I am aware that in this study, I allow Philip Babcock, Kelly Bedard, Gary Charness, John Hartman, Heather Royer,
and research assistants related to this study, to access my attendance records at the UCSB Recreation Center for June
to September 2010.
I also acknowledge the following information: Exercise has potential risks and benefits. Before starting any exercise
program, you may want to consider contacting a doctor or other professional qualified to help determine what types
of exercise are appropriate for you. When exercise is tailored to your physical condition and health, the gains from
exercise usually outweigh the costs. Please also note that pregnancy may complicate the type and amount of exercise
that you need. If you are pregnant or plan on becoming pregnant in the next six weeks, or if you are 17 years old or
younger, you are not allowed to participate in this study.
After making payment to participants, all identifiers will be immediately removed from the data. The anonymized
attendance records will be kept in a locked drawer in the office of Gary Charness.
We would also like to ask you a few questions:
What is your sex? M F
How old are you? 18 19 20 21 22 23 24 25 other_______
In the last month, how many times per week did you moderately or vigorously exercise for 30 minutes or more?
0 less than 1 1 2 3 4 5 6 7 more than 7
_____________________ ____________________________ August _____, 2010
Print name Signature Date
_____________________ __________________________ ______________________
Perm # Primary e-mail address Local phone number
………………………………………………………………..………………………………………………………….

You have been selected to receive information on the benefits of exercise.
Exercise has potential risks and benefits. Before starting any exercise program, you may want to consider
contacting a doctor or other professional qualified to help determine what types of exercise are
appropriate for you. When exercise is tailored to your physical condition and health, the gains from
exercise usually outweigh the costs. Please also note that pregnancy may complicate the type and amount
of exercise that you need.
If you have any questions, you may contact Philip Babcock at [email protected] or 805-893-4823,
or John Hartman at [email protected].
If you have any questions concerning any matter relating to your participation, you may also call the
University of California Santa Barbara Human Subjects committee at 805-893-3807.
The University of California does not provide compensation for injury to human subjects of research
except that the University will provide for any medical care required to treat any injury resulting from
participation as a human subject in a University-approved activity. If you have any questions concerning
this or any other matter relating to your participation in this activity, please call 893-3807.
By signing below, I acknowledge the above information. I will also do the following immediately if I
become pregnant or suspect that I am pregnant:
• Stop attending the UCSB Recreation Center.
• Notify one of the researchers listed above.
Signature______________________________ Print name_________________________
You have been selected to earn additional money from attendance at the UCSB Recreation Center (“Rec
Center”). From August 7-20, 2010, you will earn $2 for exercising at the Rec Center on any of these
dates, up to $10. If you attend the Rec Center at least five different days from August 7-20, 2010, you will
earn an additional $25.
We will pay you for qualifying Rec Center visits in approximately four weeks. You will receive an e-mail
in about three weeks with more information.
Recall the following information that you acknowledged earlier today: Exercise has potential risks and
benefits. Before starting any exercise program, you may want to consider contacting a doctor or other
professional qualified to help determine what types of exercise are appropriate for you. When exercise is
tailored to your physical condition and health, the gains from exercise usually outweigh the costs. Please
also note that pregnancy may complicate the type and amount of exercise that you need. If you are
pregnant or plan on becoming pregnant in the next six weeks you are not allowed to participate in this
exercise study.
Your exercise participation is voluntary. There will be no repercussions should you decide not to
participate. Please note that you may withdraw your participation at any time, and you will be paid based
on your attendance at the Rec Center up to the point that you withdraw from participating. If you have any
questions, you may contact Philip Babcock at [email protected] or 805-893-4823, or John
Hartman at [email protected].
If you have any questions concerning any matter relating to your participation, you may also call the
University of California Santa Barbara Human Subjects committee at 805-893-3807.
The University of California does not provide compensation for injury to human subjects of research
except that the University will provide for any medical care required to treat any injury resulting from
participation as a human subject in a University-approved activity. If you have any questions concerning
this or any other matter relating to your participation in this activity, please call 893-3807.
By signing below, I acknowledge the above information. I will also do the following immediately if I
become pregnant or suspect that I am pregnant:
• Stop attending the UCSB Recreation Center.
• Notify one of the researchers listed above.
Signature______________________________ Print name_________________________

You have been selected to earn additional money from attendance at the UCSB Recreation Center (“Rec
Center”). From August 7-20, 2010, you will earn $2 for exercising at the Rec Center on any of these
dates, up to $10. You have also been matched with another person for this part of the study. If both of you
attend the Rec Center at least five different days from August 7-20, 2010, you will each earn an additional
$25. Note that if either one of you does not meet this requirement, the $50 that you could have
collectively earned is lost.
We will pay you for qualifying Rec Center visits in approximately four weeks. You will receive an e-mail
in about three weeks with more information.
Recall the following information that you acknowledged earlier today: Exercise has potential risks and
benefits. Before starting any exercise program, you may want to consider contacting a doctor or other
professional qualified to help determine what types of exercise are appropriate for you. When exercise is
tailored to your physical condition and health, the gains from exercise usually outweigh the costs. Please
also note that pregnancy may complicate the type and amount of exercise that you need. If you are
pregnant or plan on becoming pregnant in the next six weeks you are not allowed to participate in this
exercise study.
Your exercise participation is voluntary. There will be no repercussions should you decide not to
participate. Please note that you may withdraw your participation at any time, and you will be paid based
on your attendance at the Rec Center up to the point that you withdraw from participating. If you have any
questions, you may contact Philip Babcock at [email protected] or 805-893-4823, or John
Hartman at [email protected].
If you have any questions concerning any matter relating to your participation, you may also call the
University of California Santa Barbara Human Subjects committee at 805-893-3807.
The University of California does not provide compensation for injury to human subjects of research
except that the University will provide for any medical care required to treat any injury resulting from
participation as a human subject in a University-approved activity. If you have any questions concerning
this or any other matter relating to your participation in this activity, please call 893-3807.
By signing below, I acknowledge the above information. I will also do the following immediately if I
become pregnant or suspect that I am pregnant:
• Stop attending the UCSB Recreation Center.
• Notify one of the researchers listed above.
Partner’s name ___________________________________________
Signature______________________________ Print name_________________________
………………………………………………………………………………………………………………..
Partner’s name ___________________________________________


