Lake Okeechobee Watershed Construction Project Phase II Technical Plan
Tom Teets South Florida Water Management District
Lake Okeechobee Watershed Construction Project Phase II Technical Plan
Tom Teets South Florida Water Management District
July 31, 2008
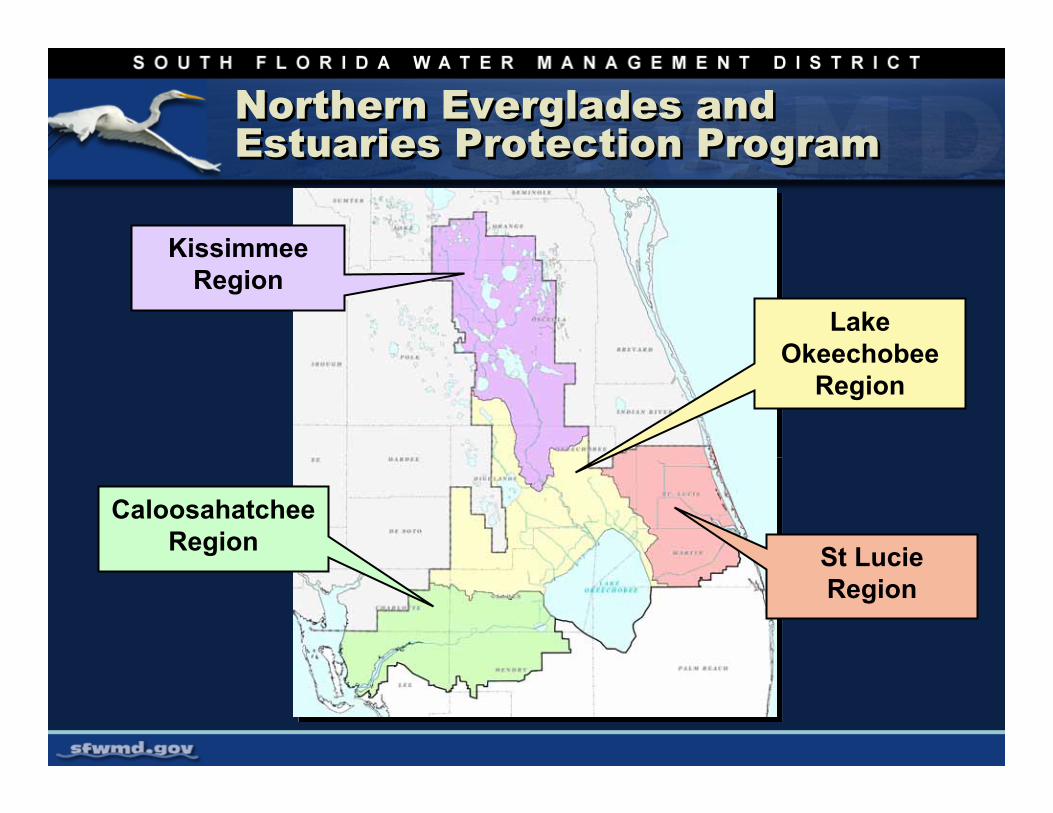
Northern Everglades and Estuaries Protection ProgramNorthern Everglades and Estuaries Protection Program
Kissimmee Region
Caloosahatchee Region St Lucie
Region
Lake Okeechobee
Region
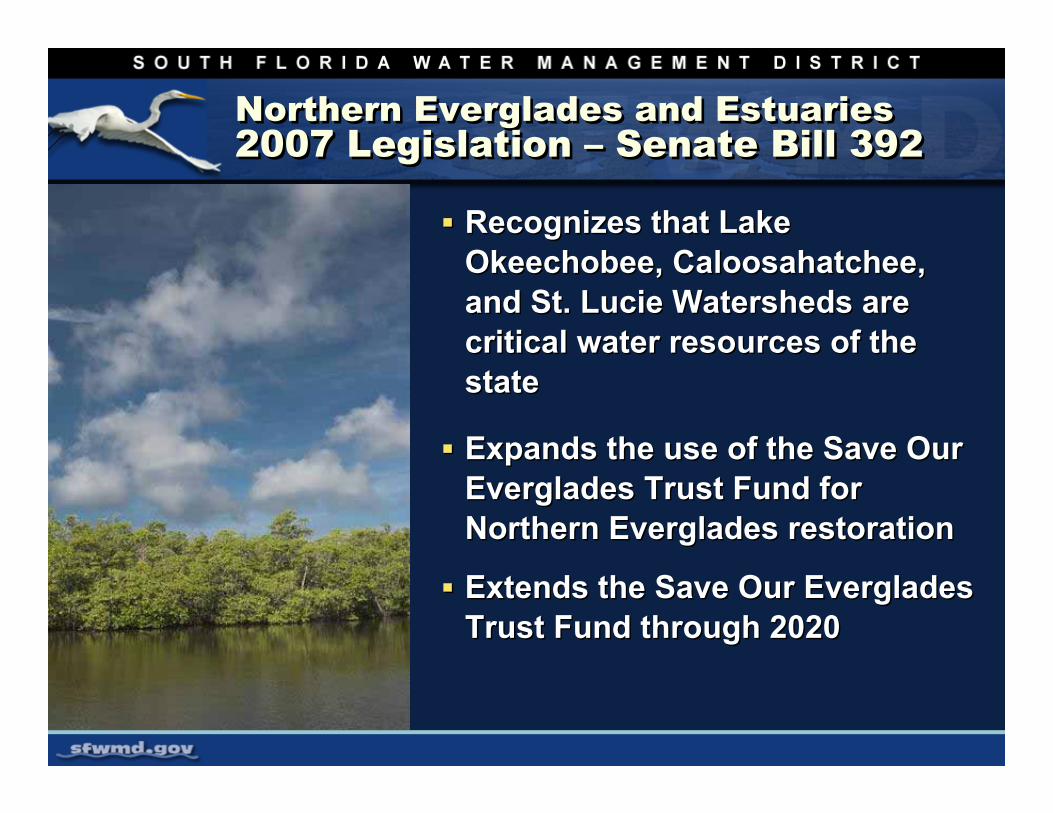
Northern Everglades and Estuaries2007 Legislation – Senate Bill 392Northern Everglades and Estuaries2007 Legislation – Senate Bill 392
Recognizes that Lake Okeechobee, Caloosahatchee, and St. Lucie Watersheds are critical water resources of the state
Expands the use of the Save Our Everglades Trust Fund for Northern Everglades restoration
Extends the Save Our Everglades Trust Fund through 2020
Recognizes that Lake Okeechobee, Caloosahatchee, and St. Lucie Watersheds are critical water resources of the state
Expands the use of the Save Our Everglades Trust Fund for Northern Everglades restoration
Extends the Save Our Everglades Trust Fund through 2020
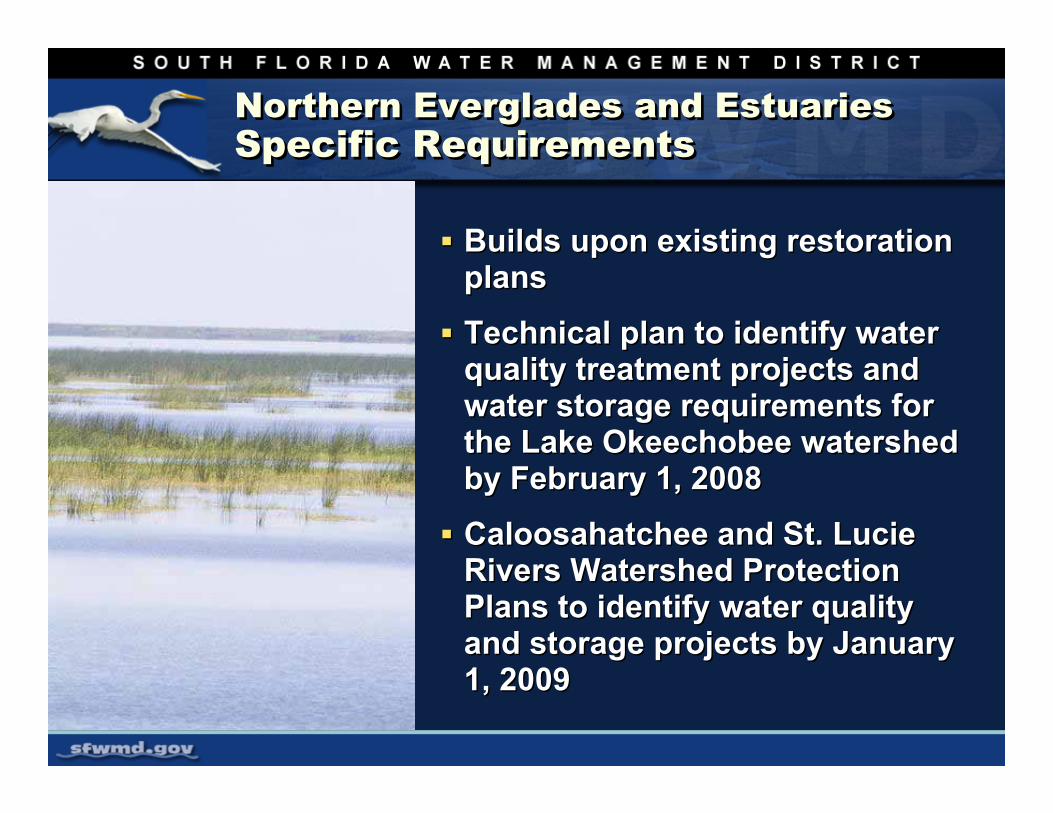
Northern Everglades and EstuariesSpecific RequirementsNorthern Everglades and EstuariesSpecific Requirements
Builds upon existing restoration plans
Technical plan to identify water quality treatment projects and water storage requirements for the Lake Okeechobee watershed by February 1, 2008
Caloosahatchee and St. Lucie Rivers Watershed Protection Plans to identify water quality and storage projects by January 1, 2009
Lake Okeechobee Watershed Construction Project
Phase II Technical Plan
Lake Okeechobee Technical Plan RequirementsLake Okeechobee Technical Plan Requirements
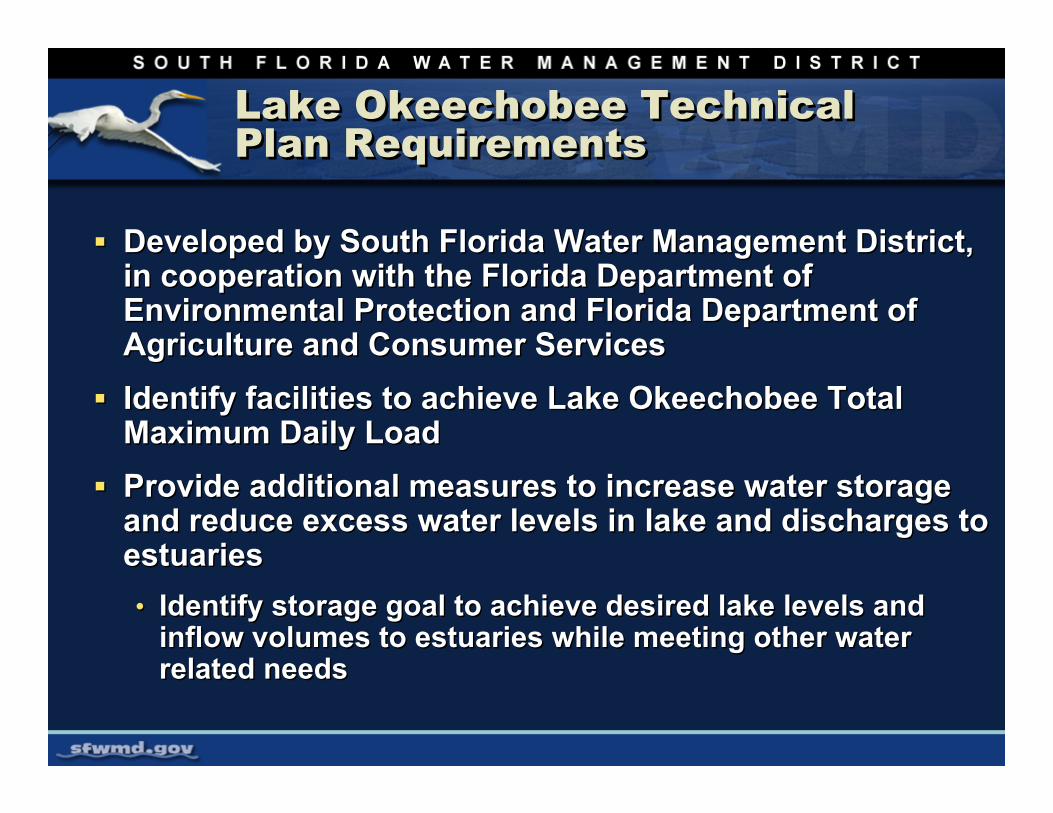
Developed by South Florida Water Management District, in cooperation with the Florida Department of Environmental Protection and Florida Department of Agriculture and Consumer ServicesIdentify facilities to achieve Lake Okeechobee Total Maximum Daily LoadProvide additional measures to increase water storage and reduce excess water levels in lake and discharges to estuaries• Identify storage goal to achieve desired lake levels and
inflow volumes to estuaries while meeting other water related needs
Alternative FormulationAlternative Formulation
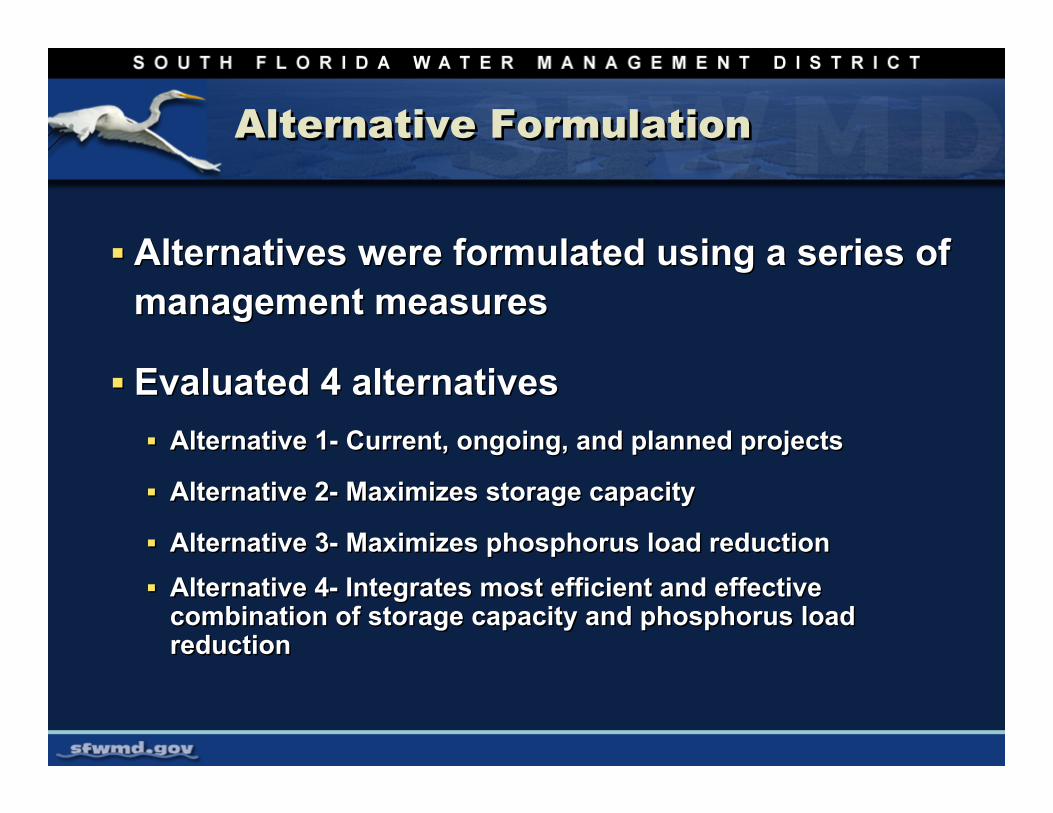
Alternatives were formulated using a series of management measures
Evaluated 4 alternativesAlternative 1- Current, ongoing, and planned projects
Alternative 2- Maximizes storage capacity
Alternative 3- Maximizes phosphorus load reductionAlternative 4- Integrates most efficient and effective combination of storage capacity and phosphorus load reduction
Water Quality and Quantity AnalysesWater Quality and Quantity Analyses
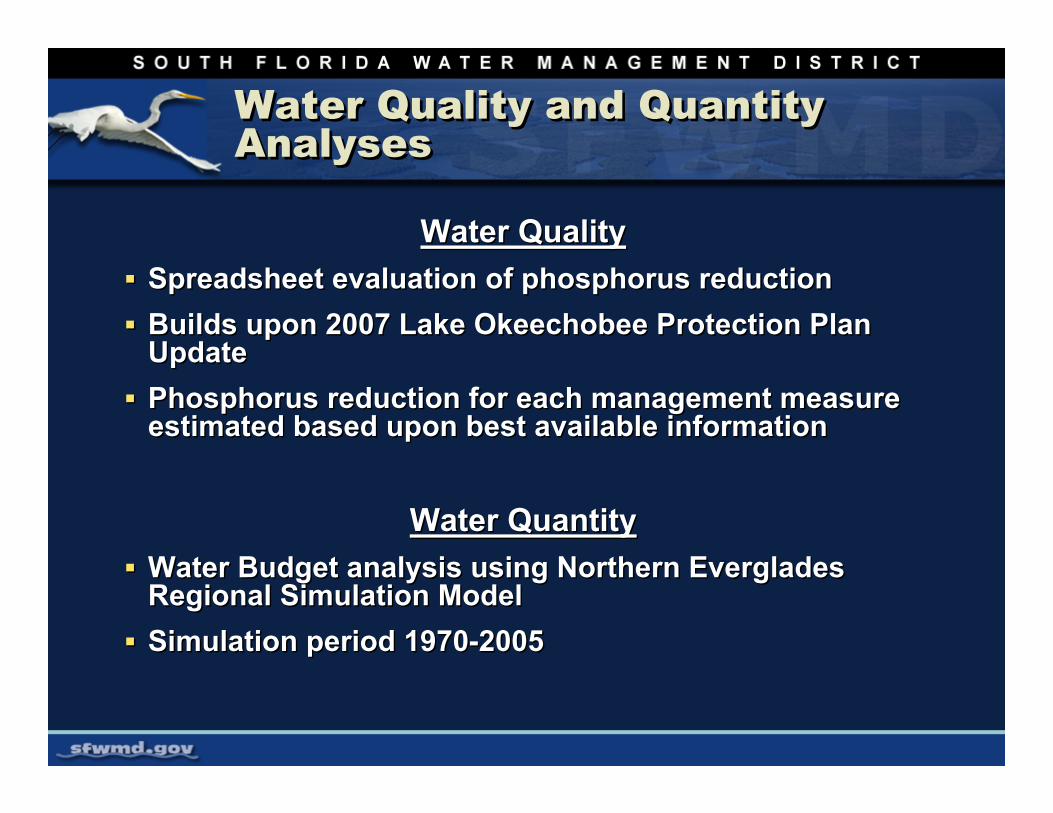
Water QualitySpreadsheet evaluation of phosphorus reductionBuilds upon 2007 Lake Okeechobee Protection Plan Update Phosphorus reduction for each management measure estimated based upon best available information
Water QuantityWater Budget analysis using Northern Everglades Regional Simulation ModelSimulation period 1970-2005
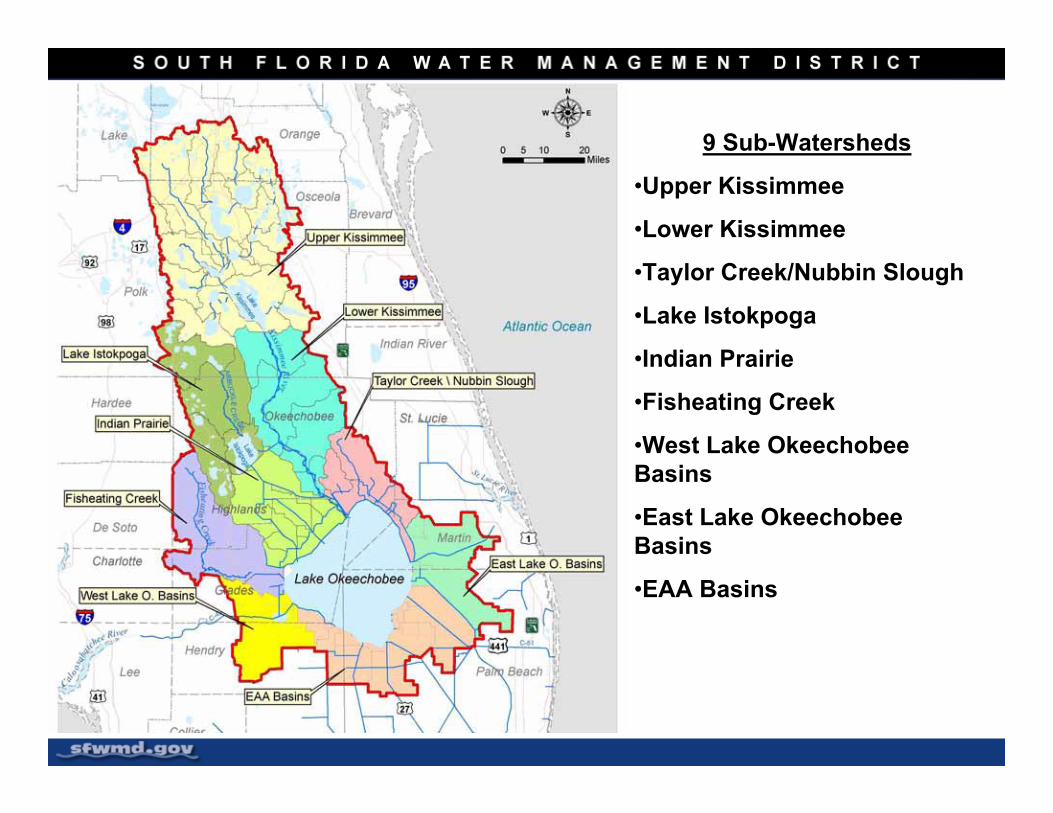
9 Sub-Watersheds
•Upper Kissimmee
•Lower Kissimmee
•Taylor Creek/Nubbin Slough
•Lake Istokpoga
•Indian Prairie
•Fisheating Creek
•West Lake Okeechobee Basins
•East Lake Okeechobee Basins
•EAA Basins
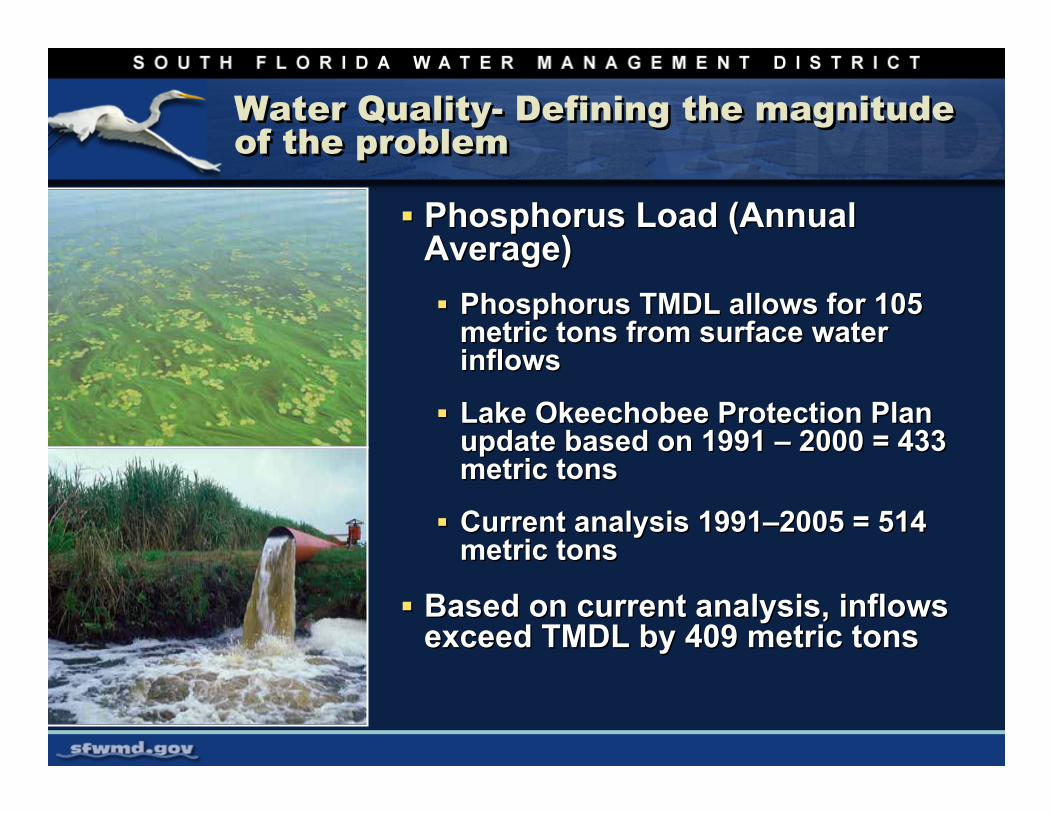
Water Quality- Defining the magnitude of the problemWater Quality- Defining the magnitude of the problem
Phosphorus Load (Annual Average)
Phosphorus TMDL allows for 105 metric tons from surface water inflows
Lake Okeechobee Protection Plan update based on 1991 – 2000 = 433 metric tons
Current analysis 1991–2005 = 514 metric tons
Based on current analysis, inflows exceed TMDL by 409 metric tons
Phosphorus Load (Annual Average)
Phosphorus TMDL allows for 105 metric tons from surface water inflows
Lake Okeechobee Protection Plan update based on 1991 – 2000 = 433 metric tons
Current analysis 1991–2005 = 514 metric tons
Based on current analysis, inflows exceed TMDL by 409 metric tons
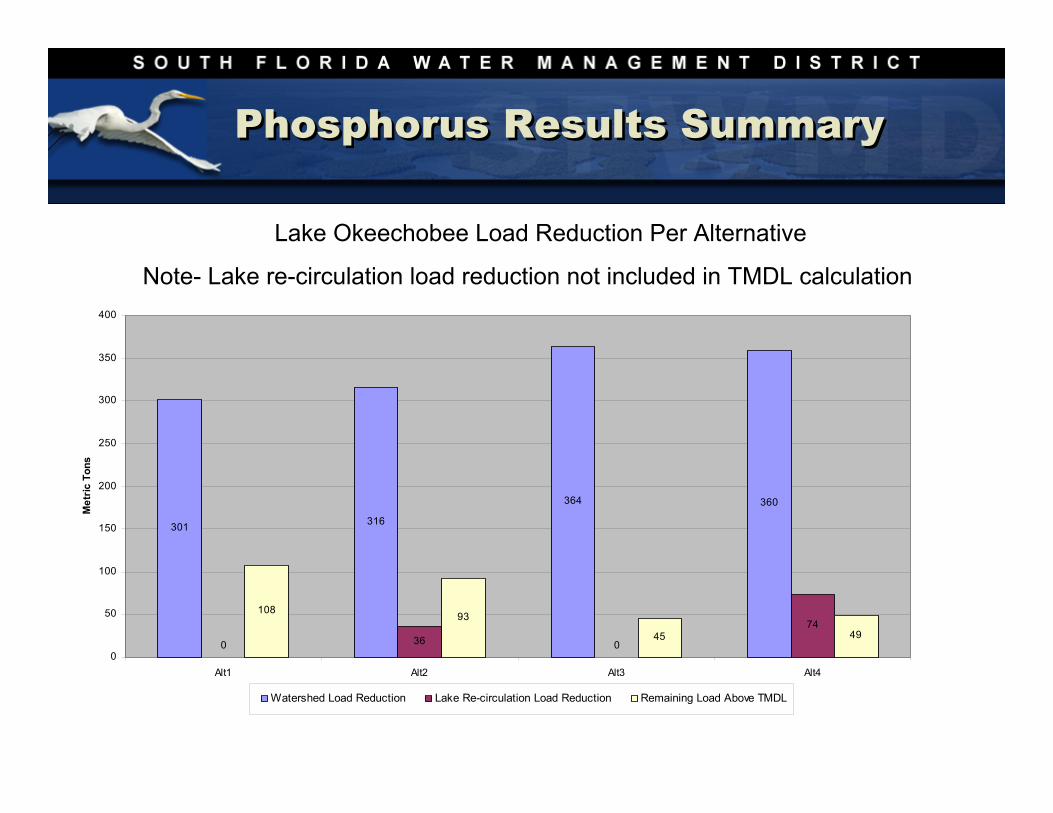
Phosphorus Results SummaryPhosphorus Results Summary
Lake Okeechobee Load Reduction Per Alternative
Note- Lake re-circulation load reduction not included in TMDL calculation
301 316
364 360
0 36 0
74108 93
45 49
0
50
100
150
200
250
300
350
400
Alt1 Alt2 Alt3 Alt4
Met
ric T
ons
Watershed Load Reduction Lake Re-circulation Load Reduction Remaining Load Above TMDL
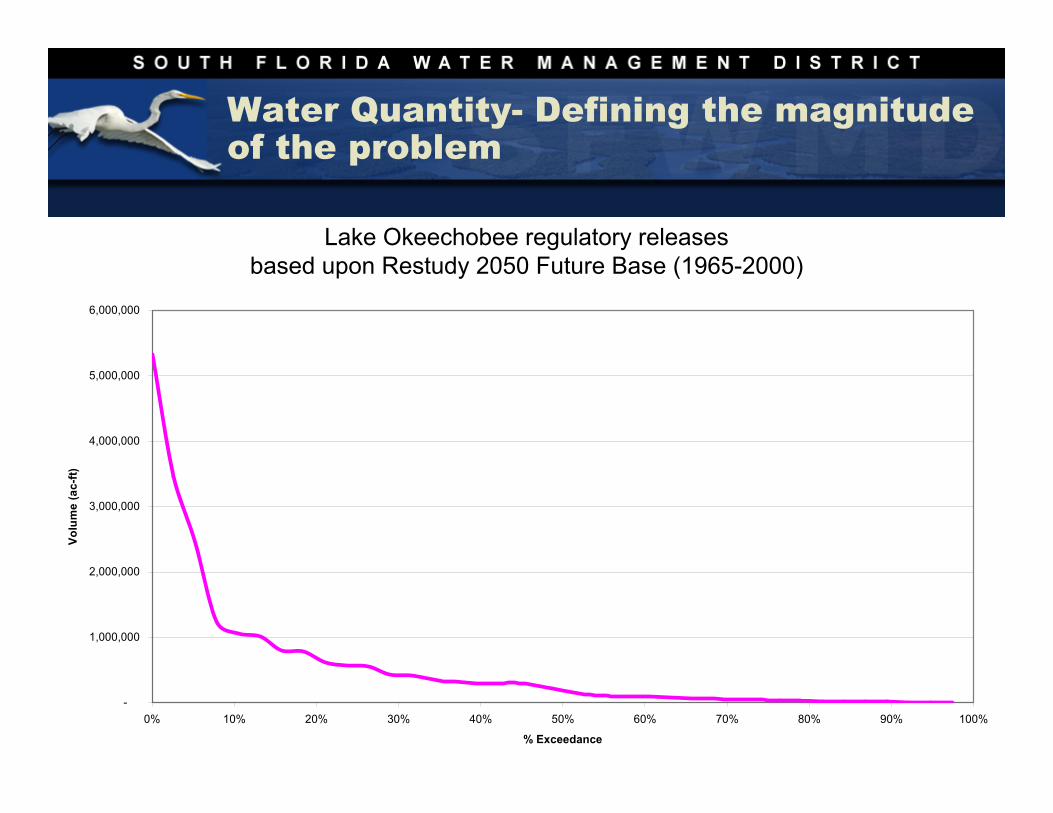
Water Quantity- Defining the magnitude of the problem
-
1,000,000
2,000,000
3,000,000
4,000,000
5,000,000
6,000,000
0% 10% 20% 30% 40% 50% 60% 70% 80% 90% 100%
% Exceedance
Volu
me
(ac-
ft)
Lake Okeechobee regulatory releases based upon Restudy 2050 Future Base (1965-2000)
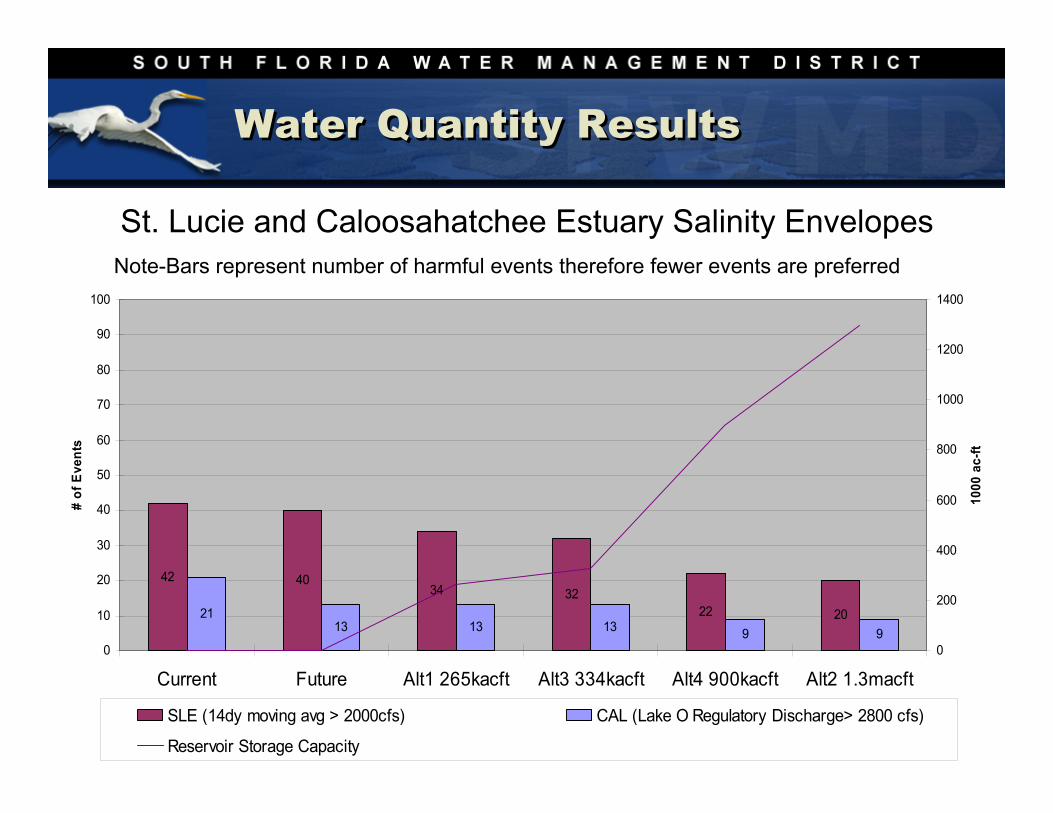
Water Quantity ResultsWater Quantity Results
42 4034 32
22 202113 13 13 9 9
0
10
20
30
40
50
60
70
80
90
100
Current Future Alt1 265kacft Alt3 334kacft Alt4 900kacft Alt2 1.3macft
# of
Eve
nts
0
200
400
600
800
1000
1200
1400
1000
ac-
ft
SLE (14dy moving avg > 2000cfs) CAL (Lake O Regulatory Discharge> 2800 cfs)
Reservoir Storage Capacity
St. Lucie and Caloosahatchee Estuary Salinity EnvelopesNote-Bars represent number of harmful events therefore fewer events are preferred
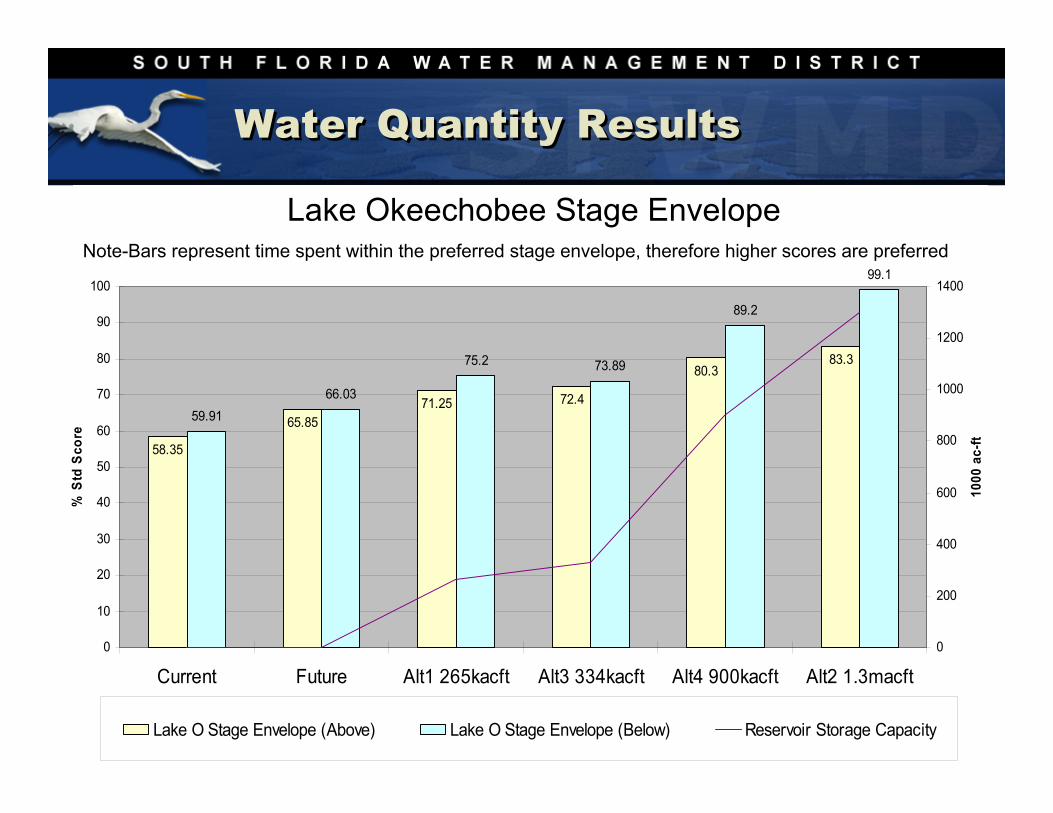
Water Quantity ResultsWater Quantity Results
58.35
65.8571.25 72.4
80.383.3
59.9166.03
75.2 73.89
89.2
99.1
0
10
20
30
40
50
60
70
80
90
100
Current Future Alt1 265kacft Alt3 334kacft Alt4 900kacft Alt2 1.3macft
% S
td S
core
0
200
400
600
800
1000
1200
1400
1000
ac-
ft
Lake O Stage Envelope (Above) Lake O Stage Envelope (Below) Reservoir Storage Capacity
Lake Okeechobee Stage EnvelopeNote-Bars represent time spent within the preferred stage envelope, therefore higher scores are preferred
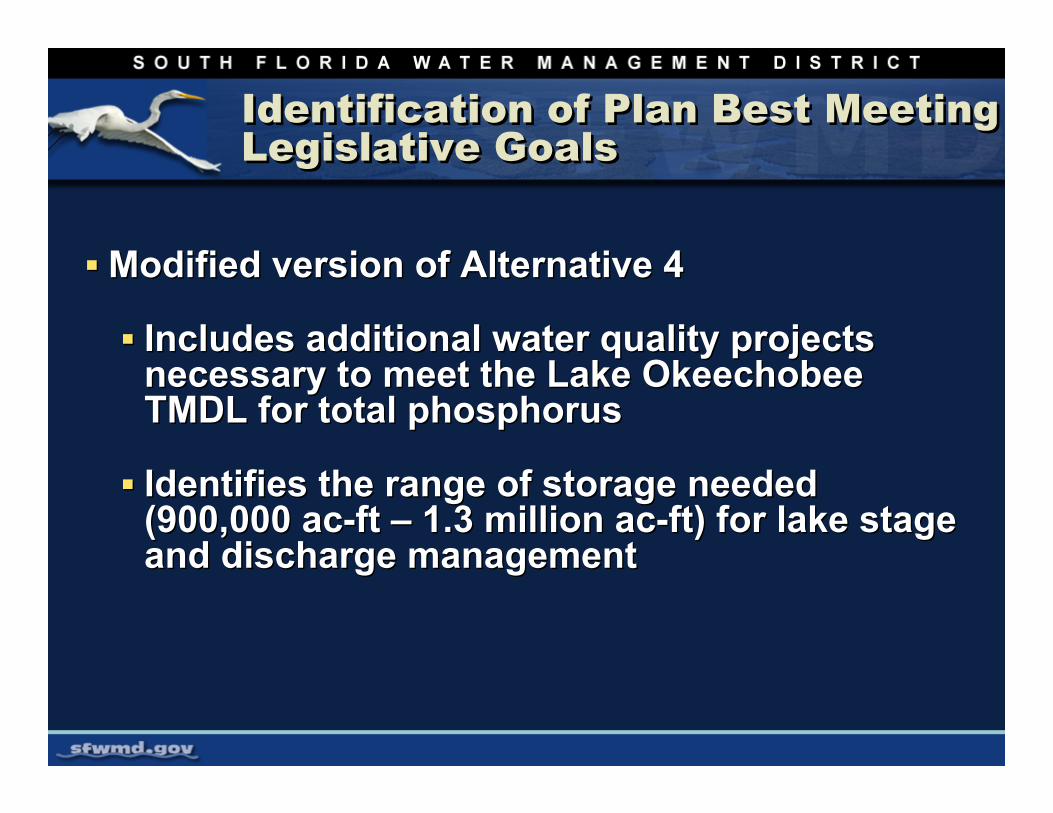
Identification of Plan Best Meeting Legislative GoalsIdentification of Plan Best Meeting Legislative Goals
Modified version of Alternative 4
Includes additional water quality projects necessary to meet the Lake Okeechobee TMDL for total phosphorus
Identifies the range of storage needed (900,000 ac-ft – 1.3 million ac-ft) for lake stage and discharge management
Modified version of Alternative 4
Includes additional water quality projects necessary to meet the Lake Okeechobee TMDL for total phosphorus
Identifies the range of storage needed (900,000 ac-ft – 1.3 million ac-ft) for lake stage and discharge management
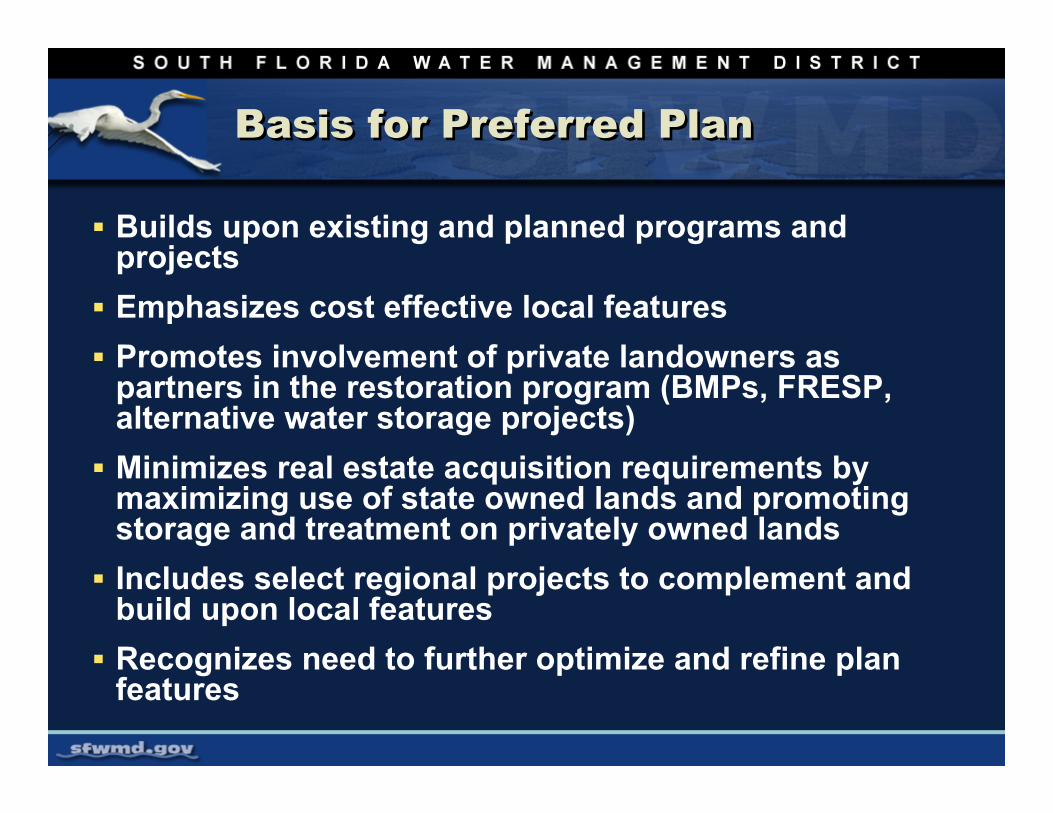
Basis for Preferred Plan Basis for Preferred Plan
Builds upon existing and planned programs and projects Emphasizes cost effective local featuresPromotes involvement of private landowners as partners in the restoration program (BMPs, FRESP, alternative water storage projects)Minimizes real estate acquisition requirements by maximizing use of state owned lands and promoting storage and treatment on privately owned landsIncludes select regional projects to complement and build upon local featuresRecognizes need to further optimize and refine plan features
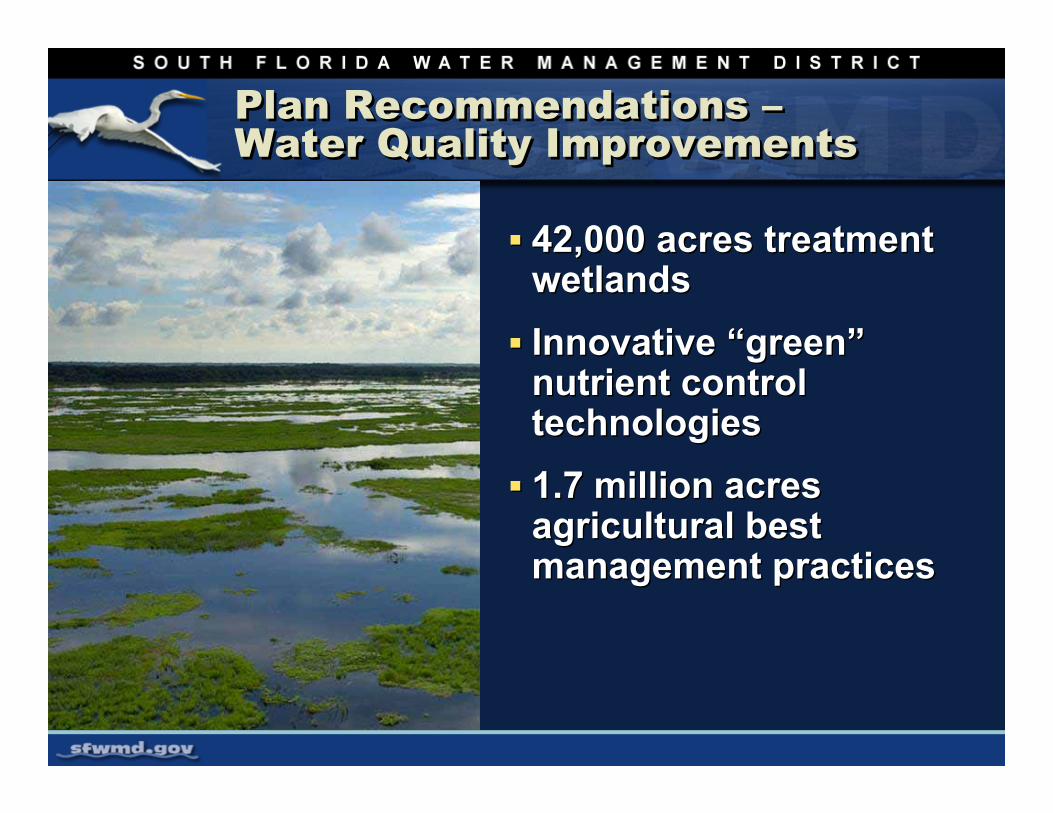
Plan Recommendations –Water Quality Improvements Plan Recommendations –Water Quality Improvements
42,000 acres treatment wetlands Innovative “green”nutrient control technologies 1.7 million acres agricultural best management practices
42,000 acres treatment wetlands Innovative “green”nutrient control technologies 1.7 million acres agricultural best management practices
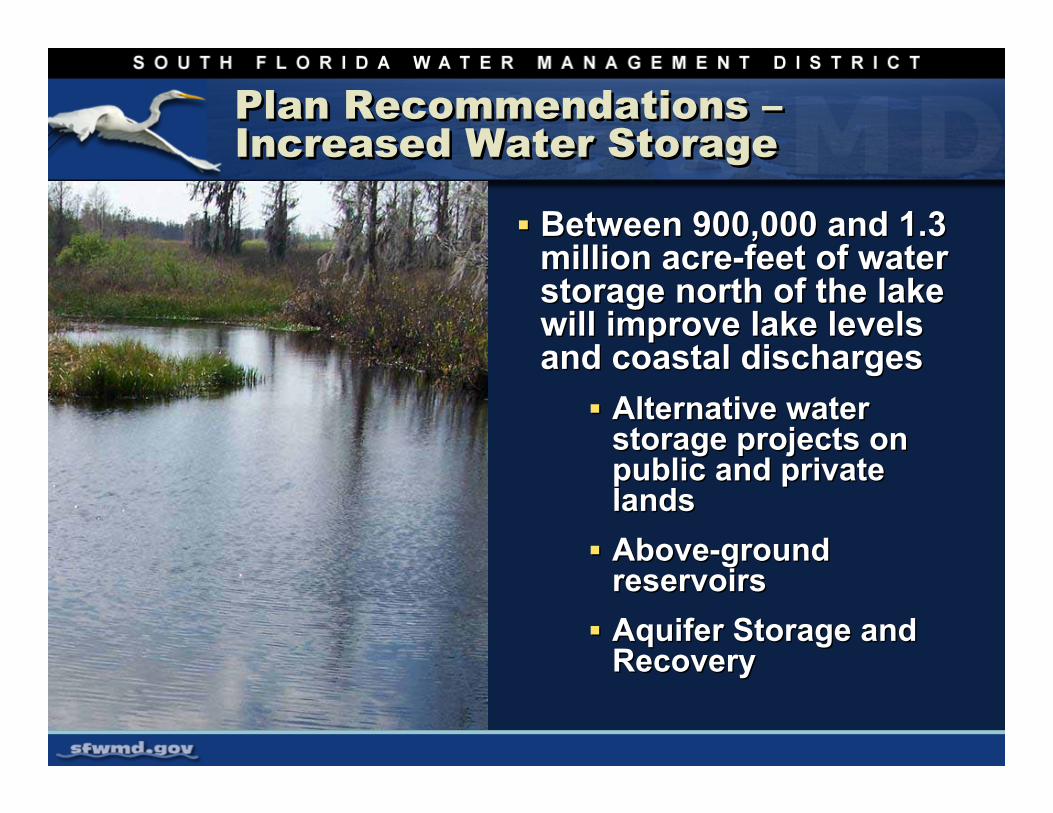
Plan Recommendations –Increased Water StoragePlan Recommendations –Increased Water Storage
Between 900,000 and 1.3 million acre-feet of water storage north of the lake will improve lake levels and coastal discharges
Alternative water storage projects on public and private lands Above-ground reservoirsAquifer Storage and Recovery
Between 900,000 and 1.3 million acre-feet of water storage north of the lake will improve lake levels and coastal discharges
Alternative water storage projects on public and private lands Above-ground reservoirsAquifer Storage and Recovery
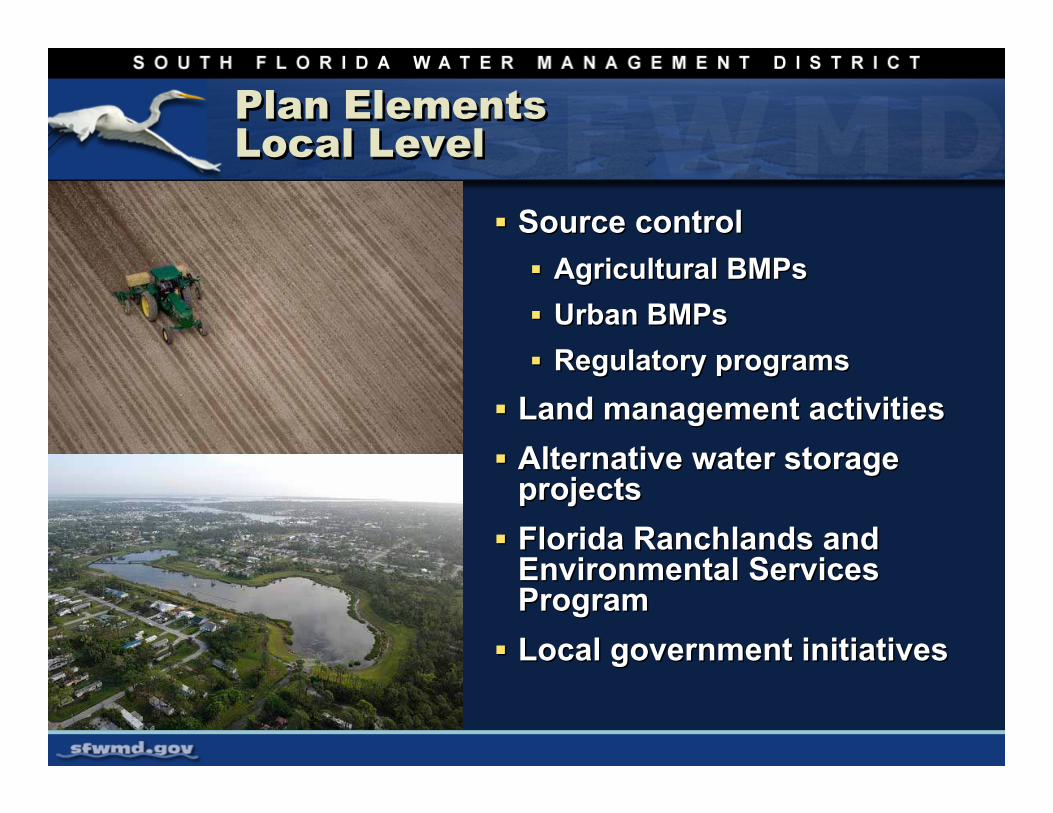
Plan Elements Local LevelPlan Elements Local Level
Source control Agricultural BMPsUrban BMPs Regulatory programs
Land management activitiesAlternative water storage projectsFlorida Ranchlands and Environmental Services ProgramLocal government initiatives
Source control Agricultural BMPsUrban BMPs Regulatory programs
Land management activitiesAlternative water storage projectsFlorida Ranchlands and Environmental Services ProgramLocal government initiatives
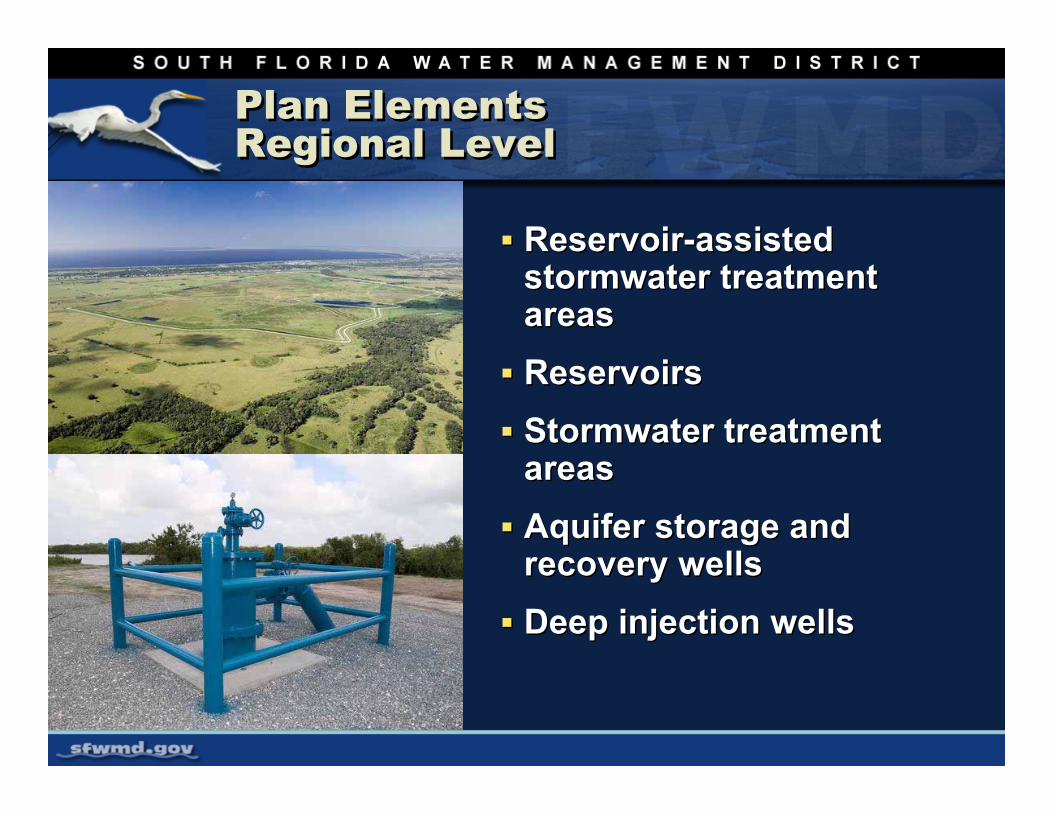
Plan ElementsRegional LevelPlan ElementsRegional Level
Reservoir-assisted stormwater treatment areas ReservoirsStormwater treatment areas Aquifer storage and recovery wellsDeep injection wells
Reservoir-assisted stormwater treatment areas ReservoirsStormwater treatment areas Aquifer storage and recovery wellsDeep injection wells
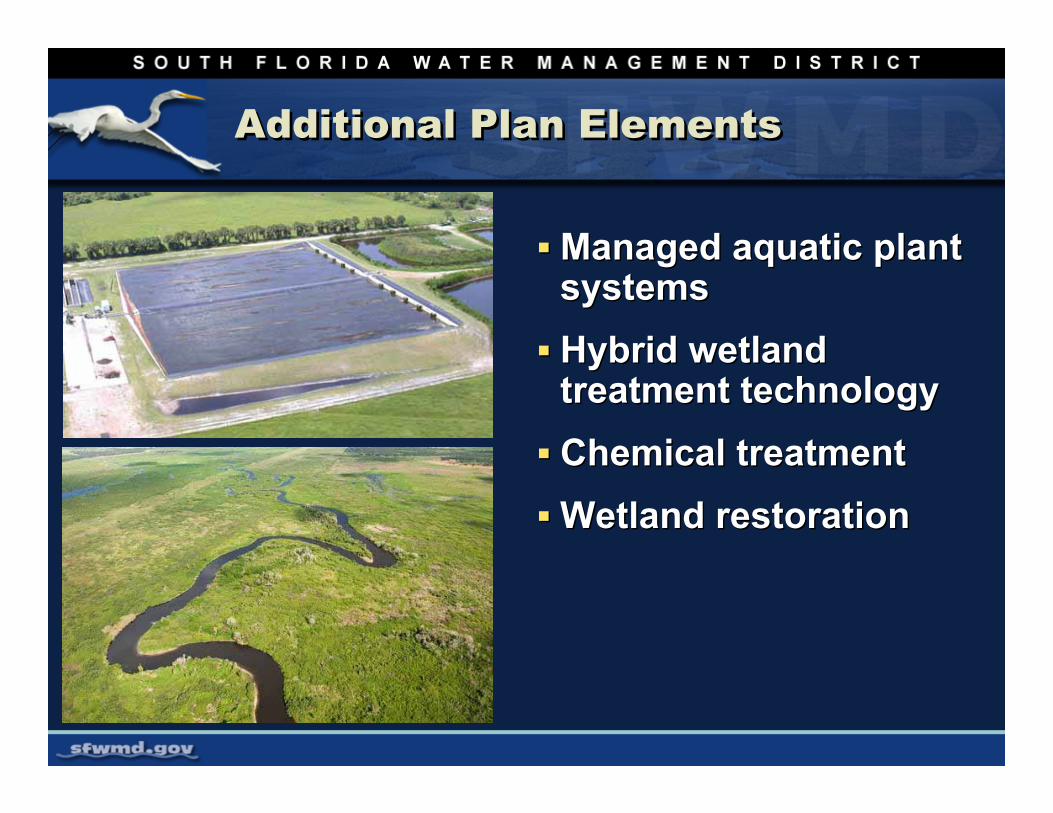
Additional Plan ElementsAdditional Plan Elements
Managed aquatic plant systemsHybrid wetland treatment technologyChemical treatmentWetland restoration
Managed aquatic plant systemsHybrid wetland treatment technologyChemical treatmentWetland restoration
Plan Implementation StrategyPlan Implementation Strategy
Multiple StagesInitial Implementation Stage- projects initiated 2008-2010Mid Term Implementation Stage-projects initiated 2011-2015Long Term Implementation Stage-projects initiated beyond 2015
Multiple StagesInitial Implementation Stage- projects initiated 2008-2010Mid Term Implementation Stage-projects initiated 2011-2015Long Term Implementation Stage-projects initiated beyond 2015
Initial Implementation StageInitial Implementation Stage
Non-CERP Cost= $260-320 MillionCERP Cost= $1-1.4 Billion
Costs are in 2007 dollarsCERP costs are eligible for 50 percent cost share with the federal governmentLOER projects included in CERP cost are eligible for federal cost share, however those funds will be needed in advance of the CERP project from State and SFWMD sourcesCosts do not include dollars that have already been expended to dateCosts include the full cost to build a project completely even if construction period goes beyond the initial implementation stage
QuestionsQuestions


