
Lake (limnic) ecosystems Origins and classifications Lakes as open systems Light and temperature Lake chemistry Primary productivity Secondary productivity Lake evolution Perturbations

Lake classification: geological origin
Lakes result from impoundment of water by:Lakes result from impoundment of water by:• tectonic downwarping (e.g. Lake Victoria)• tectonic faulting (e.g. Dead Sea)• volcanic eruption (e.g. Crater Lake)• landslide dams• ice dams • biotic dams (e.g. Beaver lake)• glacial erosion (e.g. Lake Peyto)• glacial deposition (e.g. Moraine Lake)• river channel abandonment (e.g. Hatzic Lake)• deflation
Lake classification: morphology
• Lake morphology (size, surface area and depth) largely determined by origin.
• Substrate (rocky, sandy, muddy, organic) initially determined by geological origin; thereafter by inputs.
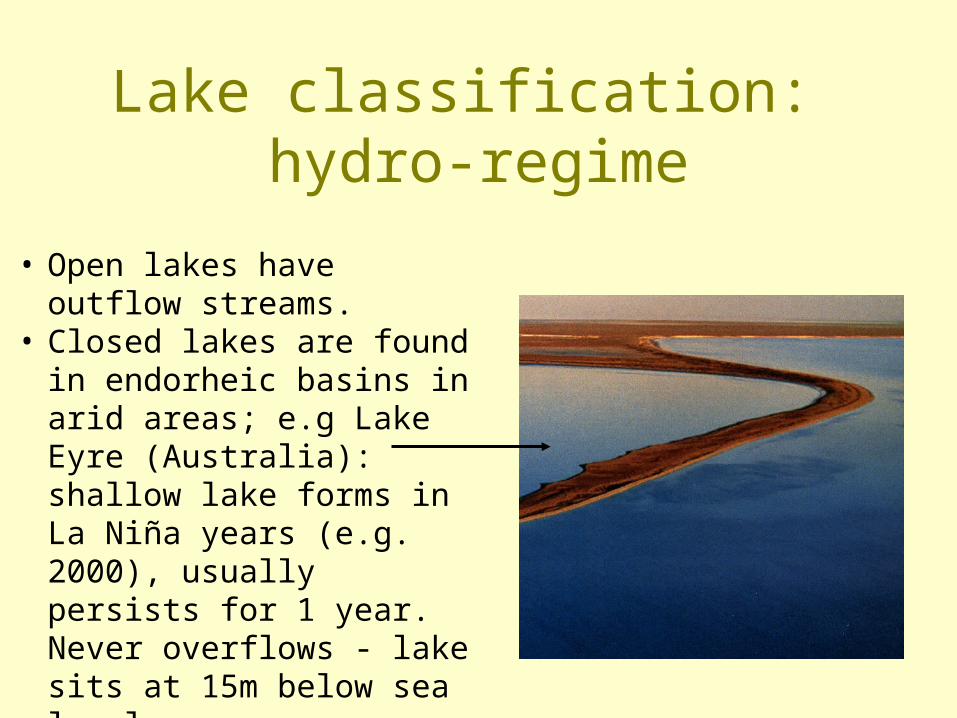
Lake classification: hydro-regime
• Open lakes have outflow streams.
• Closed lakes are found in endorheic basins in arid areas; e.g Lake Eyre (Australia): shallow lake forms in La Niña years (e.g. 2000), usually persists for 1 year. Never overflows - lake sits at 15m below sea level.
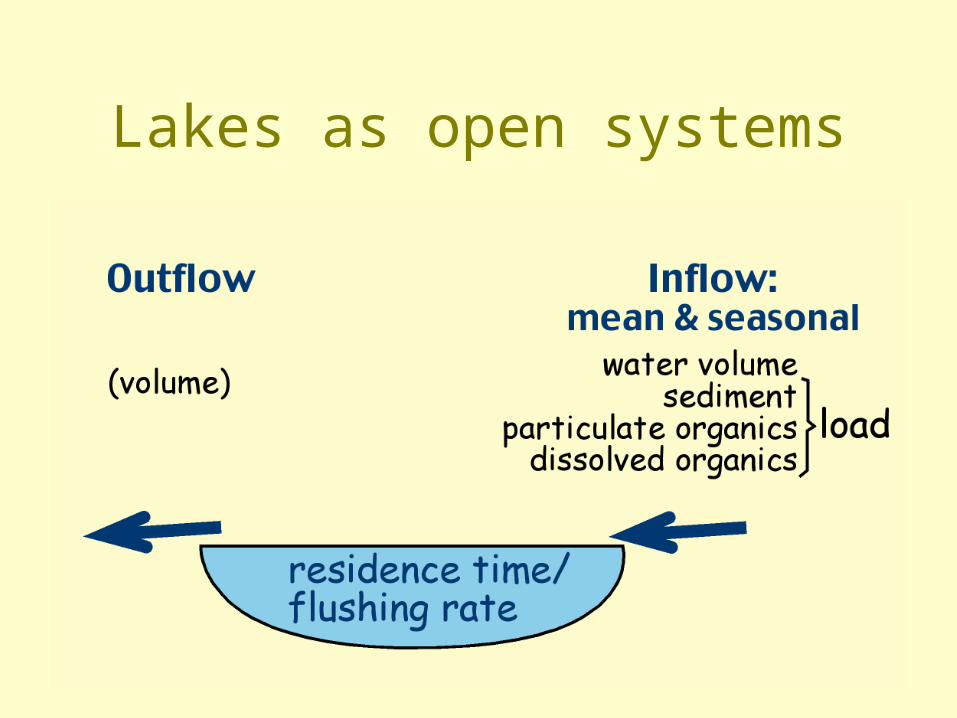
Lakes as open systems
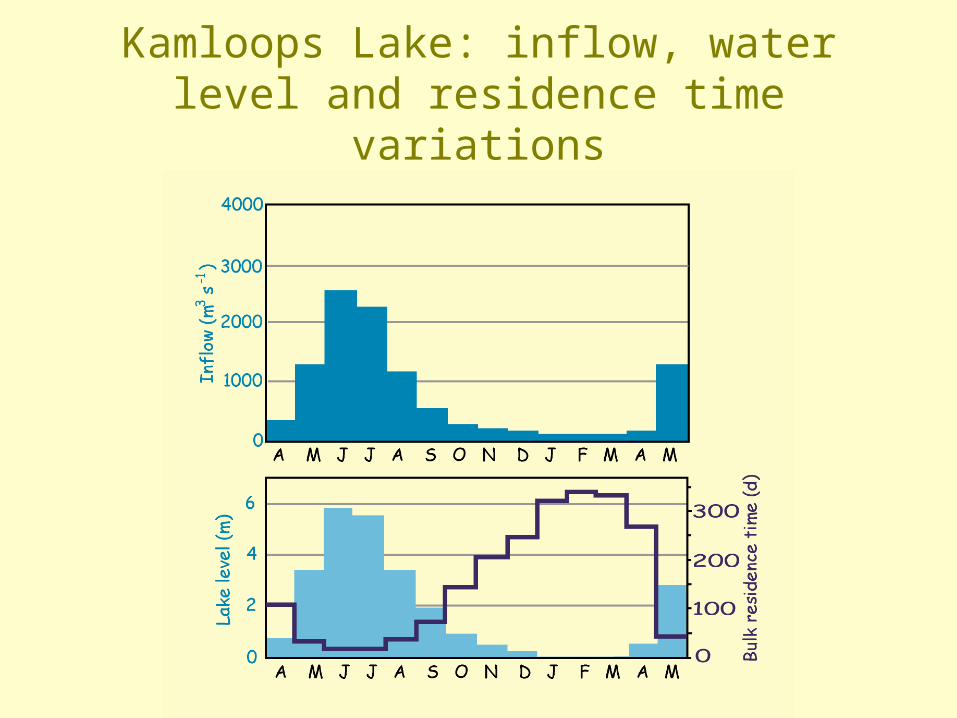
Kamloops Lake: inflow, water level and residence time variations

Thermal stratification of lakes: the physical properties of water

Thermal stratification of temperate lakes

Variations in epilimnion depth on windy and calm days
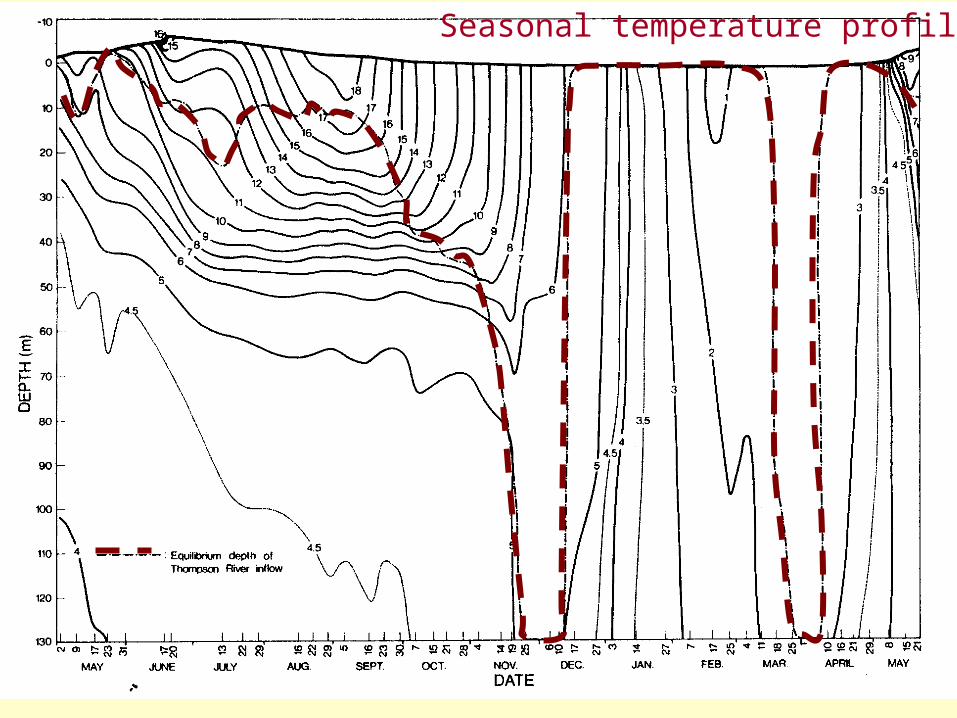
Seasonal temperature profile
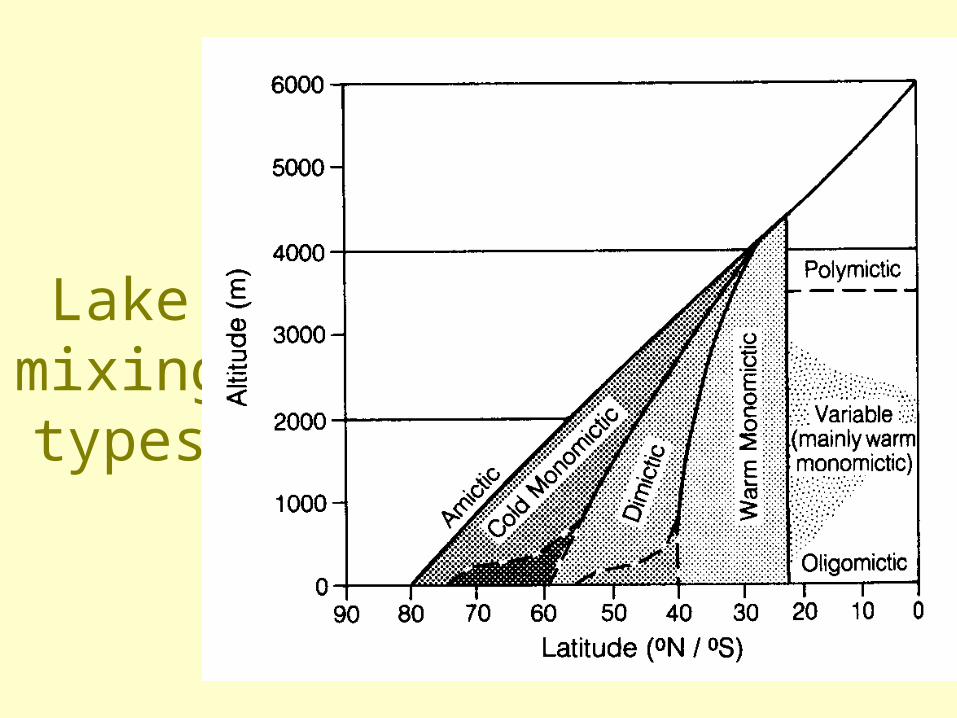
Lake mixing types
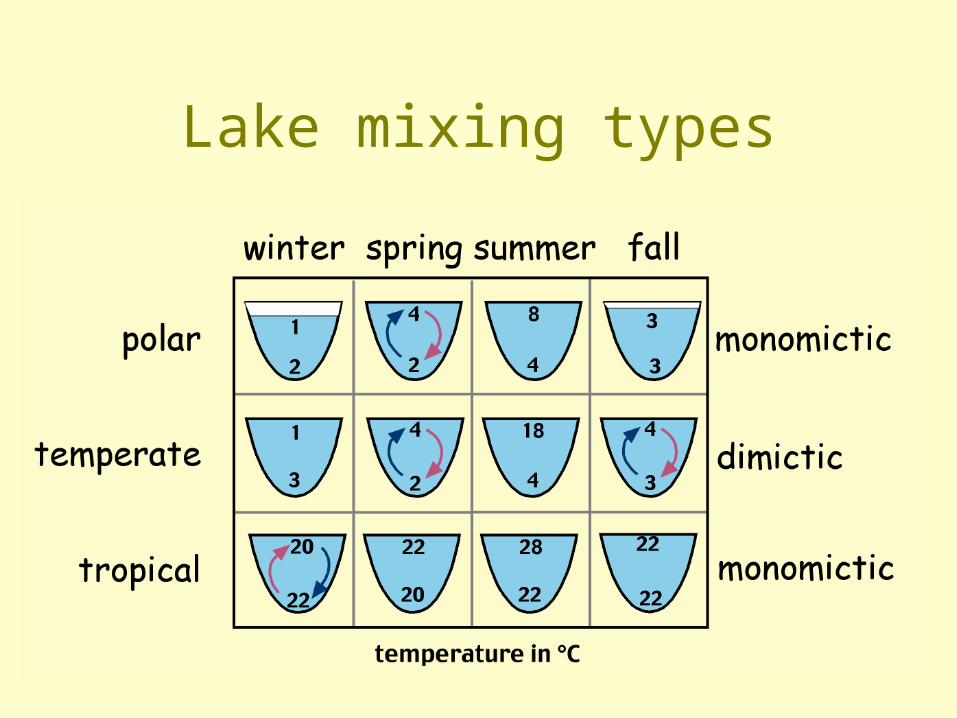
Lake mixing types
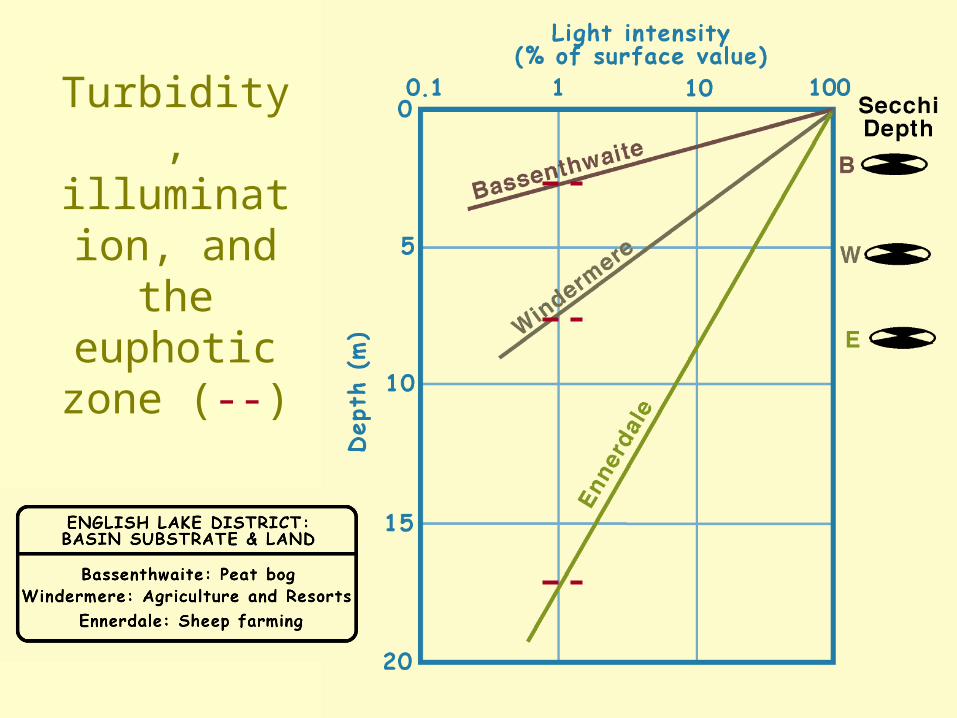
Turbidity, illumination
, and the euphotic zone (--)
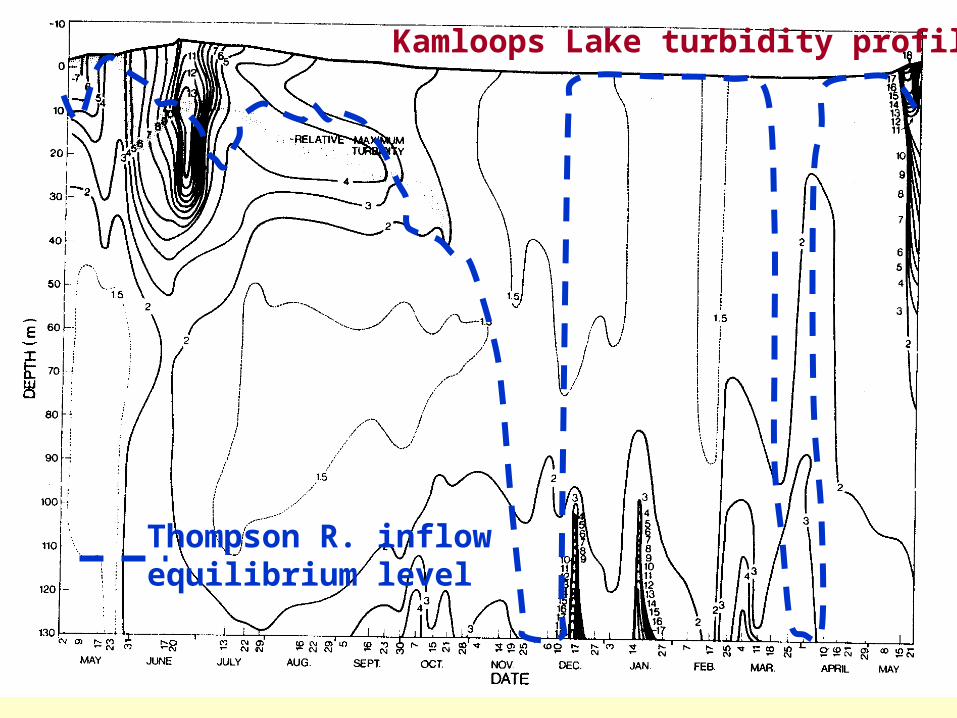
Kamloops Lake turbidity profile
Thompson R. inflowequilibrium level

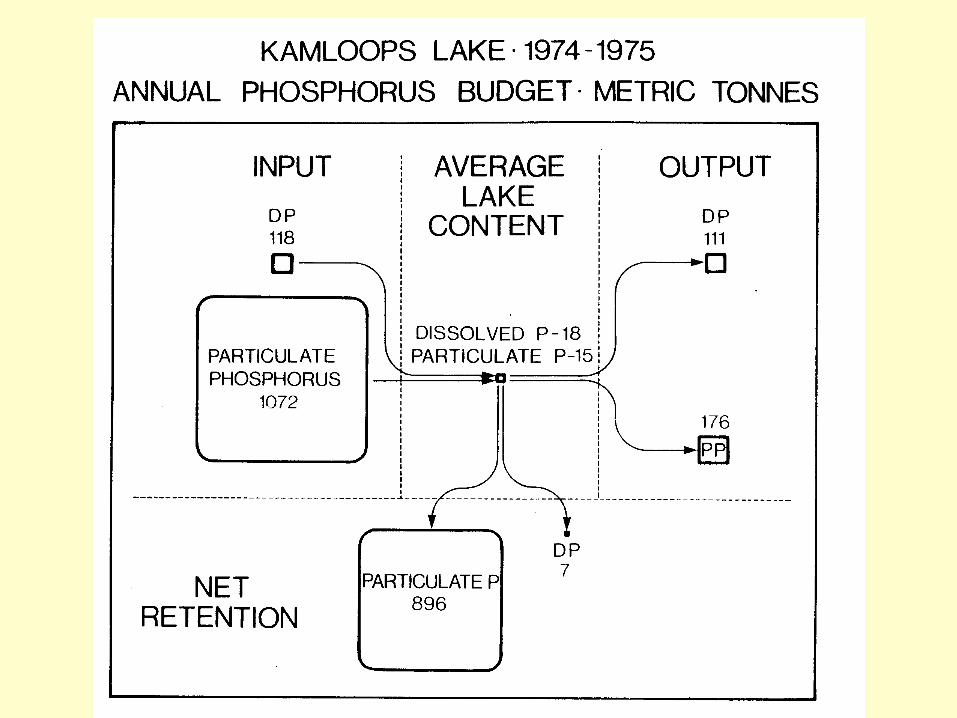
Kamloops Lake:
euphotic zone and epilimnio
n

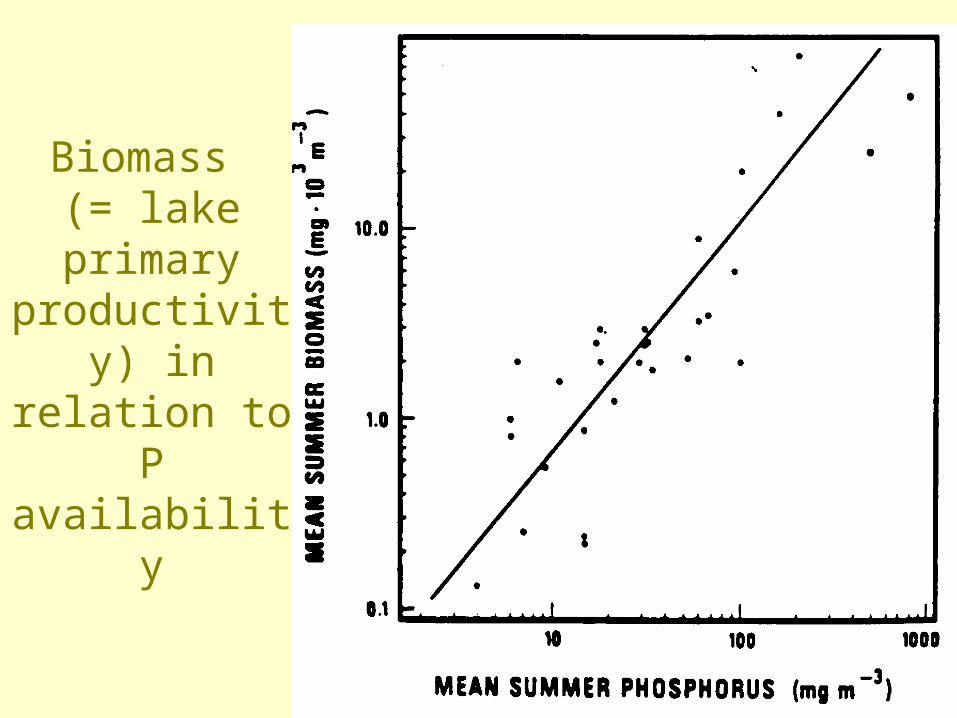
Biomass (= lake primary
productivity) in relation toP availability
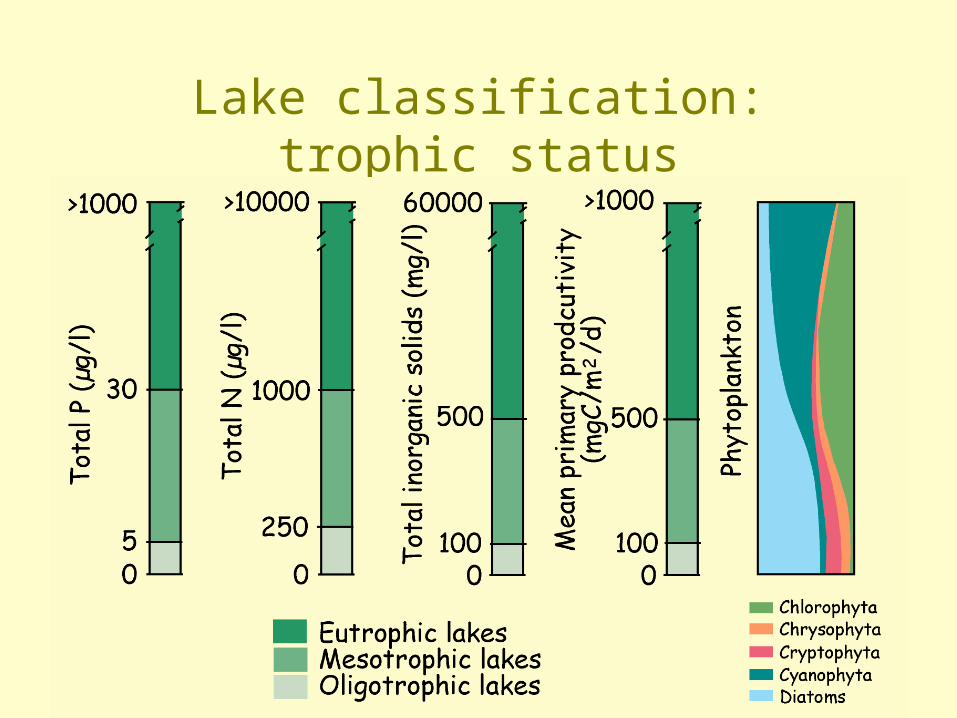
Lake classification: trophic status
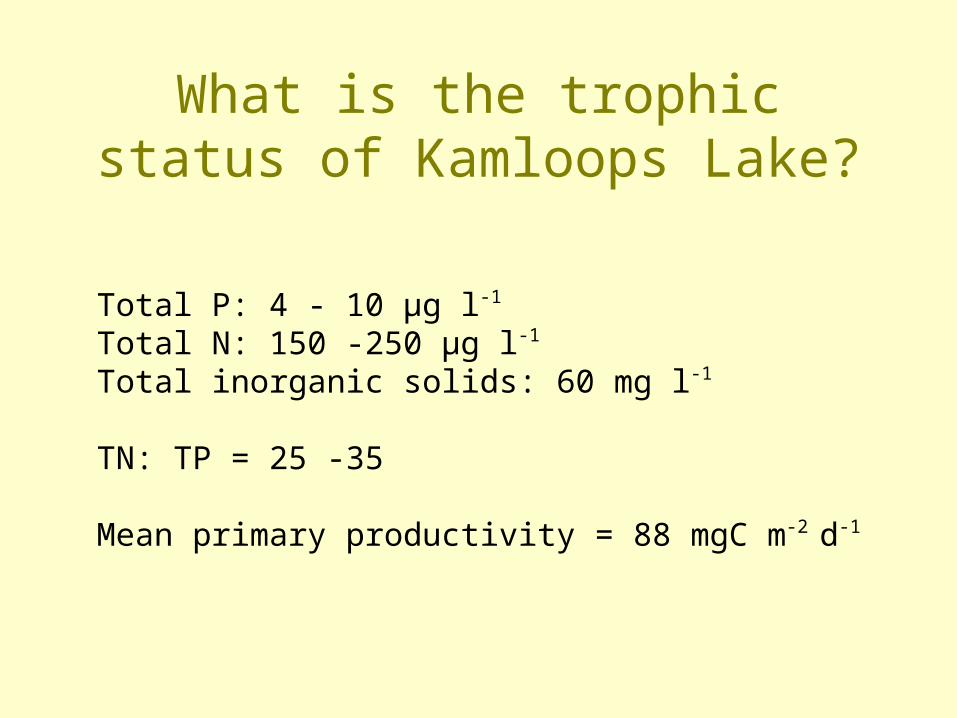
What is the trophic status of Kamloops Lake?
Total P: 4 - 10 µg l-1
Total N: 150 -250 µg l-1
Total inorganic solids: 60 mg l-1
TN: TP = 25 -35
Mean primary productivity = 88 mgC m-2 d-1

Kamloops Lake: relative abundance of phytoplankton
groups

Kamloops Lake: primary productivity
euphotic zone (Aug.)
euphotic zone (May)
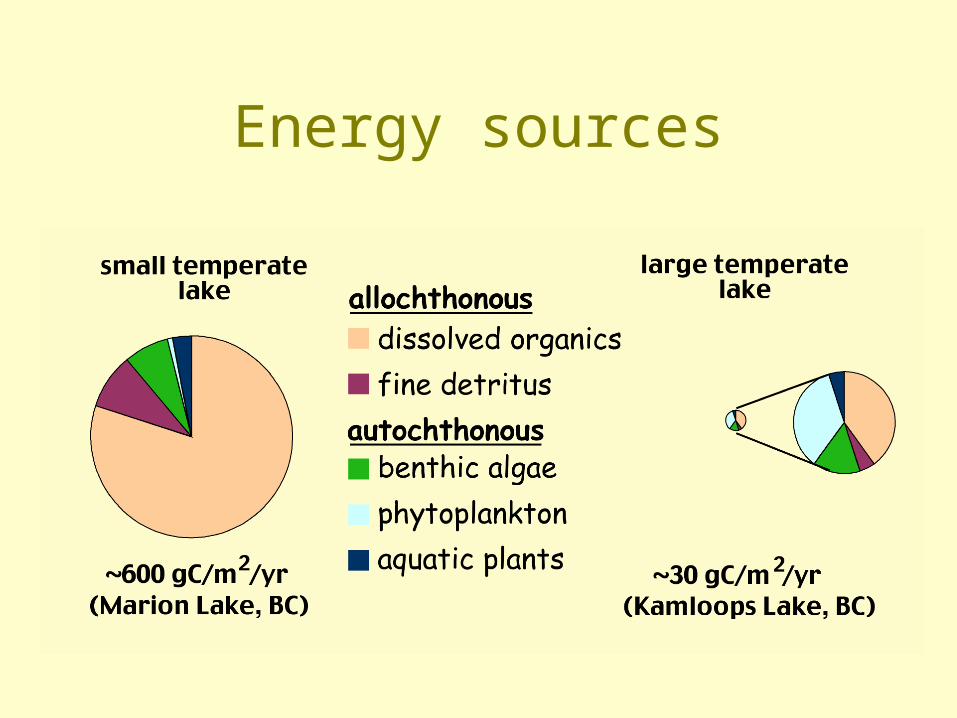
Energy sources

Small temperate
lake fodwebs are
detritus-based
(e.g. Marion Lake).
Predictions for
Kamloops Lake?

Lake environment and community structure
(North American boreal lakes)
Environmental Fish assemblagefactor PIKE BASS MUDMINNOW
Area large -------------------- smallpH high -------------------- lowConductivity high -------------------- lowDepth shallow -- deep -- shallowIsolation low -------------------- high
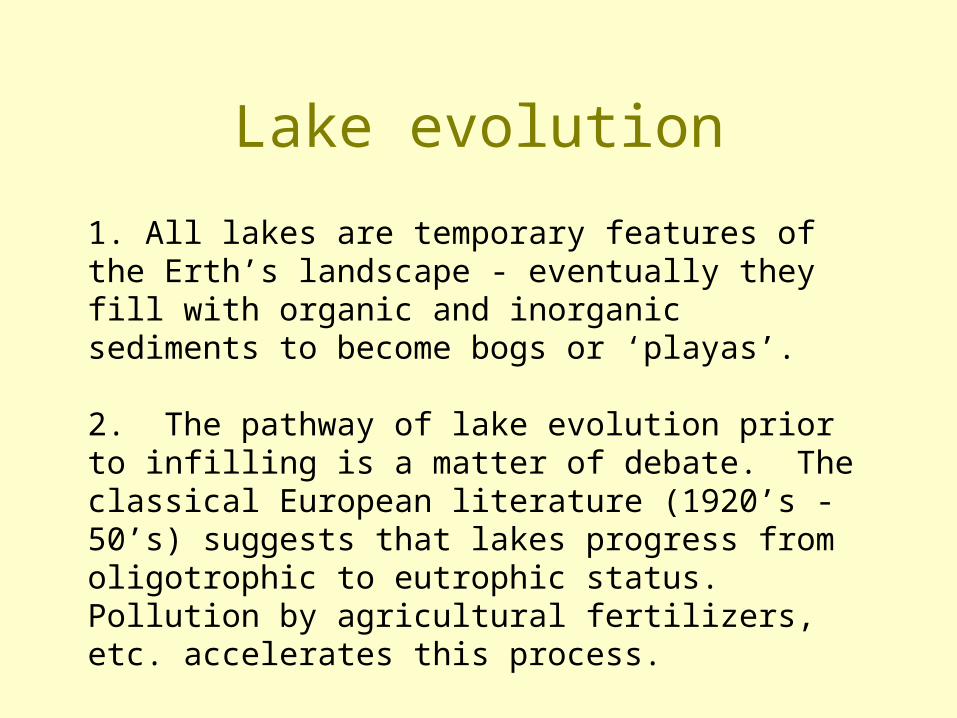
Lake evolution
1. All lakes are temporary features of the Erth’s landscape - eventually they fill with organic and inorganic sediments to become bogs or ‘playas’.
2. The pathway of lake evolution prior to infilling is a matter of debate. The classical European literature (1920’s -50’s) suggests that lakes progress from oligotrophic to eutrophic status. Pollution by agricultural fertilizers, etc. accelerates this process.
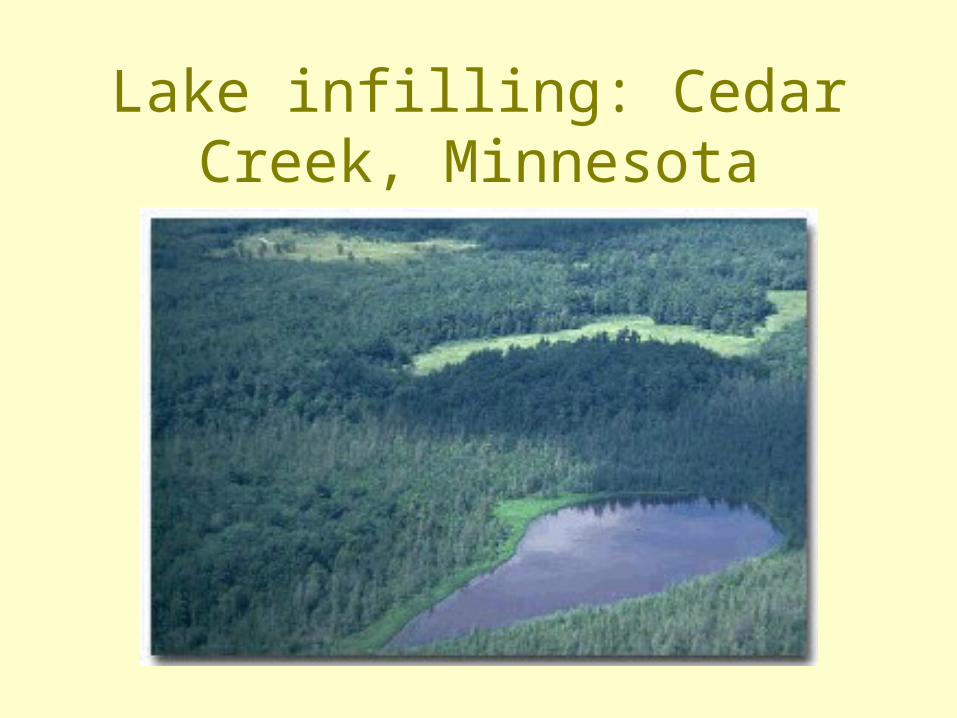
Lake infilling: Cedar Creek, Minnesota
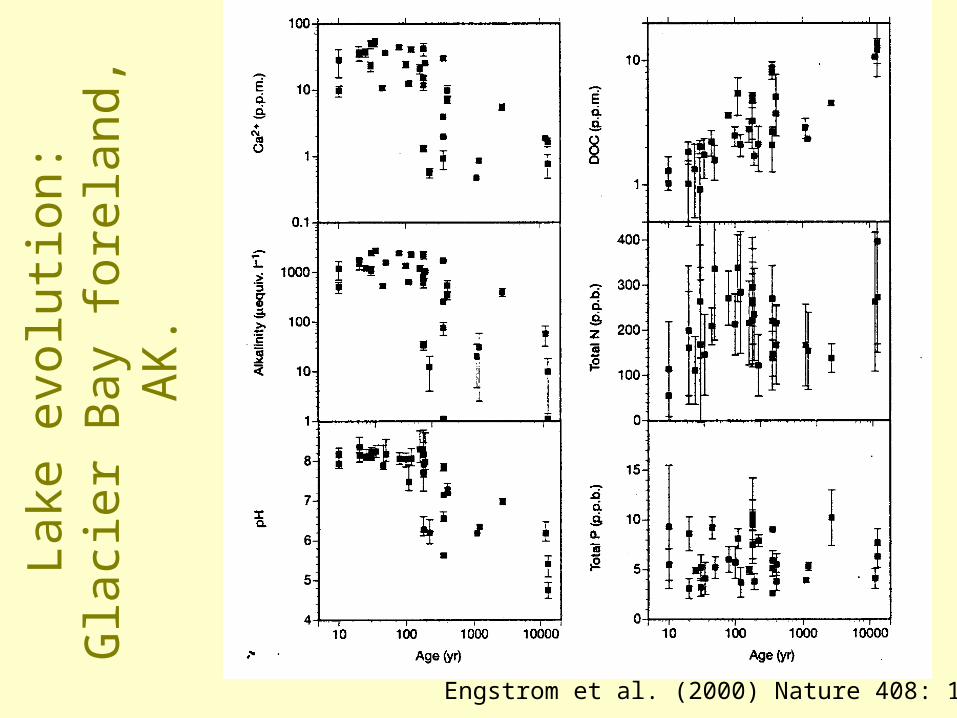
Lake
evolu
tion:
Gla
cier
Bay f
ore
land, A
K.
Engstrom et al. (2000) Nature 408: 161

QuickTime™ and aTIFF (Uncompressed) decompressor
are needed to see this picture.
Str
eam
and lake
evolu
tion:
Gla
cier
Bay f
ore
land, A
K.
Source: Milner et al., 2007, Bioscience, 57, 237-247
Perturbations of lake environments
1. GEOLOGICALlocal events such as landslides;
regional events such as tephra deposition2. CLIMATIC changes in regional climate (precip. or
evap.)3. ANTHROPOGENIC agricultural/industrial/urban pollution4. BIOTIC invasion by exotic species (often
anthropogenic)
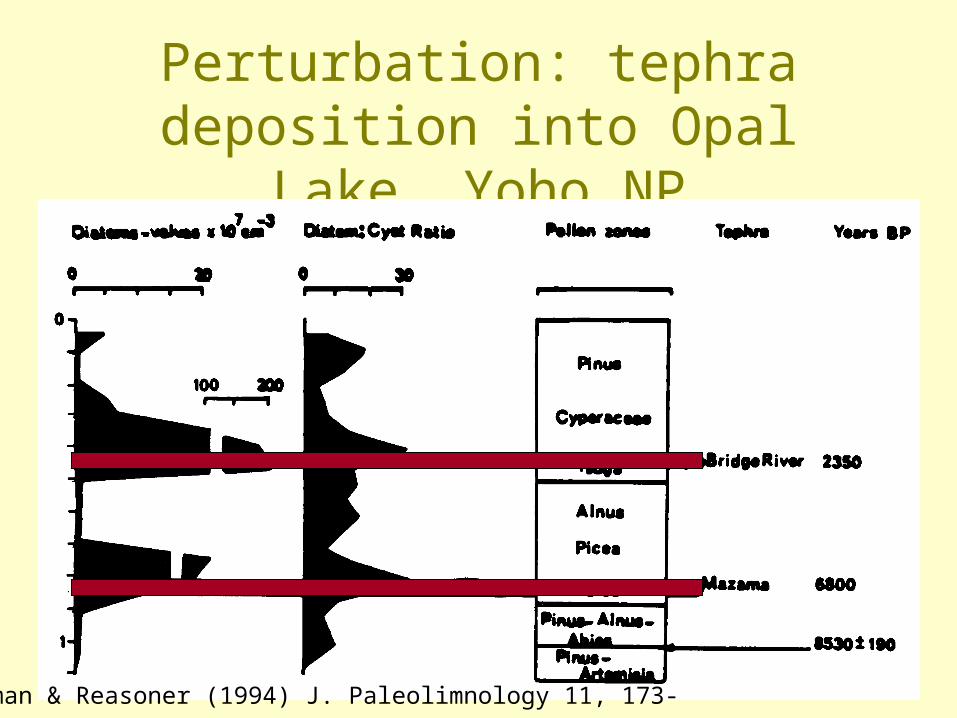
Perturbation: tephra deposition into Opal Lake,
Yoho NP
Hickman & Reasoner (1994) J. Paleolimnology 11, 173-
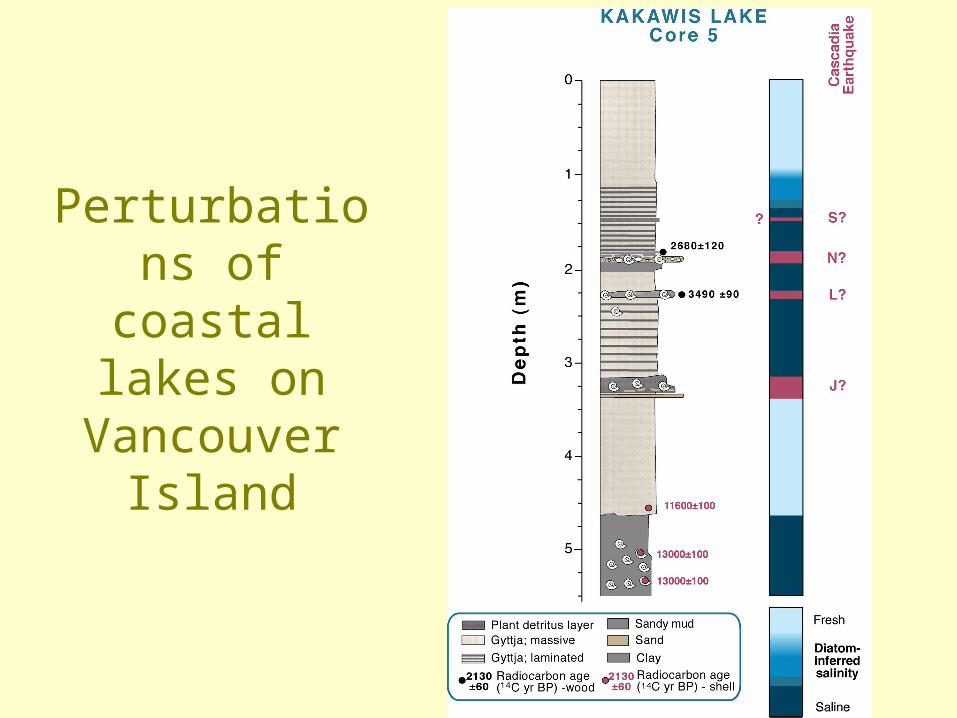
Perturbations of coastal lakes on
Vancouver Island

Reconstructing
perturbations in lake
environments using diatoms as a proxy for
lake chemistry
I: calibration based on 53
lakes in Ontario
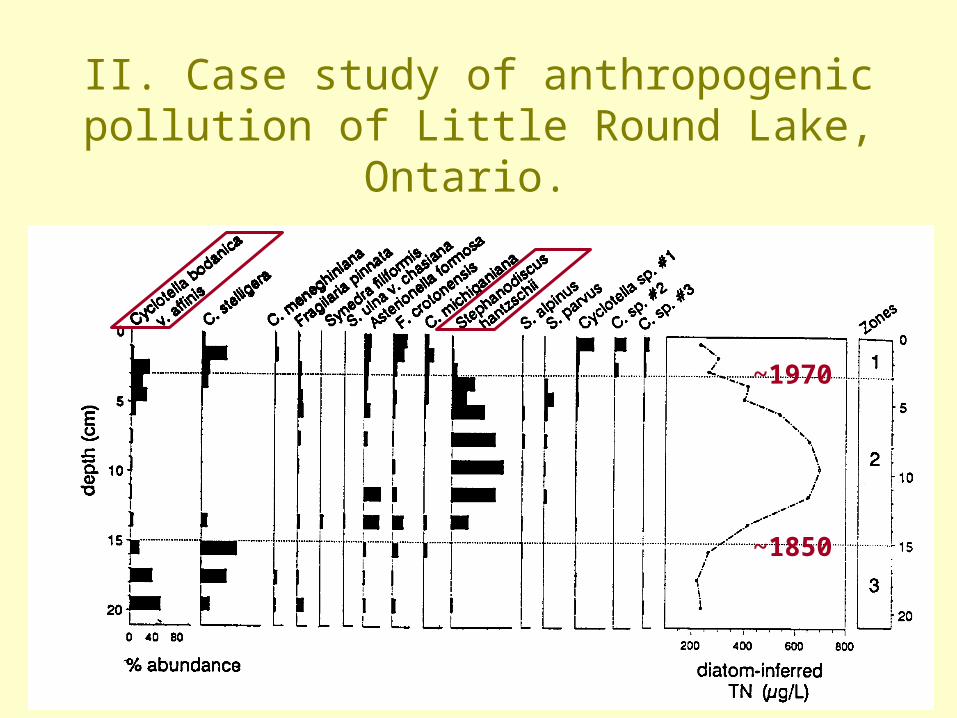
II. Case study of anthropogenic pollution of Little Round Lake,
Ontario.
~1850
~1970
Stream (lotic) ecosystems
Controls on stream ecosystems Discharge regimes and biotic activity Segment/reach analysis Stream foodwebs The river continuum concept Nutrient cycling Patch stability and dynamics

Stream communities
• Physical structure• Flow dynamics
• Community organization
• Community dynamics
Physicalhabitat
Bioticcommunity
Available species pool

Str
eam
cla
ssifi
cati
on

Stream classification
Poff and Ward (1989)Can. J.Fish. & Aquat. Sci. 46, 1805.

Discharge regimes
Poff and Ward (1989)Can. J.Fish. & Aquat. Sci. 46, 1805.
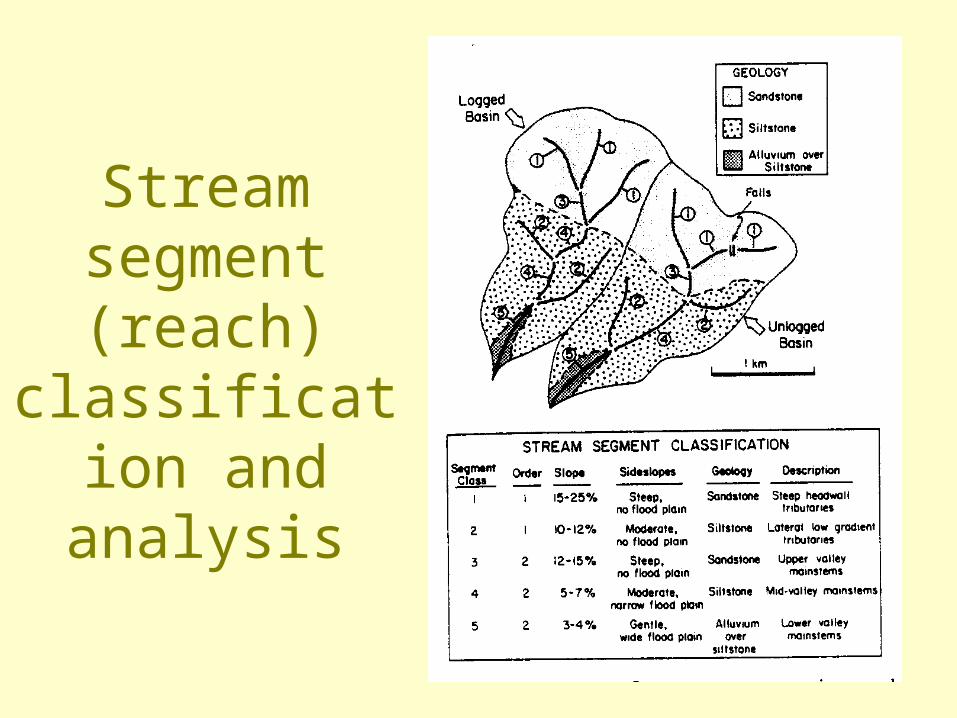
Stream segment (reach)
classification and analysis
Str
eam
food
web
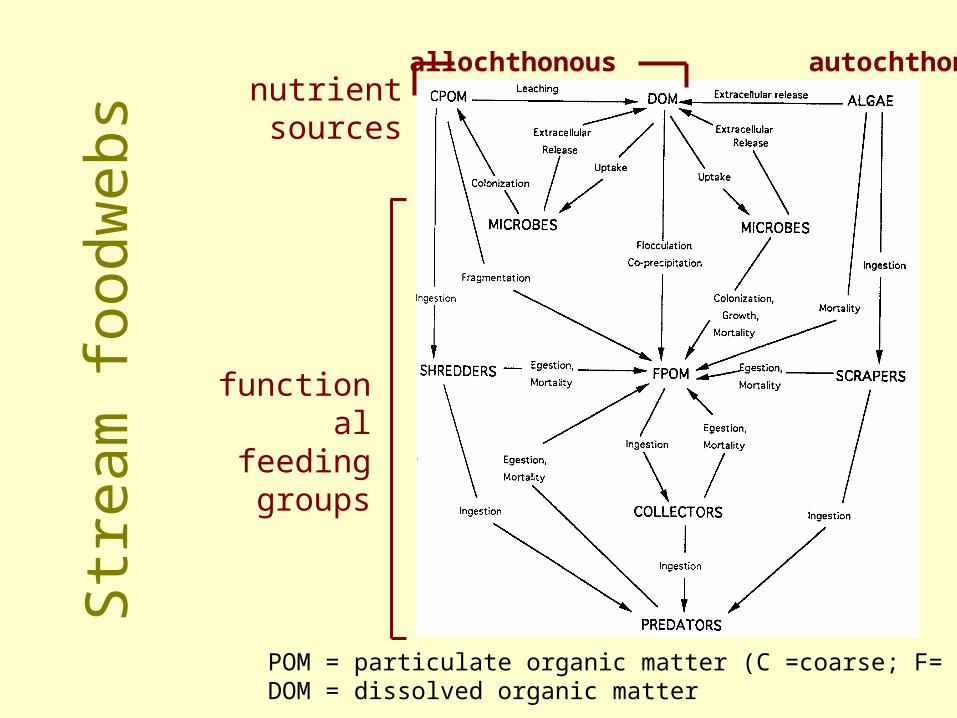
sallochthonous autochthonous
nutrientsources
functional feeding groups
POM = particulate organic matter (C =coarse; F= fine)DOM = dissolved organic matter

River continuum concept
• Continuous physical gradient from headwaters to mouth.
• Consistent biotic patterns of loading, storage and utilization of organic matter.
• Stream communities conform to the mean (most probable) state of the physical system.
• Biotic communities are graded downstream to accommodate leakage of organic matter from upstream.
Vannote et al. (1980) Can. J.Fish. & Aquat. Sci. 37, 130.

RCC parameters

River continuu
m concept
in applicatio
n
Vannote et al. (1980)Can. J.Fish. & Aquat. Sci. 37, 130.

Headwater streams are
heterotrophic (P/R ratio
<<1); downstream reaches are
balanced (P/R ratio ~1)

Alpine-arctic
streams: dominantly autotrophic
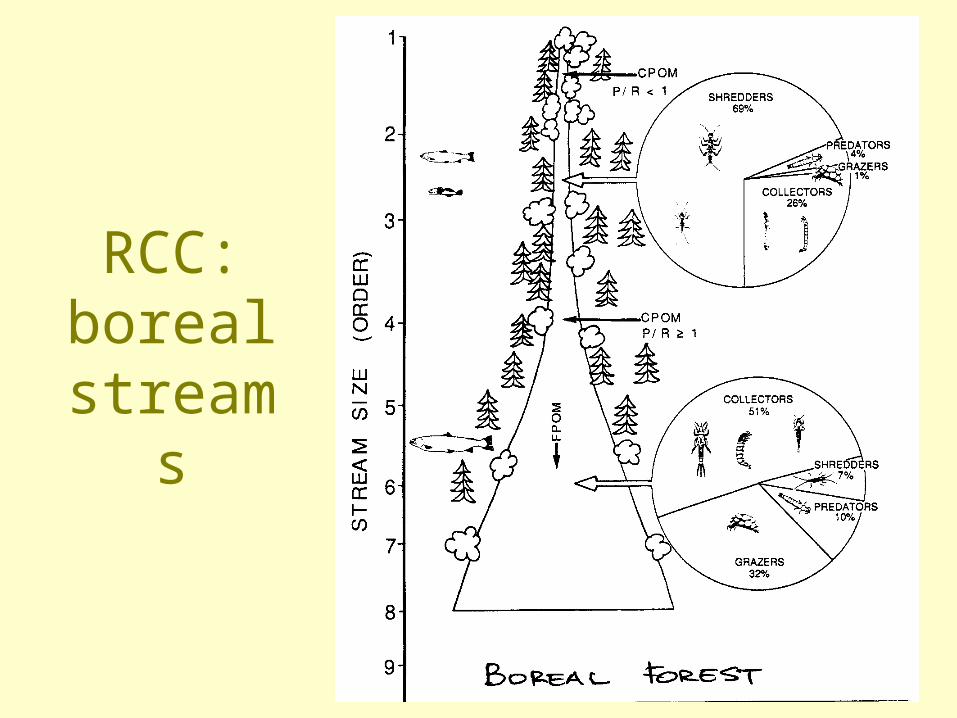
RCC: boreal
streams

RCC: deciduous forest streams

Str
eam
ord
er,
nu
trie
nt
sou
rces
an
d F
FG’s

Stream nutrient cycling dynamics
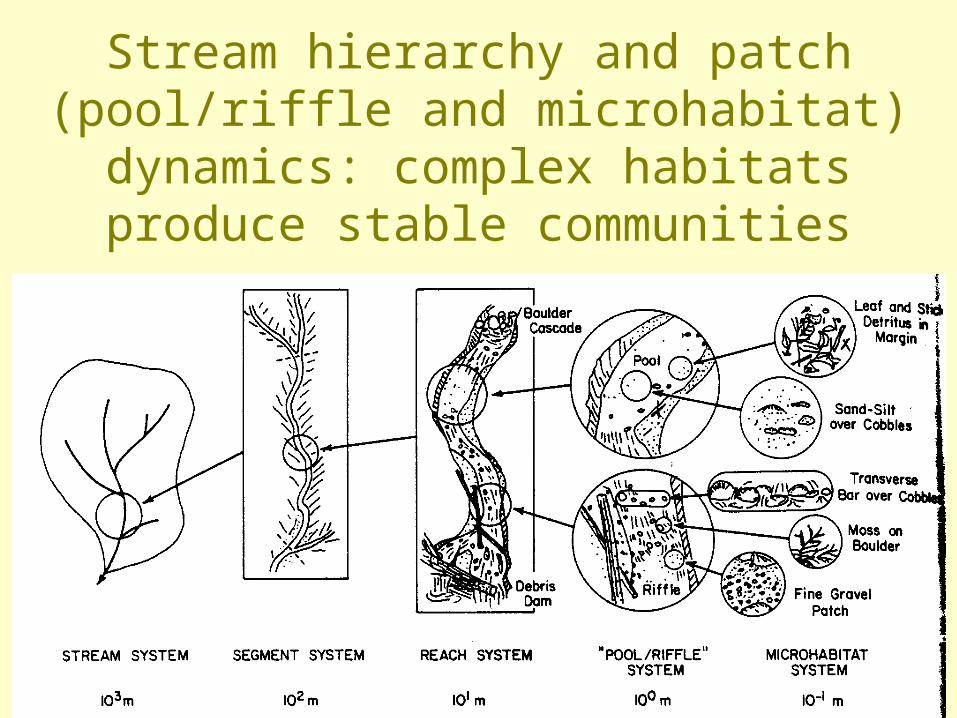
Stream hierarchy and patch (pool/riffle and microhabitat)
dynamics: complex habitats produce stable communities

Pool-riffle sequences and patchy
lotic habitats
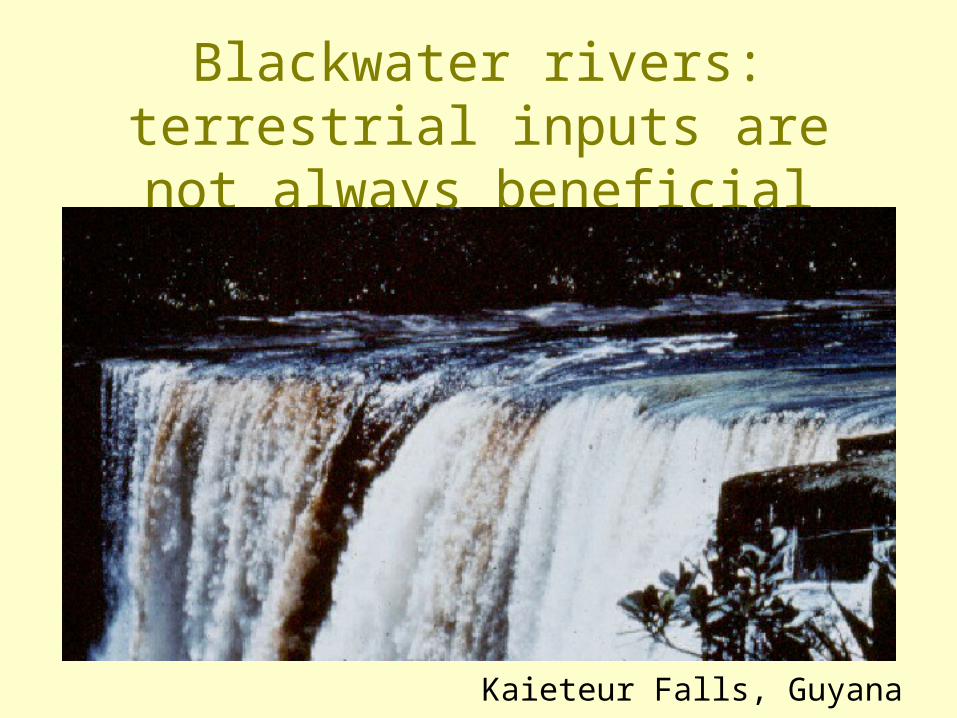
Blackwater rivers: terrestrial inputs are not always
beneficial
Kaieteur Falls, Guyana

Marine subsidies in riverine and riparian environments
Salmon streams: dead salmon add considerable quantities of marine-
derived N (22-73% of total N) to their natal streams. bears and other scavengers drag salmon
carcasses into riparian habitats; as a result (in AK-PNW):
15-30% of the N in riparian plant foliage is derived from marine sources; the amount declines with distance from the stream;
Sitka spruce grows 3x as fast adjacent to salmon streams but western hemlock shows no response;
annual variations in tree growth are significantly correlated with salmon escapements in riparian forests of the Pacific Northwest.
Notes derived from:http://www.fish.washington.edu/people/naiman/Salmon_Bear/


