Download - Khulisa Management Services (Pty) Ltd

Accurately Measuring Progress
Johannesburg 26-7th Avenue, Parktown North, 2193 PO Box 923, Parklands, 2121, South Africa
Tel: (011) 447-6464/5/6/7 Fax: (011) 447-6468
Web: www.khulisa.com E-mail: [email protected]
Directors: Dr. H. Aiello, PhD (USA); Ms. J. Bisgard (USA); Mr. P. Capozza (USA); Mr. M. Ogawa (Can) Ms. MP Selvaggio (USA); Prof. R. Murapa, PhD (Zimbabwe)
Khulisa Management Services (Pty) Ltd Reg No.: 99 09520/07
FOOD ACCESS
Case Study Report
Diagnostic/Implementation Evaluation of Nutrition Interventions for Children from Conception to Age 5
South Africa Department of Performance Monitoring and Evaluation (DPME)
Nutrition SLA 12/0287
Written by: Nadia Williams and Mary Pat Selvaggio
November 2013
Submitted by: Submitted to: Mary Pat Selvaggio Ian Goldman Director DDG: Evaluation and Research Khulisa Management Services (Pty) Ltd The Presidency 26 7th Avenue, Parktown North Dept. of Performance Monitoring and Evaluation Johannesburg, 2193, South Africa Private Bag X944 Tel: +27 11 447 6464, Ext 3215 Pretoria, 0001, South Africa Fax: +27 11 447 6468 Tel: +27 12 308 1918 Email: [email protected] Fax: +27 86 686 4455 www.khulisa.com Email: [email protected]
DPME: Nutrition SLA 12/0287 Food Access Case Study
Khulisa Management Services Page | ii
This report has been independently prepared by Khulisa Management Services (Pty) Ltd. The
Evaluation Steering Committee comprises the Presidency, Department of Performance Monitoring
and Evaluation in the Presidency, The Department of Health, the Department of Social Development,
the Department of Agriculture, Forestry, and Fisheries, and UNICEF. The Steering Committee
oversaw the operation of the evaluation, commented and approved the reports.

DPME: Nutrition SLA 12/0287 Food Access Case Study
Khulisa Management Services Page | iii
TABLE OF CONTENTS
LIST OF ABBREVIATIONS AND ACRONYMS ........................................................................ v
GLOSSARY ...................................................................................................................... vii
1 INTRODUCTION ......................................................................................................... 1
1.1 Background to the Nutrition Evaluation ................................................................... 1
1.2 Objectives/Terms of Reference (TOR) for this Evaluation ........................................ 2
1.3 Approach / Methodology .......................................................................................... 2
1.3.1 Literature Review ..................................................................................................... 3 1.3.2 Fieldwork .................................................................................................................. 3
1.4 Limitations of the Evaluation .................................................................................... 6
2 BACKGROUND ........................................................................................................... 7
2.1 Nutritional Status of Young Children in South Africa ................................................ 7
2.2 Food Access in South Africa ...................................................................................... 8
3 FOOD ACCESS – THEORY OF CHANGE ....................................................................... 10
3.1 What is to be Delivered and How? .......................................................................... 10
3.1.1 Food Parcels ........................................................................................................... 10 3.1.2 Monetary Food Vouchers ...................................................................................... 10 3.1.3 Soup Kitchens ......................................................................................................... 11 3.1.4 ECD Support ........................................................................................................... 11
3.2 Intended Recipients ................................................................................................. 11
3.3 Intended Changes in Beneficiaries’ Behaviour ........................................................ 12
3.4 The Impact Sought................................................................................................... 12
4 POLICY FIT FOR THE LOCAL CONTEXT ........................................................................ 12
4.1 Institutional Context and Culture ............................................................................ 13
4.2 Resource Allocation – Financial and HR .................................................................. 15
4.2.1 Financial Resources ................................................................................................ 15 4.2.2 Human Resources .................................................................................................. 15
5 FINDINGS: IMPLEMENTATION MODEL / STRATEGY ................................................... 16
5.1 Coverage of the Intervention .................................................................................. 16
5.2 Standards / Norms / Guidelines / Protocols ........................................................... 17
5.3 M &E Systems in Place ............................................................................................ 18
5.4 Institutional Capacity for Implementation .............................................................. 19
5.5 Coordination, Referrals, Linkages, and Partnerships .............................................. 19
5.5.1 Inter-Departmental Coordination .......................................................................... 20 5.5.2 Referrals ................................................................................................................. 20 5.5.3 Linkages and Partnerships...................................................................................... 20
5.6 Beneficiary Engagement .......................................................................................... 21
5.7 Communication to the General Public and within Government ............................ 21
6 RESULTS................................................................................................................... 21

DPME: Nutrition SLA 12/0287 Food Access Case Study
Khulisa Management Services Page | iv
7 CONCLUSIONS ......................................................................................................... 23
8 RECOMMENDATIONS ............................................................................................... 23
Appendix A Terms of Reference .............................................................................. 25
Appendix B Methodology ....................................................................................... 32
Appendix C References ........................................................................................... 40
DPME: Nutrition SLA 12/0287 Food Access Case Study
Khulisa Management Services Page | v
LIST OF ABBREVIATIONS AND ACRONYMS
AIDS Acquired Immune Deficiency Syndrome
APP Annual Performance Plan
BANC Basic Antenatal Care
CBO Community Based Organisation
CCG Community-based Care Givers
CD Community Development
CNDCs Community Nutritional Development Centres
KZN-DAEA KZN Department of Agriculture and Environmental Affairs
DAFF National Department of Agriculture, Forestry, and Fisheries
FS-DARD Free State Department of Agriculture and Rural Development
DIS District Information System
DOH Department of Health
DPME Department of Performance Monitoring and Evaluation
EC-DRDAR Eastern Cape Department of Rural Development and Agrarian Reform
DSD Department of Social Development
EC Eastern Cape
ECD Early Childhood Development
FBSA Food Bank of South Africa
FS Free State
HCBC Home and Community based Care
HIV Human Immunodeficiency Virus
HR Human Resources
IDP Integrated Development Plan
IEC Information, Education, and Communication
IMCI Integrated Management of Childhood Illnesses
INP Integrated Nutrition Programme
INS Integrated Nutrition Strategy
IYCF Infant and Young Child Feeding
KFC Kentucky Fried Chicken
KZN KwaZulu-Natal
M&E Monitoring and Evaluation
MEC Member of the Executive Committee
MTEF Medium Term Expenditure Framework
MUAC Mid-Upper Arm Circumference
NDA National Development Agency
NGO Non-Governmental Organisation
NPO Non-Profit Organisation
ORS Oral Rehydration Salts
OSS Operations Sukuma Sakhe
OVC Orphans and Vulnerable Children
PHC Primary Health Care

DPME: Nutrition SLA 12/0287 Food Access Case Study
Khulisa Management Services Page | vi
PLWHAs People Living With HIV/AIDS
PPP Private Public Partnership
SAG South African Government
SANHANES South Africa National Health and Nutrition Examination Survey
SASOL South Africa Synthetic Oil Liquid
SASSA South African Social Security Agency
SAW Social Auxiliary Workers
SP Special Programmes
TB Tuberculosis
UN United Nations
UNICEF United Nations Children’s Fund
WC Western Cape
ZAR South African Rands

DPME: Nutrition SLA 12/0287 Food Access Case Study
Khulisa Management Services Page | vii
GLOSSARY
Ante-natal Before birth; during or relating to pregnancy
Basic Antenatal Care (BANC)
The regular preventive care recommended for women during pregnancy that benefits both mother and child. Essential interventions include identifying and managing obstetric complications and infections, promoting healthy behaviours such as breastfeeding, giving medical information around biological changes, and giving nutritional counseling and vitamins to prevent maternal anaemia and malnutrition and to enhance a healthy pregnancy outcome. In South Africa, the recommended schedule for BANC is 4 visits during pregnancy starting in the first trimester. Routine BANC plays a part in reducing maternal death rates, miscarriages, birth defects, low birth weight, and other preventable health problems.
Beneficiaries Beneficiaries in this evaluation included pregnant women and/or caretakers of children 0-5 years of age who were present at health facilities during fieldwork. Beneficiary focus groups were carried out as part of this evaluation.
Breast milk substitute
Any food being marketed or otherwise represented as a partial or total replacement for breast milk whether or not it is suitable for that purpose.
Breastfeeding Protection, Promotion and Support.
In South Africa, Breastfeeding Protection, Promotion and Support consists of 4 main activities: (i) enforcement of the International Code on Marketing of Breast milk substitutes (e.g. responsible advertising about breast-milk substitutes and effective legislation to define and monitor unacceptable marketing), (ii) behavioural change from mothers to exclusively breastfeed (no other liquids or solid foods) for the first six months of life and after introducing solids at 6 months of age, continued breastfeeding for up to 2 years, (iii) promotion of breastfeeding during delivery, and (iv) workplace opportunities to breastfeed. Combined, these actions have been shown to promote more optimal breastfeeding behaviours which in turn reduces diarrhoea, acute respiratory infections, and malnutrition in infancy.
Complementary Feeding
The feeding of solid foods that are readily consumed and digested by the young child and that provide additional nutrition to meet all the growing child's needs. The recommended age range for beginning complementary feeding is from 6 months of age.
ECD food support Provision of food at Early Childhood Development (ECD) centres is one element contributing to South Africa’s Food Security Strategies. DSD subsidises registered ECD centres based on the number of children enrolled. The DSD signs 1-year Service Level Agreements under which the ECD Centre receives ZAR15 per child per day and a portion of this is to be spent on food. The DoH provides guidance on meal plans for ECD centres, and these are meant to guide the centres and DSD in assuring nutritious meals for children.
Exclusive Breastfeeding
Defined as "an infant's consumption of human milk with no supplementation of any type (no water, no juice, no nonhuman milk, and no foods) except for vitamins, minerals, and medications."1 National and international guidelines recommend that all infants be breastfed exclusively for the first six months of life. Breastfeeding may continue with the addition of appropriate foods for two years or more.
Exclusive breastfeeding has dramatically reduced infant deaths by reducing diarrhoea and infectious diseases. It has also been shown to reduce HIV transmission from mother to child, compared to mixed infant feeding.
Food Access Food Access, or “Access to food” is fundamental to South Africa’s social safety net, as it provides supplemental food through various means including soup kitchens or food parcels for at-risk groups. Food Access is a key element that contributes to South Africa’s Food Security Strategies.
1 WHO. Accessed in January 2014. http://www.who.int/elena/titles/exclusive_breastfeeding/en/.

DPME: Nutrition SLA 12/0287 Food Access Case Study
Khulisa Management Services Page | viii
Food Fortification The process of adding vitamins and minerals to food. The main reasons for adding nutrients to food is to restore losses due to processing, storage and handling of foods; to improve overall nutritional quality of the food supply; and as a public health measure to correct recognised dietary deficiency(ies). Fortifying everyday staples means people become healthier, live longer, and lead more productive lives. Infant mortality is less likely to occur and children show higher levels of physical and mental development, resulting in improved performance in school. In South Africa, the following vitamins and minerals are added to maize and wheat flour: Vitamin A, Vitamin B1, Vitamin B2, Vitamin B6, Niacin, Folic Acid, iron and zinc, and iodine is added to salt.
Food prices/zero-VAT rating
Since 1984, South Africa has removed VAT (i.e. zero-VAT rated) from certain basic foodstuffs as a means to make basic foods more accessible to the poor. Currently the following foods are zero-rated: brown bread, maize meal, samp, mealie rice, dried mealies, dried beans, lentils, tinned pilchards/sardines, milk powder, dairy powder blend, rice, vegetables, fruit, vegetable oil, milk, cultured milk, brown wheaten meal, eggs, edible legumes and pulses of leguminous plants. This is a mechanism to enhance access to food and contain food prices
Food Security (output 2 of Outcome 7)
The South African Government’s Output 2 of Outcome 7 is “improved access to affordable and diverse food”. Food Security in South Africa consists of four main strategies implemented through the combined efforts of the Department of Agriculture, Forestry and Fisheries (DAFF), DoH, and DSD: (i) ensuring access to food (through various DSD interventions), (ii) improved nutrition security (through various DoH health and nutrition interventions), (iii) improved food production capacity of households and poor resourced farmers (DAFF), and (iv) development of market channels for food (DAFF).
Growth Monitoring and Promotion (GMP)
Growth Monitoring (GM) is the process of periodic, frequent measurements of the growth of a child in comparison to a standard. GMP is a prevention activity comprising of GM linked with promotion (usually counseling) to increase awareness about child growth; improve caring practices; and serve as the core activity in an integrated child health and nutrition programme. As an intervention, GMP is designed to affect family-level decisions and individual child nutritional outcomes.
Household Food Production and Preservation
Household food production / food preservation is one component of South Africa’s Food Security Strategy. DAFF has promoted and supported home gardening as well as school, community, and clinic gardens to complement and supplement the food parcels programme carried out by the Department of Social Development (DSD) as part of its Food Security strategy. DSD now promotes home gardening as part of its Sustainable Livelihoods programme.
IMCI (Integrated Management of Childhood Illnesses)
IMCI is an integrated approach to child health that focuses on the well-being of the whole child and that aims to reduce death, illness and disability and to promote improved growth and development among children under five years of age. IMCI includes both preventive and curative elements that are implemented by families and communities as well as by health facilities. WHO notes that if implemented well, IMCI can reduce under-five mortality and improve nutritional status. In South Africa, IMCI is delivered through health facilities by IMCI-trained nurses as part of the primary health care package of services.
Improved Hygiene Practice
Improved water quality, improved disposal of human excreta, and interventions that promote hand washing have been shown to reduce diarrhoea. Repeated diarrhoea incidence in the first two years of life significantly increases the risks of being stunted by age two years, and some water, sanitation and hygiene interventions may improve height growth in children under five years of age. In South Africa, most hygiene education, improved water quality, and sanitation is delivered through local government/municipalities, although the DoH is also responsible for hygiene education as part of the primary health care package of services.

DPME: Nutrition SLA 12/0287 Food Access Case Study
Khulisa Management Services Page | ix
Indicator A monitoring and evaluation term for an objectively verifiable measurement which reflects the activity; assumption, or effect being measured.
International Code of Marketing of Breast Milk Substitutes
An international health policy framework for breastfeeding promotion adopted by the World Health Assembly (WHA) of the World Health Organisation (WHO) in 1981. The Code was developed as a global public health strategy and recommends restrictions on the marketing of breast milk substitutes, such as infant formula, to ensure that mothers are not discouraged from breastfeeding and that substitutes are used safely if needed. The Code also covers ethical considerations and regulations for the marketing of feeding bottles and teats.
Intra-partum During childbirth or during delivery.
Lactation The secretion or production of milk by mammary glands in female mammals after giving birth
Mainstreaming Interventions
Mainstreaming an intervention involves planned action, including legislation, policies or programmes, in any area and at all levels2. It is the process of bringing together common functions within and between organizations to solve common problems, developing a commitment to a shared vision and goals, and using common technologies and resources to achieve these goals3. It is a strategy for making concerns and experiences an integral part of the design, implementation, monitoring and evaluation of policies and programmes in all political, economic and societal spheres2.
Malnutrition A broad term describing the condition that develops when the body does not get the correct amount of kilojoules, vitamins, minerals, and other nutrients it needs to maintain healthy tissues and organ function. Commonly used as a broad term to refer to under nutrition and over nutrition.
Management of Moderate Malnutrition
See Targeted Supplementary Feeding.
Management of Severe Malnutrition
A medical and a social disorder, whereby malnutrition is the end result of chronic deprivation by carers who because of poor understanding, poverty, or family problems are unable to provide the child with the nutrition and care that is needed. Successful management of severely malnutrition requires both medical and social interventions. If the illness is viewed as only a medical disorder, the child is likely to relapse when returning home. In South Africa, management of severe malnutrition is mainly delivered through district and other tertiary hospitals, although health workers at all levels are responsible for identifying cases.
Micronutrient deficiency
Occurs when the body does not have sufficient amounts of essential vitamins or minerals required by the body. Deficiency occurs when there is insufficient dietary intake and/or insufficient absorption and/or suboptimal utilisation of the vitamin or mineral.
Micronutrient supplementation
Enhancing or boosting the nutritional content of one’s diet with vitamins or minerals. Young children are highly vulnerable to micronutrient deficiencies as they have low body stores of these nutrients, and can have low intake due to improper feeding practices, and losses due to infections. Micronutrient supplementation in pregnancy and during early childhood is associated with proper growth and decreased complications of infections. In South Africa, the most common micronutrients given to pregnant women are Iron and Folic Acid, along with general multi-vitamins. Children in South Africa are supposed to be given routine Vitamin A supplementation.
2 Anon. International Labour Organization (ILO). 2013.
http://www.ilo.org/public/english/bureau/gender/newsite2002/about/defin.htm 3 http://www.afro.who.int/en/clusters-a-programmes/iss/immunization-systems-support/integrated-child-
survival-interventions.html

DPME: Nutrition SLA 12/0287 Food Access Case Study
Khulisa Management Services Page | x
Mixed Feeding Feeding breast milk along with infant formula, baby food and even water.
Moderate malnutrition
A growth measure between minus two (-2) and minus three (-3) standard deviations from the median of the standard reference population.
Morbidity Refers to the state of being diseased or unhealthy within a population.
Mortality Refers to the number of deaths in a population.
Nutrition The process of providing or obtaining the food necessary for health and growth. The intake of food, considered in relation to the body’s dietary needs. Good nutrition – an adequate, well balanced diet combined with regular physical activity – is a cornerstone of good health. Poor nutrition can lead to reduced immunity, increased susceptibility to disease, impaired physical and mental development, and reduced productivity.
Nutrition Education and Counseling
Enhancing the quality of the diet, by educating about foods and what quantities are needed in order to achieve optimal dietary intake. This can also include counseling on micronutrient supplements. There is some evidence that nutrition training of health workers improves energy intake, feeding frequency, and dietary diversity of children between six months and two years of age. In South Africa, health facilities have the prime responsibility for delivery nutrition education and counseling, but with PHC re-engineering it is expected that community based nutrition education and counseling will be strengthened.
Obesogenic Causing and leading to obesity.
ORS (Oral Rehydration Salts)
A dry mixture of salt and sugar/glucose (sodium chloride) which is mixed with water to prepare a solution of used for treating dehydration due to diarrhoea or other causes. UNICEF In South Africa, both ORS and Zinc are given to children during diarrhoeal episodes.
Over nutrition A form of malnutrition which occurs if a person consumes too many kilojoules.
Overweight A form of over nutrition. Scientifically defined as weight for height above two standard deviations from the median weight for height of the standard reference population.
PHC Re-engineering A restructuring of the South African health system to better implement Primary Health Care to take comprehensive services to communities with an emphasis on disease prevention, health promotion and community participation. PHC Re-engineering is focused on strengthening the district health system (DHS) through three cohesive and co-coordinated streams: (a) the deployment of ward based PHC outreach teams; (b) strengthening of school health services; and (c) deployment of district clinical specialist teams aimed at improving maternal and child health in particular.
Post-partum After childbirth.
Prioritised Nutrition Interventions
Prioritised nutrition interventions are services which have policies, guidelines, protocols, budgetary allocation and are actually delivered on the ground to all or most eligible patients/clients as evidenced by coverage rates or other measures.
Regulations Refers to rules issued by Parliament governing the implementation of relevant South African legislation. Examples of regulations issued under the Foodstuffs, Cosmetics, and Disinfectants Act (Act 54 of 1972) in South Africa, include R. 991 relating to foodstuffs for infants and young children, and R146 relating to the labelling, marketing, educational information, and responsibilities of health authorities related to general foodstuffs.
Sanitation Refers to facilities that ensure hygienic separation of human excreta from human contact, including flush or pour flush toilet/latrine to piped sewer system, septic tank or pit latrine; ventilated improved pit (VIP) latrine; pit latrine with slab; and composting toilet.
DPME: Nutrition SLA 12/0287 Food Access Case Study
Khulisa Management Services Page | xi
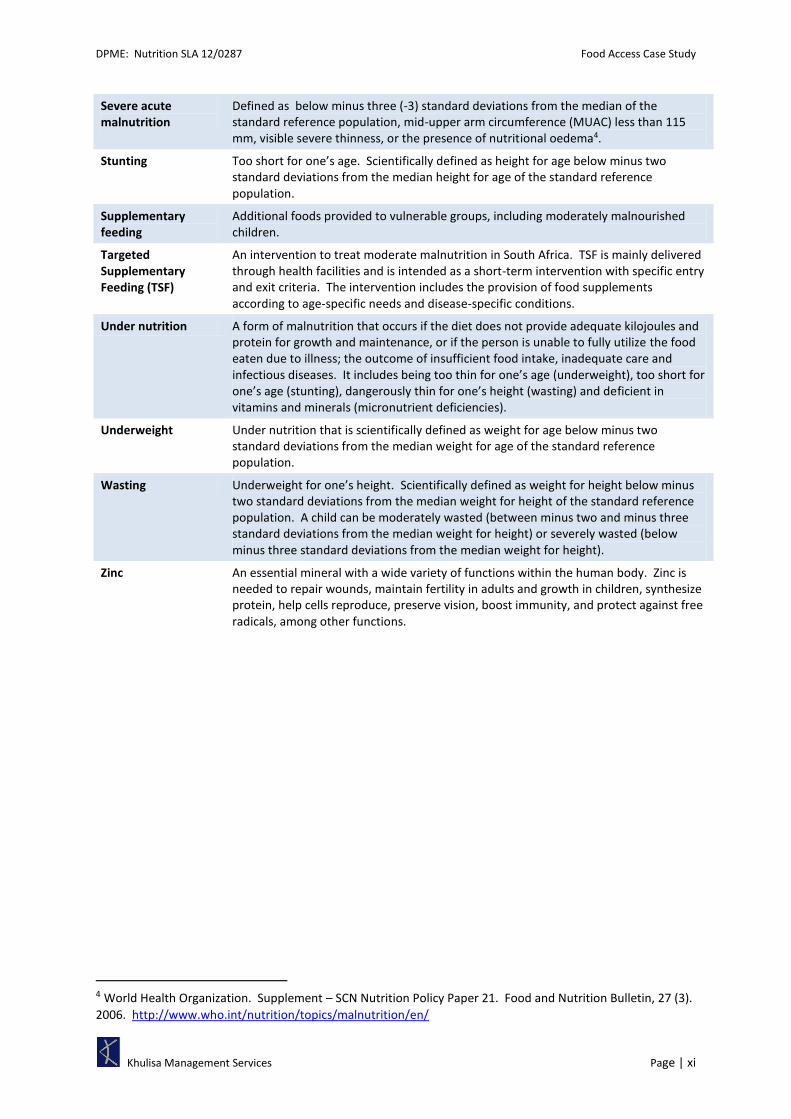
Severe acute malnutrition
Defined as below minus three (-3) standard deviations from the median of the standard reference population, mid-upper arm circumference (MUAC) less than 115 mm, visible severe thinness, or the presence of nutritional oedema4.
Stunting Too short for one’s age. Scientifically defined as height for age below minus two standard deviations from the median height for age of the standard reference population.
Supplementary feeding
Additional foods provided to vulnerable groups, including moderately malnourished children.
Targeted Supplementary Feeding (TSF)
An intervention to treat moderate malnutrition in South Africa. TSF is mainly delivered through health facilities and is intended as a short-term intervention with specific entry and exit criteria. The intervention includes the provision of food supplements according to age-specific needs and disease-specific conditions.
Under nutrition A form of malnutrition that occurs if the diet does not provide adequate kilojoules and protein for growth and maintenance, or if the person is unable to fully utilize the food eaten due to illness; the outcome of insufficient food intake, inadequate care and infectious diseases. It includes being too thin for one’s age (underweight), too short for one’s age (stunting), dangerously thin for one’s height (wasting) and deficient in vitamins and minerals (micronutrient deficiencies).
Underweight Under nutrition that is scientifically defined as weight for age below minus two standard deviations from the median weight for age of the standard reference population.
Wasting Underweight for one’s height. Scientifically defined as weight for height below minus two standard deviations from the median weight for height of the standard reference population. A child can be moderately wasted (between minus two and minus three standard deviations from the median weight for height) or severely wasted (below minus three standard deviations from the median weight for height).
Zinc An essential mineral with a wide variety of functions within the human body. Zinc is needed to repair wounds, maintain fertility in adults and growth in children, synthesize protein, help cells reproduce, preserve vision, boost immunity, and protect against free radicals, among other functions.
4 World Health Organization. Supplement – SCN Nutrition Policy Paper 21. Food and Nutrition Bulletin, 27 (3).
2006. http://www.who.int/nutrition/topics/malnutrition/en/

DPME: Nutrition SLA 12/0287 Food Access Case Study
Khulisa Management Services Page | 1
1 INTRODUCTION
Malnutrition in infants and young children typically develops during the period between 6 and 18
months of age and is often associated with frequent infections and intake of low nutrient or energy
dense diets, consisting predominantly of starch-rich staples. Linear growth (i.e. height) and brain
development are especially rapid during the pregnancy and the first 2 years of life. Young children
are particularly susceptible to growth failure and developmental delays if they are not breastfed and
are fed complementary foods with low nutrient/energy density and poor bioavailability of vitamins
and minerals. Furthermore, conditions of poor hygiene and sanitation can lead to frequent
infections, which further impairs children’s nutritional status. Infant and child malnutrition
contributes to increased morbidity and mortality, impaired intellectual development, suboptimal
adult work capacity and even increased risk of disease in adulthood.
1.1 Background to the Nutrition Evaluation
Although nutrition programmes have been in place in South Africa since the 1960’s, they were not
very effective in reducing malnutrition because they focused primarily on providing food to the
needy and not the underlying causes of malnutrition (i.e. illness, poor household access to food,
inadequate maternal and child care, poor access to health services, and an unhealthy environment
with limited access to clean water and sanitation).
In the mid-1990’s the Government introduced the Integrated Nutrition Programme (INP) which
aimed to improve nutrition through emphasizing collaboration between Government departments
(inter-sectoral collaboration of line departments) to promote joint action for addressing nutrition
problems. Inter-sectoral collaboration was envisioned mainly between the Departments of Health
(DOH), Social Development (DSD), Agriculture, Forestry, and Fisheries (DAFF), and Rural
Development and Land Reform (DRDLR)as these departments each deliver food and nutrition
interventions specific to their sector. The expected outcome of this approach was to improve
nutritional status of South Africa’s vulnerable populations, namely children under the age of five and
pregnant women.
To date, however, malnutrition persists as an underlying cause and contributor to child mortality
and morbidity in South Africa. Indeed, South Africa is one of only
15 countries where little to no progress has yet been made in
reducing under-five mortality by two-thirds1 (Millennium
Development Goal 4), and although this situation is partly due to
South Africa’s heavy burden of HIV, it is also due to a variety of
underlying factors, including poor infant and child nutrition as
evidenced by the recent 2012 South African National Health and
Examination Survey (SANHANES)2 which found that 21.6% of
children age 0-5 are stunted, and 5.5% are underweight.
Given this, the Department of Performance Monitoring and Evaluation (DPME) in the Presidency
commissioned the “Diagnostic/Implementation Evaluation of Nutrition Interventions for Children
from Conception to age 5” to examine critical systemic and implementation issues that inhibit or
enable access to nutrition interventions for children under the age of 5 and pregnant women.
The findings from this evaluation are meant to assist the Government in improving implementation
of existing nutrition interventions by identifying inhibiting or enabling factors that affect access to
In South Africa, a large percentage of young children age 0-5 show signs of malnutrition: 21.6 % are stunted, and 5.5 % are underweight for their age (2012).

DPME: Nutrition SLA 12/0287 Food Access Case Study
Khulisa Management Services Page | 2
nutrition services (particularly among children) and to support the scale-up of interventions as
required.
1.2 Objectives/Terms of Reference (TOR) for this Evaluation
This qualitative evaluation aims to identify the factors contributing to effective or non-effective
implementation of 18 nutrition interventions being delivered by Government, with an emphasis on
the first 4 interventions as listed in Table 1 below. The full terms of reference for this evaluation can
be found in Appendix A.
Table 1: 18 Nutrition Interventions Explored in this Evaluation
Nutrition Intervention (NB: the first four interventions (bolded) are the main focus of the evaluation)
Responsible Department
1. Breastfeeding support* Health
2. Management of moderate malnutrition including Targeted Supplementary Feeding* Health
3. Household food production and preservation (home gardening) DAFF
4. Food access (e.g. food parcels, soup kitchens) DSD
5. Early Childhood Development (ECD) (food in ECD centres) DSD
6. Complementary feeding* Health
7. Food fortification (Vitamin A, Iron and Iodine)* Health
8. Micronutrients including Vitamin A supplementation* Health
9. Oral Rehydration Salts (ORS) and Zinc* Health
10. Management of severe malnutrition* Health
11. Deworming Health
12. Growth monitoring and promotion including the use of Mid-Upper Arm Circumference (MUAC) measurements
Health
13. Nutrition education and counselling (part of all of these) Health
14. Improving hygiene practice (including in relation to water and sanitation) Health
15. BANC (Basic ante-natal care) – education and supplements, timing Health
16. IMCI (Integrated management of childhood illnesses) Health
17. Access to (nutritious) food, food prices DAFF
18. Food security (output 2 of outcome 7 in the National Priority Outcomes) DRDLR/DAFF * High impact interventions
1.3 Approach / Methodology
Khulisa’s approach to the evaluation examined the following six moderating factors that have been
identified as influencing the policy implementation:
1) the policy’s content and fit for the local environment,
2) the institutional context and culture, including readiness to change and the extent of
commitment at all levels through which the policy passes,
3) the various implementation strategies (i.e. models) devised for carrying out the policy,
4) the institutional capacity to implement the policy,
5) participant responsiveness, and
6) communication to the general public and within government itself.
These moderating factors comprised the “lens” through which Khulisa examined the implementation
of the INP and its 18 nutrition interventions, and for answering the 17 evaluation questions put forth
in the TOR. Figure 1 below depicts this conceptual approach in graphical form.

DPME: Nutrition SLA 12/0287 Food Access Case Study
Khulisa Management Services Page | 3
Figure 1: Conceptual Framework for the Evaluation
1.3.1 LITERATURE REVIEW
The starting point for this evaluation was a literature review that provided the context for this
implementation evaluation. The literature review examined the following relevant topics:
1. Current health and nutrition status of children under 5 and pregnant women in South Africa;
2. South Africa’s policy framework on maternal and child nutrition;
3. A review of nutrition policies and interventions from 5 countries that have successfully improved
their nutrition performance (Brazil, Columbia, Malawi, Mozambique, and Malaysia). These
countries were selected by the Evaluation Steering Committee as comparisons to South Africa
based on one of the following two reasons:
the country has similar economic or infrastructure characteristics to South Africa but
much better nutrition performance at a national level (i.e. Brazil, Columbia, and
Malaysia), or
the country is geographically proximate to South Africa and thus has similar
environmental and cultural characteristics, but again better nutrition performance (i.e.
Malawi and Mozambique);
4. An analysis of implementation issues present in the literature.
1.3.2 FIELDWORK
Data collection then took place at national level and in four provinces (Western Cape, Eastern Cape,
Free State, and KwaZulu-Natal). At national level, Key Informant Interviews were held with relevant
national government managers as well as with representatives from international NGOs, donor
organisations, and private food companies. In each province, Key Informant Interviews were held
with relevant provincial managers in the Departments of Health, Agriculture, and Social
Development, as well as with representatives from 3 NGOs and 1 ECD centre in each province.
Management of moderate malnutrition inc targeted supplementary feeding
Management of severe malnutrition
ORS and Zinc
Micronutrient inc Vitamin A supplementation
Food fortification (Vitamin A, Iron and Iodine)
Complementary feeding
Breast-feeding support
Hig
h im
pac
t In
terv
enti
on
s
ECD (food in ECD centres)
Food access (e.g. food parcels, soup kitchens)
Food security (output 2 of outcome 7)
Household food production and preservation (home gardening)
IMCI (integrated management of childhood illnesses)
BANC (Basic ante-natal care) – education and supplements, timing
Improving hygiene practice (inc in relation to water and sanitation (should be in all)
Nutrition education and counseling (part of all)
Growth monitoring and promotion inc use of MUAC
Deworming
Oth
er In
terv
enti
on
s Access to (nutritious) food, food prices
Co
mp
reh
ensi
ven
ess
and
Fit
of
the
Po
licy
Imp
lem
enta
tio
n S
trat
egi
es u
nd
erta
ken
Par
tici
pan
t R
esp
on
sive
nes
s
Cap
acit
y to
Imp
lem
ent
Co
mm
un
icat
ion
Cu
ltu
re a
nd
Co
nte
xt

DPME: Nutrition SLA 12/0287 Food Access Case Study
Khulisa Management Services Page | 4
Two districts were purposefully selected in each province and Key Informant Interviews were held
with relevant district managers in the Departments of Health, Agriculture, and Social Development.
Within each district, 4 health facilities were randomly selected for fieldwork and staff were
interviewed. In addition, in each health facility, we also conducted focus group discussions (FGDs)
with beneficiaries, rapid assessments of nurses’ nutrition knowledge, and rapid assessments of the
health facilities’ equipment, supplies, and guidelines.
Figure 2: Main Data Collection Components of the Evaluation
Table 2 presents a summary of planned and actual data collection, and Figure 3 presents a map of
data collection sites.
Table 2: Fieldwork Conducted
Data Collection Method and Stakeholders Group No. of Interviews / FGDs
Planned Actual Response Rate %
Individual or Group Interviews
National Government Managers 4 5 125%
Representatives of International NGOs 4 4 100%
Donors 3 4 133%
Private Food Companies 4 4 100%
Provincial Government Managers 12 15 125%
District Government Managers 24 21 88%
Health Workers in Health Facilities 32 31 97%
Local NGO 8 8 100%
ECD Centre 4 5 125%
Focus Group Discussions
Beneficiaries FGDs at health services and community projects
48 40 83%
Other Assessments Planned Actual Response Rate %
Health Facilities Rapid Assessments 40 36 90%
Rapid Assessment of Nurses’ Nutrition Knowledge 76 132 174%

DPME: Nutrition SLA 12/0287 Food Access Case Study
Khulisa Management Services Page | 5
Figure 3: Fieldwork Locations
Case Study reports were prepared for each of the four provinces where fieldwork took place, as well
as each of the four priority interventions. In all, 11 reports were prepared for this evaluation as
listed below:
1. Literature Review
2. Breastfeeding Case Study
3. Targeted Supplementary Feeding Case Study
4. Home Gardens Case Study
5. Food Access Case Study
6. KwaZulu-Natal Provincial Case Study
7. Eastern Cape Provincial Case Study
8. Free State Provincial Case Study
9. Western Cape Provincial Case Study
10. Final Evaluation Report
11. Summary of Final Evaluation Report
DPME: Nutrition SLA 12/0287 Food Access Case Study
Khulisa Management Services Page | 6
1.4 Limitations of the Evaluation
By their nature, qualitative evaluations of policies and programme implementation allow
examination of the broader context, rather than specific measurements of compliance to policy
elements or programmatic guidelines. This evaluation’s extremely broad scope (18 interventions, 17
research questions, and investigation of 6 moderating factors) resulted in very lengthy interviews
with respondents who often had time constraints, particularly in the WC. Consequently, many
respondents gave only cursory information around the issues that we sought to explore more
deeply.
Because the INP’s nutrition interventions for the health sector far outweigh the number of nutrition
interventions in the social development and agriculture sectors, the evaluation’s sampling
framework is biased toward respondents from health. In addition, at provincial, district, and local
levels, most respondents were able to speak knowledgeably about nutrition interventions
implemented by their specific government department, but few were able to comment on the
adequacy of implementation for interventions outside their sector. As a result, data collected from
social development and agriculture is sparse compared to that collected from health, making
generalisations on implementation in agriculture and social development more difficult.
Data collection in the WC was significantly delayed due to the need to secure ethics clearance before
the commencement of field work. This delay led to time constraints on the part of the researcher
which in turn resulted in less complete data for the WC compared to that for the other 3 provinces.
A detailed description of the methodology used in the evaluation is found in Appendix B to this
report.

DPME: Nutrition SLA 12/0287 Food Access Case Study
Khulisa Management Services Page | 7
2 BACKGROUND
2.1 Nutritional Status of Young Children in South Africa
Presently, more than 20% of children under 5 years of age are stunted in South Africa, and 5% are
underweight, although both rates have declined since 2003. Provincial differences are evident
(Figure 4 and Figure 5) and in some provinces (KZN, NW, MP) the prevalence of stunting has actually
increased since 2003.
Figure 4: Stunting Prevalence in children U5 - 2003 and 2012
Figure 5: Underweight Prevalence in children U5 - 2003 and 2012
-
10.0
20.0
30.0
40.0
Per
cen
t o
f C
hild
ren
Age
d 0
-5 y
ears
Stunting (height-for-age) in children U52012 compared to 2003
SANHANES 2012 Severe SANHANES 2012 Moderate DHS 2003 Severe DHS 2003 Moderate
-
5.0
10.0
15.0
20.0
25.0
30.0
Per
cen
t o
f C
hild
ren
Age
d 0
-5 y
ears
Underweight (weight-for-age) in children U52012 compared to 2003
SANHANES 2012 Severe SANHANES 2012 Moderate DHS 2003 Severe DHS 2003 Moderate

DPME: Nutrition SLA 12/0287 Food Access Case Study
Khulisa Management Services Page | 8
In contrast to the situation described above, most of the evaluation respondents perceive
underweight to be the most common nutrition problem (Figure 6), with only a minority recognising
stunting as a widespread nutrition problem, and few recognise overweight as an issue. The lack of
awareness of stunting as a broad nutrition issue affects government programming and
implementation of nutrition interventions.
Figure 6: Respondents’ Perceived Nutrition Problems in Children U5 (N=99)
2.2 Food Access in South Africa
Food access can be defined as “the ability of a nation and its households to acquire sufficient food
on a sustainable basis”3 4 5. Food access speaks to issues surrounding entitlement to food,
purchasing power and consumption behaviour. It also plays to cultural issues, “where women
usually are the last ones served”5, which are crucial in terms of nutrition interventions specifically
targeting pregnant women.
“Access to food” is fundamental to South Africa’s social safety net, and is one of the elements that
contributes to South Africa’s Zero Hunger and Food Security Strategies (Figure 7).
DSD’s implementation of Food Access comprises three different interventions:
1. Cash transfers through various social grants and food vouchers;
2. Food support through supplemental feeding for at-risk groups (food parcels, soup kitchens)
and support to ECD centres; and
3. Household/Community Gardens through its Sustainable Livelihoods programme.
In this report we focus on (2) Food Support with a special focus on children under the age of 5 and
pregnant women.
Food access is fundamental to South Africa’s Framework for Comprehensive Social Protection that
defines minimum acceptable living standards for all citizens, of which the “right to food” is part4.
Moreover, South Africa is one of the few countries in the world that has this as part of its
Constitution6.
0%
20%
40%
60%
80%
100%
Overweight Underweight Stunting/Other
Perc
ent
of
resp
on
ses
Perceived Nutrition Problems in Children 0-5 in EC, FS, KZN, and WC
DOH mgrs
DSD mgrs
DOA mgrs
NGO staff

DPME: Nutrition SLA 12/0287 Food Access Case Study
Khulisa Management Services Page | 9
Figure 7: Logic Model for South Africa’s Zero Hunger Strategy 7
Despite numerous poverty alleviation policies and programmes in South Africa since 1994, there are
still high levels of hunger, poverty, reliance on social grants, unemployment and decrease in food
production. The recent South African National Health and Examination Survey (SANHANES)8 on
hunger, food security, and nutrition found that overall, less than half the South African population is
food secure (45.6%), while 28.3% were at risk of food insecurity and 26.0% were food insecure. The
rate of hunger is lowest in Western Cape (16.4% of households) and Gauteng (19.2%), and highest in
the Eastern Cape (more than 30%).
In 2009, the DSD introduced its “Food for All” initiative to acquire and distribute basic foods at
affordable prices to poor households and communities as the department’s contribution to the
country’s Zero Hunger Framework. The goal of Food for All is “to attain physical, social and
economic access to sufficient, safe and nutritious food for food insecure South Africans at all times
to meet their specific needs for an active and a healthy lifestyle”9. The Food for All campaign
objectives include10:
• Ensuring access to food for the poor and vulnerable members of society
• Improving nutrition security of citizens
• Improving food production capacity of households
• Developing market channels through bulk government procurement of food, and
• Fostering partnerships with relevant stakeholders within the food supply chain
The Food for All campaign also aims to have an economic influence.
“The aspect of capacity building was brought into the theme, as social welfare cycles needed
to be evolutionary. The government could not provide families with social assistance for
ever, but with empowerment and tools to develop self-sustainability the once vulnerable
could build a new life for themselves. The cycle of supply and demand for food production in
the country could stimulate the economy in itself.”10

DPME: Nutrition SLA 12/0287 Food Access Case Study
Khulisa Management Services Page | 10
In pursuit of these goals and objectives, DSD delivers different forms of Food Access interventions –
Food Parcels, Monetary Food Vouchers, Soup Kitchens, Sustainable Livelihoods Interventions11, and
support to ECD Centres for meals – each of which are delivered independently from each other (i.e.
not integrated).
In this evaluation, an overall scarcity of programme documentation regarding the DSD’s Food Access
interventions, particularly food parcels and soup kitchens, made it difficult to evaluate the
sufficiency of implementation, although information on food support to ECD centres was more
readily available.
3 FOOD ACCESS – THEORY OF CHANGE
3.1 What is to be Delivered and How?
3.1.1 FOOD PARCELS
Food Parcels are a short-term response to provide immediate relief to households in conjunction
with medium and long-term interventions that create conditions conducive to improving food and
nutrition security. The South African Social Security Agency (SASSA) provides food parcels to people
in distress for 3-6 months. These parcels are supposed to be comprised of basic staple foods that
are high in nutritional content. Beneficiaries are identified through standardised eligibility criteria by
DSD or other departments (e.g. DAFF and DOH staff), as well community leaders. Food parcels are
then distributed monthly to the beneficiaries until alternate medium-term interventions are
successfully introduced to render the beneficiaries self-sufficient, sustainable and not dependent on
food relief.
3.1.2 MONETARY FOOD VOUCHERS
As well as Food Parcels, the DSD/SASSA provides Food Vouchers for social relief. DSD prefers to give
vouchers (rather than food parcels) in order to empower people to make their own choices and
decisions, and to eliminate many of the logistical issues around food parcels (procurement, storage,
distribution, security)12.
“Food parcels require additional capacity, the food expires, management of the food cannot
be controlled, and they are difficult to store. Human capacity is needed to sort the food, carry
it, manage it, pack it, making it very intensive. Money is therefore the preferred choice to
provide for people in need.”13
Food vouchers are given either in actual monetary form, as "gift" cards for supermarkets, or as debit
cards loaded with a total of ZAR3,400 for 3 months’ worth of food, except in KZN where food
vouchers are valued at ZAR3,000 for 3 months. The card is given with an ID and pin, and is thought
to give people a sense of dignity by giving them the choice of what to buy and when, ensuring that
food doesn't go to waste. Much like South Africa’s social grants, the vouchers can be accessed
through cashpoints, ATMs or Merchants. There is no specification as to how the voucher is used,
although it is supposed to be for food.
In order to limit abuse of the vouchers, DSD has a list of accessible grocery stores where the food
vouchers can be used, and they have developed a guide on nutritious and sustaining foods that can
be purchased.

DPME: Nutrition SLA 12/0287 Food Access Case Study
Khulisa Management Services Page | 11
3.1.3 SOUP KITCHENS
Soup Kitchens are a third short-term intervention to address food insecurity. DSD partners with
Home and Community based Care organisations (HCBCs) to establish soup kitchens for vulnerable
children, youth, and adults who are malnourished and/or affected by HIV, AIDS, or TB. Ideally, a
soup kitchen provides a nutritious meal that consists of meat, vegetables and salads.
3.1.4 ECD SUPPORT
In relation to children under 5 years of age, DSD subsidises registered ECD Centres based on the
number of children enrolled. The DSD signs 1-year Service Level Agreements under which the ECD
Centre receives ZAR15 per child per day, and a portion of this is to be spent on food. The DOH also
provides guidance on meal plans for ECD centres, and these are meant to guide the centres and DSD
in assuring nutritious meals for children.
Figure 8 - Logic Model for Food Access
3.2 Intended Recipients
Except for the ECD programme support, the intended recipients for all food access programmes are
all vulnerable members of society, i.e. the destitute, those living below the poverty line, or those
who fall within the category of “hungry”. There are no nutrition-related targeting criteria for any of
the Food Access programmes. Rather the criteria for identifying beneficiaries is poverty and
“hunger” as shown in Table 3. Beneficiaries of food access interventions include children under 5
years of age, pregnant women, child headed households, and people living with HIV and AIDS and
TB, elderly, and persons living with disabilities.
Recipients of Food Parcels and Soup Kitchens are also NGOs who then distribute the food to their
beneficiaries. Examples of NGOs include orphanages, crèches, old age homes, shelters for abused
women and children, soup kitchens and HIV and AIDS clinics. In the EC, Soup Kitchens are primarily
for HIV and AIDS programmes, rather than malnourished mothers or children.

DPME: Nutrition SLA 12/0287 Food Access Case Study
Khulisa Management Services Page | 12
Table 3: Illustrative Questions on Food Insecurity and Child Hunger in Household Profiling14
Household-level food insecurity
Does your household ever run out of money to buy food?
Do you ever rely on a limited number of foods to feed your children because you are running out of money to buy food for a meal?
Do you ever cut the size of meals or skip meals because there is not enough money for food?
Individual-level food insecurity
Do you ever eat less than you should because there is not enough money for food?
Child hunger
Do your children ever eat less than you feel they should because there is not enough money?
Do your children ever say they are hungry because there is not enough food in the house?
Do you ever cut the size of your children’s meals or do they ever skip meals because there is not enough money to buy food?
Do any of your children ever go to bed because there is not enough money to buy food?
The primary recipients of ECD support are registered ECD centres who are meant to use a portion of
the DSD subsidy to purchase healthy food for the young children (0-5 years of age) in their centres.
3.3 Intended Changes in Beneficiaries’ Behaviour
“Food availability and access by themselves (do) not translate into a well-nourished
population; hence nutrition awareness and education coupled with socio-economic
programmes are integral to the improved health status of the South African population.
Awareness moves the individual from lack of interest and ignorance to an increased
appreciation and finally to action.” 6
The DSD’s Food Access interventions are not designed to change nutrition or food-related
behaviour; rather they aim to create changes in a person’s wellbeing through the following
outcomes:
Increase food intake
Decrease the number of individuals that are hungry due to the unavailability of adequate
quantity of food
Food Vouchers are also intended to empower beneficiaries to utilise their money in the best possible
way to receive nutritious foods, without placing restrictions on what food should be purchased or
eaten. The vouchers are intended to also teach beneficiaries about the value and use of money,
while also ensuring that they do not go hungry.
3.4 The Impact Sought
Overall the impact sought for all the Food Access interventions is to reduce hunger and malnutrition
in the vulnerable populations in South Africa.
4 POLICY FIT FOR THE LOCAL CONTEXT
Various policies, strategies, guidelines were highlighted during fieldwork and during the review of
literature as guiding the implementation of Food Access interventions:

DPME: Nutrition SLA 12/0287 Food Access Case Study
Khulisa Management Services Page | 13
Table 4: Laws, Policies, and Strategies Relevant to Food Access
Year Responsible Department
Law, Policy, Strategy
Legislation
2010 DSD The Social Assistance Amendment Act (2010)15
2008 DSD The Social Assistance Amendment Act (2008)16
2007 n/a Children’s Amendment Act17
2006 n/a Older Person’s Act18
2005 n/a Children’s Act19
2004 DSD The Social Assistance Act20
1996 n/a Section 27 of Chapter 2 (Bill of Rights of RSA Constitution of 1996:13)
Policies
2013 DAFF / DSD National Policy on Food and Nutrition (in process)21
2012 DSD Social Service Professions Policy (in process)
Strategies
2002 DAFF Integrated Food Security Strategy (IFSS)22
Guidelines
2010 DOH Healthy eating for preschool children23
2006 DSD Guidelines for ECD services (including nutrition and menu guidelines)24
No date DSD/SASSA The Social Relief Guidelines
Special Programmes
2011 DSD Food for All Campaign10
No date Treasury/SARS Tax exemption for food stuffs
No date DAFF Zero Hunger
No date DSD Sustainable Livelihoods programme
4.1 Institutional Context and Culture
DSD staff at district and local levels (mainly DSD Social Workers) are largely focused on diagnosing
hunger and vulnerability and identifying potential recipients of Food Access interventions. The
delivery of the Food Access interventions, however, is largely through NGOs, although in some
communities DSD staff themselves deliver food parcels and other Food Access and social welfare
support directly to households and communities. Some respondents in this evaluation noted that
food parcels can also be given at soup kitchens.
Food Banks are used as a mechanism to support delivery of food to poor households, particularly in
the processes of procurement, storage, and distribution. DSD has partnered with the Food Bank of
South Africa (FBSA), the main coordinator of food banks in South Africa, to organize and establish
food banks in communities with the highest concentration of food insecurity, with the aim of
eliminating hunger and food insecurity specifically for:
Child and Youth Development (pre-schools, foster care, shelters for orphans and vulnerable
children and school feeding schemes);
Adult Development (nutritional feeding centres and soup kitchens serving unemployed
persons, HIV-infected persons and pregnant women); and
Social Welfare (aged care, disabled care and care for the terminally ill)25.
FBSA secures food and essential non-food groceries from producers, manufacturers, retailers,
government agencies, individuals and other organisations. After removing branding from all
donated products, FBSA stores them in warehouses and then dispatches them (daily) to its large

DPME: Nutrition SLA 12/0287 Food Access Case Study
Khulisa Management Services Page | 14
networks of NGOs based throughout South Africa. FBSA attains significant economies of scale,
enabling it to source and distribute very high volumes of food at a significantly lower cost than other
entities. DSD’s Annual Report for 2011/2012 reports that ZAR 5 million was allocated to the Food
Bank in March 201226.
Community-based NGOs receive (or purchase) food products which they cook and serve to
beneficiaries. Food products are received mostly from the DSD, other NGOs, FBSA and corporate
donations. The amount of food products received varies, but on average soup kitchens provide 3
meals per beneficiary per week. In the WC, the Community Development Directorate finances
community-based NPOs to distribute food parcels (as part of social relief) to the vulnerable and
needy, and to operate community nutritional development centres (CNDCs). This aims to provide
nutritional support services to children (and their families) who are almost on the verge of being
malnourished and/or facing growth faltering (i.e. falling outside the DOH’s Nutritional Therapeutic
Programme) as well as those do not qualify for Social Relief of Disaster support from SASSA.
Figure 9: Process of Food Access Implementation
In terms of leadership, across the four provinces, most DSD respondents considered leadership
sufficient for Food Access interventions although each province noted something distinct. In EC, the
DSD’s Special Programmes (DSD-SP) was appointed as the champion and lead department for
coordinating the province’s Integrated Food Security and Nutrition Strategy. In both KZN and FS,
DSD was said to have a clear vision and commitment to implementing nutrition/food access
interventions. FS also indicated adequate leadership for addressing key nutrition and food
challenges in the province, as evidenced by a directive from the premier’s office to promote food
gardens, improve household food security and establish ECDs.
Planning is inconsistent across the four provinces. In KZN, DSD has department-wide operational
plans and directorate-specific plans that detail food access interventions as part of their service
package. In FS, DSD’s Annual Performance Plan (APP) contains little detail on Food Access budgets
or targets. In WC, DSD’s APP contains indicators and targets for ECD support (of which nutrition is
DSD SOCIAL WORKERS
• Profile Households
• Initiate families and individuals onto Food Access Support
• Monitor Progress
FOOD BANK SA
NGOs
• Deliver Food Parcels
• Deliver Soup Kitchens
COMMUNITY
DEPARTMENT OF SOCIAL DEVELOPMENT
DSD SOCIAL WORKERS
• Deliver and Monitor Food Parcels, Food Vouchers, Social Relief

DPME: Nutrition SLA 12/0287 Food Access Case Study
Khulisa Management Services Page | 15
one component) and for targeted feeding schemes; however, there is no detailed financial
information which unpacks this specifically for nutrition-related interventions.
4.2 Resource Allocation – Financial and HR
4.2.1 FINANCIAL RESOURCES
Most respondents across the four provinces considered financial resources to be generally
adequate, except for financial resources for ECD. In EC, funding for ECD is only sufficient to reach a
small portion of the eligible pre-school population. “The children population in the province is
estimated at around 600,000 and the department is only subsidising 57,000 children”, said one EC
respondent. Indeed, in 2012, the population of children aged 0-4 in South Africa was an estimated
10.9 million27, but the number of children attending registered ECD centres was less than 10% of this
– only 789,000 (Table 5) excluding Grade R.
Table 5: ECD enrolment 28
EC FS KZN WC
No. of registered ECD centres in 2011 2 911 2 979 3 167 1 417
No. of children enrolled in registered ECD centres in 2011 82 336 97 031 123 545 95 060
No. and % of children enrolled who receive the ECD subsidy in 2011
75 880 42 969 70 815 68 865
92% 44% 57% 72%
The portion of the ECD subsidy allocated to food reportedly varies across provinces – in EC it is R6.00
per child per day, whereas in FS it is R7.00, and in KZN, R7.50. There is no monitoring on whether
the money allocated for food is being used correctly (i.e. whether ECD Centres are spending the
allowance for food on nutritious food).
During fieldwork, respondents provided different monetary values to the food parcels across the
provinces. In KZN, the parcel’s value was noted as ZAR 450, whereas in the EC, it was reportedly
valued at ZAR1260 for adults and ZAR290 for children. However, these monetary values do not
reflect the same time periods or numbers of people to be reached.
4.2.2 HUMAN RESOURCES
Respondents broadly cited human resources constraints as limiting implementation, particularly
vacant positions and inadequate training of those currently delivering and monitoring Food Access
interventions and ECD support. Indeed, South Africa is reportedly short of 77,000 Social Workers29
at all levels.
KZN-DSD is troubled by a lack of permanent staff, specifically at head office and at district level
where several managers are serving in acting capacities. At head office, one manger is temporarily
seconded from the Ulundi Cluster Office, and still lives in temporary accommodation because of the
tentative nature of her position, and this reportedly affects implementation. Also in KZN, there is a
shortage of data capturers at ward level to capture all the relevant data which is currently collected
by the Social Work Coordinators.
The FS provincial DSD also reports inadequate staff especially with skills and expertise on food and
nutrition. Their current complement of 3 full-time social workers who are responsible for
implementing the sustainable livelihoods, social relief, and the community development
programmes have only undergone informal training on food and nutrition.

DPME: Nutrition SLA 12/0287 Food Access Case Study
Khulisa Management Services Page | 16
In EC, HR for Food Access interventions are reportedly inadequate for rural areas. For example, in
OR Tambo district, a minimum of 10 Community Development Practitioners are required per local
municipality, but DSD operates with only 3 for the entire district.
A shortage of Social Work Coordinators in WC spurred the province to engage NGOs for supporting
ECD centres. Although this partially addresses the referral role of the social work coordinators, it
doesn’t completely fill the need (or the gap) for oversight and monitoring.
5 FINDINGS: IMPLEMENTATION MODEL / STRATEGY
5.1 Coverage of the Intervention
Recent data from the 2012 SANHANES8 shows that more than 50% of households (or estimated 3.8
million households30) in South Africa are hungry or at risk of hunger (Figure 10). Food insecurity is
highest in EC and lowest in WC among the four provinces involved in this evaluation.
Figure 10: Food Insecure and Hungry Households, 2012 8
Data from national DSD suggests that it is reaching only a fraction of these vulnerable households --
DSD has only profiled 12% of these households and has assisted 5% with Food Access and
Sustainable Livelihoods services (Figure 11). But food access coverage rates vary across provinces.
In the EC, SASSA’s Ministerial Malnutrition Programme was said to have identified and provided
1,500 children with food parcels and supplements during 2012/2011 – which if we consider each
child represents a household represents assistance to only 0.25% of hungry households in EC. WC-
DSD appears to perform slightly better than other provinces. According to the WC DSD more than
22,000 people were reached through awareness programmes on family support services in
2011/1214 and this accounts for 8.3% of hungry households in that province.
Coverage of ECD is also low -- as less than 10% of the country’s pre-schoolers attend registered ECD
centres that receive the support.
0%
25%
50%
75%
100%
National Western Cape Eastern Cape Free State KZN
Hungry Households At Risk Households

DPME: Nutrition SLA 12/0287 Food Access Case Study
Khulisa Management Services Page | 17
Figure 11: National DSD Coverage for Food Access Interventions in 201226
5.2 Standards / Norms / Guidelines / Protocols
The following guidelines, protocols and policies were mentioned by respondents in this evaluation,
regarding Food Access Interventions:
Children’s Act 38 of 2005
Western Cape Provincial Government Policy on the Funding of Non-Governmental
Organisations for rendering Social Welfare Services
Early Childhood Development Protocol
DOH menu guidelines for ECD centres
Food template for Social Relief of Distress
Social Relief Guidelines
Woolworth Trust SOPs
For food support to ECD centres, the ECD Guidelines24 provide a sample menu and nutrition
considerations for feeding all children, as well as special guidelines around breastfeeding, formula
feeding, and complementary feeding for infants under two years of age.
For food parcels, no respondents were able to indicate any prescribed composition for parcels.
However, from an NGO working with OVC in Gauteng, we learned that their monthly food parcels
are packaged from donated food and consist of “5 kgs mielie meal, 2 kgs rice, and 8 tins of
vegetables per family. Food lasts 10-15 days depending on size of family”31. While this parcel does
contain key carbohydrates, it does not provide a completely balanced diet, as it lacks proteins and
other nutrients.
Another example comes from a tender we found online from one city in Gauteng that had requested
bids for the supply and distribution of 5 different food parcel options (Table 6). While encouragingly,
each food parcel option does contain an item of protein and a carbohydrate, and sometimes a
Households Profiled
Households Benefiting fm DSD Feeding Programmes
Total Food Parcels Distributed
Beneficiaries of Social Relief Distress programmes
Households Linked to Income-Generating Opportunities
Food Gardens Established & Supported355
472,267
183,179
14,955
7,903
735
40
0 C
om
mu
nit
ies
Pro
file
d

DPME: Nutrition SLA 12/0287 Food Access Case Study
Khulisa Management Services Page | 18
vegetable, it is highly disturbing that every option contains a significant number of unhealthy
processed foods that are high in fat, salt, sugar, caffeine, and additives (e.g. MSG). Few if any of the
options provide foods that are rich in micro-nutrients. These are not nutritious food parcels, and
they contain many items that are not appropriate for children (i.e. Monster Energy drink).
Table 6: Contents of Food Parcels to be supplied and distributed for a City in Gauteng32
Food Parcel Option Contents of Food Parcel
Option 1 Approximate quantities per annum: 18 000
1 x Corned Beef 300g Bull Brand or equal (No Pork) 1 x Sweet Corn Cream Style 215g Koo / All Gold or equal 1 x Potato Chips Assorted 30g/ 36g Simba / Willards or equal 1 x Two Minute Noodles 73g Maggi or equal 1 x Pvm Energy Bar 45g or equal 1 x Energy Drink Assorted 500ml Energade / Powerade or equal 1 x Plate Recyclable 155mm x 165mm 1 x Table Spoon Recyclable
Option 2 Approximate quantities per annum: 12 000
1 x Hot Pilchards 425g Glenrich, Lucky Star or equal 1 x Beans 215g Koo /All Gold or equal 1 x Potato Chips Assorted 30g/ 36g Simba / Willards or equal 1 x Energy Sweets Super C or equal 1 x Energy Drink Monster 473ml 1 x Plate Recyclable 155mm x 165mm 1 x Table Spoon Recyclable
Option 3 Approximate quantities per annum: 6 000
1 x Pilchards 425g Glenrich, Lucky Star or equal In Tomato Sauce 425g or equal 1 x Spaghetti In Tomato Sauce 225g Koo / All Gold or equal 1 x Peanuts Salted / Peanuts & Raisins 33g or equal 1 x Bioplus Energy 12 Chews or equal 1 x Energy Drink Assorted 500ml Energade / Powerade or equal 1 x Plate Recyclable 155mm x 165mm 1 x Table Spoon Recyclable
Option 4 Approximate quantities per annum: 6 000
1 x Chicken Biryani 410g Koo / All Gold or equal 1 x Curried Mixed Veggies 420g Koo / All Gold or equal 1 x Potato Chips Assorted 30g/36g Simba / Willards or equal 1 x Chocolate Assorted Energy Bar 80g Beacon / Cadbury Nestle or equal 1 x Energy Drink Monster 473mll 1 x Plate Recyclable 155mm x 165mm 1 x Table Spoon Recyclable
Option 5 Approximate quantities per annum: 7 200
1 x Corned Beef 300g Bull Brand or equal 1 x Baked Beans In Tomato Sauce 225g Koo / All Gold or equal 1 x Tuc Biscuits 100g or equal 1 x Energy Bar 60g Beacon / Cadbury or equal 1 x Energy Drink Assorted 500ml Energade / Powerade or equal 1 x Plate Recyclable 155mm x 165mm 1 x Table Spoon Recyclable
5.3 M &E Systems in Place
In terms of programme review processes, 75% of DSD respondents reported that there was an
efficient management process for measuring the effectiveness of the delivery of Food Access
interventions at service delivery point; however, we were unable to identify any standard indicators
or data collections methods. All the M&E information we received suggested that each province
tracks Food Access in its own unique way. Despite these processes, DSD does not appear to have
any review processes that focus on nutrition issues or outcomes for its Food Access interventions.
In KZN, M&E systems reportedly function well with clear intervention-specific indicators, and few
DPME: Nutrition SLA 12/0287 Food Access Case Study
Khulisa Management Services Page | 19
data quality issues. KZN-DSD tracks the implementation of the Food Access interventions from data
collected solely within the District Information system (DIS), using the following indicators:
the number of organizations supported for ECD,
the number of women- and child-headed households,
the number of HIV/AIDS and TB beneficiaries reached;
In the EC, Home Based Care Workers and Social Workers collect various data on DSD services, but
little data is reported to provincial or national level on the reach or nutritional effects of the food
parcels, soup kitchens, or ECD interventions. The indicators identified in EC include:
Number of individuals who benefited from social relief of distress programme, and
Number of children 0-5 years old accessing registered ECD programmes.
Social Workers monitor ECDs on a monthly basis using an ECD monitoring tool that investigates
money spent on nutrition, environmental issues, and how food is being cooked at the ECD centres.
One SASSA respondent in the EC also indicated that there was no internal management review
process for the Social Relief of Distress activities, but SASSA does collect data on the intervention.
No information on the data elements being tracked for Food Access were obtained for WC or FS.
No M&E data is disaggregated to better track the number of children under 5, and pregnant mothers
who have been reached with Food Access interventions. Moreover, the quality of existing data is
uncertain; for example, there are lists of people who visit Soup Kitchens, but respondents reported
that many more people visit these kitchens than are on the list.
5.4 Institutional Capacity for Implementation
As noted earlier, human resources are in short supply for DSD generally, but respondents also noted
a lack of food and nutrition training for existing DSD staff. Particularly, in KZN, respondents from
DSD, DAEA, as well as NGOs, noted limited training on food and nutrition and a lack of refresher
trainings as limiting implementation.
In EC, inadequate financial resources for ECD support and inadequate material resources for Food
Access interventions limits implementation effectiveness.
Limited resources for transport to conduct community outreach was also noted as a limiting factor
all round.
5.5 Coordination, Referrals, Linkages, and Partnerships
The successful implementation of a comprehensive “package” of nutrition interventions to targeted
populations hinges on 3 implementation principles:
strong strategic coordination between government departments,
strong referrals between government departments at implementation level, and
strong linkages and partnerships with community-based organisations or other institutions
to extend the reach directly to households.
Each of these are further explored below.

DPME: Nutrition SLA 12/0287 Food Access Case Study
Khulisa Management Services Page | 20
5.5.1 INTER-DEPARTMENTAL COORDINATION
DSD undertakes little strategic coordination with DOH or agriculture around nutrition at national
level, but does work closely with SASSA in carrying out Food Access interventions. None of the DSD
Food Access interventions are focused primarily on children or pregnant mothers. At provincial
level, there is some evidence of coordination in KZN (through the Operations Sukuma Sukhe (OSS)
initiative) and in WC, but not in other provinces.
5.5.2 REFERRALS
Referrals at local level are stronger, however. In WC, the referral system from ECD centres to other
nutrition services is also reportedly effective, as DSD Social Work Coordinators refer cases of
malnutrition directly to dieticians in nearby clinics and to social and agricultural services. However,
some respondents noted that NGOs (rather than the DSD) often organise these referrals because of
staff shortages and heavy workload for the Social Work Coordinators, and that rather than working
through the DSD’s Social Work Coordinators, ECD sites also refer directly to SASSA, local social
workers, and DOH clinics without any involvement of DSD.
In KZN, Operations Sukuma Sakhe (OSS) war rooms facilitate linkages and referrals between the
various departments for support to vulnerable households. DSD works closely with DOH in assisting
severe malnutrition cases, and all DOH health facilities in KZN confirmed links with a DSD through a
social worker. However, DSD-KZN noted occasional difficulty in tracing and finding severe
malnutrition cases when DOH does not record all the necessary information, such as where
individuals reside, or nearby locations.
In contrast to KZN, there was little evidence of referrals and linkages in the EC between DSD Food
Access interventions and other government food/nutrition interventions. Although theoretically,
when the DOH identifies cases of malnutrition, these should also be enrolled in the DSD / SASSA
Social Relief of Distress programme and given food parcels, only one respondent reportedly worked
closely with Social Workers when referring malnutrition cases for social assistance. This was
confirmed by the DSD who noted generally that the linkages between its department and other
government departments around nutrition are weak. ECD Centres in the EC, however, noted better
integration with other government departments, as evidenced by the mechanisms ECD centres have
to refer children to SASSA and the DOH, and the support given to ECD centres from SASSA (food
parcels to poor families in distress identified at ECD centres), EC-DRDAR (assistance with vegetable
gardens and other food security interventions), and DOH (vitamin A, weighing and education, and
oral hygiene).
5.5.3 LINKAGES AND PARTNERSHIPS
Partnerships with NGOs do exist, but there is no programme documentation available on the
number of agreements with NGOs, the level of funding, or the reach of NGOs working in Food
Access.
Respondents also reported a few partnerships with the private sector including Foodbank SA (as
described in section 4.1 above) and with Nestle, who in 2010 began support to the EC-DSD in
strengthening ECD in the province. The partnership had 3 focus areas: (1) to beautify the ECDs, i.e.
fencing, painting, equipping, etc.; (2) to assist in training ECD practitioners on how to cook nutritious
meals for children; and (3) to develop food security through ECD vegetable gardens. Through this
partnership, Nestle supported a 2-day training workshop in nutrition in November 2010 for 30 Social
Auxiliary Workers (SAW) who were attached to ECD centres to monitor (amongst other things) how

DPME: Nutrition SLA 12/0287 Food Access Case Study
Khulisa Management Services Page | 21
ECD centres perform in the area of child nutritional support. This was the primary reason they were
selected as the target group for the training. In addition, Nestle also provided wheelbarrows, spades
and forks for gardening at ECD centres. Respondents from EC-DSD reported that the partnership
with Nestle ended in 2012 at the urging of the DOH.
In addition, several large food companies are involved in food donations that parallel DSD’s efforts.
Tiger Brands, Pioneer Foods, Woolworths, and Pick n Pay provide significant food donations to
FoodBank and/or other NGOs for onward distribution in food parcels or for soup kitchens. The
Shoprite Group also runs a feeding program that distributes more than 300 000 cups of nutritional
soup and bread per month to less privileged communities throughout South Africa through the
deployment of 12 Shoprite mobile kitchen units33.
5.6 Beneficiary Engagement
In KZN, soup kitchens, food parcels, and food voucher programmes were not widely known by most
beneficiaries interviewed in this evaluation, nor had they seen IEC materials or heard any radio
advertisement about these programmes. In EC, on the other hand, most of the beneficiaries
interviewed were aware of food in ECD centres, social grants, and food parcels, despite DSD’s
professed difficulty reaching people who live in remote rural areas because of the province’s vast
terrain and inaccessible roads.
In 2012, the DSD’s Sustainable Livelihoods programme successfully organised a Taking the DSD to
Communities campaign as well as a Social Development Outreach Month, where food parcels were
distributed via soup kitchens and Food Banks to more than 1 million people26. The results suggested
that DSD should invest more in promoting Food Access programmes to increase awareness among,
and access for, potentially eligible beneficiaries.
5.7 Communication to the General Public and within Government
DSD uses several channels to raise awareness of its programmes among the general public, including
road shows, awareness campaigns, radio advertisements, community referrals, and CHWs. Most
DSD and other respondents felt that communication externally was adequate.
In contrast, internal communication was less positive. National level respondents from SASSSA and
DRDLR both expressed dissatisfaction with internal communication. In the FS, DSD also spoke of
insufficient feedback about implementation from lower to higher levels.
6 RESULTS
Given the evaluation’s sampling framework, whereby health-sector-based interviews far outweighed
interviews with DSD or DAFF, few individuals were able to speak knowledgeably about Food Access
interventions (Figure 12), and those were mainly DSD and NGO respondents. This is consistent with
findings elsewhere in this evaluation that showed most respondents are knowledgeable about the
nutrition-related interventions implemented by their specific government department, but rarely
the interventions of other government departments. This means that few health-sector or
agriculture-sector respondents were able to comment on the adequacy of DSD’s Food Access
interventions, speaking to a lack of coordination and linkages between government departments
around food and nutrition interventions. Even within DSD, it was apparent that respondents often
did not have a “big picture” understanding of department’s Food Access interventions, further
suggesting the silo’d nature of such as food parcels, soup kitchens, ED support, and social grants.

DPME: Nutrition SLA 12/0287 Food Access Case Study
Khulisa Management Services Page | 22
However, nearly every DSD respondent mentioned support to ECD centres as a priority activity – a
reflection perhaps of this evaluation’s focus on children under 5, but also of the fact that Food
Access interventions (food parcels, soup kitchens) are not specifically or even generally targeted to
young children but are rather targeted at adults.
This suggests that, along with a general absence of nutrition-specific objectives and goals, the overall
scope of Food Access interventions is not sensitive to nutrition or to the needs of children under 5.
Even ECD food support is not reaching infants and young children in the first 1000 days of life, as the
vast majority of children enrolled in ECD centres are 3 years or older34.
Figure 12: Respondents who mentioned Food Access Interventions without Prompting
Food Access interventions are targeted to the poor, and there appears to be a good uptake of this
intervention on the part of beneficiaries. However, the need appears to be greater than the supply,
and the intervention is targeted towards any person who is destitute and in need of food.
Various factors limit implementation of Food Access interventions – namely, a gross shortage of
human resources, limited inter-departmental linkages and coordination, no standardised protocols
for implementation, no standardised delivery mechanisms, and no standardised M&E system.
The shortage of human resources has forced some provincial DSD’s to scale back activities, while
others have engaged NGOs to support delivery, but monitoring and oversight of these NGOs isn’t
apparent and the lack thereof could lead to inappropriate delivery and implementation. Few, if any,
DSD staff have training in food and nutrition.
Limited inter-departmental coordination leads to fragmentation of, and poor return on,
government’s investments in food and nutrition. Access to food must be coupled with good health
and other nutrition-related interventions in the agriculture sector to ensure an effective response
from each and every intervention. Strategic coordination at provincial level only appears to
effectively exist in KZN. Referrals and linkages at local level need strengthening everywhere. As one
DOH respondent lamented, “Severely malnourished children are discharged from hospitals without
food support, and then they end up being re-admitted”.
The poor composition of food parcels as discussed in section 5.2 above, demonstrates an urgent
need for more intensive guidance on optimising the nutritional value and quality of the food parcels.

DPME: Nutrition SLA 12/0287 Food Access Case Study
Khulisa Management Services Page | 23
Finally, despite a relatively-sound policy base, the absence of standardised delivery or M&E
protocols leads to ad hoc implementation that makes it difficult to manage or improve for maximum
nutritional effect. Moreover, there is little programme documentation about the various Food
Access interventions, how they are delivered, their reach, and their effects.
7 CONCLUSIONS
Secure Food Access is related, but different, to Nutrition Security. Availability of – and access to –
food are necessary but not sufficient conditions for nutrition security. The latter is achieved when
secure access to nutritious and healthy food is coupled with a sanitary environment, adequate
health services, and knowledgeable nutrition care35. Although the Food for All campaign provides a
strategy for improving nutrition for pregnant women and children under age 510, this evaluation
suggests that it is still an idea that has not yet been implemented or integrated into existing
interventions. Each DSD intervention is implemented in a silo, with little integration internally or
externally with the work of other government departments. Moreover, there is no targeting of
pregnant women and young children, particularly for the first 1000 days of life, to prevent
malnutrition (i.e. stunting or underweight).
There is need to establish effective monitoring systems around the delivery of Food Access
interventions and their effects. While not examined as part of this evaluation, there may be an
opportunity to consolidate nutrition and Food Access data using the new SASSA biometric cards
(introduced in March 2012 for grant disbursements) for SASSA beneficiaries specifically.
Disappointingly, aside from food support given to ECD centres, there is a lack of focus on the
adequacy of food provided or consumed – i.e. nutritional diversity, nutritional balance, and overall
health quality of food items (i.e. free from pesticide residues) – that are either provided in parcels or
meals, or that are purchased with grants and vouchers. Although separate legislation and standards
regulate some of these concerns (such as pesticide residues), DSD’s focus in Food Access and
Sustainable Livelihoods is on making available a greater quantity of food and not quality of food.
This is a shortcoming that urgently needs more attention.
8 RECOMMENDATIONS
1. Formalise protocols for the delivery of each Food Access intervention with a focus on nutrition
goals and objectives. Require all implementation bodies (DSD staff, NGOs, etc.) to adhere to
these protocols.
2. Clarify implementation roles and responsibilities between DSD’s Sustainable Livelihoods
programme and DAFF’s Household Food Production and Preservation programmes with respect
to Food Access.
3. Create strategic coordination mechanisms at national and provincial levels that have the
authority to hold different departments accountable, and ensuring that pregnant women and
young children can access a full range of food and nutrition services from multiple service points
in as integrated a way as possible.
4. Fill vacancies and train staff on food and nutrition needs and requirements of pregnant women
and young children.
5. Improve supervision and monitoring of the delivery of all Food Access interventions, including
tracking the length of time individuals and households are enrolled in the intervention, and their
DPME: Nutrition SLA 12/0287 Food Access Case Study
Khulisa Management Services Page | 24
change in nutritional status as a result of participation, and their relapse rate.
6. Develop more accurate, reliable, and comprehensive data on Food Access interventions,
disaggregated to local level to assist planning and targeting. Improve M&E systems by including
additional data points on the delivery of food and nutrition interventions to pregnant women
and children under 5 and to include outcome level data that indicates the effects of these
interventions.
7. Clearly indicate performance targets for delivery of Food Access interventions to pregnant
women and children under 5 in Strategic Plans and APPs.
8. Explore the possibility of consolidating nutrition and food access data on the SASSA biometric
cards.
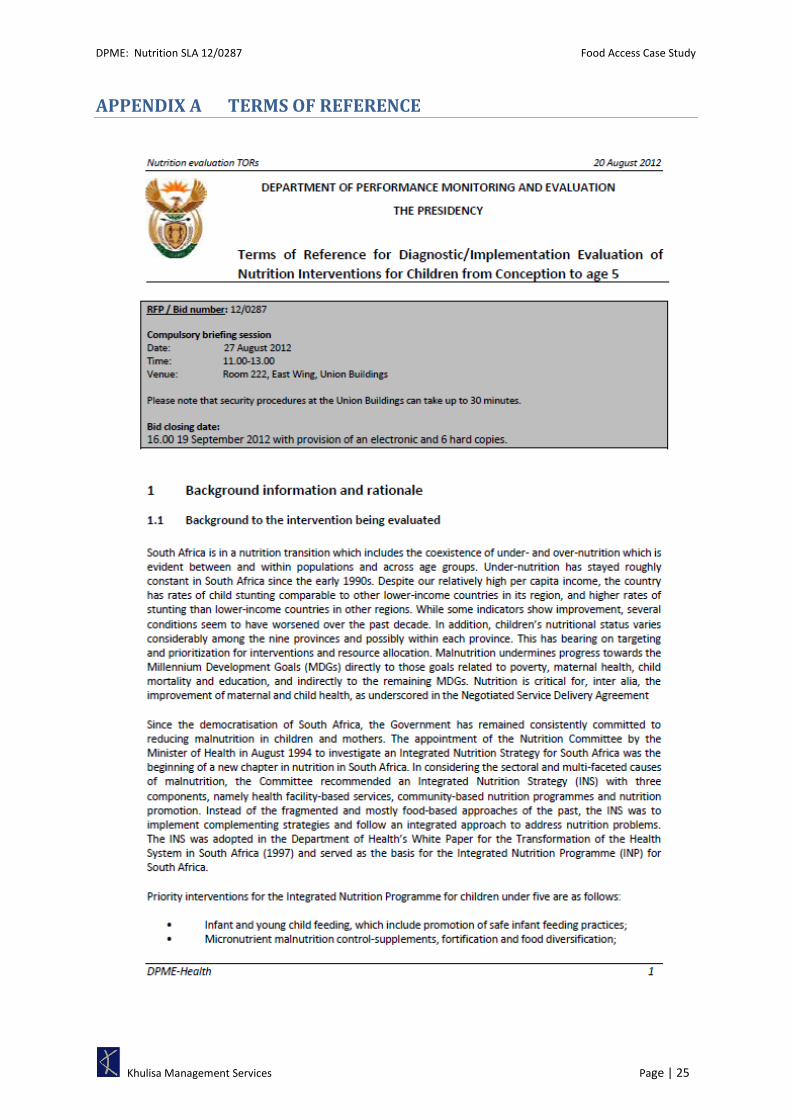
DPME: Nutrition SLA 12/0287 Food Access Case Study
Khulisa Management Services Page | 25
APPENDIX A TERMS OF REFERENCE
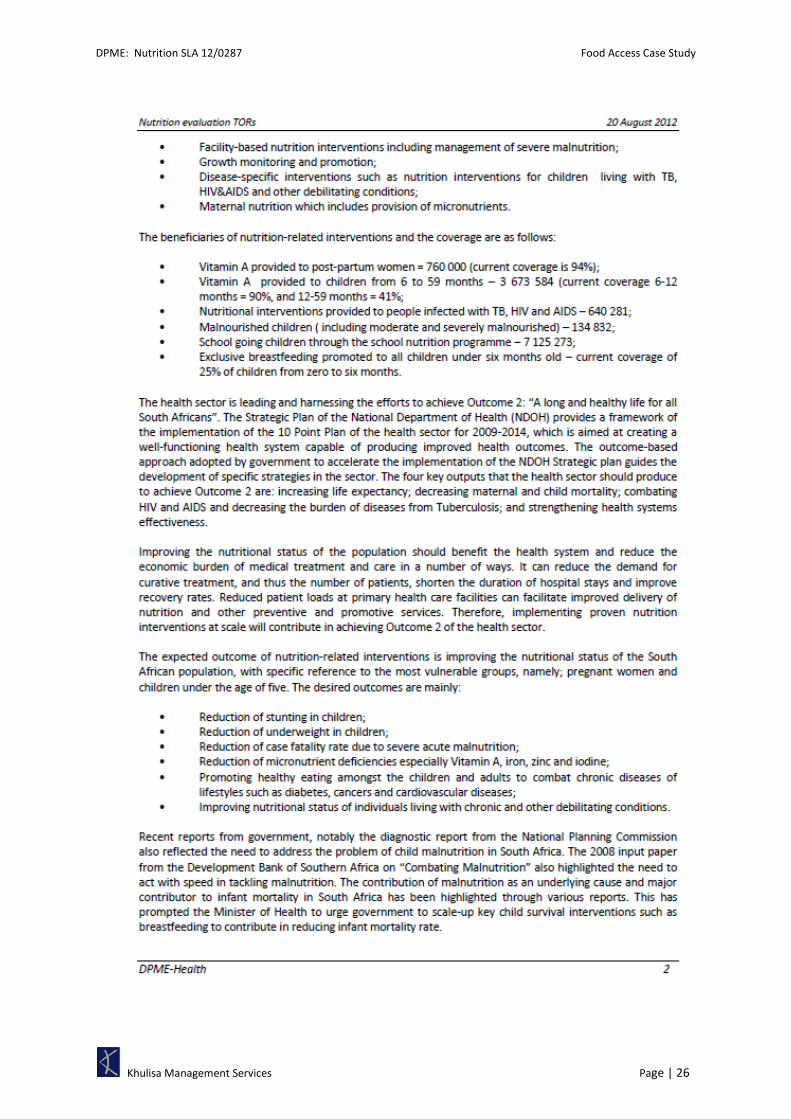
DPME: Nutrition SLA 12/0287 Food Access Case Study
Khulisa Management Services Page | 26

DPME: Nutrition SLA 12/0287 Food Access Case Study
Khulisa Management Services Page | 27
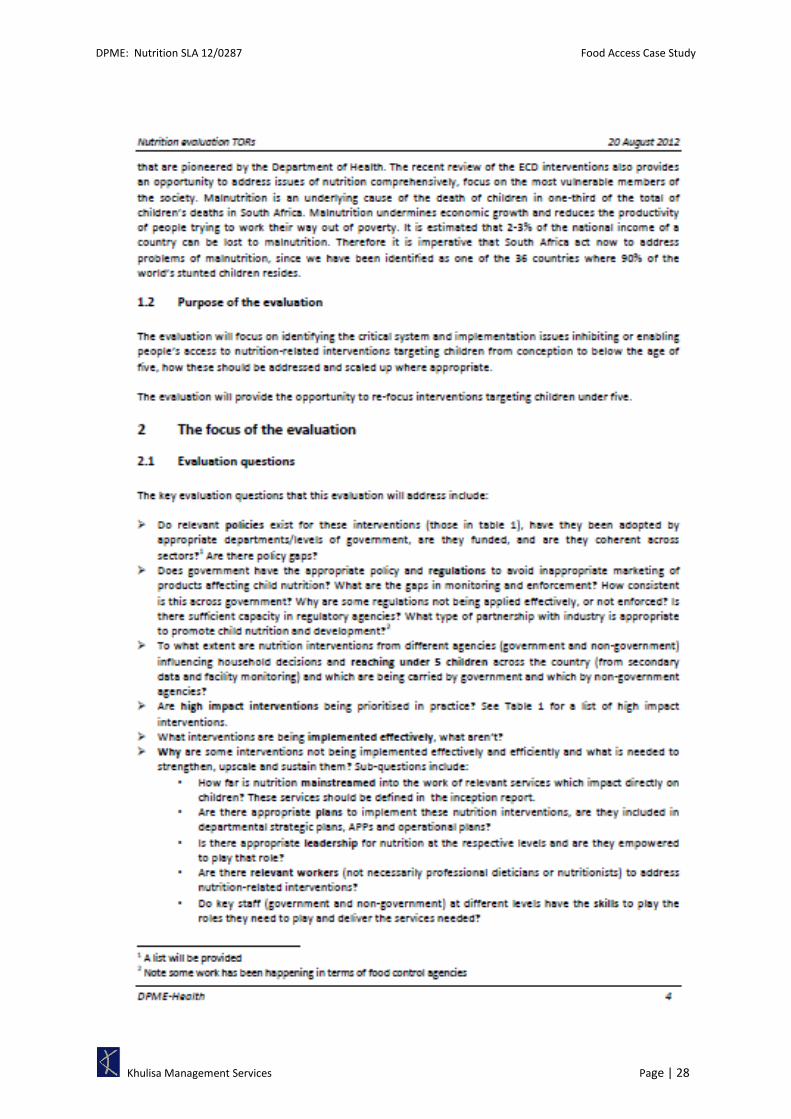
DPME: Nutrition SLA 12/0287 Food Access Case Study
Khulisa Management Services Page | 28

DPME: Nutrition SLA 12/0287 Food Access Case Study
Khulisa Management Services Page | 29

DPME: Nutrition SLA 12/0287 Food Access Case Study
Khulisa Management Services Page | 30

DPME: Nutrition SLA 12/0287 Food Access Case Study
Khulisa Management Services Page | 31

DPME: Nutrition SLA 12/0287 Food Access Case Study
Khulisa Management Services Page | 32
APPENDIX B METHODOLOGY
LITERATURE REVIEW
The starting point for this evaluation was a literature review that provided the context for this
implementation evaluation. The literature review examined the following relevant topics:
1. Current health and nutrition status of children under 5 and pregnant women in South Africa;
2. South Africa’s policy framework on maternal and child nutrition;
3. A review of nutrition policies and interventions from 5 countries that have successfully improved
their nutrition performance (Brazil, Colombia, Malawi, Mozambique, and Malaysia). These
countries were selected by the Evaluation Steering Committee as comparisons to South Africa
based on one of the following two reasons:
the country has similar economic or infrastructure characteristics to South Africa but much
better nutrition performance at a national level (i.e. Brazil, Colombia, and Malaysia), or
the country is geographically proximate to South Africa and thus has similar environmental
and cultural characteristics, but again better nutrition performance (i.e. Malawi and
Mozambique);
4. An analysis of implementation issues present in the literature.
SAMPLING
Before we began fieldwork, the Evaluation Steering Committee identified the geographic areas
where fieldwork was to be carried out and the important subgroups or categories of people to be
sampled. The four stages involved are further described below.
Stage 1: Selection of Provinces
Aside from data collection at national level, the Evaluation Steering Committee identified 4
provinces (purposefully-selected) for the reasons indicated below:
JUSTIFICATION FOR THE PROVINCES SAMPLED
Province Justification
KwaZulu-Natal Its emphasis on community nutrition
Western Cape The general perception that nutrition and health programmes are well implemented in the Western Cape
Free State The general perception that nutrition and health programmes are well implemented in the Free State
Eastern Cape Its unique development profile and its challenges in implementing government programmes
Stage 2: Selection of Districts
In each province, 2 districts were purposefully selected based on their levels of performance (i.e.
high performing and low performing). We obtained recommendations from provincial nutrition
focal persons regarding the names of high-performing districts in their province. Selection of the
poor-performing districts were identified with the Evaluation Steering Committee using the
following criteria:

DPME: Nutrition SLA 12/0287 Food Access Case Study
Khulisa Management Services Page | 33
NDOH score for district’s performance in child health indicators
NDOH pilot districts for implementing the NHI (these tend to be districts with vulnerable
population and have a high burden of disease, and have demonstrated poor performance in
27 socio-economic, health service and financial and resource management indicators).
Rural Development scores for district performance
Agriculture scores for district performance
DSD district performance scores
Two of the poor-performing districts chosen with the Evaluation Steering Committee (in FS and WC)
were revised, with the final sample of districts being presented in the table below.
DISTRICTS INCLUDED IN THE SAMPLE
PROVINCE HIGH PERFORMING DISTRICTS POOR PERFORMING DISTRICTS
District Name Justification District Name Justification
Eastern Cape
Chris Hani
Recommendation from the EC nutrition focal person.
OR Tambo (Umtata)
NHI pilot site Poor Child Health indicator score Poor Rural Development indicator Score
KZN Umgungundlovu
Recommendation from the KZN nutrition focal person.
Umkhanyakude (Mkuze / Jozini)
Poor Child Health indicator score Poor Rural Development indicator Score High poverty levels based on DSD indicators
Free State Thabo
Mofutsanyane
Recommendation from FS nutrition focal person
Fezile Dabi Recommendation from Nutrition Manager in FS province
Western Cape
West Coast Recommendation from WC nutrition focal person.
City of Cape Town
Recommendation from Nutrition Manager in WC province
Stage 3: Selection of Facilities/Organisations
In each district, Khulisa randomly selected 4 health facilities according to their geographic status
(urban/rural), and purposefully selected 4 NGOs that work in food/nutrition. This resulted in a total
sample of 32 health facilities and 16 NGOs as across the 4 provinces.

DPME: Nutrition SLA 12/0287 Food Access Case Study
Khulisa Management Services Page | 34
FIELDWORK LOCATIONS
Stage 4: Selection of Individual Respondents
Key informant respondents were purposefully sampled based on a list of stakeholders provided by
the Evaluation Steering Committee. The sampling strategy for beneficiaries was based on a
convenience sample obtained during site visits to health facilities and NGOs. The method for data
collection in each group in the sample is indicated in brackets in the box below.
Proposed Respondents (and method of data collection)
1) National Level Respondents (in-depth interviews)
National DOH nutrition managers
National DSD managers
National Rural Development food/nutrition managers
National Agriculture food security managers
National ECD managers
Bilateral Donors: USAID, CDC
Multi-lateral Donors: UNICEF, WHO
Relevant local and international health/development organizations:
Relevant food industries
2) Provincial Level Respondents in WC, EC, FS, and KZN (in-depth interviews)
Provincial DOH nutrition managers
Provincial DSD nutrition managers

DPME: Nutrition SLA 12/0287 Food Access Case Study
Khulisa Management Services Page | 35
Provincial Rural Development food/nutrition managers
Provincial Agriculture food security managers
3) District Level Respondents (in-depth interviews or focus group discussions)
District DOH nutrition managers
District DSD nutrition managers
District Rural Development food/nutrition managers
District Agriculture food security managers
4) Health Facility Respondents (in-depth interviews or focus group discussions)
MCH nurse or nursing assistant
Counsellors for pregnant women and/or mothers of young children
Community health workers attached to health facilities
5) NGO Respondents (in-depth interviews or focus group discussions)
Programme or Site Manager
Community workers
6) Beneficiary Respondents (focus group discussions)
Pregnant women and mothers of children under 5 years present at health facilities
Beneficiary participants in NGO programmes
DATA COLLECTION METHODS
Data collection methods used in the evaluation are as follows:
1. Semi-structured Key Informant Interviews
2. Focus Groups with beneficiaries
3. Rapid Performance Assessments of health facilities
4. Assessment of Health Worker Knowledge around nutrition
The figure below summarises the data collection components of the evaluation.
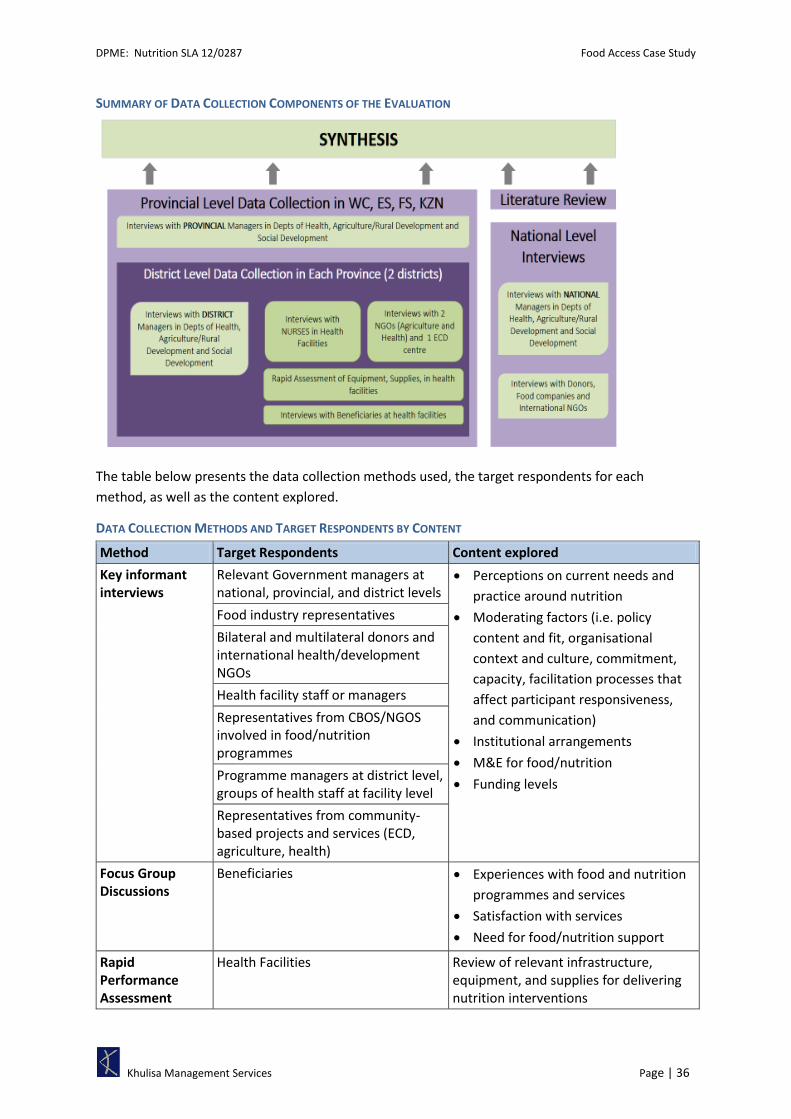
DPME: Nutrition SLA 12/0287 Food Access Case Study
Khulisa Management Services Page | 36
SUMMARY OF DATA COLLECTION COMPONENTS OF THE EVALUATION
The table below presents the data collection methods used, the target respondents for each
method, as well as the content explored.
DATA COLLECTION METHODS AND TARGET RESPONDENTS BY CONTENT
Method Target Respondents Content explored
Key informant interviews
Relevant Government managers at national, provincial, and district levels
Perceptions on current needs and
practice around nutrition
Moderating factors (i.e. policy
content and fit, organisational
context and culture, commitment,
capacity, facilitation processes that
affect participant responsiveness,
and communication)
Institutional arrangements
M&E for food/nutrition
Funding levels
Food industry representatives
Bilateral and multilateral donors and international health/development NGOs
Health facility staff or managers
Representatives from CBOS/NGOS involved in food/nutrition programmes
Programme managers at district level, groups of health staff at facility level
Representatives from community-based projects and services (ECD, agriculture, health)
Focus Group Discussions
Beneficiaries Experiences with food and nutrition
programmes and services
Satisfaction with services
Need for food/nutrition support
Rapid Performance Assessment
Health Facilities Review of relevant infrastructure, equipment, and supplies for delivering nutrition interventions

DPME: Nutrition SLA 12/0287 Food Access Case Study
Khulisa Management Services Page | 37
Method Target Respondents Content explored
Assessment of Health worker Knowledge
Nurses, counsellors, or others providing nutrition services
Knowledge of diagnostic steps and counselling around breastfeeding difficulties, growth faltering, and knowledge of the benefits of micronutrient supplementation
PLANNED VS. ACTUAL DATA COLLECTION
The fieldwork was conducted in 100 of the intended 104 intended locations (96%). The missing
locations include: one national level interview (not conducted because of difficulties in scheduling or
refusals), two district level offices (not interviewed in the Western Cape (DOA for West Coast district
and DOH for City of Cape Town Metro)), and one health facility in the Free State.
As shown in in the table below, 143 interviews and Focus Group Discussions (FGDs) were conducted
across these 100 locations. Half of these were held at Government offices or health facilities, 30%
were Beneficiary FGDs, and the remaining 20% were with NGOs or other (donor representatives,
international agencies, and private companies). Many interviews were conducted with more than 1
respondent, resulting in the total number of respondents being more than 400 people.
Two additional assessments were conducted at health facilities: (i) a rapid assessment of relevant
equipment and supplies for delivery of nutrition interventions, and (ii) an assessment of health
worker’s knowledge around nutrition interventions.
FIELDWORK PLANNED AND ACTUAL
Data Collection Method and Stakeholders Group
No. of Interviews / FGDs Total No. Persons
interviewed Planned Actual %
Individual or Group Interviews
National Government Managers 4 5 125% 7
Representatives of International NGOs 4 7 175% 8
Donors 3 4 133% 5
Private Food Companies 4 4 100% 8
Provincial Government Managers 12 15 125% 22
District Government Managers 24 21 88% 37
Health Facilities 32 31 97% 61
Local NGO 8 8 100% 18
ECD Centre 4 5 125% 12
Focus Group Discussions
Beneficiaries FGDs at health services and community projects
48 40 83% 267
TOTAL 143 140 98% 445
Other Assessments Planned Actual % No. Persons
Reached
Health Facilities Rapid Assessments 40 36 90% --
Health Worker’s Assessment of Nutrition Knowledge
76 132 174% 136

DPME: Nutrition SLA 12/0287 Food Access Case Study
Khulisa Management Services Page | 38
A breakdown of the number of respondents per province can be seen in in the table below.
ACTUAL NO. INTERVIEWS AND FGDS CONDUCTED BY PROVINCE
Western Cape Free State KwaZulu Natal Eastern Cape National Level Total
No. Interviews
/ FGDs
No. Resp.
No. Interviews
/ FGDs
No. Resp.
No. Interviews
/ FGDs
No. Resp.
No. Interviews
/ FGDs
No. Resp.
No. Interviews
/ FGDs
No. Resp.
No. Interviews
/ FGDs
No. Resp.
DOH Mgmt 2 2 4 5 3 4 3 7 1 2 13 20
DSD Mgmt 2 4 5 6 3 7 4 6 2 3 16 26
Ag Mgmt 1 1 3 5 3 7 3 5 2 2 12 20
Donors, companies
-- -- -- -- -- -- -- -- 14 21 14 21
NGOs (local) /ECD
1 1 4 7 4 15 4 7 -- -- 13 30
Health Facilities
8 9 7 7 8 31 8 14 -- -- 31 61
Beneficiary FGDs
7 21 10 69 11 106 12 71 -- -- 40 267
TOTAL 21 38 33 99 32 170 34 110 19 28 139 445
NB: No. Resp = Number of respondents across the interviews and focus group discussions. Because interviews were often conducted with more than one person, the number of respondents is often greater than the number of interviews or FDGs held.
DATA RECORDING AND CAPTURING
During each interview or assessment, the researcher took extensive notes on the instruments
specific to the interview. An interview guide provided researchers with further guidance on when to
probe for answers and when not to. The notes were then captured in Excel for data analysis and
then coded according to themes.
DATA ANALYSIS
Quantitative data collected in the KIIs, FGDs, Health Facilities Rapid Assessments, and Health
Worker’s Assessment of Nutrition Knowledge were analysed using descriptive statistics.
Qualitative data collected under the KIIs and FGDs were analysed using content analysis, from the
notes that had been transcribed into Excel. The following criteria were utilised to determine the
‘reliability and validity’ of the data.
1. Truth value/Credibility: Truth value describes the level of confidence the researcher has
with the truth of the findings based on: research design, informants and context.
2. Consistency/Dependability: Due to the non-experimental and complex nature of qualitative
research, variability is expected and consistency is explained as dependability.
Dependability requires that variability is tracked and explained and informant’s range of
experience from typical to atypical experience explained.
3. Neutrality: Neutrality in qualitative research involves neutrality in relation to data rather
than the investigator.
Once the qualitative notes were checked for reliability and validity, these were coded for themes.
These themes were tabulated and reported on according to the KII and FGD questions.
REPORTS PRODUCED
Case Study reports were prepared for each of the four provinces where fieldwork took place, as well

DPME: Nutrition SLA 12/0287 Food Access Case Study
Khulisa Management Services Page | 39
as for each of the four priority interventions. In all, 11 reports for dissemination prepared for this
evaluation as listed below:
1. Literature Review
2. Breastfeeding Case Study
3. Targeted Supplementary Feeding Case Study
4. Home Gardens Case Study
5. Food Access Case Study
6. KwaZulu-Natal Provincial Case Study
7. Eastern Cape Provincial Case Study
8. Free State Provincial Case Study
9. Western Cape Provincial Case Study
10. Final Evaluation Report
11. Summary of Final Evaluation Report (1-5-25)
LIMITATIONS OF THE EVALUATION
By their nature, qualitative evaluations of policies and programme implementation allow
examination of the broader context, rather than specific measurements of compliance to policy
elements or programmatic guidelines. This evaluation’s extremely broad scope (18 interventions, 17
research questions, and investigation of 6 moderating factors) resulted in very lengthy interviews
with respondents who often had time constraints. Consequently, many respondents gave only
cursory information around the issues that we sought to explore more deeply.
Because nutrition interventions for pregnant women and children under 5 in the health sector far
outweigh the number of nutrition interventions in the social development and agriculture sectors,
the evaluation’s sampling framework is biased toward respondents from health. In addition, at
provincial, district, and local levels, most respondents were able to speak knowledgeably about
nutrition interventions implemented by their specific government department, but few were able to
comment on the adequacy of implementation for interventions outside their sector. Consequently,
data collected from social development and agriculture is sparse compared to that collected from
health, making generalisations on implementation in agriculture and social development more
difficult.
Data collection in the WC was significantly delayed due to the need to secure ethics clearance from
the province before the commencement of field work. This delay led to time constraints on the part
of the researcher which in turn resulted in less complete data for the WC compared to that for the
other 3 provinces.

DPME: Nutrition SLA 12/0287 Food Access Case Study
Khulisa Management Services Page | 40
APPENDIX C References

DPME: Nutrition SLA 12/0287 Food Access Case Study
Khulisa Management Services Page | 41
1 UNICEF. Levels & Trends in Child Mortality. Report 2011. Estimates Developed by the UN Inter-agency Group for Child Mortality Estimation. http://www.unicef.org/media/files/Child_Mortality_Report_2011_Final.pdf.
2 HSRC. South African National Health and Nutrition Examination Survey. 2012. http://www.hsrc.ac.za/en/research-outputs/view/6493 and http://www.hsrc.ac.za/en/research-areas/Research_Areas_PHHSI/sanhanes-health-and-nutrition
3 du Toit, C.D., M. D. Ramonyai, PA Lubbe and V. Ntushelo. Food Security. Directorate Economic Services Production Economics unit. 2011. http://www.daff.gov.za/docs/GenReports/FoodSecurity.pdf
4 Koch, J. The Food Security Policy Context in South Africa. International Policy Centre for Inclusive Growth. UNDP. 2011. http://www.ipc-undp.org/pub/IPCCountryStudy21.pdf
5 DAEA. Formulation Report, Development Co-operation between the Flemish Government and the South-African Government Direct Aid Project 2005-2009. Empowerment for Food Security Programme, KwaZulu-Natal 2005-2009. 2005. http://www.kzndae.gov.za/Portals/0/Rural%20Development/Food%20Security/FINAL%20formulation%20report%20Food%20Security%20-%206%20sept.pdf
6 Mncube, B.V. SASSA re-registration process: SASSA briefing; Zero Hunger Campaign: DSD briefing. 2012. http://www.pmg.org.za/report/20120606-briefing-south-african-social-security-agency-sassa-newly-issued-sass
7 Adapted from DAFF, The Framework for the Zero Hunger Programme -- Actuating the Integrated Food Security Strategy for South Africa. 2012. http://d2zmx6mlqh7g3a.cloudfront.net/cdn/farfuture/i8-Pq-BWhginQQfJ6cVdBMq-uZt5qVgt28pfg0i4vPM/mtime:1381178055/files/docs/120515framework.rtf
8 Shisana O, D. Labadarios, T. Rehle, L. Simbayi, K. Zuma, A. Dhansay, P. Reddy, W. Parker, E. Hoosain, P. Naidoo, C. Hongoro, Z. Mchiza, NP. Steyn, N. Dwane, M. Makoae, T. Maluleke, S. Ramlagan, N. Zungu, MG. Evans, L. Jacobs, M. Faber, & SANHANES-1 Team. South African National Health and Nutrition Examination Survey (SANHANES-1). Cape Town: HSRC Press. 2013. http://www.hsrc.ac.za/uploads/pageNews/72/SANHANES-launch%20edition%20(online%20version).pdf
9 Botha, Y. Progress made in the Implementation of the Zero Hunger Programme: briefing by Department of Social Development, with Minister in attendance. 2013. http://www.pmg.org.za/report/20130319-progress-made-implementation-zero-hunger-programme-briefing-departmen#.UjchSEbYwZk.email
10 DSD. Social Development Zero Hunger Programme. Portfolio Committee on Social Development. 2013. http://d2zmx6mlqh7g3a.cloudfront.net/cdn/farfuture/sYf7krS0AlJ1ZPYc6NIF6TzsAYedI2-CD-JrykwiwXk/mtime:1364285696/files/docs/130319zero.ppt
11 Although Sustainable Livelihoods Programme is not a Food Access intervention, it does deal with dissemination of food to an extent, as the DSD provides financial resources for household food production (i.e. home gardens).
12 Polity. Food Vouchers a Possibility for Poor Households. May 2008. http://www.polity.org.za/article/food-vouchers-a-possibility-for-poor-households-2008-05-05
13 Molifi, J. Interview. 2013
14 Labadarios, D., Mchiza, JR, Steyn, NP, Gericke, G, Maunder, EM, Davids, YD and Parker, W. Food security in South Africa: a review of national surveys. Bulletin of the World Health Organization. 2011;89:891-899. doi: 10.2471/BLT.11.089243.

DPME: Nutrition SLA 12/0287 Food Access Case Study
Khulisa Management Services Page | 42
http://www.who.int/bulletin/volumes/89/12/11-089243/en/
15 South African Government. Social Assistance Amendment Act. 2010. http://www.gov.za/documents/download.php?f=131972
16 South African Government. Social Assistance Amendment Act. 2008. http://www.gov.za/documents/download.php?f=85194
17 South African Government. Children’s Amendment Act. 2007. http://www.gov.za/documents/download.php?f=78580
18 South African Government. Older Person’s Act. 2006. http://www.gov.za/documents/download.php?f=67839
19 South African Government. Children’s Act. 2005. http://www.gov.za/documents/download.php?f=67892
20 South African Government. Social Assistance Act. 2004. http://www.gov.za/documents/download.php?f=67950
21 National Food, Nutrition Policy to End Hunger. Polity.org.za . September 17, 2013 http://www.polity.org.za/article/national-food-nutrition-policy-to-end-hunger-2013-09-17
22 http://www.nda.agric.za/docs/Policy/FoodSecurityStrat.pdf
23 Bowden, Carol. Healthy eating for preschool children. Facilitator’s Guide for DOH and ADSA. 2010. http://www.doh.gov.za/docs/programmes/2010/guide.pdf
24 DSD, Guidelines for ECD Services. 2006. http://www.unicef.org/southafrica/SAF_resources_ecdguidlines.pdf
25 FoodBank SA. Accessed in September 2013: http://www.foodbank.org.za
26 DSD. Annual Report for the year ended 31 March 2012. 2012. https://www.google.co.za/url?sa=t&rct=j&q=&esrc=s&source=web&cd=1&cad=rja&ved=0CCsQFjAA&url=http%3A%2F%2Fwww.dsd.gov.za%2Findex.php%3Foption%3Dcom_docman%26task%3Ddoc_download%26gid%3D389%26Itemid%3D39&ei=Ywo3UraZEoqO7Qb6zgE&usg=AFQjCNF0PFPU0z1vsOwew4QPI_4UtIM7Xg&sig2=vUiHxVhEuL13j0RbkcmqUw&bvm=bv.52164340,d.ZGU
27 Statistics South Africa. Census 2011 Methodology and Highlights of key results. Pretoria: Statistics South Africa. 2012.
28 Harrison, D. The State of ECD in South Africa. 2012. http://www.dgmt-community.co.za/organisations/documents/state-ecd-south-africa
29 Personal Communication with Social Worker A. Kleijn. 19 September 2013.
30 STATS SA. General Household Survey, Forthcoming issue. 2013. http://www.statssa.gov.za/Publications/P0318/P0318August2012.pdf
31 Khulisa Management Services, SAPPPA OVC Performance Assessment, Heartbeat. Data collected December 2012.
32 http://www.tshwane.gov.za/Business/Lists/Tenders/Attachments/211/CB1062012.pdf
33 Shoprite Holdings Limited. Feeding Programme. http://www.shopriteholdings.co.za/Sustainability/CommunityEngagement/Pages/Feeding-Programme.aspx
34 Biersteker, L. Early Childhood Development Services: Increasing access to benefit the most vulnerable children. South African Child Gauge 2012. http://www.ci.org.za/depts/ci/pubs/pdf/general/gauge2012/ecd.pdf

DPME: Nutrition SLA 12/0287 Food Access Case Study
Khulisa Management Services Page | 43
35 World Bank. Food and Nutrition Security. Brief for Rio 20+ A Framework for Action, Sustainable
Development. 2012. http://www-wds.worldbank.org/external/default/WDSContentServer/WDSP/IB/2013/07/16/000356161_20130716161915/Rendered/PDF/793350BRI0RioF00Box037737400Public0.pdf


![Franklins Pty Ltd v Metcash Trading Ltd [2009] NSWCA … · Franklins Pty Ltd v Metcash Trading Ltd ... Franklins Pty Ltd v Metcash Trading Ltd [2009] NSWCA 407 FILE NUMBER ... ET](https://cdn.vdocuments.site/doc/165x107/5af3ebe97f8b9a4d4d8ce24d/franklins-pty-ltd-v-metcash-trading-ltd-2009-nswca-pty-ltd-v-metcash-trading.jpg)


![TBK Beef Pty Ltd v Ark Mangoes Pty · PDF fileTBK Beef Pty Ltd v Ark Mangoes Pty Ltd [2012] NTSC 44 PARTIES: TBK BEEF PTY LTD v ARK MANGOES PTY LTD TITLE OF COURT: SUPREME COURT OF](https://cdn.vdocuments.site/doc/165x107/5a730b347f8b9ab6538e2881/tbk-beef-pty-ltd-v-ark-mangoes-pty-ltd-tbk-beef-pty-ltd-v-ark-mangoes-pty-ltd.jpg)

