
KEO Discussion Paper No.140
Revisiting Complementarity between Japanese FDI
and the Import of Intermediate Goods:
Agglomeration Effects and Parent-firm Heterogeneity
Tadashi Ito, Toshiyuki Matsuura, Chih-Hai Yang

1
Revisiting Complementarity between Japanese FDI and the Import of
Intermediate Goods: Agglomeration Effects and Parent-firm Heterogeneity
Tadashi Ito
Gakushuin University
Toshiyuki Matsuura
Keio University and KU Leuven
Chih-Hai Yang
National Central University
Abstract
The concern regarding the hollowing out by FDI has re-emerged in Japan, with both large
and small firms relocating their plants to China since the late 1990s. This study sheds lights on
the effects of agglomeration and firm characteristics upon the complementary relationship
between FDI and import of intermediate input from home country, which has been overlooked
in the literature. Estimating the duration model of Japanese affiliates’ input trade by using
parent–affiliate, product-level data from 2000 to 2006, we found while firms in agglomerated
regions with more foreign affiliates shorten its duration, small firms import for a longer
duration. (100 words)
Keywords: FDI by SMEs, Trade duration, Intermediate goods, Agglomeration,
JEL classifications: F14, F21, F23
This study is based on a report of Yang’s visiting research project at the Institute of Developing Economies (IDE),
JETRO, in 2015. We thank Ayako Obashi, Kozo Kiyota and other seminar participants at the University of British
Columbia and the annual conference of the Japanese Economic Association for their helpful comments. We also
thank Toyojiro Maruya for providing the data for the procurement pattern of Japanese affiliates in China. Yang
gratefully acknowledges financial support from IDE-JETRO. The study is also conducted as part of an economic
analysis of trade policy and trade agreements at IDE-JETRO. This paper utilizes the data constructed under the
auspices of JSPS KAKENHI Grant Numbers JP26380311 and JP26285058. Matsuura and Yang appreciate the
financial support from the Interchange Association, Japan.

2
1. Introduction
When China symbolically joined the world trading system by becoming a member of the
World Trade Organization (WTO) in 2001, Japanese firms dramatically increased their foreign
direct investment (FDI) flows to China, surpassing Japan’s largest trade and investment partner,
the United States (US) by 2005. Large enterprises as well as small and medium-sized
enterprises (SMEs) set up their plants in China. As Table 1 shows, the share of SMEs
(companies with less than 300 employees) has steadily increased over the past few decades.
In particular, the share of firms with less than 1,000 employees accounts for 47.7% of the firms
that began investing after 2001. The relocation of SMEs, which employ the majority of the
Japanese labor force, to foreign countries, including China, has revived concerns of the
hollowing out of the local economy in Japan.
[Insert Table 1 approximately here]
This study provides some stylized facts to contribute toward better debates on the hollowing
out issue and, from a dynamic perspective, analyzes the duration of intermediate goods trade
when it is accompanied by an increase in FDIs by using a unique parent–firm–affiliate,
product-level dataset for the 2000–2006 period. More specifically, we investigate the effects
of firm characteristics and agglomeration on the FDI-trade complementarity.
This study is structured as follows. Section 2 briefly review the literature and sectin3
describes the data sources and demonstrates several important stylized facts about the

3
dynamics of intermediate goods trade. Section 4 presents the empirical specifications. Section
5 explains our estimation results. Section 6 discusses these results. The final section
summarizes our concluding remarks.
2. Literature
The hollowing-out effect of FDIs has long been debated in the international trade literature,
often centering on whether FDIs are substitutes or complements of exports. Brainard (1993,
1997) argued that FDIs and exports are substitutes because of the trade-off between proximity
and concentration. When the production function is characterized by increasing returns to scale,
a firm can benefit from lower costs by concentrating all of its production in one plant, but it
incurs trade costs, such as transportation costs or import tariffs, to serve foreign markets
through exports. However, by setting up a plant in each market, a firm can save on trade costs,
but it loses any cost reductions gained through scale effects. Thus, this trade-off determines if
a firm exports or invests to serve its foreign demand.
Complementarity may arise in a vertical production relationship. When an assembly
company relocates its plant to a foreign country, the company that has supplied parts and
components to the assembly firm now starts to export to the assembly firm’s foreign plant. The
same can be said for operations within the same firm. Specifically, when a firm “unbundles”
its production stages and relocates a stage to a foreign country, the parent-firm exports inputs
(typically, parts and components) to its affiliate plant abroad. The recent development of global

4
supply chains has brought this type of FDI to the fore. Head and Ries (2001) found a
complementary relationship for the case of Japanese manufacturing firms. Similar findings are
obtained by Chen and Ku (2000) for Taiwan, Clausing (2000) for US, Eaton and Tamura (1994)
for Japan and US, and Pfaffermayr (1996) for Austria. Hanson et al. (2005) examined trade in
intermediate inputs for further processing between parent firms and their foreign affiliates
using firm-level data on US multinationals and found that demand for imported inputs is higher
when affiliates face lower trade costs, lower wages for low-skilled labor, and lower corporate
tax rates.
There are still several concerns that the complementary relationship between FDIs and
exports may not last long. First, as mentioned above, recent FDI flows to China have been
mainly driven by SMEs, in which many of them are single-product firms. If it is difficult for
SMEs to “unbundle” their production stages, exports from the parent SMEs to their foreign
affiliates may not increase. Second, FDI flows to China tend to concentrate on the coastal areas,
which mean that the multinational enterprise (MNE) affiliates in China have formed
agglomerations in some coastal regions. Agglomerations of foreign firms may attract domestic
suppliers to seek transactions with MNE affiliates. Therefore, once an agglomeration of
suppliers develops, the MNE affiliates may reduce imports of intermediate goods from the
home country. Third, as Belderbos et al. (2001) and Kiyota et al. (2008) demonstrated, MNE
affiliates tend to increase local procurement as they accumulate experience in the local market.

5
These results imply that imports from the home country may gradually be substituted with the
passage of time. In other words, the choice between imports from the home country or
purchases from local suppliers may also change over time. Thus, the complementary
relationship should be examined from a dynamic perspective.
Pioneering works on dynamic trade relationships can be traced to Besedes and Prusa (2006a,
2006b). Employing a survival analysis to a study of the duration of US imports, they found
that the median duration of exporting a product to the US is very short—typically two to four
years. They further examined the extent to which product differentiation affects the duration
of the US import-trade relationship. Applying the Cox proportional hazard model to conduct
empirical estimations, they estimated the hazard rate to be at least 23% higher for
homogeneous goods than for differentiated products. Obashi (2010) examined whether the
duration of intermediate goods trade is longer than that for the usual transactions of goods
within East Asia because of the relation-specific nature of the international fragmentation of
production. A series of survival analyses provided evidence that the stability of international
production networks is a particularly prominent feature of East Asia. In addition, East Asian
countries are more likely to engage in lasting trade relationships of intermediate goods with
each other than with outsiders. Shao et al. (2012) focused on China’s manufacturing exports
at the six-digit harmonized system (HS) code product from 1995 to 2007 to isolate the factors
affecting export duration. Their results show that export durations tend to be rather short-lived.

6
Crucially, the duration is longer for differentiated products and parts and components,
highlighting the stability of intermediate goods trade resulting from international production
fragmentation, as indicated by Obashi (2010).
Building on the previous literature about trade duration, we incorporate the FDI–trade
nexus, which helps us better understand the hollowing-out effect of FDIs. More specifically,
we study what kind of firms are more likely to continue to import intermediate goods from the
home country and what kind of intermediate goods imported from the home country are less
likely to be substituted for local procurement, which are questions that could not be addressed
by the product-level trade data or firm-level data used in the previous studies. Our parent–
affiliate–transaction matched panel dataset enables us to explore these issues in a dynamic
perspective, and furthermore, we are able to calculate the quantitative sizes of impacts on trade
duration and identify which factors contribute the most.
3. Data Sources
This study focuses on the stability of intermediate goods trade between Japanese affiliates
in China and their parent companies. To do this, we construct a unique parent-affiliate-
transaction panel dataset, covering 929 Japanese affiliates in China from 2000 to 2006. This
section describes how the dataset was constructed.
The first data source is China’s Annual Survey of Industrial Firms (CASIF), which is
conducted by the National Bureau of Statistics (NBS) of China and consists of the total
population of firms with sales above RMB 5 million, the so-called “scale-above” enterprises.

7
It covered 162,885 firms in 2000 and 301,961 firms in 2006. This dataset provides abundant
information such as company name, location, type of ownership, sales, output, capital, labor
and intermediate input. In the dataset, each firm reports its ownership type; viz., state-owned
enterprises, private-owned enterprises, and foreign-owned enterprises (FOEs)1 Unfortunately,
nationality information for the FOEs is unavailable, preventing us from differentiating
Japanese affiliates from those of other countries.
The second data source is the Toyo Keizai’s Overseas Japanese Companies Data (Kaigai
Shinshutsu Kigyo Soran). Toyo Keizai’s survey on outward FDIs primarily covers foreign
subsidiaries with a 20% or higher Japanese ownership. Crucially, the Japanese foreign
affiliates in China covered in this survey have information about their Chinese names and
addresses, enabling us to link them to the CASIF database and thereby access the dataset of
Japanese affiliates.
We link the aforementioned compiled dataset to two more data sources. One is the China
Customs data, which contains detailed information on each transaction, including the eight-
digit HS code for trading products, product unit, quantity, unit value of each eight-digit HS
product, total value, import origin, export destination, and type of trade. As firm identification
numbers are different in the CASIF and Customs data, we use the affiliates’ Chinese names to
match the two datasets for information on the Japanese affiliates’ imports of intermediate
1 FOEs include Hong Kong-, Macao-, and Taiwan-owned firms (HMTs) and other foreign-owned firms.

8
goods. In order to focus on the imports of intermediate goods in this study, we exclude the
imports of final goods, which are identified by the Broad Economic Category (BEC)
classification.2
To consider the parent-firm characteristics, we complement Toyo Keizai’s survey with the
TSR database, since Toyo Keiza’s survey only has limited information on parent firms (e.g.,
name of company and location). The Tokyo Shoko Research (TSR) Data is one of the largest
databases compiled by a private company and it records both listed and non-listed companies
in Japan. It gives several facts about each firm, including the year of establishment, the paid-
up capital, and the current number of employees.
4. Empirical Specification and Data Overview
4.1 Empirical Specification
The semi-parametric Cox proportional hazards model has been widely used (see Besedes
and Prusa, 2006a, 2006b; Brenton et al., 2010; and Obashi, 2010) to investigate the
relationship between the duration of intermediate goods imports and its determinants.
However, a recent study by Hess and Persson (2012) argued that the Cox model is
inappropriate for analyzing the duration of a trade relationship. For example, given that trade
2 We define transport equipment, except for parts and components (51 and 52), as well as durable, semi-
durable, and non-durable consumer goods (61, 62, and 63) as final goods.
9
duration refers to the number of years such a relationship continues, we observe that many
trade durations are of equal length. The many tided trade durations might cause asymptotic
bias in the estimated coefficients. Hess and Persson (2012) thus proposed using a discrete-time
hazard model instead of the continuous-time Cox proportional hazard model.
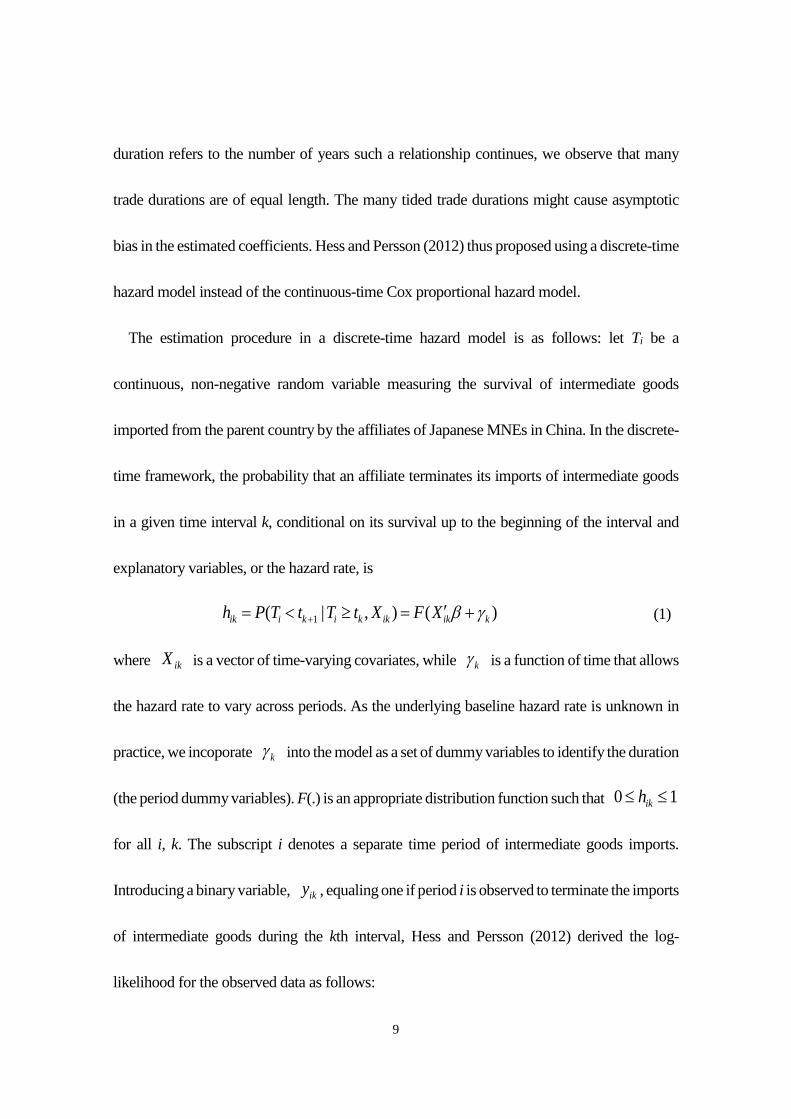
The estimation procedure in a discrete-time hazard model is as follows: let Ti be a
continuous, non-negative random variable measuring the survival of intermediate goods
imported from the parent country by the affiliates of Japanese MNEs in China. In the discrete-
time framework, the probability that an affiliate terminates its imports of intermediate goods
in a given time interval k, conditional on its survival up to the beginning of the interval and
explanatory variables, or the hazard rate, is
)(),|( 1 kikikkikiik XFXtTtTPh (1)
where ikX is a vector of time-varying covariates, while k is a function of time that allows
the hazard rate to vary across periods. As the underlying baseline hazard rate is unknown in
practice, we incoporate k into the model as a set of dummy variables to identify the duration
(the period dummy variables). F(.) is an appropriate distribution function such that 10 ikh
for all i, k. The subscript i denotes a separate time period of intermediate goods imports.
Introducing a binary variable, iky , equaling one if period i is observed to terminate the imports
of intermediate goods during the kth interval, Hess and Persson (2012) derived the log-
likelihood for the observed data as follows:

10
])1ln()1()ln([ln1 1
n
i
ik
k
k
ikikik hyhyLi
(2)
This is similar to a standard log-likelihood function for a binary panel regression model.
Assuming the functional form for the hazard rate to be a normal, logistic, or extreme-value
minimum distribution, it will lead to a probit, logit, or cloglog (complimentary log-log) model,
respectively. The cloglog model with period-specific intercepts represents the exact grouped-
duration analog of the Cox proportional hazard model (Hess and Persson, 2012).
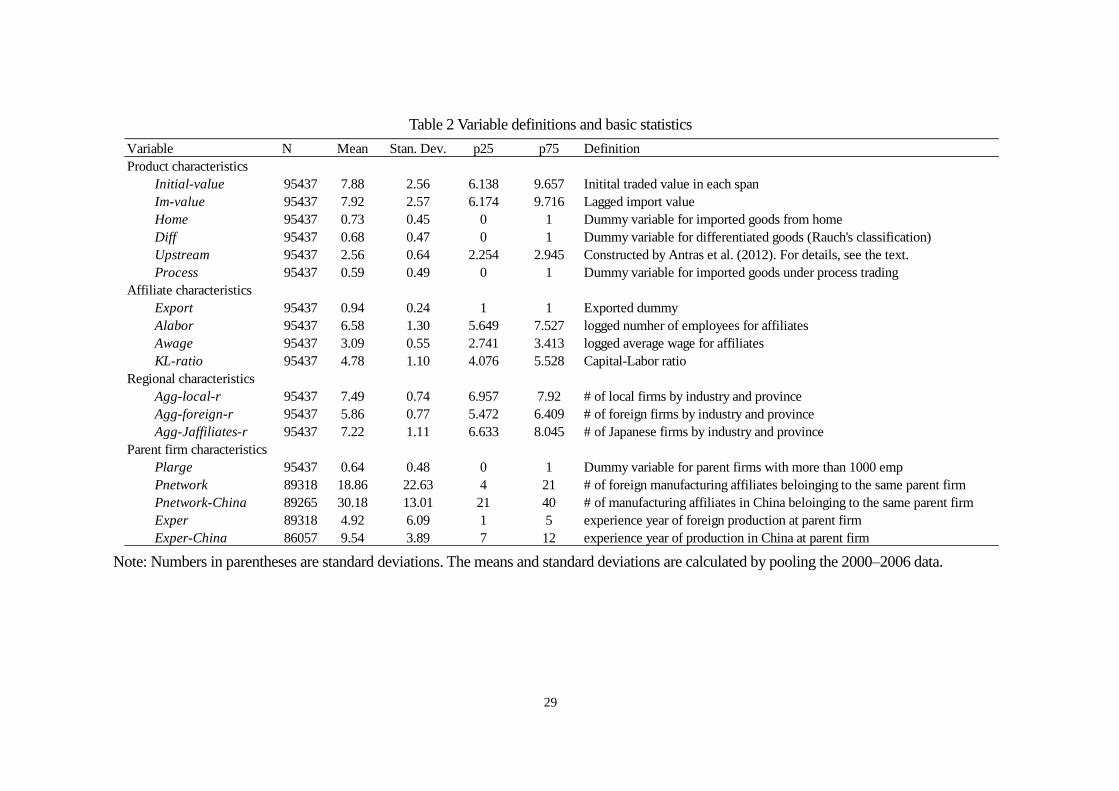
4.2 Definition of variables
The vector X for the hazard function (1) consists of three dimensions: affiliate and product
characteristics, regional characteristics (agglomeration), and parent-firm characteristics. For
the affiliate characteristics, affiliate size (Alabor) is measured by the logarithm of the number
of workers. A large affiliate generally needs a range of intermediate goods and some of them
have to be imported, suggesting a longer duration. Thus, a negative coefficient is expected
to be associated with this variable. The terms Awage and KL-ratio refer to the logarithm of
the total wage bill per worker and the capital-to-labor ratio, respectively. The exporter
dummy (Export) takes the value one if an affiliate engages in export. Most Japanese affiliates
in China undertake industrial processing for exports, suggesting that they need to import
intermediate goods, which translates into longer trade durations.

11
For product characteristics, we include five variables.3 The first is Im-value, which is the
logarithm of lagged import value. It is expected to be associated with a negative coefficient
because import goods with larger value are more difficult to be replaced with local
procurement in the short term.4 Second, we include Diff, which takes the value one if the
products are categorized as differentiated goods, and zero otherwise. The definition of
differentiated goods is per Rauch’s (1999) commodity classification.5 Differentiated goods
are expected to be more likely to survive, because differentiated goods display more complex
technologies. They are thus less easily substitutable by local supplies. Third, to control for
product characteristics in the global value chain, we use the upstreamness index (Upstream).
The concept of an upstreamness index was proposed by Antràs et al. (2012) and it measures
how far an industry is from final consumption. An industry whose output is used mainly as an
intermediate input for other industries is considered to be relatively upstream.6 Since these
products are required by other relatively upstream industries, they embody a higher degree of
technological content. Again, these products are less likely to be substituted for local
3 Since we use product-level data, one may be interested in the effect of tariff. Actually, as shown in Table
2, a majority of our observations are classified as “process trading,” which is not under the effect of tariff.
We believe the effect of tariff may be limited. One way to inculpate this effect is to include product-year
(period) fixed effect. We confirmed the robustness of the results including product-period fixed effect. 4 In previous studies, such as Besedes and Prusa (2006a, 2006b) and Obashi (2010) use the initial value of
import, namely the import value in the first year instead of lagged import value. We confirmed our results
do not change even if we replace lagged import value with the initial value of import. 5 Rauch (1999) classifies products traded on an organized exchange as “homogeneous goods” and
products that are not sold on the exchanges, but whose benchmark prices exist, as “reference priced.” We
treat all other products as differentiated goods. 6 For a detailed definition of the upstreamness index, please see the supplemental appendix in Antràs et al.
(2012).

12
procurement, leading to a longer trade duration. Fourth, the home dummy (Home) equals one
if an affiliate shows a positive value for intermediate goods imported from Japan. As Japan is
one of the world’s leading countries in technology, it is difficult to replace its intermediate
goods with local supplies, meaning that trade with the home country should have a longer
duration than that with other countries. Lastly, we include “process trading” (Process), which
takes the value one if the products are included under process trading. In the Chinese Custom
data, exports can be classified into processing exports and ordinary exports. Processing exports
means that the products exported are made using imported inputs to assemble the final goods.
One of the features of process trading is that it enjoys zero tariffs for the imported intermediate
goods.7 The dummy variable, Process, takes the value one if the intermediate goods are
imported under a process trading scheme, otherwise zero.
Variables capturing the regional characteristics are our key variables. We consider three
regional agglomeration variables. A widely defined agglomeration is the number of local
firms in the same industry in the same region (Agg-local-r). Under the condition of high
transportation costs, the products of local firms can replace the imported ones, leading to a
negative influence on the duration of trade. Two more narrowly defined agglomeration
variables are Agg-foreign-r and Agg-Jaffiliates-r, denoting the number of foreign affiliates
7 For details of process trading, see Yu (2014).

13
(including Japanese affiliates) in the same industry in the same region, and the number of
Japanese affiliates in the same industry in the same region.
As for variables for parent-firm characteristics, we include a size dummy of the parent firm
(Plarge) that equals one if the parent firm has 1,000 employees or more.8 And to examine the
MNEs’ own production networks, we also control for the number of foreign manufacturing
affiliates worldwide or in China that belong to the same parent firm (Pnetwork and Pnetwork-
China) or for the years of experience in managing production for each MNE (Exper and Exper-
China). Table 2 summarizes the variable definitions and basic statistics.
[Insert Table 2 approximately here]
4.2 Data Overview
Before starting our econometric analysis, we provide a brief overview of the sample firms
and their imports of intermediate goods. Figure 1 shows the share of local procurement and
imports in total procurement by Japanese MNEs affiliates in China from 1995 to 2007, as
derived by Maruya (2007). The imports from Japan used to be a major source of the
procurement of Japanese affiliates in China. However, while the share of imports from Japan
has gradually decreased from 50% to 30%, that for local procurement has increased from 30%
8 The legal definition of SMEs in Japan is firms with 300 or more employees or whose paid-in capital is
more than 3,000 million yen. However, we define large firms as those firms with more than 1,000 employees
following the definition used in some labor statistics, such as the Census of Wage Structure by the Ministry
of Health, Labor, and Welfare of Japan. The other reason is that the share of firms with fewer than 300
employees is quite limited. As shown in Table 1, it is slightly more than 20%. The estimation results are
qualitatively the same and quantitatively very similar, even if we use different thresholds for the parent firms’
number of employees; namely, 300 or 500.

14
to 50%. At the same time, the share of imports from countries other than Japan has also
decreased from 20% to 10%. These facts suggest that MNE affiliates in China have gradually
substituted their imports for local procurement.
[Insert Figure 1 approximately here]
Table 3 shows the regional distribution of Japanese affiliates in China. Two things are
noteworthy. First, almost all Japanese affiliates are located in the coastal areas—the Bohai
economic zone, the Yangtze River Delta, and the Pearl River Delta. These areas represent 96%
of the regional distribution of Japanese affiliates in China. Second, of these coastal areas, the
Yangtze River Delta area accounts for 49% of the Japanese affiliates. Moreover, 26% of the
affiliates in China are located in Shanghai. These facts suggest that the Japanese affiliates in
China form a dense agglomeration in these areas.
[Insert Table 3 approximately here]
Table 4 compares product and affiliate characteristics by parent-firm size. As for product
characteristics, while Diff, and Im-value are higher for large firms; Home, Upstream and
Process are larger for SMEs, suggesting that SMEs in China import more “upstream”
intermediate goods from Japan and engage more actively in process trading. Looking at
affiliate characteristics, those affiliates owned by large firms are, on average, larger in terms of
the number of employees, pay higher wages, and have a higher K-L ratio. In contrast, affiliates
owned by SMEs tend to be more active in terms of export activities.

15
[Insert Table 4 approximately here]
5. Empirical Results
5.1 Baseline Model
What determines the duration of imported intermediate goods for Japanese-owned
enterprises in China? Based on product-level data of the eight-digit HS code, the results of
the estimations using the discrete-time hazard rate of a probit model are reported in Table 59.
Column (1) and column (2) show the benchmark models comprising product and affiliate
characteristics. While column (1) uses whole sample, we focus on import from home country
in column (2).
[Insert Table 5 approximately here]
As for the influence of product characteristics, some interesting findings are contained in
the various estimations. The coefficient for the logarithm of the import value in year t-1
(Import-value) is statistically significant with a negative sign, suggesting that the larger the
trade value in year t-1. Crucially, we find a significantly negative coefficient of the variable
Home, indicating that, if intermediate goods are imported from Japan, the trade relationship
survives longer than in the case of imports from other countries. Japan is at the forefront of
technology and possesses outstanding capability in producing many key parts and components.
9 We employ various techniques of discrete-time survival models such as the cloglog model, the random-
effect model probit, and the randome effect logit model. We confirm that all estimates are very similar. Due
to space limitation, we do not report these results but these tables are provided upon readers’ request.
16
Thus, intermediate goods imported from Japan are not easily substitutable through local
procurement, so the decline is slower in terms of the hazard rate.
The coefficient for Diff is negative and significant, meaning that the traded goods’
characteristics matter to the trade duration. The differentiated products (Diff) dominate other
product types in terms of their survival rates, which last longer for the Japanese affiliates.
Moreover, as the estimated coefficient for Upstream is significantly negative, this suggests that,
if an industry is located upstream across industries (i.e., selling a disproportionate share of its
output to the relatively upstream industries), its hazard rate is lower and has a longer trade
duration. The fragmentation of production across national boundaries is a distinctive feature
of the Asian production network (Athukorala and Yamashita, 2006). Thus, production in
developing countries entails the sourcing of inputs and components from multiple suppliers,
particularly from their home countries. That an industry’s output is required by other relatively
upstream industries implies a higher degree of technological content embodied in their
products, thereby making its replacement through local procurement difficult. The above
findings are consistent with existing product-level studies such as Besedes and Prusa (2006a,
2006b) and Obashi (2010). Another interesting phenomenon is that, if imported goods are used
for process trading (Process), they experience a lower hazard rate; that is, they survive for a
longer period. This result can be attributed to the specific export-promoting measures adopted
by the Chinese government that allow the firms undertaking process trade to enjoy zero tariffs

17
on their imported inputs. This induces exporters to continue importing intermediate goods for
the assembly of exports in order to remain eligible for zero import tariffs.
Turning to affiliate characteristics, which are not examined in the extant literature, while the
coefficient for Export is negative but not significant, the variables Alabor, Awage, and KL-
ratio show significantly positive coefficients, suggesting that larger affiliates, which pay higher
wages to employees and are more capital intensive, tend to show a shorter duration of
intermediate goods imports. Large and capital-intensive Japanese affiliates tend to establish
local production networks and purchase inputs from local (Chinese-owned or foreign-owned)
suppliers, thereby experiencing a shorter duration of intermediate goods imports.
In columns (2), we restrict our sample to imports from Japan. Basically, our results do not
change much. As indicated in Table 6, the sample size in columns (2) is 70% of that in
columns (1). This may imply that our results are mainly driven by imports from Japan.
Therefore, we use the sample for imports from Japan in all of our remaining estimations.10
As mentioned earlier, the agglomeration of suppliers may affect the procurement patterns
of Japanese affiliates because they can purchase their intermediate goods locally if local
suppliers, either local firms or other foreign affiliates, can supply qualified commodities. How
does regional agglomeration affect the duration of the intermediate goods trade? Column from
10 One may be interested in whether the results change or not if we include imports from all countries in the
following estimations. We confirm that the results do not change. The results are provided at the reader’s
request.

18
(3) through (4) in Table 5 report the results by including the agglomeration variable and
excluding the province fixed effect.11
Using the number of local firms within an industry and region (Agg-local-r) as a measure
of agglomeration, the estimates in column (4) show that the agglomeration variable has a
positive and significant coefficient. Recognizing the importance of innovation, China has been
implementing various policies to encourage innovative activities since the late 1990s, aimed
at transforming the economy into a knowledge-based one and catching up with the developed
countries in technological capability.12 With this technological upgrading in China, local firms
can gradually produce qualified parts and provide them to the MNE affiliates, including
Japanese affiliates, in China. Thus, in a region with more local firms in terms of numbers or
sales, the Japanese affiliates exhibit a higher hazard rate to stop importing intermediate goods.
Correspondingly, the procurement of intermediate goods for Japanese affiliates can come
from other foreign affiliates in China. Using the number of foreign firms to measure the degree
of agglomeration (Agg-foreign-r), the estimates in column (4) show that within a region with
more foreign affiliates, the Japanese affiliates located there tend to have a shorter duration for
importing intermediate goods. Foreign affiliates overall have superior technological
11 We construct the agglomeration variable by region (Bohai, Yangtze River Delta, Perl River Delta, Central
region, West region, and North East region). However, some firms may transact with firms locating within a
province. As a robustness check, we used the agglomeration variable by province and confirmed that the
results do not change so much. These estimation results are provided upon readers’ request.. 12 China’s R&D intensity (R&D expenditures-to-GDP ratio) has tripled from 0.57% in 1996 to 1.70% in
2009.

19
capabilities and Japanese affiliates might acquire their needed intermediate goods from other
affiliates, thereby reducing imports. Similarly, for Japanese affiliates located in a region with
many other Japanese-owned enterprises (Agg-Jaffiliates-r), their imports of intermediate
goods have a shorter duration, as shown in column (5). This finding is reasonable because they
may prefer acquiring intermediate inputs from other Japanese affiliates, if available.
5.2 Does the Duration in the Trade of Intermediate Goods Differ according to Parent-firm Size
and Production Network?
In Table 6, we examine the impact of parent-firm characteristics. In column (1), we include
the variable for parent-firm size, Plarge. We find that its impact is positive and significant,
suggesting that SMEs tend to experience longer trade durations than those for large firms.
Turning to the variables for MNE production networks or the experience of foreign
production, more striking results emerge, which are presented in columns (2)–(5) in Table 6.
The MNE production network variables, both Pnetwork and Pnetwork-China, are associated
with significantly positive coefficients, as shown in columns (2) and (3). Large Japanese
MNEs, such as Toyota and Hitachi, have numerous foreign affiliates in China and other
Southeast Asian countries that specialize in producing parts or assembly work and support the
production needs of one another. Their affiliates in China thus substitute imported intermediate
goods by procuring products from other affiliates belonging to the same parent firm.
20
Alternatively, Japanese affiliates owned by SMEs generally find it difficult to access their own
production networks and continue to import needed intermediate goods from abroad, thereby
showing a longer duration.
[Insert Table 6 approximately here]
Another parent-firm characteristic that potentially affects the affiliates’ hazard rates of
intermediate goods imports is FDI experience. The variables Exper and Exper-China, shown
in columns (4) and (5), denote years of experience of foreign production and years of
experience of production in China by a parent firm, respectively. We find that for parent firms
with more FDI experience, their affiliates in China tend to exhibit a shorter period of importing
intermediate goods; that is, there is a higher hazard rate. This is probably because MNEs learn
more about local or foreign suppliers as their experience of foreign production increases. Firms
that have more years of foreign production experience are more likely to substitute their
imports of intermediate goods for local procurement.
In sum, we find that the duration of the imports of intermediate goods by SMEs is longer
than that by large firms. Furthermore, firms with their own large production networks and
greater experience of foreign production induce decreases in the imports of intermediate goods.
As SMEs usually have only a few foreign affiliates and their experience of foreign production
is limited, their trade duration might be shorter than that of large firms. This fact implies that
trade in intermediate goods from Japan to China will continue to increase when considering

21
the fact that recent FDI is mainly driven by SMEs.
6. Discussion
While agglomeration has a positive impact on the hazard rate of intermediate goods imports
in our estimation results, FDI by SMEs has a negative impact on the probability of the
termination of trade-transaction ties. One may be interested in which of the agglomeration or
parent-firm characteristics are more influential in the duration of trade for intermediate goods.
To measure the quantitative size of the impact of the determinants in our survival model, we
calculate how much the predicted probability would change if the firm or regional
characteristics changed. Figure 3 illustrates the predicted probability and the impact of changes
in attributes, based on the results in column (2) in Table 6. Our baseline predicted probability
of the termination of imports is calculated for those products that are differentiated (Diff=1),
traded by large firms (Plarge=1), and exported by affiliates (Export=1). For other products and
parent-firm and regional attributes, we use average values in our sample.
[Insert Figure 2 approximately here]
As for agglomeration, a change of one standard deviation of the agglomeration variable
increases the predicted probability from 26.8% to 28.2% compared with the predicted
probability of the baseline. A change of one standard deviation of the agglomeration variable
is almost equivalent to the change in average value of the agglomeration variable from 2000

22
to 2006. Therefore, this change in predicted probability (28.2% − 26.8% = 1.4%) can be
considered as the contribution of changes in agglomeration over the period. Next, looking at
the contribution of SMEs (plarge = 0), the difference in predicted probability between large
firms and the SMEs is only 0.5% (= 26.8% − 26.3%). However, recall that product and affiliate
characteristics differ according to parent-firm size, as discussed in Table 5. For example, the
imported goods by SMEs have a higher value for Upstream and engage more in process
trading. Similarly, the affiliates owned by SMEs are smaller in terms of the number of workers
and have lower K-L ratios. Since these characteristics lower the probability of the termination
of trade-transaction ties, imported goods by the SMEs may have lower predicted probabilities.
We calculate the predicted probability for the products with average SME attributes and
average large firm attributes. In this case, the difference between the SME and large firms is
1.7% (= 27.4% − 25.6%). Therefore, the contribution of FDI by SMEs slightly exceeds that
of agglomeration.
7. Concluding Remarks
The concern regarding the hollowing out of the domestic economy by outward FDI flows
has re-emerged in Japan, with both large and small firms relocating their plants to China since
the late 1990s, in line with the development of global production fragmentation. This study
provides some facts to contribute toward better debates on this issue and, from a dynamic

23
perspective, analyzes the duration of intermediate goods trade when it is accompanied by an
increase in FDIs by using a unique parent–firm–affiliate, product-level dataset for the 2000–
2006 period.
This study focus on the roles of products, affiliates, or parent-firm characteristics and
agglomerations. Estimates obtained from the discrete-time hazard model show that
intermediate goods, such as differentiated goods and products that belong to upstream
industries, survive for a longer time, which is consistent with previous studies. Intermediate
goods imported from Japan have a stronger impact on lowering the hazard rate, suggesting
they contain sophisticated technologies and are thus less easily substitutable by local
procurement. Using various measures of agglomeration indicators, we consistently find a
positive relationship between agglomeration and the hazard rate of intermediate goods imports.
As for parent-firm characteristics, we find that SMEs tend to engage in longer trade
relationships. Moreover, the parent firms’ foreign production networks and greater foreign
production experience are found to reduce the duration. These findings also suggest that SMEs,
which usually do not have foreign production networks, tend to continue importing
intermediate goods from their home country. Finally, we calculate the quantum of the impact
of the determinants of our survival model. We find that the difference in predicted probability
between SMEs and large firms is slightly larger than the changes in predicted probability due
to increases in agglomeration.

24
Although this study provides interesting insights, there remain various issues to be studied
in future research. For example, how does the termination of transaction ties affect the
Japanese parent firms’ performances? From policymakers’ viewpoint, the effect on domestic
employment may be an important agenda. Another issue is to distinguish the difference
between arm’s-length trade and intra-firm trade. Recent studies, such as those by Ramondo et
al. (2016), have shown that the MNE firms that engage in intra-firm trade are heavily
concentrated within the large MNE category. Exploring the survival rate of intra-firm trade
may be an interesting exercise.

25
Reference
Antràs, P., Chor, D., Fally, T., and Hillberry, R. (2012), Measuring the Upstreamness of
Production and Trade Flows, American Economic Review Papers and proceedings,
102(3), 412-416.
Athukorala, P.C. and Yamashita, N. (2006), Production Fragmentation and Trade Integration:
East Asia in a Global Context, The North American Journal of Economics and Finance,
17(3), 233-256.
Belderbos, R., Capannelli, G., Fukao, K. (2001), Backward Vertical Linkages of Foreign
Manufacturing Affiliates: Evidence from Japanese Multinationals, World Development
29(1), 189-208.
Besedes, T. and Prusa, T. (2006a), Ins, Outs, and the Duration of Trade, Canadian Journal of
Economics, 39(1), 266-295.
Besedes, T. and Prusa, T. (2006b), Production Differentiation and Duration of US Import Trade,
Journal of International Economics, 70(2), 339-358.
Brainard, L., (1993), A Simple Theory of Multinational Corporations and Trade with a Trade-
off between Proximity and Compensation, NBER working paper, No.4269.
Brainard, L., (1997), An Empirical Assessment of the Proximity-Concentration Trade-off
Between Multinational Sales and Trade, American Economic Review, 87(4), 520-544
Chen, T-J., and Ku, Y-H., (2000), The effect of Foreign Direct Investment on Firm Growth:

26
The Case of Taiwan’s Manufacturers, Japan and the World Economy, 12(2), 153-172.
Clausing, K. A. (2000), Does Multinational Activity Displace Trade, Economic Inquiry, 38,
190-205.
Eaton, J. and Tamura, A. (1994), Bilateralism and Regionalism in Japanese and US trade and
Direct Foreign Investment Patterns, Journal of the Japanese and International
Economies, 8, 478-510.
Hanson, G.H., Mataloni, R.J., and Slaughter M.J. (2005), Vertical Production Networks in
Multinational Firms, Review of Economics and Statistics, 87(4): 664-678
Head, K. and Ries, J. (2001), Overseas Investment and Firm Exports, Review of International
Economics, 9, 108-122.
Hess, W., and Persson, M., (2012), The Duration of Trade Revisited: Continuous-time versus
Discrete-time Hazards, Empirical Economics, 43(3), 1083-1107.
Kiyota, K., Matsuura, T., Urata, S., and Wei, Y. (2008), Reconsidering the Backward Vertical
Linkage of Foreign Affiliates: Evidence from Japanese Multinationals, World
Development, 36(8), 1398-1414.
Maruya, Toyojiro. (2007), Nichu Keizai Kankei no Kadai to Tembo (Challenge and prospects
in China-Japan Economic Relationship), Chugoku Keizai Hatten to Nichu Keizai Kyoryoku
ni Kansuru Kenkyukai Houkokusho (Project Report on the Economic Development of China
and Economic corporation between Japan and China), Economic and Social Research

27
Institute, Cabinet Office of Japanese government.
Obashi, A.(2010), Stability of International Production Network: Is East Asia Special?
International Journal of Business and Development Studies, 2(1), 63-94.
Pfaffermayr, M. (1996), Foreign Outward Direct Investment and Exports in Austrian
Manufacturing: Substitutes or Complements, Weltwirtschaftliches Archiv, 132, 501-522.
Ramondo, N., Rappoport, V., Ruhl, K., (2016), Intra-firm Trade and Vertical Fragmentation in
US Multinational Corporations, Journal of International Economics, 98(1), 51-59.
Rauch, J., (1999), Networks versus Markets in International Trade, Journal of International
Economics, 48(1), 7-35.
Shao, J., K. Xu and B. Qiu (2012), Analysis of Chinese Manufacturing Export Duration, China
and World Economy, 20(4), 56-73.
Yu, Miaojie., (2014), Process Trade, Tariff Reductions and Firm Productivity: Evidence from
Chinese Firms, Economic Journal, 125, 943-988.

28
Table 1 Distribution of parent-firm size of Japanese affiliates by entry year
Entry year
# of employees -1990 1991-1995 1996-2000 2001-
-299 14.1% 19.0% 18.1% 23.1%
300-499 6.7% 8.3% 8.1% 10.1%
500-999 11.3% 12.0% 12.0% 14.5%
1000-2999 23.2% 22.3% 22.0% 23.7%
3000- 44.7% 38.5% 39.7% 28.6%
Total 100% 100% 100% 100%
Source: Authors’ calculations
29
Table 2 Variable definitions and basic statistics
Note: Numbers in parentheses are standard deviations. The means and standard deviations are calculated by pooling the 2000–2006 data.
Variable N Mean Stan. Dev. p25 p75 Definition
Product characteristics
Initial-value 95437 7.88 2.56 6.138 9.657 Initital traded value in each span
Im-value 95437 7.92 2.57 6.174 9.716 Lagged import value
Home 95437 0.73 0.45 0 1 Dummy variable for imported goods from home
Diff 95437 0.68 0.47 0 1 Dummy variable for differentiated goods (Rauch's classification)
Upstream 95437 2.56 0.64 2.254 2.945 Constructed by Antras et al. (2012). For details, see the text.
Process 95437 0.59 0.49 0 1 Dummy variable for imported goods under process trading
Affiliate characteristics
Export 95437 0.94 0.24 1 1 Exported dummy
Alabor 95437 6.58 1.30 5.649 7.527 logged numher of employees for affiliates
Awage 95437 3.09 0.55 2.741 3.413 logged average wage for affiliates
KL-ratio 95437 4.78 1.10 4.076 5.528 Capital-Labor ratio
Regional characteristics
Agg-local-r 95437 7.49 0.74 6.957 7.92 # of local firms by industry and province
Agg-foreign-r 95437 5.86 0.77 5.472 6.409 # of foreign firms by industry and province
Agg-Jaffiliates-r 95437 7.22 1.11 6.633 8.045 # of Japanese firms by industry and province
Parent firm characteristics
Plarge 95437 0.64 0.48 0 1 Dummy variable for parent firms with more than 1000 emp
Pnetwork 89318 18.86 22.63 4 21 # of foreign manufacturing affiliates beloinging to the same parent firm
Pnetwork-China 89265 30.18 13.01 21 40 # of manufacturing affiliates in China beloinging to the same parent firm
Exper 89318 4.92 6.09 1 5 experience year of foreign production at parent firm
Exper-China 86057 9.54 3.89 7 12 experience year of production in China at parent firm

30
Table 3 Regional distribution of Japanese affiliates in China
Source: Authors’ calculations
# of firms Share
1 Bohai economic zone11 Beijing 39 4%12 Tenjing 65 7%13 Hebei 16 2%21 Liaoning 69 7%37 Shandong 58 6%
Subtotal 247 27%
2 Yangtze River Delta31 Shang Hai 238 26%32 Jiangsu 159 17%33 Zhejiang 56 6%
Subtotal 453 49%
3 Perl River Delta
35 Fujian 25 3%
44 Guangdong 161 17%
Subtotal 186 20%
4 Central region 10 1%
5 West region 22 2%
6 North East region 11 1%
Total 929 100%

31
Table 4 Product and affiliate characteristics by parent-firm size
Source: Authors’ calculations
Total N=95437 SME N=34377 Large firms N=61060
Mean SD Mean SD Mean SD
Diff 0.68 0.47 0.67 0.47 0.68 0.47
Home 0.73 0.45 0.75 0.43 0.71 0.45
Im-value 7.92 2.57 7.73 2.52 8.03 2.60
Upstream 2.56 0.64 2.57 0.63 2.55 0.65
Process 0.59 0.49 0.67 0.47 0.55 0.50
Total N=929 SME N=457 Large firms N=472
Mean SD Mean SD Mean SD
Export 0.87 0.34 0.78 0.41 0.83 0.38
Export-home 0.76 0.43 0.63 0.48 0.69 0.46
Alabor 5.16 1.12 5.72 1.25 5.45 1.22
Awage 3.00 0.56 3.27 0.56 3.14 0.58
Aoutput 6.26 1.19 7.42 1.49 6.85 1.47
KL-ratio 4.75 1.13 5.36 1.10 5.06 1.16

32
Table 5 Survival of intermediate goods imports for Japanese affiliates in China
Note: Marginal effects at mean-level are presented in this table. Figures in parentheses
are standard errors. *** represents statistical significance at the 1% level.
Estimation
method(1) (2) (3) (4) (5)
Import origin all country
Im_value -0.0402*** -0.0411*** -0.0405*** -0.0404*** -0.0404***
(0.0006) (0.0007) (0.0007) (0.0007) (0.0007)
Home -0.0625***
(0.0036)
Diff -0.0178*** -0.0164*** -0.0169*** -0.0168*** -0.0169***
(0.0034) (0.0040) (0.0040) (0.0040) (0.0040)
Upstream -0.0698*** -0.0781*** -0.0779*** -0.0778*** -0.0778***
(0.0025) (0.0029) (0.0029) (0.0029) (0.0029)
Process -0.0596*** -0.0479*** -0.0463*** -0.0453*** -0.0456***
(0.0033) (0.0038) (0.0037) (0.0037) (0.0037)
Export -0.0008 0.0009 -0.0067 -0.0084 -0.0070
(0.0069) (0.0076) (0.0075) (0.0075) (0.0075)
Alabor 0.0093*** 0.0093*** 0.0082*** 0.0076*** 0.0070***
(0.0015) (0.0018) (0.0017) (0.0017) (0.0017)
Awage 0.0125*** 0.0075** 0.0111*** 0.0120*** 0.0139***
(0.0032) (0.0038) (0.0037) (0.0037) (0.0036)
KL-ratio 0.0264*** 0.0265*** 0.0248*** 0.0240*** 0.0238***
(0.0018) (0.0021) (0.0020) (0.0020) (0.0020)
Agg-local-r 0.0268***
(0.0034)
Agg-foreign-r 0.0234***
(0.0034)
Agg-Jaffiliates-r 0.0166***
(0.0030)
Observations 95,437 69,198 69,202 69,202 69,202
Period FE Yes Yes Yes Yes Yes
Industry FE Yes Yes Yes Yes Yes
Province FE Yes Yes No No No
log LL -57830 -41886 -42010 -42017 -42026
Pseudo R2 0.109 0.113 0.110 0.110 0.110
Japan

33
Table 6 Impact of the parent-firm characteristics
Note: Marginal effects at the mean level are presented in this table. Figures in parentheses
are standard errors. *** and ** represent statistical significance at the 1% and 5% levels,
respectively.
(1) (2) (3) (4) (5)
Im-value -0.0406*** -0.0404*** -0.0402*** -0.0403*** -0.0404***
(0.0007) (0.0007) (0.0007) (0.0007) (0.0007)
Diff -0.0170*** -0.0170*** -0.0171*** -0.0170*** -0.0164***
(0.0040) (0.0042) (0.0042) (0.0042) (0.0043)
Upstream -0.0779*** -0.0772*** -0.0768*** -0.0771*** -0.0767***
(0.0029) (0.0030) (0.0030) (0.0030) (0.0031)
Process -0.0458*** -0.0452*** -0.0451*** -0.0452*** -0.0450***
(0.0037) (0.0039) (0.0039) (0.0039) (0.0040)
Export -0.0050 -0.0066 -0.0046 -0.0061 -0.0008
(0.0075) (0.0078) (0.0078) (0.0078) (0.0081)
Alabor 0.0065*** 0.0086*** 0.0077*** 0.0090*** 0.0058***
(0.0018) (0.0019) (0.0020) (0.0019) (0.0020)
Awage 0.0086** 0.0054 0.0064 0.0059 0.0037
(0.0038) (0.0039) (0.0039) (0.0039) (0.0040)
KL-ratio 0.0233*** 0.0245*** 0.0248*** 0.0250*** 0.0253***
(0.0021) (0.0021) (0.0021) (0.0021) (0.0022)
Agg-local-r 0.0276*** 0.0286*** 0.0281*** 0.0279*** 0.0278***
(0.0034) (0.0035) (0.0035) (0.0035) (0.0037)
Plarge 0.0132*** 0.0046 0.0067 0.0090* 0.0178***
(0.0042) (0.0049) (0.0051) (0.0047) (0.0046)
Pnetwork 0.0005***
(0.0001)
Pnetwork-China 0.0006***
(0.0002)
Exper 0.0014***
(0.0004)
Exper-China 0.0019***
(0.0005)
Observations 69,202 64,205 64,160 64,205 61,909
Period FE Yes Yes Yes Yes Yes
Industry FE Yes Yes Yes Yes Yes
Province FE Yes Yes Yes Yes Yes
log LL -42005 -38980 -38957 -38985 -37639
Pseudo R2 0.111 0.111 0.111 0.111 0.111

34
Figure 1 The share of local procurement and imports by Japanese MNE affiliates in
China
Source: Maruya (2007).
0%
10%
20%
30%
40%
50%
60%
70%
1995 1996 1997 1998 1999 2000 2001 2002 2003 2004 2005 2006 2007
Local procurement
Import from Japan
Import from other countries

35
Figure 2 Predicted probability that the transaction tie by an average firm is terminated.
Source: Authors’ calculations
25.6%
27.4%
28.0%
26.3%
28.2%
29.2%
27.0%
27.7%
27.4%
31.3%
21.9%
28.5%
16.4%
26.8%
0% 5% 10% 15% 20% 25% 30% 35%
Average attributes of SMEs
Average attributes of large firms
Pnetwork
SMEs (plarge=0)
Agg-local-r
KL-ratio
Awage
Alabor
non-Exporter(Export=0)
Ordinary trade (Process=0)
Upstream
Homogeneous goods (Diff=0)
Im-value
Baseline


