Working Paper 13Bishnu Raj Upreti, Pravat Uprety, Jessica Hagen-Zanker, Sony KC and RichardMallettJune 2014
Surveying livelihoods, service delivery and governance: baseline evidence from Nepal
Researching livelihoods and services affected by conflict
Rolpa
Bardiya
Ilam
Nepal
India
China
Bangladesh
BhutanKathmandu

i
About us
Secure Livelihoods Research Consortium (SLRC) aims to generate a stronger evidence base on how
people in conflict-affected situations (CAS) make a living, access basic services like health care,
education and water, and perceive and engage with governance at local and national levels. Providing
better access to basic services, social protection and support to livelihoods matters for the human
welfare of people affected by conflict, the achievement of development targets such as the Millennium
Development Goals (MDGs) and international efforts at peace- and state-building.
At the centre of SLRC’s research are three core themes, developed over the course of an intensive one-
year inception phase:
State legitimacy: experiences, perceptions and expectations of the state and local
governance in conflict-affected situations
State capacity: building effective states that deliver services and social protection in
conflict-affected situations
Livelihood trajectories and economic activity in conflict-affected situations
The Overseas Development Institute (ODI) is the lead organisation. SLRC partners include the
Afghanistan Research and Evaluation Unit (AREU), the Centre for Poverty Analysis (CEPA) in Sri Lanka,
the Feinstein International Center (Tufts University), Focus1000 in Sierra Leone, the Food and
Agriculture Organization (FAO), Humanitarian Aid and Reconstruction of Wageningen University (WUR) in
the Netherlands, the Nepal Centre for Contemporary Research (NCCR), and the Sustainable
Development Policy Institute (SDPI) in Pakistan.
Secure Livelihoods Research Consortium
Overseas Development Institute
203 Blackfriars Road
London SE1 8NJ, UK
T +44 (0)20 7922 8221
F +44 (0)20 7922 0399
W www.securelivelihoods.org
Disclaimer: The views presented in this paper are those of the
author(s) and do not necessarily represent the views of DFID,
Irish Aid, the EC, SLRC or our partners, SLRC Working Papers
present information, analysis on issues relating to livelihoods,
basic services and social protection in conflict-affected
situations. This and other SLRC reports are available from
www.securelivelihoods.org. Funded by DFID, Irish Aid and the
EC.
Readers are encouraged to quote or reproduce material from
SLRC Working Papers for their own publications. As copyright
holder, SLRC requests due acknowledgement and a copy of
the publication

ii
Contents
About us i
Tables, figures and boxes iii
Acknowledgements iv
Preface v
Abbreviations vi
Executive summary 8
1 Introduction 11
2 Background, objectives and analytical frameworks 12
2.1 Situating the survey within the research programme 12
2.2 Objectives of the panel survey 13
2.3 Analytical frameworks 13
3 Research methodology 16
3.1 Methodology 16
3.2 Sampling methods and description of sample 17
4 Livelihoods and wellbeing 19
4.1 Livelihood activities 19
4.2 Food security 21
4.3 Household wealth 23
4.4 Summary of findings on livelihoods and wellbeing 24
5 Basic services, social protection and livelihoods assistance 25
5.1 Health 25
5.2 Education 28
5.3 Water 30
5.4 Social protection 32
5.5 Livelihoods assistance 35
5.6 Summary of findings on basic services, social protection and livelihoods assistance
36
6 Perceptions of governance 37
6.1 Perceptions of local government 37
6.2 Perceptions of central government 39
6.3 Summary of findings on governance 42
7 Conclusion 43
7.1 The survey sample 43
7.2 Livelihoods and wellbeing 43
7.3 Basic services, social protection and livelihoods assistance 44
7.4 Perceptions of governance 45
7.5 Priorities for future research 45
Bibliography 46
Annex 47

iii
Tables, figures and boxes
Tables
Table 1: Distribution of households by district 17
Table 2: Distribution of age group and dependency ratio by district 18
Table 3: Coping strategies by district and urban/rural status 21
Table 4: Mean food insecurity score, by main household income source (n=3,176) 22
Table 5: Mean Morris Score Index scores, by main household income source (n=3,176) 23
Table 6: Access to water by actors responsible for provision 31
Table 7: Receipt of livelihood assistance by household wellbeing levels 35
Figures
Figure 1: Location of the sampled districts, Bardiya, Rolpa and Ilam, highlighted in red 16
Figure 2: Livelihood activities, by main income source and percentage of households with a member
above the age of six participating in each activity. 20
Figure 3: Overall satisfaction with the quality of the health service on most recent use of the facility 26
Figure 4: Levels of satisfaction with the health service, by gender 26
Figure 5: Levels of satisfaction with the health service, by district 27
Figure 6: Levels of satisfaction with the health service, by ethnicity 27
Figure 7: Levels of satisfaction with government vs. privately run health clinics 28
Figure 8: Travel time to primary school – boys 29
Figure 9: Travel time to primary school – girls 29
Figure 10: Source of water 30
Figure 11: Variations in journey times to water point, by district 30
Figure 12: Respondents’ perceptions of the Old-Age Allowance 33
Figure 13: Respondents’ perceptions of Old-Age Allowance, by ethnic group 34
Figure 14: Extent to which respondents felt local government decisions reflected their priorities 37
Figure 15: Agreement with the statement, ‘To what extent do you feel the decisions of those in power in
the local government reflect your own priorities?’ by district 38
Figure 16: Extent to which respondents felt central government decisions reflected their priorities 40
Figure 17: Extent to which respondents felt government decisions reflected their priorities, comparison
of local and central government 41
Boxes
Box 1: Ethnicity and caste in Nepal 18
iv
Acknowledgements
This publication is the outcome of the collective efforts of many people. Though we are not able to
mention them all here, we would like to extend our sincere gratitude to all of them. Nevertheless, we
have to mention some who have greatly contributed to bringing the publication into the form in which
you find it.
We are thankful for the guidance and support provided by SLRC CEO Paul Harvey and Research Director
Dr Rachel Slater during the preparation and implementation of the field survey, the analysis of data and
the writing this report. We acknowledge the logistical support of Mr Siddhi Manandhar, Manager of
Nepal Centre for Contemporary Research (NCCR) during the research and writing process. Thanks to
Purna Bahadur Nepali, Babken Babajanian, Georgina Sturge and Joseph Wales for their support with
the analysis. We also sincerely thank Roo Griffiths, Aaron Griffiths and Georgina Sturge for editorial
assistance.
We express our appreciation to the reviewers of the draft report, Dr George Varughese and Rachel
Gordon, for their valuable comments and suggestions. The support of NCCR researchers Mr Suman
Paudel, Mr Gopikesh Acharya, Mr Annal Tandukar, Ms Apsara KC and Ms Sharmila Shivakoti is
appreciated. We also thank the field survey enumerators, field supervisors, and coordinators for their
valuable work upon which this publication is based.
Last but not least, we express our special gratitude to the 3,176 respondents to the household survey
who not only spent their valuable time answering a long list of questions but also provided warm
hospitality during the field visits.

v
Preface
As a multi-year, cross-country research programme, one of the overarching aims of the Secure Livelihoods Research
Consortium (SLRC) is to contribute towards a better understanding of what processes of livelihood recovery and state
building look like following periods of conflict and how positive outcomes are achieved. Understanding socioeconomic
change of this nature is possible only when appropriate evidence exists. This, in turn, requires the availability of reliable
longitudinal data that are able to measure shifts, fluctuations and consistencies in the performance of a given unit of
analysis (e.g., an individual, a household, an economy) against a set of outcome indicators between at least two points in
time.
In order to directly address this need for appropriate evidence – evidence that tells us something about processes playing
out over time and in more than one context – SLRC is carrying out original panel surveys in five countries: the Democratic
Republic of Congo, Nepal, Pakistan, Sri Lanka and Uganda. In two other countries, Afghanistan and South Sudan, we are
following a slightly different process by tagging on to existing panel surveys. The surveys are designed to produce
information on people’s livelihoods (income-generating activities, asset portfolios, food security, constraining and enabling
factors within the broader institutional and geographical context), their access to basic services (education, health, water),
social protection and livelihood services and their relationships with governance processes and practices (participation in
public meetings, experience with grievance mechanisms, perceptions of major political actors). The surveys are to be
implemented twice in each country: the first round took place in late 2012 to early 2013, and the second round – where we
will attempt to re-interview the same households – will take place in late 2015 to early 2016.
Undertaking a cross-country, comparative panel survey in difficult environments is far from a straightforward exercise. For
purposes of transparency and clarity, we highlight the two major limitations of our baseline analyses and reports below.
The first limitation concerns the methods of statistical analysis used. In order to identify factors that appear to (partially)
determine outcomes of various kinds – for example, food security or perceptions of state actors – and compare them
across countries, it was necessary for SLRC researchers to carry out standardised regression analyses of the survey data. If
the analysis were being carried out solely at the country level, what would ordinarily happen is that each country team would
make their own decisions – based on theory, existing knowledge and context – about which dependent and independent
variables to include in each of their regressions and which specific regression methods to use. In an attempt to generate
findings that would usefully tell us something about patterns or discrepancies across countries, it was originally decided that
each country team would include a standardised list of independent variables in each of their regressions and use the same
regression techniques; this would then enable the global survey team to produce a synthesis based on similar-looking
analyses at the country level. This approach, however, creates a trade-off. For instance, including a long list of comparable
independent variables means including certain variables that for some countries may be less relevant or even co-linear (an
undesirable statistical situation that arises when two independent or explanatory variables share a strong linear
relationship). As such, we have tested for multi-co-linearity in all regressions and have re-specified those that were affected
by this problem – at the expense of some cross-country comparability. Other reasons the results are not completely
comparable across countries include low numbers of responses for some questions/variables; and low levels of variation
between responses for some questions/variables (when either situation arose, such variables were not included in the
regression analysis).
The second limitation of the baseline reports is their absence of theory and contextualisation. Indeed, the reports focus
primarily on empirical information generated through the surveys, rather than on a thorough theoretical or grounded
explanation of findings. As such, direct attempts have not been made to reference the findings in relation to other relevant
pieces of research or to provide theoretical explanations of relationships and patterns. This is the result of a choice made by
SLRC researchers at the outset of the survey process. Rather than allocate additional resources to producing country
reports that offer comprehensive explanations of findings, it was decided that the outputs emerging from the first survey
round would constitute basic, relatively unembellished baseline reports. While still presenting information of interest, one of
the primary purposes of the baseline reports is to provide a clear and solid basis against which the second-round survey
data can be compared and interpreted. It is in those second-round reports that far greater attention will be paid to
embedding the SLRC survey findings – findings that will be of greater value given their longitudinal and panel nature – in
the appropriate theoretical and contextual foundations.

vi
Abbreviations
DDC District Development Committee
MSI Morris Score Index
NCCR Nepal Centre for Contemporary Research
NGO Non-governmental organisation
OECD
OLS
Organisation for Economic Co-operation and Development
Ordinary Least Square
SLRC Secure Livelihoods Research Consortium
VDC Village Development Committee

8
Executive summary
In 2012/13, SLRC implemented the first round of an original cross-country panel survey in Nepal
designed to produce information on:
■ people’s livelihoods (income-generating activities, asset portfolios, food security, constraining
and enabling factors within the broader institutional and geographical context)
■ their access to basic services (education, health, water), social protection and livelihood
assistance, and
■ their relationships with governance processes and practices (participation in public meetings,
experience with grievance mechanisms, perceptions of major political actors).
This paper reports on the baseline findings emerging from statistical analysis of the Nepal first-round
data.
We collected survey data from a sample of 3,176 households in September to November 2012.
Although the sample was drawn from three districts – Rolpa, Bardiya and Ilam (purposively selected in
order to capture geographic variation in conflict, physical accessibility and access to services) – our
data are not representative at the district level. They are representative, however, at the village level,
and are statistically significant at the study, district and village level.
Livelihoods and wellbeing
Three key findings emerge from our analysis of the livelihoods data.
First, the data show that agriculture remains the major livelihood activity, with close to 80% of
households participating. It is the most important income source for around 46% of households. Only a
negligible share of households had members who held a private sector job, while about 10% of
households had at least one member working in the public sector.
Second, we find that higher levels of household education and the ability of a household to obtain a
loan in an emergency are significantly associated with lower levels of food insecurity and with higher
levels of asset ownership. The significance of the ‘access to a loan’ variable suggests that when
households have access to financial safety nets or response mechanisms such as loans, particularly in
tough times, they are more likely to be better off. Of course, the direction of causality might flow the
other way: it may be that wealthier, more food-secure households find it easier to access loans,
perhaps because they are trusted more by other households or financial organisations.
Third, in terms of the links between food insecurity and asset ownership, there are four variables that
stand out. We find that female-headed households are likely to be less food insecure but also less
wealthy. We also find that households in urban locations in our sample are likely to be wealthier but
more food insecure. Land access could be an influence here, because those in urban areas may lack
the safety net effects of subsistence agriculture when food prices spike. We find that receipt of a social
protection transfer is associated with greater asset ownership (possibly because the transfer buffers
against asset depletion, such as selling assets to buy food) but also with higher levels of food insecurity.
And finally, although not sharing a statistically significant relationship with food insecurity, receipt of a
livelihoods assistance transfer is also associated with greater household wealth.
9
Basic services, social protection and livelihoods assistance
Looking across the range of services covered by the survey – health, education, water, social protection
and livelihoods assistance – we can identify four key findings regarding households’ access to, and
experience of, basic services in our sample.
First, the number of shocks experienced by a household in the last three years generally appears to be
linked to worse service-related outcomes. For example, we find that exposure to a greater number of
shocks is associated with longer journey times to health clinics, greater dissatisfaction with health
clinics and a lower likelihood of receiving social protection. The exception is livelihood assistance, but
we think this is explained by the fact that it is mainly received by households with greater assets.
Second, in terms of social protection and livelihoods assistance coverage, 38% of households in our
sample population received some form of social protection over the past year, while 16% of households
received some form of livelihoods assistance over the same period. Interestingly, there are more female
than male respondents who reported receiving livelihoods assistance. Regression analyses suggest that
social protection programmes generally appear to be fairly well targeted – with older, female-headed,
less educated and more food-insecure households all more likely to have received a transfer – although
households experiencing a greater number of shocks in the last three years are less likely to have
accessed social protection.
Third, levels of satisfaction with services are generally fairly strong. For example:
More than 70% of respondents reported being either ‘very’ or ‘fairly’ satisfied with their health
service on the basis of their most recent visit. 64% of women tend to be fairly satisfied with the
health services as opposed to 60% men.
Just under 90% of respondents felt the water they accessed was clean and safe.
More than 80% of those receiving a form of livelihoods assistance (e.g. seeds and tools, fertiliser
vouchers) felt the assistance had helped improve agricultural production or another livelihood
activity.
An exception seems to be social protection. When asked about the effectiveness of the Old-Age
Allowance, less than 10% of beneficiaries in the sample felt the transfer helped either ‘quite a lot’ or ‘a
lot’. The vast majority of beneficiaries felt the transfer helped ‘a bit’ (insofar as it allowed them to buy
some extra food).
And finally, although there is no consistent set of variables explaining why some respondents are more
satisfied with services than others, there is some indication that people’s specific personal experiences
with the service heavily influences their overall level of satisfaction. For example, we find that when
respondents are dissatisfied with specific aspects of the health clinic – such as waiting times,
availability of quality staff – they are much more likely to be dissatisfied with the service overall. When
we look at respondents’ satisfaction with education, we find a very similar story.
Perceptions of governance
There are number of key findings regarding respondents’ perceptions of local and central government.
First, the vast majority of respondents have very low levels of trust and confidence in both local and
central levels of government. Perceptions of central government are comparatively worse than those
of local government. Female respondents have a more negative perception of the local government
than male respondents, but the difference is not statistically significant.
Second, few factors appear to consistently influence perceptions of both local and central government.
However, we do find that the higher the number of service-related problems a household experiences,
the worse a respondent’s perceptions of local and central government are likely to be. This suggests a
possible lack of effective accountability or grievance mechanisms in government service provision, and
weak responsiveness from those in power locally and centrally. On the same theme, there is also some
evidence that respondents are likely to hold more positive perceptions of local and central government

10
if they (1) are aware of official complaints procedures regarding services, or (2) have recently been
consulted about services. On the other hand, access to services – whether measured by journey times
to facilities or by receipt of a transfer – does not have a clear or significant relationship with perceptions
of government. This suggests that the way in which services are being delivered (participatory,
accountable etc.) is as important as what is delivered.
Third, and related to the above finding, there does not appear to be any consistent statistical
relationship between perceptions and a variety of factors one might expect to matter. For example, for
variables that we thought would each have strong influences on perceptions, such as economic
characteristics of households and the extent to which they participate in community meetings, we find
no correlation.
11
1 Introduction
In 2012/13, the Secure Livelihoods Research Consortium (SLRC) designed and implemented the first
round of a panel survey in five conflict-affected countries, generating cross-country data on livelihoods,
access to and experience of basic services, exposure to shocks and coping strategies, and people’s
perceptions on governance. This paper presents the findings of the Nepal survey, which was conducted
with 3,176 households between September and November 2012. It constitutes, in effect, the Nepal
baseline report, to be followed by a subsequent report in 2015/16 when the second round of the panel
survey will be completed. The analysis presented within also informs, together with the four other
country papers, the first-round synthesis report.
The paper is structured as follows. Section 2 provides the background to the survey, situating it in
relation to the overarching themes of SLRC’s research programme, outlining the objectives of the survey
and presenting the analytical frameworks used to guide analysis of the survey data. Section 3 presents
the survey methodology for Nepal in greater detail, discussing the specific sampling methods used and
describing the basic characteristics of the final sample. Sections 4-6 constitute the analytical core of
the paper, exploring: the livelihood status of households in our sample and the factors which influence
this; people’s access to and experience with basic services, social protection and livelihoods assistance
and the factors which influence this; and people’s perceptions of governance actors and the factors
which influence this. The final section concludes by summing up the main findings and presenting
suggestions for additional research.

12
2 Background, objectives and analytical
frameworks
This section is divided into three parts. The first provides some background information to the survey by
situating it in relation to SLRC’s broader research agenda. The second outlines the objectives of
carrying out a panel survey. The third describes the basic analytical frameworks used to analyse the
survey data.
2.1 Situating the survey within the research programme
The cross-country panel survey is of direct relevance to the first and third themes of SLRC’s six-year
global research programme:
1 Legitimacy. What are people’s perceptions, expectations and experiences of the state and
of local-level governance? How does the way services are delivered and livelihoods are
supported affect people’s views on the legitimacy of the state?
2 Capacity. How do international actors interact with the state and local-level governance
institutions? How successful are international attempts to build state capacity to deliver
social protection, basic services and support to livelihoods?
3 Livelihood trajectories. What do livelihood trajectories in conflict-affected situations tell us
about the role of governments, aid agencies, markets and the private sector in enabling
people to make a secure living?
Legitimacy: people’s perceptions of governance and the role of service delivery
Establishing, building or strengthening state legitimacy is a major element of state building. The
Organisation for Economic Co-operation and Development (OECD) (2010: 3), for example, notes that,
‘State legitimacy matters because it provides the basis for rule by consent rather than by coercion.’
Indeed, a lack of state legitimacy is seen as a major contributor to state fragility because it undermines
state authority. While the steps they can take to influence state legitimacy are few, donors do have an
interest in developing a clearer understanding of the following: what leads to legitimacy? What, if
anything, can they do to strengthen state–society relations? And what might be the (unintended)
positive and negative impacts of their programming on state legitimacy if they, for example, route
development funding via bodies other than the formal organs of the state?
Literature reviews carried out during SLRC’s inception year found very little evidence for the frequent
assertion that improving access to services and social protection in conflict-affected situations
contributes to state building (see, in particular, Carpenter et al., 2012). The relationship between
delivering services and state–society relations remains poorly understood. Given the cited importance
of legitimacy in state-building processes – as the European Report on Development (2009: 93) notes,
‘State-building efforts are bound to fail if, in strengthening institutional capacities, the legitimacy of the
state is not restored’ – it is both surprising and concerning that we have so little robust knowledge
about what leads to state legitimacy. Literature reviews have also spotted gaps between service
provision and the extent to which people know about or use those services. Also, the major focus of
much conflict research in Nepal has been on the causes and types of conflict, disregarding actual
impacts on the livelihoods and basic services of people affected (Bohara et al., 2006; Do and Iyer,
2010; Murshed and Gates, 2005; Nepal et al., 2011, as cited in Upreti et al., 2012).
Despite these gaps, state building, encompassing both legitimacy and capacity, provides the organising
framework for much international engagement in conflict-affected situations. In tackling this question
we are taking up the OECD’s call for donors to ‘seek a much better understanding – through perception

13
surveys, research and local networking – of local people’s perceptions and beliefs about what
constitutes legitimate political authority and acceptable behaviour’ (OECD, 2010: 55).
Livelihood trajectories: tracking change and identifying determinants
Literature reviews carried out during SLRC’s inception year identified empirical and longitudinal
research on livelihoods in conflict-affected situations as a key evidence gap. Good in-depth case studies
can sometimes be found on livelihood strategies in particular contexts, but these are usually just
snapshots. Qualitative case study approaches are also insufficiently linked to quantitative survey data.
The reviews also revealed a significant gap in any comparative analysis of the effectiveness and impact
of interventions to support livelihoods (see, in particular, Mallett and Slater, 2012). There is some
evaluation and academic literature that examines the impact of particular projects or programmes, but
very little that looks at the overall significance of aid in people’s livelihoods and compares the impact of
different approaches. The Nepal inception report also identified that the focus had been only on the
material facet of livelihoods, leaving out people’s aspirations and perceptions (Upreti et al., 2012).
Thus, perceptions have been a major focus of the SLRC survey. SLRC’s research programme aims to fill
some of these gaps by building a picture of how people make a living in particular contexts and tracking
how this changes over time.
2.2 Objectives of the panel survey
The panel survey will help us find answers to parts of our research questions under the first and third
themes of the research programme.
Regarding the first theme, legitimacy, our approach is centred on documenting and analysing people’s
views on governance in conflict-affected situations. A cross-country panel survey incorporating
questions about perception allows us to investigate difficult-to-measure, subjective issues such as trust
and satisfaction, and provides both a comparative snapshot and a longitudinal perspective.
Under the third theme, livelihood trajectories, SLRC is undertaking rigorous, longitudinal livelihoods
research. Our aim is to build a picture of how people make a living in particular contexts, to track how
this changes over time and to shed light on what causes change. We want to know whether people are
recovering or starting to build stronger and more secure livelihoods, whether they are stuck in poverty or
sliding into destitution, and how the broader political, economic and security environment affects this.
Implementing a panel survey that captures both the dynamics and the determinants of people’s
livelihoods enables a deeper understanding of these issues.
The SLRC cross-country panel survey therefore combines elements of both perception and livelihoods
surveys, enabling a dual focus on governance and legitimacy, and livelihood trajectories. There are five
points of added value in conducting a hybrid survey of this kind:
1 It allows us to link perceptions directly with experiences.
2 It generates rare panel data in fragile and conflict-affected contexts.
3 It allows us to identify similarities and differences between different fragile state contexts.
4 It allows us to differentiate between levels of government and different forms of governance.
5 It generates information on livelihoods beyond simple income measures.
2.3 Analytical frameworks
Three basic analytical frameworks emerged from the survey design process, which are outlined below
and in greater depth in the synthesis paper (SLRC, forthcoming). It should be emphasised that, because
this paper is based on the first round of the survey, the analysis is not geared towards identifying and
explaining changes over time (which is why we talk about livelihood status as opposed to trajectory
throughout the report). Rather, much of the analysis focuses on producing descriptive baseline
statistics and identifying possible correlations and relationships between different sets of factors. The

14
data collected also allow us to explain variations between Nepali households across a range of
outcomes.
1 Livelihood and wellbeing status
Livelihoods and wellbeing are broad concepts and cannot be meaningfully captured by a single
indicator. We have chosen to measure it in two different ways by looking at:
Household asset ownership (as a proxy for wealth)
Food security (using the Coping Strategies Index)
In the synthesis report (SLRC, forthcoming), we argue that variations in livelihood status can be
explained by a number of different factors. These include:
1 Household factors. These include demographic characteristics of the household,
religion/ethnicity of the household and education and migration characteristics.
2 Contextual factors. These include location, indicators accounting for season, occurrence of
conflict, perceptions of safety in the neighbourhood and moving to work, as well as other
indicators of livelihood opportunities/constraints (e.g. availability of credit).
3 Shocks experienced by a household. These include natural disasters and economic shocks,
as well as crime and conflict.
4 Differential access to basic services, social protection and livelihood assistances and the
quality of these services/transfers.
5 Serious crimes committed by parties to the conflict experienced by a household. These
include serious crimes under international humanitarian and human rights law.
The aim of the quantitative analysis is to estimate if and to what extent the above factors determine the
main outcome (household assets/food insecurity).
2 Access to and experience of basic services, social protection and livelihood assistance
We are interested in which factors determine access to and experience of services. We measure access
to services in terms of distance in minutes to the closest service provider last used (for health,
education and water) and someone having received a social protection transfer or livelihoods
assistance.
Variations in access to services can be explained by a number of different factors. These include:
1 Individual and household characteristics (as discussed above).
2 Contextual factors (as discussed above).
3 Shocks experienced by the household (as discussed above).
4 Implementation and performance of basic services, social protection and livelihood
assistance. Implementation and performance of (e.g. regularity of the provision, who
provides the service etc.) may affect access to basic services, social protection and
livelihoods assistance
5 Serious crimes committed by parties to the conflict experienced by a household (as
discussed previously).
The aim of the quantitative analysis is to estimate if and to what extent the above factors determine the
main outcome (access).
We measure experience in terms of overall satisfaction with the service provided (health and
education), if clean water is being provided for water and self-perceived impact for social protection and
livelihoods assistance.
In the synthesis report (SLRC, forthcoming), we argue that variations in experience of services can be
explained by a number of different factors. These include:
1. Individual and household characteristics (as discussed above).
2. Contextual factors (as discussed above).
3. Shocks experienced by the household (as discussed above).

15
4. Access to basic services. We expect that distance to basic services is likely to affect
experience of services.
5. Implementation and performance of basic services, social protection and livelihood
assistance (as discussed above).
The aim of the quantitative analysis is to estimate if and to what extent the above factors determine the
main outcome (satisfaction with the service/transfer).
3 People’s perceptions of governance and the role of service delivery
Analysis of people’s perceptions of governance is more complicated. We propose that perceptions of
governance are determined, as before, by individual and household characteristics, context and shocks
experienced. We then look specifically at the explanatory role of: (1) access to basic services, social
protection and livelihood assistance; (2) experience of using these; and (3) implementation and
performance of these.
We therefore propose that the following factors may determine people’s perceptions of governance:
1 Individual and household characteristics (as discussed above).
2 Contextual factors (as discussed above).
3 Shocks experienced by the household (as discussed above).
4 Serious crimes committed by parties to the conflict experienced by a household (as
discussed above).
5 Access to basic services, social protection and livelihood assistance. We expect that access
to services and social protection and livelihood assistance affect perceptions of
governance. In particular, not having access is likely to affect perceptions of certain
governance actors.
6 Experience of using basic services, social protection and livelihood assistance. We expect
that experience in using/receiving services and social protection and livelihoods assistance
affects perceptions of governance. In particular, having a negative experience is likely to
affect perceptions of certain governance actors.
7 Implementation and performance of basic services, social protection and livelihood
assistance. Implementation and performance of services and social protection and
livelihoods assistance may affect perceptions of governance. Waiting time, regularity and
costs in accessing services and social protection are likely to determine how state
governance is perceived by individuals, in particular if the transfer is government-provided.
The aim of the quantitative analysis is to estimate if and how much the above factors – and in particular
those relating to services – determine the main outcome (perceptions of governance).

16
3 Research methodology
This section first covers parts of the survey design process, highlighting some of the challenges faced,
before clarifying the sampling methods used and describing the characteristics of the final sample.
3.1 Methodology
The Nepal survey included the following modules: (1) basic household information; (2) individual
information; (3) assets of the household; (4) livelihood sources and activities; (5) food security; (6)
shocks and coping strategies; (7) security and justice services; (8) access to and experience of basic
services; (9) access to and experience of social protection; (10) access to and experience of livelihood
assistance; and (11) perceptions of governance. More information on the instrument design process
can be found in the SLRC survey process paper (SLRC, 2013).
The SLRC survey incorporates elements of both livelihood and perception surveys, which raises a
methodological issue: while the ideal unit of analysis for the livelihood survey is at the household level,
for the perception survey it is at the individual level. After extensive discussion and consultation, it was
decided to combine them in one survey, partly because of logistical and budgetary considerations, and
partly in an active effort to link perceptions more directly to real and measurable changes in wellbeing.
We opted to sample households, but to specifically seek out a varied range of gender and age-group
respondents within these to avoid a strong bias of male household heads for the perception questions.
For example, 56.3% of respondents were female, 75% were married, and while 50% of the respondents
were in the age range 30-53, 25% were between 18-35 and another 25% above the age of 53.
Panel surveys are particularly rare in fragile and conflict-affected contexts. Part of the reason for this is
that panel surveys are at risk of attrition – that is, households dropping out of subsequent survey
rounds – and it is assumed that, because conflict often results in displacement, attrition is too high in
conflict-affected situations. To account for this, we substantially increased the sample (see Section 3.2).
The first round of the panel study was conducted in 2012 and the second will be conducted in 2015.
The actual field survey was conducted from 24 September to 14 October 2012 in Rolpa and Bardiya
districts in western Nepal, and from 28 October to 10 November 2012 in Ilam district of eastern Nepal.
Figure 1: Location of the sampled districts, Bardiya, Rolpa and Ilam, highlighted in red

17
3.2 Sampling methods and description of sample
The sampling strategy combined purposive and random sampling at different stages in order to ensure
that we could make comparisons in terms of conflict-affectedness, remoteness and access to services
while also being able to draw statistically significant conclusions at the study/district and village level.
Districts and VDCs1 were selected purposively in order to locate the specific groups of interest and to
select geographical locations relevant to the broader SLRC research themes, with wards selected
randomly. The criteria of accessibility – conflict-affectedness and access to services – were used to
select Rolpa, Bardiya and Ilam districts. Rolpa, where the armed conflict originated, was the most
conflict-affected, followed by Bardiya and then Ilam. Rolpa is the most mountainous district in our
sample, Ilam has a combination of hills and Terai (plains) and Bardiya is entirely Terai.
Three VDCs covering a range of levels of service provision were selected in every district. For example,
in Rolpa, Liwang is the district headquarters, with a relatively higher level of service provision, Budagaon
falls in the middle, and Thawang is highly remote with fewer services. In Bardiya district, the list in the
same order was Guleria (the district headquarters) Belwa and Rajapur VDCs. In Ilam District, Ilam
Municipality had the highest provision, followed by Pashupatinagar VDC and then Chulachuli VDC.
The survey did not attempt to achieve representativeness at the country or district level, but it did aim
for representativeness at the village level. 2 The voters list, obtained from the Election Commission of
Nepal, was used for the sampling frame, and households were selected using a simple random
sampling method. We used this list as it was relatively recent, freely available (unlike the latest census
data) and cheaper than conducting a new household listing.
The sample size was calculated with three considerations: statistical significance at the district and
village level; budgetary and logistical limitations; and accounting for attrition between 2012 and 2015.
The minimum overall sample size required to achieve significance at the study level, given population
and average household size in the districts, was calculated using a 95% confidence level and a
confidence interval of 5%. The same criteria were used to calculate sample size at the village level.
Finally, the sample was increased by 20% to account for attrition between 2012 and 2015 so that the
sample size in 2015 is still statistically representative.
The overall sample size calculated for the survey was 3,175. A total of 3,176 questionnaires were
actually filled in during the field, but two were incomplete, so most of the analysis is based on 3,174
questionnaires. This study did not exclude questionnaires with responses such as ‘don’t know’ or ‘not
applicable’, or with missing information. Table 1 shows the sampled households by district.
Table 1: Distribution of households by district
District Frequency % of overall sample
population
% urban households % rural
households
Rolpa 717 22.6 0.0 100.0
Bardiya 1213 38.2 45.26 54.74
Ilam 1246 39.2 39.81 60.19
Total 3176 100.0 32.90 67.10
1 Nepal has 75 districts. Each district has a number of VDCs/municipalities. VDCs are the lowest administrative level of government. They are
divided into nine wards. 2 It should be noted that, as the sample is not representative at the district level, wherever comparisons are made between different districts
we are referring to the sample of this survey in the district, rather than the population at large. So for example if we say ‘In Rolpa’, we mean
‘our sample in Rolpa’.
18
The distribution the sample size across districts was calculated based on the selected VDCs’ population
sizes within the district. The average size of the surveyed households was 5.0 (see Annex 1 Table 4,
which is slightly higher than the national figure (4.88) from the 2011 census (CBS, 2012). Further,
67.1% of the surveyed households were from rural areas and 32.9% from urban areas. Across the
country, 83% of the population resides in rural areas (ibid.). Just over half of the respondents (56%)
were female.
With regard to household distribution by ethnicity, the majority of households were Janjati/indigenous
groups (47.4%) followed by Brahmin/Chhetri (33.2%), Dalit (7.8%) and Madhesi (6.4%). The main
religion in the surveyed districts was Hindu (81.4%), followed by Kirat (7.9%) and Buddhist (5%) (see
Annex 1, Table 1). This broadly follows the national distribution.
The average literacy rate of all individuals in the sample was 76.6%. The male literacy rate was 84.3%
and the female literacy rate 69.3% (see Annex 1 Table 2). According to the Population Census of 2011,
the overall literacy rate of Nepal is 65.9%, with the male literacy rate at 75.1% and the female literacy
rate at 57.4% (CBS, 2012). Our sample’s higher-than-national-average literacy rate can be attributed to
the fact that one-third of the sample consists of Ilam residents – who generally have higher-than-
national-average literacy rates – and because we included the district capitals in the three districts. The
findings show that that the mixed ethnicity group had the highest literacy levels (84.6%), followed by the
Brahmin/Chhetri (84.5%), the Janjati and indigenous groups (73.8%), the Dalit (71.9 %), Muslims
(69.7%) and other caste groups (68.2%) (see Annex 1, Table 3).
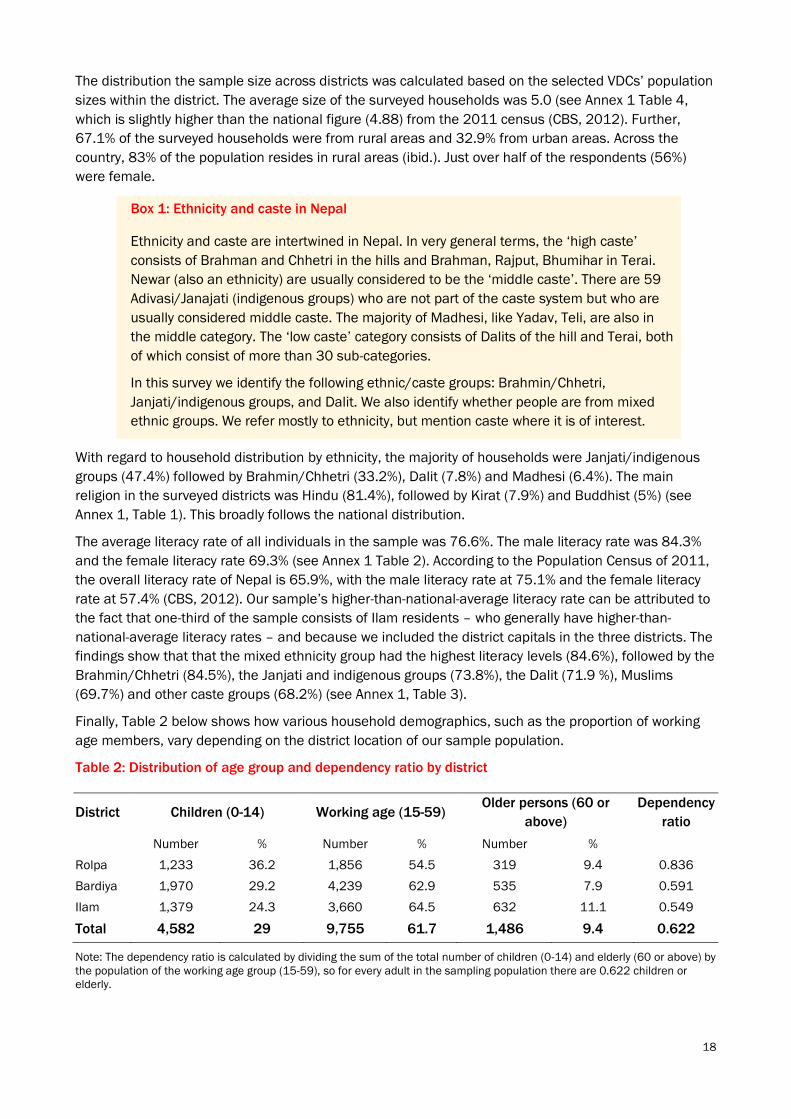
Finally, Table 2 below shows how various household demographics, such as the proportion of working
age members, vary depending on the district location of our sample population.
Table 2: Distribution of age group and dependency ratio by district
District Children (0-14) Working age (15-59) Older persons (60 or
above)
Dependency
ratio
Number % Number % Number %
Rolpa 1,233 36.2 1,856 54.5 319 9.4 0.836
Bardiya 1,970 29.2 4,239 62.9 535 7.9 0.591
Ilam 1,379 24.3 3,660 64.5 632 11.1 0.549
Total 4,582 29 9,755 61.7 1,486 9.4 0.622
Note: The dependency ratio is calculated by dividing the sum of the total number of children (0-14) and elderly (60 or above) by
the population of the working age group (15-59), so for every adult in the sampling population there are 0.622 children or
elderly.
Box 1: Ethnicity and caste in Nepal
Ethnicity and caste are intertwined in Nepal. In very general terms, the ‘high caste’
consists of Brahman and Chhetri in the hills and Brahman, Rajput, Bhumihar in Terai.
Newar (also an ethnicity) are usually considered to be the ‘middle caste’. There are 59
Adivasi/Janajati (indigenous groups) who are not part of the caste system but who are
usually considered middle caste. The majority of Madhesi, like Yadav, Teli, are also in
the middle category. The ‘low caste’ category consists of Dalits of the hill and Terai, both
of which consist of more than 30 sub-categories.
In this survey we identify the following ethnic/caste groups: Brahmin/Chhetri,
Janjati/indigenous groups, and Dalit. We also identify whether people are from mixed
ethnic groups. We refer mostly to ethnicity, but mention caste where it is of interest.

19
4 Livelihoods and wellbeing
This section explores the livelihoods and wellbeing of households in our sample by analysing our two
main wellbeing indicators (food insecurity and household wealth) as well as livelihood activities.
The first of the indicators, food insecurity, is proxied using the Coping Strategies Index (see Maxwell and
Caldwell, 2008). The index is a weighted sum reflecting the frequency with which households adopted
particular behaviours over the course of the previous 30 days. The weights given to these coping
strategies reflect their relative severity as follows (weights in parenthesis):
Had to rely on less preferred and less expensive food (1)
Had to borrow food or rely on help from friends or relatives (2)
Had to limit portion size at meal time (1)
Had to restrict consumption by adults in order for small children to eat (3)
Had to reduce number of meals eaten in a day (1).
Thus, a higher Coping Strategies Index score indicates a higher level of household food insecurity.
The second indicator, household wealth, is proxied by the assets owned by the household using the
Morris Score Index (MSI) (Morris et al., 1999). The MSI is a weighted asset indicator that weights each
durable asset owned by the household by the share of households owning the asset. This essentially
means that households are considered better off when they own assets not owned by most households
in the sample.3
In this section, we present descriptive information on the main livelihood activities and the two
wellbeing indicators, and draw on the results of regression analyses where appropriate in an attempt to
identify possible determining factors of livelihood outcomes. We first look at livelihood activities – what
households are doing in order to make a living – before moving on to discussions of food insecurity and
then household wealth. We end by summarising the main findings of the section. Findings are
statistically significant, except if specified otherwise.
4.1 Livelihood activities
The survey data allow us to examine the importance of particular livelihood activities in two main ways.
First, we asked what different members of each household did in order to make a living in the past six
months. Second, we asked respondents to tell us which activities were most important in terms of how
much income they generated. Contrasting these two indicators (see Figure 2) offers some insightful
results.
3 In the Nepali context, this index includes assets within four different categories. The first, ‘household items’, covers fridge, TV, mobile phones,
fan/air conditioning unit, computer/laptop and radio. The second, ‘livestock’, covers medium livestock (goat, pigs, sheep etc.) and large
livestock (horses, bullocks, cows, yaks, buffaloes etc.). The third covers ‘tools and machinery’: animal-powered tools/machinery such as
ploughs; petrol-powered machinery such as tractors, harvesters, threshing machines. The fourth includes ‘transportation’: man-powered
vehicles (bicycle, rickshaw, hand cart) and petrol-powered vehicles (motorbike, car, truck). We computed the weight of each asset by
calculating the reciprocal of the share of households owning the asset and then constructed the Morris index by adding all the product of
number of asset and their respective weight.
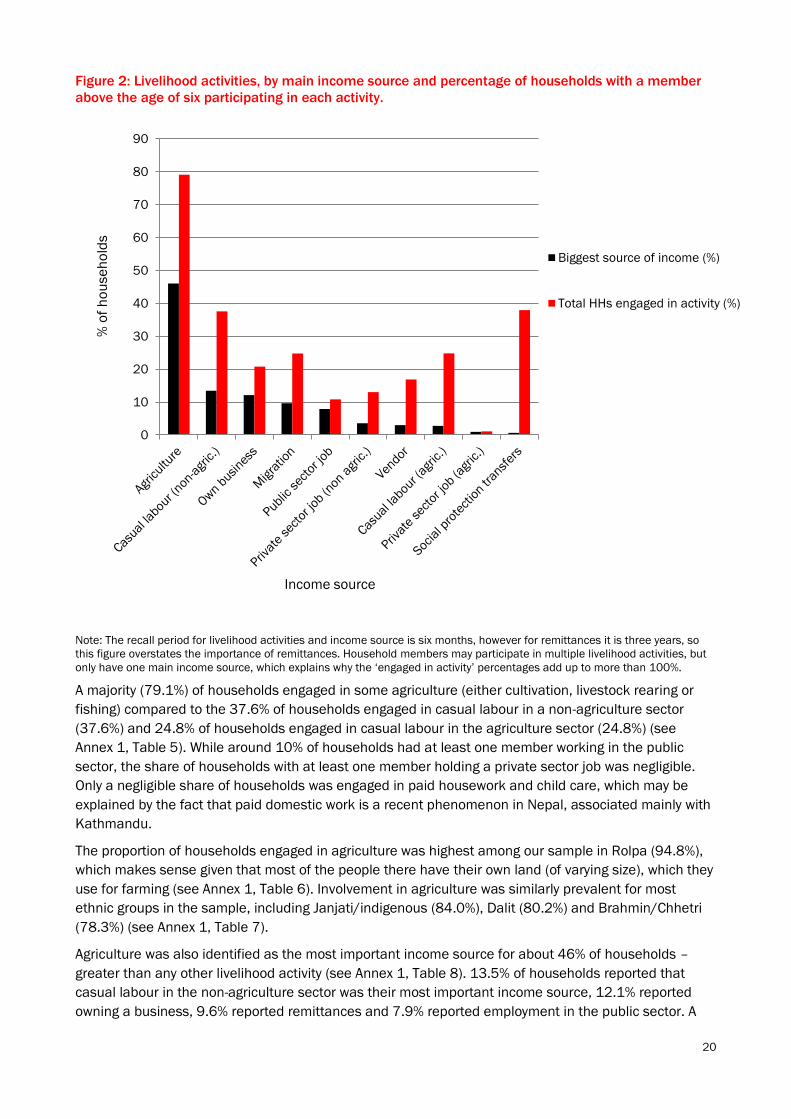
20
Figure 2: Livelihood activities, by main income source and percentage of households with a member
above the age of six participating in each activity.
Note: The recall period for livelihood activities and income source is six months, however for remittances it is three years, so
this figure overstates the importance of remittances. Household members may participate in multiple livelihood activities, but
only have one main income source, which explains why the ‘engaged in activity’ percentages add up to more than 100%.
A majority (79.1%) of households engaged in some agriculture (either cultivation, livestock rearing or
fishing) compared to the 37.6% of households engaged in casual labour in a non-agriculture sector
(37.6%) and 24.8% of households engaged in casual labour in the agriculture sector (24.8%) (see
Annex 1, Table 5). While around 10% of households had at least one member working in the public
sector, the share of households with at least one member holding a private sector job was negligible.
Only a negligible share of households was engaged in paid housework and child care, which may be
explained by the fact that paid domestic work is a recent phenomenon in Nepal, associated mainly with
Kathmandu.
The proportion of households engaged in agriculture was highest among our sample in Rolpa (94.8%),
which makes sense given that most of the people there have their own land (of varying size), which they
use for farming (see Annex 1, Table 6). Involvement in agriculture was similarly prevalent for most
ethnic groups in the sample, including Janjati/indigenous (84.0%), Dalit (80.2%) and Brahmin/Chhetri
(78.3%) (see Annex 1, Table 7).
Agriculture was also identified as the most important income source for about 46% of households –
greater than any other livelihood activity (see Annex 1, Table 8). 13.5% of households reported that
casual labour in the non-agriculture sector was their most important income source, 12.1% reported
owning a business, 9.6% reported remittances and 7.9% reported employment in the public sector. A
0
10
20
30
40
50
60
70
80
90
Biggest source of income (%)
Total HHs engaged in activity (%)
Income source
% o
f h
ou
se
ho
lds

21
very small proportion of households (0.7%) reported that social protection constituted the most
important income source.
These findings are generally in line with results from the most recent Nepal Living Standards Survey
(NPC, 2011). Data from that survey reveal that the main sector of employment in Nepal for both men
and women is self-employment in agricultural activities, with 28% of household income generated
through agriculture. This is followed by 17% from remittances. In Nepal, remittances now account for
25% of GDP (World Bank, 2013). Our data show that around one-quarter (24.8%) of households
reported receiving remittances in the previous three years. However, remittances were identified as the
primary source of income by just 9.6% of households (see Table 9 in Annex 1).
4.2 Food security
Nepal was largely food-secure until the 1980s (Adhikari, 2010), but with population growth and low
agricultural production in the 1990s (Tiwari, 2007) levels of food insecurity began to rise. However,
different regions and districts have experienced different forms of food insecurity.
For our survey, we measured food insecurity using the Coping Strategies Index. Coping Strategies Index
scores ranged between 0 and 32.0, with a mean value of 3.23 and a median value of 0.0; the
distribution of food insecurity scores across all households in the sample shows that 70% of
households fell below the mean. The low median value emerges because 56% of surveyed households
did not report using any food insecurity coping strategies, with a further 19.1% of households adopting
such strategies only very rarely. Only 13.2% had to adopt coping strategies four to five times during the
period in question. This indicates low levels of food insecurity in the sample areas at the time of the
survey, which makes sense given that the survey was conducted in the post-harvest period.
There were some slight but statistically significant variations across districts, with the average level of
food insecurity in Rolpa and Bardiya higher than in Ilam (see Table3).
Table 3: Coping strategies by district and urban/rural status
District Urban/rural status
Bardiya(***) Ilam(***) Rolpa(***) Urban(***) Rural (***) Total
Coping strategies index 3.85 2.37 3.69 3.65 3.03 3.23
Note: Asterisks indicate whether the mean for each group is statistically different from the sampled population as a whole (*
significant at 10%; ** significant at 5%; *** significant at 1%).
A surprising finding is that the mean Coping Strategies Index is lower for rural households in the sample
(mean 3.03) than urban households (mean 3.65) (see Table 3 above). This difference is brought out
even more clearly through regression analysis (see Annex 1, Table 10), the results of which indicate that
urban households are significantly more likely to be food insecure. While this could be explained
partially by a lower availability of land for production in urban areas or by high inflation of food prices in
recent times, it contradicts findings from the wider literature that rural or hilly areas in Nepal are
particularly food insecure (Adhikari, 2010; Ghale and Bishokarma, 2013; Gill et al., 2003). Indeed,
some studies show that while Nepal is a country with generally low food security, rural areas are
relatively more vulnerable in terms of the range of livelihoods options available to people – something
which has been exacerbated by insurgency (Seddon and Adhikari, 2003; Upreti et al., 2012).
We also find that mean food insecurity scores are highest for households engaged primarily in non-
agricultural casual labour (7.125) and lowest for those engaged primarily in agricultural casual labour
(1.06) (see Table 4). This is surprising at first sight, since casual labour in agriculture is by definition not
a reliable income source and casual labourers are also not likely to own their own land. This finding
could be explained by the post-harvest timing of the survey or by labourers being paid in food. We need
to explore this unexpected finding further in the qualitative fieldwork.
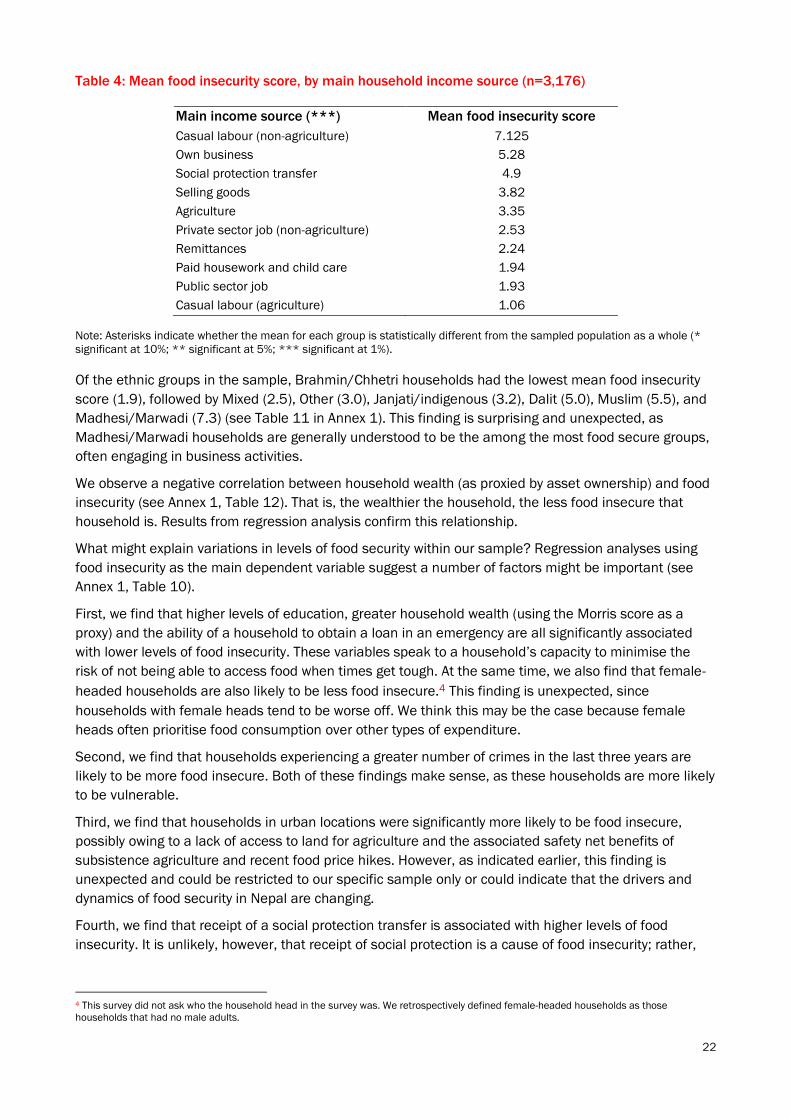
22
Table 4: Mean food insecurity score, by main household income source (n=3,176)
Main income source (***) Mean food insecurity score
Casual labour (non-agriculture) 7.125
Own business 5.28
Social protection transfer 4.9
Selling goods 3.82
Agriculture 3.35
Private sector job (non-agriculture) 2.53
Remittances 2.24
Paid housework and child care 1.94
Public sector job 1.93
Casual labour (agriculture) 1.06
Note: Asterisks indicate whether the mean for each group is statistically different from the sampled population as a whole (*
significant at 10%; ** significant at 5%; *** significant at 1%).
Of the ethnic groups in the sample, Brahmin/Chhetri households had the lowest mean food insecurity
score (1.9), followed by Mixed (2.5), Other (3.0), Janjati/indigenous (3.2), Dalit (5.0), Muslim (5.5), and
Madhesi/Marwadi (7.3) (see Table 11 in Annex 1). This finding is surprising and unexpected, as
Madhesi/Marwadi households are generally understood to be the among the most food secure groups,
often engaging in business activities.
We observe a negative correlation between household wealth (as proxied by asset ownership) and food
insecurity (see Annex 1, Table 12). That is, the wealthier the household, the less food insecure that
household is. Results from regression analysis confirm this relationship.
What might explain variations in levels of food security within our sample? Regression analyses using
food insecurity as the main dependent variable suggest a number of factors might be important (see
Annex 1, Table 10).
First, we find that higher levels of education, greater household wealth (using the Morris score as a
proxy) and the ability of a household to obtain a loan in an emergency are all significantly associated
with lower levels of food insecurity. These variables speak to a household’s capacity to minimise the
risk of not being able to access food when times get tough. At the same time, we also find that female-
headed households are also likely to be less food insecure.4 This finding is unexpected, since
households with female heads tend to be worse off. We think this may be the case because female
heads often prioritise food consumption over other types of expenditure.
Second, we find that households experiencing a greater number of crimes in the last three years are
likely to be more food insecure. Both of these findings make sense, as these households are more likely
to be vulnerable.
Third, we find that households in urban locations were significantly more likely to be food insecure,
possibly owing to a lack of access to land for agriculture and the associated safety net benefits of
subsistence agriculture and recent food price hikes. However, as indicated earlier, this finding is
unexpected and could be restricted to our specific sample only or could indicate that the drivers and
dynamics of food security in Nepal are changing.
Fourth, we find that receipt of a social protection transfer is associated with higher levels of food
insecurity. It is unlikely, however, that receipt of social protection is a cause of food insecurity; rather,
4 This survey did not ask who the household head in the survey was. We retrospectively defined female-headed households as those
households that had no male adults.

23
given the link found here, this may well be a sign of well-targeted social protection programming (i.e.
food-insecure households are more likely to receive social protection).
Fifth, we find that satisfaction with different services seems to be linked in mixed ways with levels of
food insecurity. For example, while satisfaction with health and education are both associated with
greater food insecurity, respondents who perceive their water source to be clean and safe are likely to
be less food insecure.
4.3 Household wealth
As outlined above, we use asset ownership as a proxy indicator for household wealth, measured in turn
by the MSI. Overall, the asset index score for all sampled households ranged between 0 and 305.2,
with a mean value of 19.7 and a median of 14.6. This means the majority of households own fewer
assets than the mean.
As Table 5 shows, MSI scores vary by household livelihood activity (as measured by main income
source). We see that households that owned their own business or had members employed in a public
sector job had much higher mean scores than other kinds of households. Casual labour households
had the lowest mean scores. Of particular interest here are households engaged in agricultural casual
labour: while such households were, on average, the least food insecure, they were also the second
worst-off in terms of asset ownership. This reinforces the argument presented that if agricultural casual
labourers are paid in food (reducing their food insecurity index), they continue to have few assets.
Table 5: Mean Morris Score Index scores, by main household income source (n=3,176)
Main income source (***) Mean MSI score
Own business 28.97
Public sector job 27.51
Livestock/fishing 19.80
Selling goods 19.64
Private sector job (non-agriculture) 18.48
Social protection transfer 16.24
Remittances 16.22
Private sector job 14.63
Casual labour (agriculture) 12.85
Casual labour (non-agriculture) 11.24
Note: Asterisks indicate whether the mean for each group is statistically different from the sampled population as a whole (*
significant at 10%; ** significant at 5%; *** significant at 1%).
In order to identify which variables might be influencing levels of household wealth, regression analyses
were carried out (see Table 13 in Annex 1). A number of variables are found to be statistically
significant.
First, we find that certain household characteristics appear to determine levels of wealth. As expected,
higher education levels and a household’s ability to access loans in an emergency, for example, are
associated with higher levels of wealth. In contrast, households with a migrant and households with
higher dependency ratios are significantly more likely to have lower levels of wealth.
Second, and contradicting our findings on food security, households in an urban location were more
likely to have higher levels of wealth, suggesting there is something about being based in a town or city
that is beneficial for asset accumulation but detrimental for food security.
Third, we find that receipt of either social protection or livelihoods assistance is associated with higher
levels of wealth. The direction of influence, however, is unclear: while these forms of assistance may
increase household wealth (for instance social protection may protect households against asset

24
depletion, such as when assets are sold to buy food), it might alternatively be the case that wealthier
households are more likely to access such support.
Fourth, and in contrast to the regression results for food insecurity, we find that female-headed
households are likely to be less wealthy.
4.4 Summary of findings on livelihoods and wellbeing
This section has looked at the determinants of livelihoods and wellbeing, analysing livelihood activities,
household assets and household wealth. In addition to the noteworthy findings that emerge on each of
the individual livelihood status outcome indicators, looking across the results of the statistical analysis
reveals a number of key issues with respect to livelihoods in the sampled population. We note three
features in particular here.
First, the data show that agriculture remains the major livelihood activity, with close to 80% of
households participating in agriculture. It is the most important income source for around 46% of
households. Only a negligible share of households had members who held a private sector job, while
about 10% of households had at least one member working in the public sector.
Second, we find that higher levels of household education and the ability of a household to obtain a
loan in an emergency are significantly associated with lower levels of food insecurity and with higher
levels of asset ownership. The significance of the ‘access to a loan’ variable suggests that, when
households have access to financial safety nets or response mechanisms such as loans, particularly in
tough times, they are more likely to be better off. Of course, the direction of causality might flow the
other way: it may instead be that wealthier, more food-secure households find it easier to access
loans, perhaps because they are trusted more by other households and financial organisations.
Third, in terms of the links between food insecurity and asset ownership, there are four variables that
stand out. We find that female-headed households are likely to be less food insecure but also less
wealthy. It is not clear why this is the case, but women may prioritise ‘consumption’ over asset-building,
as research from some countries suggests (e.g. Khan and Khalid, 2012 for Pakistan). We also find that
households in urban locations in our sample are likely to be wealthier but more food insecure;
questions about land might be particularly important here, as those in urban areas may lack the safety
net effects of subsistence agriculture when food prices spike. We find that receipt of a social protection
transfer is associated with greater wealth but also with higher levels of food insecurity, possibly because
social protection protects households against asset depletion, but we cannot draw any conclusions on
the direction of causality. And finally, although not sharing a statistically significant relationship with
food insecurity, receipt of a livelihoods assistance transfer is also associated with greater household
wealth.
25
5 Basic services, social protection and
livelihoods assistance
In this section, we look at people’s access to and experience with a range of basic services, including
health, education, water, social protection and livelihoods assistance. We provide information on how
access and experience vary across the sample, before drawing on regression findings to try and explain
what might be driving the variations. Findings are statistically significant, except if specified otherwise.
We use a simple indicator of access to basic services: journey time. For health services, this means the
time taken in minutes to travel to the nearest health clinic; for education it means the time taken in
minutes to travel to the primary school used by the household (we asked this separately for girls and
boys); and for water it means the time taken in minutes to travel to the water access point used by the
household (if that point is located outside of the dwelling). For social protection and livelihood
assistance, we measured access by asking whether at least a single member of the household had
received a transfer in the last year. An explanation and justification of the specific explanatory variables
can be found in the SLRC synthesis report (SLRC, forthcoming).
In exploring experience of services, we are particularly interested in how individuals perceive the basic
service and/or social protection or livelihood transfer. For basic services, we consider individual-level
perceptions of satisfaction with the basic service, both in an overall sense (asking, ‘Overall, how
satisfied are you with the quality of the service on the basis of your most recent use of [insert
service]?’), as well as in a more disaggregated sense (by asking people about their experience with
particular characteristics of a service, such as waiting times, teacher attendance and so on). For social
protection and livelihood assistance, we use perceived impact as a measure of experience. An
explanation and justification of the specific explanatory variables can be found in the SLRC synthesis
report.5
5.1 Health
For the sample population as a whole, the mean time taken to reach the nearest health centre was
40.22 minutes. There are large and statistically significant differences in journey times between
households in each of three districts. Journey times were lowest for households in Bardiya (20.93
minutes) – a district in the relatively accessible and well-connected Terai – whereas in Rolpa and Ilam
the average times taken were 61.53 minutes and 46.75 minutes, respectively (Table 14 in Annex 1).
Regression analysis suggests that a series of factors might be responsible for causing variations in
households’ access to health clinics (Table 15 in Annex 1). As in the descriptive statistics, geography is
particularly important, with households in Rolpa being significantly more likely to face longer journey
times. Part of this can be explained by the more difficult terrain of the district compared with Bardiya
and Ilam. We also find that higher levels of education within the household are associated with shorter
journey times. It is not clear why this is the case, although it could be linked to location, as more highly
educated households are more likely to be found in urban areas. Shorter journey times are also,
surprisingly, associated with experiencing conflict in the last three years; however, the greater the
number of shocks experienced by a household in the previous three years, the longer their journey time
to the health clinic was likely to be. This is a trend that is also observed for other services. Finally, a
series of factors related to the running of the health service emerged as statistically significant:
5 In the following analysis, we examine cross-tabulations and correlations between different sets of factors, before exploring possible
determinants of access and experience through regression analysis. Whenever the dependent variable is a scale variable we use the Ordinary
Least Squares method to estimate the multiple linear regression model; when the dependent variable is binary we use the logit model; and
when the variable is categorical/ordinal we use the multinomial logit model.

26
households who had to pay official fees at the clinic, whose clinic was run by government or who had
attended a community meeting on health services were all more likely to face longer journey times.
Overall, respondents seemed relatively satisfied with the quality of health services (based on their most
recent use of the facility). As Figure 3 shows, more than 70% of those interviewed reported being either
‘very’ or ‘fairly’ satisfied with the service. Just over 6% reported being either ‘very dissatisfied’ or
‘dissatisfied’.
Figure 3: Overall satisfaction with the quality of the health service on most recent use of the facility (%
of respondents)
Do levels of satisfaction differ by gender? Figure 4 shows the breakdown of satisfaction levels by
gender of the respondent. There is a statistically significant difference between satisfaction levels for
male and female respondents. We observe that a slightly higher proportion of female respondents
(64.2%) reported being ‘fairly satisfied’ with the health service compared with male respondents
(59.6%), indicating higher satisfaction levels among female respondents. Further research is needed to
explain this finding.
Figure 4: Levels of satisfaction with the health service, by gender
Note: The mean for each group is statistically different from the sampled population as a whole, significant at 5% level.
20.74
1.27
62
5
10.96 Very dissatisfied
Dissatisfied
Niether satisfied nor
disstisfied
Fairly satisfied
Very satisfied
0%
10%
20%
30%
40%
50%
60%
70%
80%
90%
100%
Female Male
Very dissatisfied
Dissatisfied
Neither satisfied nor
dissatisfied
Fairly satisfied
Very satisfied
% o
f re
sp
on
de
nts
Gender

27
In terms of the geographical distribution of levels of satisfaction, Figure 5 shows that ‘fairly satisfied’
respondents were most common in Rolpa (70.6%), followed by Bardiya (63.1%) and Ilam (56.4%). Ilam
had the largest proportions of respondents reporting being either ‘very dissatisfied’ or ‘dissatisfied’. This
finding is somewhat unexpected, since it runs counter to levels of access by district. It seems to indicate
that households assess satisfaction independently from travel time.
Figure 5: Levels of satisfaction with the health service, by district
Note: The mean for each group is statistically different from the sampled population as a whole, significant at 1% level.
We also observe a statistically significant variation in levels of satisfaction by ethnicity of respondent;
however, the levels of satisfaction are not clearly linked to the ranking of castes/ethnicities and the
social status/wealth these imply. As Figure 6 illustrates, Janjati/indigenous and Dalit respondents
tended to be somewhat more satisfied with the health service relative to other ethnic groups.
Figure 6: Levels of satisfaction with the health service, by ethnicity
Note: The mean for each group is statistically different from the sampled population as a whole, significant at 1% level.
Finally, we looked at how levels of satisfaction vary depending on whether the clinic was run privately or
by the government. Figure 7 shows some fairly large differences between the two, with a considerably
0
10
20
30
40
50
60
70
80
90
100
Rolpa Bardiya Ilam
Very dissatisfied
Dissatisfied
Neither satisfied nor dissatisfied
Fairly satisfied
Very satisfied
Pe
rce
nta
ge
of
resp
on
de
nts
wh
o a
gre
ed
wit
h t
his
sta
tem
en
t
0% 20% 40% 60% 80% 100%
Dalit
Muslim
Janjati/Indigenous
Madhesi/Marwadi
Brahmin
Very satisfied
Fairly satisfied
Neither satisfied nor dissatisfied
Dissatisfied
Very dissatisfied

28
higher proportion of respondents using private health clinics reporting being either ‘very’ or ‘fairly’
satisfied with the service compared with respondents using government-run clinics.
Figure 7: Levels of satisfaction with government vs. privately run health clinics
Note: The mean for each group is statistically different from the sampled population as a whole, significant at 1% level.
What explains why some people are more satisfied than others with their health clinic? Our regression
analysis points to a number of different factors (see Table 16 in Annex 1).
First, we find that when respondents were dissatisfied with specific aspects of the health clinic – such
as waiting times, availability of medicine and number of qualified staff – they were much more likely to
be dissatisfied with the service overall. This suggests that the way a health service is implemented and
run determines, at least in part, levels of satisfaction more generally, rather than factors not related to
direct experiences of the service. Similarly, regression results show that respondents who have to pay
fees – either official or informal – as well as those who attend a clinic run by the government are more
likely to be dissatisfied with the overall service.
Second, we find that respondents living in urban households were less likely to report dissatisfaction
with the health clinic, as were those who report feeling safe in their neighbourhood. Respondents from
households located in Rolpa or Bardiya were similarly less likely to report dissatisfaction compared to
their counterparts in Ilam.
Finally, we find that the greater the number of shocks experienced by a household in the last three
years, the more likely their respondent was to report dissatisfaction with the health clinic. Therefore,
such respondents were both more likely to (1) face longer journey times to a clinic, and (2) report
dissatisfaction with the service.
5.2 Education
Access to education was measured using journey times to both primary schools by girls and boys within
households. Boys’ and girls’ access to primary education was separated in order to examine whether
gender norms and discriminative practices towards girls still exist. Figures 8 and 9 show the difference
in travel times between girls and boys.
0%
10%
20%
30%
40%
50%
60%
70%
80%
90%
100%
Government Private
Very dissatisfied
Dissatisfied
Neither satisfied nor dissatisfied
Fairly satisfied
Very satisfied
Provider
% o
f re
sp
on
de
nts

29
Figure 8: Travel time to primary school – boys
Figure 9: Travel time to primary school – girls
There is very little difference between girls’ and boys’ travel times. Girls travelled on average 23.7
minutes to school and boys 24.9 minutes. Boys’ longer travel times seem to be linked to the types of
schools boys were attending. Among the girls going to primary school, 63.4% went to a government
school, whereas 36.7% went to a private school. In comparison, 41% of boys went to private primary
schools. The difference is small but statistically significant. This suggests that boys’ slightly longer travel
time may be explained by the fact that they are more likely to attend a private school than girls – with
private schools often being further away. The reasons why boys are more likely to attend private schools
than girls need to be explored further in order to understand if there is gender discrimination at play.
Two separate regression analyses were performed in order to identify factors associated with journey
times: one for boys, one for girls (Annex 1, Tables 17 and 18). Three independent variables were found
to be statistically significant for both boys and girls. First, households whose main income source is
‘own cultivation’ are more likely to face longer journey times to schools. Second, urban households are
also more likely to face longer journey times. Third, households from our sample population in Bardiya
district are more likely to face shorter journey times compared to households in Ilam.
We also carried out two separate regression analyses to identify factors associated with levels of overall
satisfaction with the quality of the education service: again, one for boys, one for girls (Annex 1, Tables
19 and 20). The main finding is that satisfaction with a range of specific aspects of the service – such
82.85
12.8
4.35
Up to half an hour
31 minutes to one hour
More than one hour
84.47
11.53 4
Up to half an hour
31 minutes to one hour
More than one hour

30
as teacher attendance, class sizes and quality of the teaching – is highly correlated with greater
satisfaction with the service as a whole. Again, this strongly suggests that the specific features of a
service are important in shaping people’s overall perceptions.
5.3 Water
Survey data tell us that the majority of households (52%) in our sample population accessed their water
from a tap, compared to 40% who drew their water from a tube well. The share of households relying on
either bottled water from shops or river sources was low (0.2% and 1%, respectively) (see Figure 10).
Figure 10: Source of water (% of households)
In terms of how long it takes households to access water, we find considerable statistically significant
differences in journey times across the three districts, as Figure 11 illustrates. We can see that while
90.8% of households in Bardiya and 73.6% of households in Ilam had access to water in their own
house, just 3.5% of households in Rolpa enjoyed the same level of access.
Figure 11: Variations in journey times to water point, by district
Note: The mean for each group is statistically different from the sampled population as a whole, significant at 1% level.
6.24
39.79
1.1
52.11
0.19 0.57
Well
Tube well
River source
Tap
Bottled water from shop
Other
0%
10%
20%
30%
40%
50%
60%
70%
80%
90%
100%
Rolpa Bardiya Ilam
More than 60 minutes
Between 30 and 60 minutes
Up to 30 minutes
Water source in own house
District
% o
f h
ou
se
ho
lds
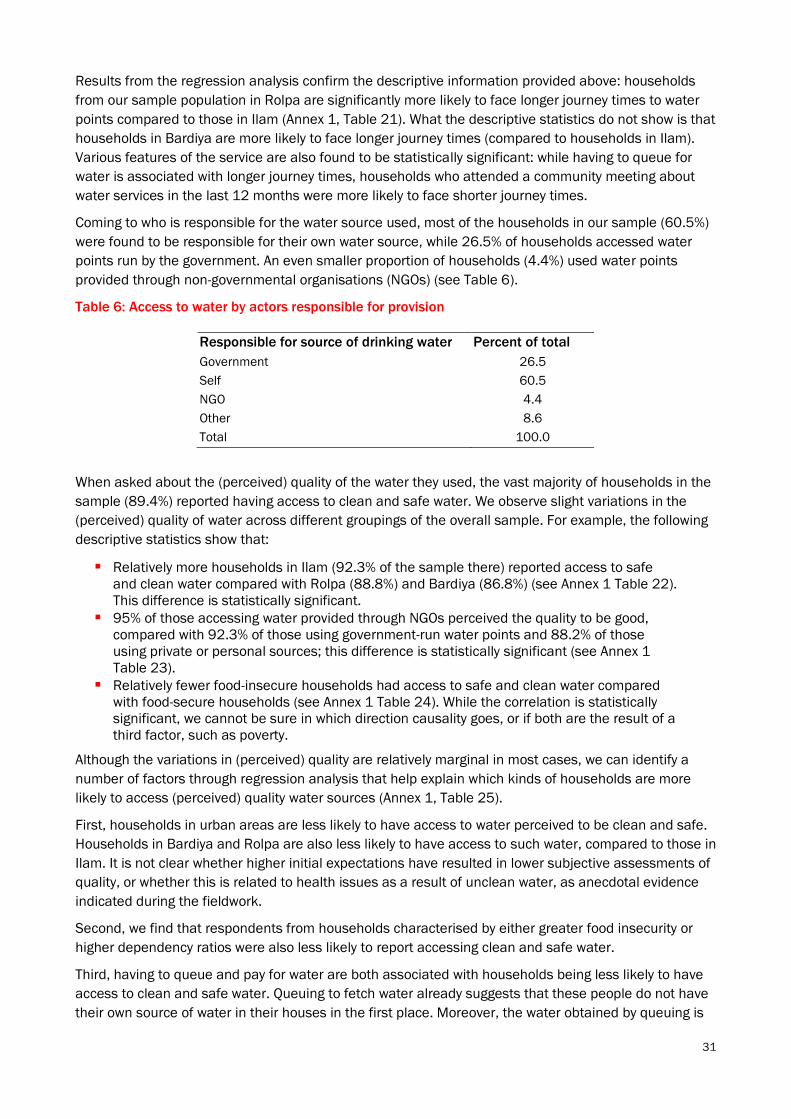
31
Results from the regression analysis confirm the descriptive information provided above: households
from our sample population in Rolpa are significantly more likely to face longer journey times to water
points compared to those in Ilam (Annex 1, Table 21). What the descriptive statistics do not show is that
households in Bardiya are more likely to face longer journey times (compared to households in Ilam).
Various features of the service are also found to be statistically significant: while having to queue for
water is associated with longer journey times, households who attended a community meeting about
water services in the last 12 months were more likely to face shorter journey times.
Coming to who is responsible for the water source used, most of the households in our sample (60.5%)
were found to be responsible for their own water source, while 26.5% of households accessed water
points run by the government. An even smaller proportion of households (4.4%) used water points
provided through non-governmental organisations (NGOs) (see Table 6).
Table 6: Access to water by actors responsible for provision
Responsible for source of drinking water Percent of total
Government 26.5
Self 60.5
NGO 4.4
Other 8.6
Total 100.0
When asked about the (perceived) quality of the water they used, the vast majority of households in the
sample (89.4%) reported having access to clean and safe water. We observe slight variations in the
(perceived) quality of water across different groupings of the overall sample. For example, the following
descriptive statistics show that:
Relatively more households in Ilam (92.3% of the sample there) reported access to safe
and clean water compared with Rolpa (88.8%) and Bardiya (86.8%) (see Annex 1 Table 22).
This difference is statistically significant.
95% of those accessing water provided through NGOs perceived the quality to be good,
compared with 92.3% of those using government-run water points and 88.2% of those
using private or personal sources; this difference is statistically significant (see Annex 1
Table 23).
Relatively fewer food-insecure households had access to safe and clean water compared
with food-secure households (see Annex 1 Table 24). While the correlation is statistically
significant, we cannot be sure in which direction causality goes, or if both are the result of a
third factor, such as poverty.
Although the variations in (perceived) quality are relatively marginal in most cases, we can identify a
number of factors through regression analysis that help explain which kinds of households are more
likely to access (perceived) quality water sources (Annex 1, Table 25).
First, households in urban areas are less likely to have access to water perceived to be clean and safe.
Households in Bardiya and Rolpa are also less likely to have access to such water, compared to those in
Ilam. It is not clear whether higher initial expectations have resulted in lower subjective assessments of
quality, or whether this is related to health issues as a result of unclean water, as anecdotal evidence
indicated during the fieldwork.
Second, we find that respondents from households characterised by either greater food insecurity or
higher dependency ratios were also less likely to report accessing clean and safe water.
Third, having to queue and pay for water are both associated with households being less likely to have
access to clean and safe water. Queuing to fetch water already suggests that these people do not have
their own source of water in their houses in the first place. Moreover, the water obtained by queuing is
32
mostly sourced from public tube wells, or is natural stone tap water. These sources are often not
cleaned regularly, so it could be the case that their water is contaminated and unsafe. The association
with having to pay for water is slightly more difficult to interpret. This might be a reflection of a lack of
regulation of companies selling water, but further research needs to be conducted before we can fully
understand this finding.
Finally, we find that respondents were more likely to report receiving clean and safe water if their
service is provided by either the government or an NGO.
5.4 Social protection
Our survey asked respondents whether any member of their household had received any of a range of
social protection transfers in the last year, including the Old-Age Allowance, the disability grant, the
single woman/widow allowance, and others. More than one-third of households (38%) had received at
least one social protection transfer in the previous year. The most commonly received social protection
transfers were the child grant (15.6% of households in the sample), the Old-Age Allowance (12.5 %) and
the single woman/widow allowance (6.9%).
A statistically significantly higher proportion of households in Rolpa (44.7%) received some social
protection compared with households in Bardiya and Ilam (see Annex 1 Table 26). This may be
explained partially by geographical variations in degrees of conflict-affectedness, and the subsequent
targeting of certain transfers to those affected by war. Indeed, Rolpa has been a focus of attention
since the conflict: the district has become a centre for many NGOs and international NGOs, as well as
government and other development organisations.
Receipt of social protection also varied according to household size, with differences being statistically
significant. Among households of six persons or more, 55.2% had been receiving at least one social
protection transfer; for households of four to five members to figure was 37.5% and for households of
one to three members it was 24.9% (see Table 27 in Annex 1). From this, it is clear that a greater
proportion of large families receive some form of social protection. This is arguably because such
households have more members (children, older people) who are eligible for social protection. This is
confirmed by regression analysis, which shows that the greater the number of children or elderly living
in the household, the greater the likelihood of the household receiving social protection.
Dalit households are specifically targeted with a number of social protection transfers. Our data
confirms this: receipt of transfers was most common among Dalit households: 67% of them receiving
social protection (with a statistically significant difference) compared with 56.9% of Madhesi
households and 44.3% of Muslim households. This is also confirmed by regression analysis (see Table
28 in Annex 1).
Regression analysis suggests that a number of further variables are significantly associated with the
receipt of social protection (Annex 1, Table 29):
The greater a household’s average age, the more likely it is to have received a social
protection transfer. This can partially be explained by the prevalence of universal old-age
pensions in the surveyed households.
Female-headed households are more likely to have received social protection (indeed, this
variable was found to have the strongest effect size out of all variables in the regression
model).
Those who engage in agricultural activities, such as cultivation, livestock or fishing, are
more likely to have received a social protection transfer.
Households with higher (median) education levels or who receive remittances are less likely
to have received social protection.
Those who experience more food insecurity are more likely to have received social
protection. Consistent with this, people who employ negative coping strategies such as
eating less or eating less preferred food are more likely to have received social protection.

33
When taken together, what these results suggest is that social protection programmes in the three
districts surveyed seem well targeted, with the receipt of transfers consistently associated with various
appropriate characteristics of eligibility. However, in what appears to be a pattern across different
services, regression analysis also suggests that the greater the number of shocks experienced by a
household in the past three years, the less likely they are to receive social protection transfers.
What do the 38% of households that receive social protection think about how effective the transfer is
in terms of improving household-level outcomes? Of particular interest for this study is the Old-Age
Allowance. This is one of the most widely disbursed transfers in Nepal: indeed, our data show that 398
households surveyed had received the Old-Age Allowance in the previous year (12.5% of the sample).6
As Figure 12 clearly shows, the majority of beneficiaries of the Old-Age Allowance felt the transfer
helped them ‘a bit’. It might, for example, allow them to buy some extra food. A further 37.7% of
beneficiaries felt it was ‘too small to make a difference’ in their life. Less than 7% of beneficiaries
attributed more positive (perceived) impacts to the transfer.
Figure 12: Respondents’ perceptions of the Old-Age Allowance (% of respondents)
Perceptions of the impact of the Old-Age Allowance varied by relatively marginal amounts across the
three districts but these differences are statistically significant (see Table 30 in Annex 1). We do
observe some variations across ethnic groups, however, with Dalit households being most positive
about the usefulness of the transfer and Janjati/indigenous groups generally the least positive (the
difference is statistically significant). Figure 13 shows perceptions of the Old-Age Allowance by ethnic
group.
6 The Old-Age Allowance programme has a unique history in terms of its establishment and coverage. While this transfer is universal among a
specific age group, there are still some constraints on its reach. An analysis of the political economy of this cash transfer is planned for the
near future.
38
55
6 1
The transfer is too small to make a
difference to my life
The transfer helps me a bit: I can buy
some extra food
The transfer helps me quite a lot: we
are rarely of food anymore and I can
buy some other household items
The transfer helps me a lot: we are
never short of food anymore and I
can also pay for school fees or invest
in a small

34
Figure 13: Respondents’ perceptions of Old-Age Allowance, by ethnic group
Note: The mean for each ethnic/caste group is statistically different from the sampled population as a whole, significant at
10% level.
We do see some further variations in perceptions of impact depending on the frequency with which the
transfer is received. For example, 58.3% of respondents in households that had been receiving the Old-
Age Allowance on a monthly basis felt it helped ‘a bit’, compared with 52.9% of those in households
that received it as a quarterly payment, and 51.8% of those in households that received a one-off
payment. This implies that the more frequent the payment, the more the transfer was perceived to have
helped. However, these differences are not statistically significant. In the latter group, 43.8% of
respondents said the transfer was too small to make difference in their lives – a substantially higher
share than for those that received a more frequent payment. This shows that beneficiaries seem to
prefer regular payments to lump sum payments. Further, respondents in households that always or
sometimes received the right amount felt more positive about the transfer than those rarely or never
receiving the right amount. Overall, these findings show the importance of reliability and adequacy of
the transfer in terms of achieving positive satisfaction.
Regression analysis of the data suggests that very few factors are significant in explaining variations in
the perceived impact of the Old-Age Allowance (see Annex 1, Table 35). Two variables consistently
demonstrate statistical significance: the number of crimes experienced by a household in the previous
three years, and how safe a respondent feels in their neighbourhood. Thus, respondents from
households experiencing a greater number of crimes or from safer neighbourhoods (as perceived by the
respondent) were more likely to report that the Old-Age Allowance was helpful to them. There is some
additional evidence that respondents were less likely to agree that the transfer was helpful if they did
not receive it on time.
0%
10%
20%
30%
40%
50%
60%
70%
80%
90%
100%
Brahmin Janjati Dalit Madhesi Muslim Other
The transfer helps me a lot: we are
never short of food anymore and I
can also pay for school fees or
invest in a small business
The transfer helps me quite a lot:
we are rarely of food anymore and I
can buy some other household
items
The transfer helps me a bit: I can
buy some extra food
The transfer is too small to make a
difference to my life
Ethnicity of respondent

35
5.5 Livelihoods assistance
Livelihoods assistance refers to a range of interventions provided by the state or aid agencies designed
to increase the productivity of primarily rural and agricultural households. Our survey asked
respondents whether their household had received any of a number of such interventions, from seeds
and tools to fertiliser vouchers, in the previous year. Data show that a relatively small proportion of
households received any form of livelihoods assistance – just 16.4% of the sample.
In terms of how receipt breaks down geographically, we see that a significantly higher share of
households in Rolpa (around one-quarter) had received at least one form of livelihoods assistance in
the previous year compared with 11.7% in Bardiya and 14.4% in Ilam (Annex 1, Table 32). We also see
that a statistically significant higher proportion of Dalit households (22.7%) had received at least one
form of livelihoods assistance in the previous year compared with other ethnic groups. For example, just
6.4% of Madhesi households and 15.6% of Janjati/indigenous households had received any form of
support (Table 33 in Annex).
Interestingly, as Table 7 shows, households that had received livelihood assistance also had, on
average, a higher MSI score and lower food insecurity (although the latter is not statistically significant).
Further analysis is needed to determine the causality of this correlation: while it might be telling us
something about the effectiveness of livelihood assistance – that is, households receiving livelihood
assistance are able to increase assets and reduce food insecurity – it could alternatively be an
indication of elite capture of such assistance.
Table 7: Receipt of livelihood assistance by household wellbeing levels
Getting at least one form of
livelihoods assistance
Average Morris
Index (***)
Average food
insecurity index
Average number of
shocks (***)
No 19.01 3.28 2.28
Yes 23.19 2.97 2.47
Total 19.69 3.23 2.32
Note: Asterisks indicate whether the mean for each group is statistically different from that of that of the other group (*
significant at 10%; ** significant at 5%; *** significant at 1%).
Regression analysis of the survey data reveals some interesting patterns (see Annex 1, Table 34) that
largely confirm the descriptive statistics. We find that, compared to households in Ilam, households
from our sample population in Rolpa were more likely to receive livelihood assistance, while households
in Bardiya were less likely to receive it. On the other hand, a household was more likely to access
livelihood assistance if it had greater assets (supporting what the descriptive statistics found), if it had
received remittances or if it had participated in community meetings regarding livelihood assistance.
Interestingly, we also find that households experiencing a greater number of crimes in the last three
years were more likely to receive such assistance – as noted above, the opposite is true for access to
social protection. Descriptive statistics show that households in Rolpa are more likely to have
experienced crimes than households in other districts. This could be an indication that livelihood
assistance is targeted towards those households that have experienced crime and conflict.
However, while the proportion of households receiving livelihoods assistance was relatively small, we
find that those that did receive it tended to feel the support helped their household – this is in contrast
with perceptions of the impact of social protection transfers, which were less positive overall. When
asked if the service had helped improve agricultural production or another livelihood activity, 80.4% of
beneficiaries responded that it had. There were no statistically significant differences by gender, with
80.3% of men and 80.4% of women reporting positively.
Looking solely at seeds and tools, regression analysis suggests a number of factors are associated with
perceptions of the effectiveness of the intervention (Annex 1, Table 35). First, respondents are
considerably more likely agree that seeds and tools helped increase their productivity if the transfer was

36
received on time. This makes intuitive sense – if seeds and tools arrive too late in the agriculture
season, they cannot be utilised productively. Second, respondents who reported feeling safe in their
neighbourhood were also more likely to agree that the transfer was helpful. Possible reasons include
because these households may be more willing to invest and/or there is less theft. Third, we find that
both the Morris and food insecurity index are significant. Respondents from wealthier households were
more likely to agree that the transfer was helpful, and those from more food insecure households were
less likely to agree. Again, a possible reason why is that wealthier and less food-insecure households
are more able to make additional investments that are needed to productively utilise the tools and
seeds.
5.6 Summary of findings on basic services, social protection and livelihoods assistance
Looking across the range of services covered in this section – health, education, water, social
protection and livelihoods assistance – we can identify four key findings regarding households’ access
to, and experience of, basic services.
First, the number of shocks experienced by a household in the last three years generally appears to be
linked to worse service-related outcomes. For example, we find that exposure to a greater number of
shocks is associated with longer journey times to health clinics, greater dissatisfaction with health
clinics and a lower likelihood of receiving social protection. The exception is livelihood assistance, but
we think this is explained by the fact that it mainly received by households with greater assets. Number
of crimes is significant in some of the regressions explaining access and satisfaction, but with
inconsistent patterns.
Second, in terms of social protection and livelihoods assistance coverage, 38% of households in our
sample population received some form of social protection over the past year, while just 16% of
households having received any form of livelihoods assistance over the same period. Regression
analyses suggest that social protection programmes generally appear to be fairly well targeted – with
older, female-headed, less educated and more food-insecure households all more likely to have
received a transfer – although households experiencing a greater number of shocks in the last three
years are less likely to have accessed social protection.
Third, levels of satisfaction with services are generally fairly strong. For example:
More than 70% of respondents reported being either ‘very’ or ‘fairly’ satisfied with their
health service on the basis of their most recent visit.
Just under 90% of respondents felt the water they accessed was clean and safe.
More than 80% of those receiving a form of livelihoods assistance (e.g. seeds and tools,
fertiliser vouchers) felt the assistance had helped improve agricultural production or
another livelihood activity.
An exception seems to be social protection. When asked about the effectiveness of the Old-Age
Allowance, less than 10% of beneficiaries in the sample felt the transfer helped either ‘quite a lot’ or ‘a
lot’. The vast majority of beneficiaries felt the transfer helped ‘a bit’ (insofar as it allowed them to buy
some extra food).
And finally, although there is no consistent set of variables explaining why some respondents are more
satisfied with services than others, there is some indication that people’s specific personal experiences
with the service influences their overall level of satisfaction heavily. For example, we find that when
respondents are dissatisfied with specific aspects of the health clinic – such as waiting times,
availability of quality staff – they are much more likely to be dissatisfied with the service overall. When
we look at respondents’ satisfaction with education, we find a very similar story. This suggests that the
way in which a service is implemented and run determines, at least in part, levels of satisfaction more
generally.

37
6 Perceptions of governance
What do people in our sample think about governance in their area? Using a series of outcome
indicators that measure people’s trust and confidence in local and central government, we examine
people’s experiences with, and perceptions of, governance. We focus on respondents’ attitudes towards
local and central government, and draw on regression analyses to suggest what might be driving
negative or positive perceptions. Findings are statistically significant, except if specified otherwise.
In Nepal, local government comprises three types of administrative unit: District Development
Committees (DDCs), Village Development Committees (VDCs) and municipalities. The Local Self-
Governance Act 1999 clearly defines the authorities and responsibilities of local governments. Central
government in Nepal refers to the body that performs centralised planning and budgeting at the central
level. Local government refers to the decentralised body that functions under the supervision of central
government, taking up the responsibilities of all the work associated with the ministry bodies present at
the local level.
6.1 Perceptions of local government
More than half of the respondents (56.7%) responded that they felt that the decisions of those in power
in the local government never reflected their own priorities; less than one-third (30.1%) felt that
decisions reflected some of their priorities. Only a small minority of respondents felt the local
government’s decisions either ‘completely’ or ‘to a large extent’ reflected their own priorities (see Figure
14).
Figure 14: Extent to which respondents felt local government decisions reflected their priorities (% of
respondents)
Levels of confidence in government varied only slightly across districts, with a higher proportion of our
sample population in Bardiya reporting that local government decisions ‘never’ reflected their priorities
and being generally less positive compared with those in Rolpa and Ilam. However, the proportions of
respondents reporting positive perceptions were consistently low, with less than 5% of respondents in
each district stating either ‘completely’ or ‘to a large extent’ (see Table 36 in Annex 1).
57
10
30
3
0
Never
Almost never
Only in some areas
To a large extent
Completely

38
Figure 15: Agreement with the statement, ‘To what extent do you feel the decisions of those in power
in the local government reflect your own priorities?’ by district
Note: The mean for each group is statistically different from the sampled population as a whole at 1%.
When we group the sample in other ways, we also find that respondents generally have negative
perceptions of government. For example:
■ Around 58% of rural respondents felt local government decisions ‘never’ reflected their
priorities, compared with around 54% of urban respondents (Table 37 in Annex 1; differences
were significant at the 1% level).
■ 52.6% of male respondents and 60.2% of female respondents reported ‘never’ (Table 38 in
Annex 1; differences are statistically significant at the 1% level).
■ Levels of dissatisfaction were highest among the Madhesi (68.1% reporting ‘never’) and lowest
among the Janjati/indigenous groups, although a majority (55.2%) still reported ‘never’. Both
groups can be considered middle-castes (Table 37 in Annex 1; differences are significant at the
5% level).
Generally speaking, however, our data illustrate fairly low levels of confidence in local government
across our sample population as a whole.
Two types of regressions were run for both central and local government. The first type was a logit
regression with the outcome, ‘Do you agree with the following statement: The local/central government
cares about my opinions’, with ‘no’ being the base category. The second regression was a multinomial
regression for the question ‘To what extent do the decisions of those in power in local/central
government reflect your own priorities?’. The base category was ‘never reflects my own priorities’. The
regression results are shown in Tables 40-41 (for local) and 46-47 (for central) in Annex 1.
Results from both regressions show that the higher the level of education received by a respondent, the
more likely they are to hold positive perceptions of local government. This variable proves significant in
both analyses, which suggests it is particularly important in influencing perceptions.
49.5
61.6 55.2
13.4
9.3
8.1
33.5 24.7
33.9
3.4 4.3 2.4 0.2 0.1 0.3
0%
10%
20%
30%
40%
50%
60%
70%
80%
90%
100%
Rolpa Bardiya Ilam
Completely
To a large extent
Only in some areas
Almost never
Never

39
Results from the logit regression analysis alone show that respondents from households which
experienced conflict in the last three years are less likely to feel that local government cares about their
opinions. The same goes for respondents from households which experienced a greater number of
crimes over the last three years. One hypothesis here might be that those who have experienced a
greater number of crimes do not feel that the ex-post assistance received is timely or adequate – if,
indeed, they receive assistance in the first place. Such a situation might be even more pronounced
among rural households in more remote areas. However, somewhat counter-intuitively, results from the
multinomial regression analysis show that the greater the number of shocks experienced over the last
three years, the more likely a respondent is to feel that local government decisions ‘largely’ or
‘completely’ reflect their priorities. The story that emerges from the analysis, therefore, is not a
straightforward one; rather, the relationship between exposure to shocks and perceptions of local
government appears quite complex.
If we look more closely at the relationship between services and perceptions, we see some inconsistent
patterns emerging. In particular, there appears to be a confusing and non-linear link between access to
and experience of services and perceptions of local government: respondents who were satisfied and
those who were dissatisfied with the availability of medicine at their local health clinic were both more
likely to report that that the local government’s decisions ‘largely’ or ‘completely’ reflect their priorities.
Those having to pay informal fees at the health clinic were also more likely to feel positively about local
government. How might this be explained? It might be, for example, that households having to pay
informal fees are just satisfied that they have been able to access a decent health clinic; the existence
of informal fees might also indicate flexibility or ‘room for manoeuvre’ in interactions with local
government officials, possibly allowing households to negotiate better access for themselves. Access to
and experience of education services is not significant, on the other hand.
That said, we see a stronger pattern emerge when we look at the relationship between people’s access
to grievance mechanisms and accountability of the government and their perceptions of local
government. Respondents living in households that have experienced a greater number of service-
related problems are: (1) more likely to feel that the local government does not care about their opinion;
and (2) less likely to feel that decisions ‘largely’ or ‘completely’ reflect their priorities. This suggests a
possible lack of effective accountability or grievance mechanisms in local government service provision,
and weak responsiveness from those in power locally. Incidentally, results from the multinomial
regression analysis show that the more grievance mechanisms – or complaints procedures – a
respondent knows about, the more likely they are to feel that local government decisions ‘largely’ or
‘completely’ reflect their priorities. Finally, results from both regressions show that the more a
respondent is consulted about services, the more positively they feel about local government. This
suggests that the way in which services are being delivered (participatory, accountable, etc.) is as
important as what is delivered.
6.2 Perceptions of central government
The story is even less encouraging when we look at respondents’ views of central government. When
asked, ‘To what extent do you feel the decisions of those in power in the central government reflect your
own priorities?’, almost 70% of the 2,572 respondents for whom we have answers felt the decisions of
those in central government ‘never’ reflected their own priorities (see Figure 16). In addition, just 17.6%
of the sample responded ‘only in some areas’ – around 12 percentage points lower than the proportion
of respondents giving the same response in relation to local government.

40
Figure 16: Extent to which respondents felt central government decisions reflected their priorities (%
of respondents)
Again, levels of confidence were consistently low regardless of how the sample is grouped. That said,
the variations we observe in relation to responses regarding local government also hold true here. In the
descriptive statistics we see, for example, that:
■ 76% of respondents in Bardiya reported ‘never’ compared with 70.3% in Ilam and 53.8% in
Rolpa (Table 42 in Annex 1; statistically significant).
■ 70.9% of female respondents compared with 68.4% of male respondents reported ‘never’
(Table 43 in Annex 1; not statistically different).
■ Levels of dissatisfaction were highest among the Madhesi, which can be classified as ‘middle-
caste’ (84.2% reporting ‘never’) and lowest among the ‘low-caste’ Dalit, although a majority
(66.7%) still reported ‘never’ (Table 44 in Annex 1; statistically significant).
What is striking about the data is that, although respondents’ levels of confidence in both local and
central government were generally low, perceptions of central government were consistently worse than
those of local government, to a statistically significant degree, regardless of how the sample is split.
Figure 17 shows perceptions of both among the sample as a whole.
69.8
10.5
17.6
2.1 0.1
Never
Almost never
Only in some areas
To a large extent
Completely

41
Figure 17: Extent to which respondents felt government decisions reflected their priorities, comparison
of local and central government
Note: The mean for each group is statistically different from the sampled population as a whole at 1%.
In order to identify what might be shaping people’s perceptions of central government, we ran the same
series of regressions as for local government (see Tables 45 and 46 in Annex 1).
One variable stands out (insofar as it is found to be statistically significant in both the logit and
multinomial regressions for both local and central government): the greater the number of problems
experienced with services, the less likely the respondent is to hold positive perceptions of government.
This suggests that respondents do hold the government responsible for problems with service delivery.
On a similar theme, results from the multinomial regressions for both local and central government
show that respondents are more likely to feel positively about central government if: (1) they know
about official procedures to make complaints about services; or (2) they have been previously consulted
about services.
Specifically at the central government level, we find that having to pay official fees for the health service
is associated with more negative perceptions. While we find no such relationship in the local
government regressions, we do find that having to pay informal fees for health is associated with worse
perceptions of local government. Regarding the role of respondent satisfaction with services, we again
see a mixed picture. For example, the respondent being satisfied or the respondent being dissatisfied
with certain indicators of health service quality are both significantly associated with respondents
reporting that central government decisions ‘largely’ or ‘completely’ reflect their priorities. At the very
least, this suggests a complex and non-linear relationship. As for local government, access to and
experience of education services is not significant. Further research will explore whether there is a link
between satisfaction with services and perceptions of government.
0.2 0.1 3.4 2.1
30.1
17.6
9.6
10.5
56.7
69.8
0%
10%
20%
30%
40%
50%
60%
70%
80%
90%
100%
Local government Central government
Never
Almost never
Only in some areas
To a large extent
Completely
42
6.3 Summary of findings on governance
There are number of key findings regarding respondents’ perceptions of government.
First, the vast majority of respondents have very low levels of trust and confidence in both local and
central levels of government (as measured by our two outcome indicators, ‘Do you have trust in the
government?’ and ‘Do decisions taken reflect your priorities?’). Perceptions of central government are
comparatively worse than those of local government.
Second, few factors appear to consistently influence perceptions of both local and central government.
However, we do find that the higher the number of service-related problems a household experiences,
the worse a respondent’s perceptions of local and central government are likely to be. This suggests a
possible lack of effective accountability or grievance mechanisms in government service provision, and
weak responsiveness from those in power locally and centrally. On the same theme, there is also some
evidence that respondents are likely to hold more positive perceptions of local and central government
if they: (1) are aware of official complaints procedures regarding services; or (2) have recently been
consulted about services. On the other hand, access to services – measured either by journey times to
facilities or by receipt of a transfer – does not have a clear and statistically significant relationship with
perceptions of government. This suggests that the way in which services are being delivered
(participatory, accountable, etc.) is as important as what is delivered.
Third, and related to the above finding, there does not appear to be any consistent statistical
relationship between perceptions and a variety of factors one might expect to matter. For example, for
variables that we thought would each have strong influences on perceptions, such as economic
characteristics of households and the extent to which they participate in community meetings, we find
no correlation.

43
7 Conclusion
In 2012/13, SLRC implemented the first round of an original cross-country panel survey in Nepal
designed to produce information on:
■ people’s livelihoods (income-generating activities, asset portfolios, food security, constraining
and enabling factors within the broader institutional and geographical context)
■ their access to basic services (education, health, water), social protection and livelihood
assistance
■ their relationships with governance processes and practices (participation in public meetings,
experience with grievance mechanisms, perceptions of major political actors).
This paper has reported on the baseline findings emerging from statistical analysis of the Nepali first-
round data. We now provide a recap of those findings. For ease and accessibility, we split this
concluding section into five: the first subsection provides some basic detail on the sample; the second,
third and fourth revisit key findings on livelihoods, services and governance, respectively; and the fifth
identifies research priorities to take forwards.
7.1 The survey sample
We collected survey data from a sample of 3,176 households in September to November 2012.
Although the sample was drawn from three districts – Rolpa, Bardiya and Ilam (purposively selected in
order to capture geographic variation in conflict, physical accessibility and access to services) – our
data are not representative at the district level. They are representative, however, at the village level
and are statistically significant at the study, district and village level.
In terms of composition, around two-thirds of respondents were from rural areas and just over half were
female. The majority of households were Janjati/indigenous groups (47.4%) followed by
Brahmins/Chhetri (33.2%), Dalit (7.8%), and Madhesi (6.4%). The main religion in the surveyed districts
was Hindu (81.4%), followed by Kirat (7.9%) and Buddhist (5%). These follow the national distribution.
The average literacy rate of the sample was 76.6%. This is higher than the national average, which can
be attributed to the fact that one-third consisted of Ilam residents – who generally have higher-than-
national-average literacy rates – and because we included the district capitals in the three districts.
7.2 Livelihoods and wellbeing
Our survey generated data on livelihood activities, asset ownership (as a proxy for household wealth)
and food insecurity (using the Coping Strategies Index). Three key findings emerge from our analysis of
the data.
First, the data show that agriculture remains the major livelihood activity, with close to 80% of
households participating in agriculture. It is the most important income source for only around 46% of
households. Only a negligible share of households had members who held a private sector job, while
about 10% of households had at least one member working in the public sector.
Second, we find that higher levels of household education and the ability of a household to obtain a
loan in an emergency are significantly associated with lower levels of food insecurity and with higher
levels of asset ownership. The significance of the ‘access to a loan’ variable suggests that when
households have access to financial safety nets or response mechanisms such as loans, particularly in
tough times, they are more likely to be better off. Of course, the direction of causality might flow the
other way: it may be that wealthier, more food-secure households find it easier to access loans,
perhaps because they are trusted more by other households or financial organisations.
44
Third, in terms of the links between food insecurity and asset ownership, there are four variables that
stand out. We find that female-headed households are likely to be less food insecure but also less
wealthy. We also find that households in urban locations in our sample are likely to be wealthier but
more food insecure; questions about land might be particularly important here, as those in urban areas
may lack the safety net effects of subsistence agriculture when food prices spike. We find that receipt
of a social protection transfer is associated with greater wealth but also with higher levels of food
insecurity, possibly because social protection protects households against asset depletion, but we
cannot draw any conclusions on the direction of causality. And finally, although not sharing a
statistically significant relationship with food insecurity, receipt of a livelihoods assistance transfer is
also associated with greater household wealth.
7.3 Basic services, social protection and livelihoods assistance
Looking across the range of services covered by the survey – health, education, water, social protection
and livelihoods assistance – we can identify four key findings regarding households’ access to, and
experience of, basic services in our sample.
First, the number of shocks experienced by a household in the last three years generally appears to be
linked to worse service-related outcomes. For example, we find that exposure to a greater number of
shocks is associated with longer journey times to health clinics, greater dissatisfaction with health
clinics and a lower likelihood of receiving social protection. The exception is livelihood assistance, but
we think this is explained by the fact that it is mainly received by households with greater assets.
Second, in terms of social protection and livelihoods assistance coverage, 38% of households in our
sample population received some form of social protection over the past year, while 16% of households
received some form of livelihoods assistance over the same period. Interestingly, there are more female
than male respondents who reported receiving livelihoods assistance. Regression analyses suggest that
social protection programmes generally appear to be fairly well targeted – with older, female-headed,
less educated and more food-insecure households all more likely to have received a transfer – although
households experiencing a greater number of shocks in the last three years are less likely to have
accessed social protection.
Third, levels of satisfaction with services are generally fairly strong. For example:
More than 70% of respondents reported being either ‘very’ or ‘fairly’ satisfied with their health service on the basis of their most recent visit. 64% of women tend to be fairly satisfied with the
health services as opposed to 60% of men.
Just under 90% of respondents felt the water they accessed was clean and safe.
More than 80% of those receiving a form of livelihoods assistance (e.g. seeds and tools, fertiliser
vouchers) felt the assistance had helped improve agricultural production or another livelihood
activity.
An exception seems to be social protection. When asked about the effectiveness of the Old-Age
Allowance, less than 10% of beneficiaries in the sample felt the transfer helped either ‘quite a lot’ or ‘a
lot’. The vast majority of beneficiaries felt the transfer helped ‘a bit’ (insofar as it allowed them to buy
some extra food).
And finally, although there is no consistent set of variables explaining why some respondents are more
satisfied with services than others, there is some indication that people’s specific personal experiences
with the service heavily influences their overall level of satisfaction. For example, we find that when
respondents are dissatisfied with specific aspects of the health clinic – such as waiting times,
availability of quality staff – they are much more likely to be dissatisfied with the service overall. When
we look at respondents’ satisfaction with education, we find a very similar story.

45
7.4 Perceptions of governance
Respondents were asked what they thought about local and central government. Three key findings
emerge from the data.
First, the vast majority of respondents have very low levels of trust and confidence in both local and
central levels of government. Perceptions of central government are comparatively worse than those
of local government. Female respondents have a more negative perception of the local government
than male respondents, but the difference is not statistically significant.
Second, few factors appear to consistently influence perceptions of both local and central government.
However, we do find that the higher the number of service-related problems a household experiences,
the worse a respondent’s perceptions of local and central government are likely to be. This suggests a
possible lack of effective accountability or grievance mechanisms in government service provision, and
weak responsiveness from those in power locally and centrally. On the same theme, there is also some
evidence that respondents are likely to hold more positive perceptions of local and central government
if they: (1) are aware of official complaints procedures regarding services; or (2) have recently been
consulted about services. On the other hand, access to services – whether measured by journey times
to facilities or by receipt of a transfer – does not have a clear or significant relationship with perceptions
of government. This suggests that the way in which services are being delivered (participatory,
accountable etc.) is as important as what is delivered.
Third, and related to the above finding, there does not appear to be any consistent statistical
relationship between perceptions and a variety of factors one might expect to matter. For example, for
variables that we thought would each have strong influences on perceptions, such as economic
characteristics of households and the extent to which they participate in community meetings, we find
no correlation.
7.5 Priorities for future research
Research insights gained from this baseline survey are very indicative and will be validated and
complemented by qualitative research. The findings of the household survey conducted in the second
year of the SLRC will be used as the basis for the qualitative survey in subsequent years. Year 3 will
focus on four major components for the qualitative research:
1 We saw that people’s perceptions of impacts of social protection were generally quite
negative, and we will be further exploring the links between receipt of the Old-Age
Allowance and people’s perceptions of the government in Rolpa district.
2 We will also explore the links between access to services (health, education and water) and
people’s perceptions of the government more generally, again in Rolpa district. We will be
following up directly on our inconsistent findings on the links between access to and
experience of services and perceptions of governance, as discussed above.
3 We will examine the impact and effectiveness of the Local Governance Community
Development Project based on its ability to deliver capacity to the local government and
community.
4 We will examine and assess the overall achievements of the Nepal Peace Trust Fund in
providing support to conflict-affected people and those internally displaced by the conflict
through a study in Bardiya district.

46
Bibliography
Adhikari, R.K. (2010) ‘Food utilization practices, beliefs and taboos in Nepal: an overview’. The Global
Health Technical Assistance Project. Washington, DC: USAID.
Carpenter, S., Slater, R. and Mallett, R. (2012) Social protection and basic services in fragile and
conflict-affected situations. Working Paper 8. London: Secure Livelihoods Research Consortium.
CBS (Central Bureau of Statistics) (2012) National population and housing census 2011: National
report. Kathmandu: CBS.
European Report on Development (2009) Overcoming fragility in Africa: Forging a new European
approach. San Domenico di Fiesole: Robert Schuman Centre for Advanced Studies.
Ghale, Y. and Bishokarma, N. (2013) ‘Food security: a fundamental basis for human security’, in B.R.
Upreti, R. Bhattrai and G.R. Wagle (eds) Human security in Nepal: concepts, issues and challenges.
Kathmandu: Nepal Institute for Policy Studies and South Asia Regional Coordination Office of NCCR
(North-South).
Gill, G.J., Farrington, J., Anderson, E., Luttrell, C., Conway, T., Saxena, N.C. and Slater, R. (2003) Food
Security and The Millennium Development Goal on Hunger in Asia. Working Paper 231. London:
Overseas Development Institute.
Khan, A. and Khalid, U. (2012) ‘Consumption patterns of male and female headed households in
Pakistan: evidence from PSLM 2007-08’, The Pakistan Development Review 51(4): 465-478
(http://econpapers.repec.org/article/pidjournl/v_3a51_3ay_3a2012_3ai_3a4_3ap_3a465-478.htm).
Mallett, R. and Slater, R. (2012) Growth and livelihoods in fragile and conflict-affected situations.
Working Paper 9. London: SLRC.
Maxwell, D. and Caldwell, R. (2008) The Coping Strategies Index: field methods manual. Second
edition. CARE USA, Feinstein International Centre (Tufts University), TANGO International, World Food
Programme.
Morris, S., Carletto, C., Hoddinott, J. and Christiaensen, L.J.M. (1999) Validity of rapid estimates of
household wealth and income for health surveys in rural Africa. Food and Consumption Division
Discussion Paper No. 72. Washington, DC: International Food Policy Research Institute.
NPC (National Planning Commission) (2011) NLSS statistical report, volume II. Kathmandu: NPC.
OECD (Organisation for Economic Cooperation and Development) (2010) The state’s legitimacy in
fragile situations: unpacking complexity. Paris: OECD.
Seddon, D. and Adhikari, J.N. (2003) Conflict and food security in Nepal: a preliminary analysis.
Kathmandu: Rural Construction Nepal.
SLRC (Secure Livelihoods Research Consortium) (2013) SLRC panel survey (first round): the process
paper. London: SLRC.
Tiwari, M. (2007) ‘Chronic poverty and entitlement theory’. Third World Quarterly 28(1): 171-191.
Upreti, B.R., KC, S., Mallett, R. and Babajanian, B., with Pyakuryal, K., Ghimire, S., Ghimire, A. and
Sharma, S.R. (2012) Livelihoods, basic services and social protection in Nepal. Working Paper 7.
London: SLRC (www.odi.org.uk/resources/docs/7784.pdf).
World Bank (2013) ‘Migrants from developing countries to send home $414 billion in earnings in 2013’
2 October (www.worldbank.org/en/news/feature/2013/10/02/Migrants-from-developing-countries-to-
send-home-414-billion-in-earnings-in-2013).
Mallett, R., Hagen-Zanker, J., Slater, R. and Sturge., G (2015) ’Surveying livelihoods, service delivery and governance: baseline evidence from DRC, Nepal, Pakistan, Sri Lanka and Uganda’. London: SLRC

47
1 Annex A: Additional tables and figures
Table 1: Distribution of household, by religion 49
Table 2: Literacy status of members of the surveyed households, by gender 49
Table 3: Literacy status of the members of the surveyed households, by ethnic group 49
Table 4: Household size, by ethnicity 49
Table 5: Household involvement in livelihood activities (full sample) 50
Table 6: Household involvement in own agriculture, by district 50
Table 7: Involvement in own agriculture, by ethnic group 50
Table 8: Most important household income source (full sample) 51
Table 9: Involvement in own agriculture, by remittance receipt 51
Table 10: OLS regression of food insecurity score 52
Table 11: Food insecurity situation, by ethnicity 53
Table 12: Correlation of Food Security Index with other factors 53
Table 13: OLS regression analysis of Morris index 54
Table 14: Mean distance to nearest health facility, by district. 54
Table 15: OLS regression of distance to health facilities 55
Table 16: Multinomial logit regression of satisfaction with health facilities 56
Table 17: OLS regression of distance to boys’ school 58
Table 18: OLS regression of distance to girls’ school 59
Table 19: Logit regression of satisfaction with boys’ school 60
Table 20: Logit regression of satisfaction with girls’ school 61
Table 21: OLS regression of distance to water source 62
Table 22: Perception of water quality, by district 62
Table 23: Perception of water quality, by agency providing water 63
Table 24: Perception of water quality, by food insecurity status 63
Table 25: Logit regression of access to clean and safe water 63
Table 26: Social protection access, by district 64
Table 27: Social protection access, by household size 64
Table 28: Social protection access, by ethnicity 64
Table 29: Logit regression of receipt of social protection transfer 65
Table 30: Perception of Old Age Allowance, by district 65
Table 31: Multinomial logit regression of impact of Old Age Allowance 66
Table 32: Receipt of livelihoods transfer, by district (%) 67
Table 33: Receipt of livelihoods transfer, by ethnic group (%) 67
Table 34: Logit regression of receipt of livelihoods transfer 68
Table 35: Logit regression of whether livelihood transfer improved production 69
Table 36: Perception of local government, by district 70
Table 37: Perception of local government, by urban area 70
Table 38: Perception of local government, by respondent gender 70
Table 39: Perception of local government, by ethnic group 70
Table 40: Logit regression of perception that local government cares about opinions 71
Table 41: Multinomial logit regression of perception that local government reflects priorities 72
Table 42: Logit regression of perception that local government cares about opinions including education
variables 75
Table 43: Perception of central government, by district 77
Table 44: Perception of central government, by ethnic group 77

48
Table 45: Perception of central government, by respondent’s gender 77
Table 46: Logit regression of perception that central government cares about opinions 78
Table 47: Multinomial logit regression of perception that central government decisions reflect priorities79
Table 48: Logit regression of perception that central government cares about opinions including education
variables 82

49
Table 1: Distribution of household, by religion
Religion Frequency Percent
Muslim 97 3.1
Hindu 2586 81.4
Buddhist 159 5.0
Christian 62 2.0
Kirat 251 7.9
None 8 0.3
Mixed 10 0.3
Others 3 0.1
Total 3176 100.0
Source: Field Survey
Table 2: Literacy status of members of the surveyed households, by gender
Table 3: Literacy status of the members of the surveyed households, by ethnic group
Ethnicity (***) Illiterate Percent Literate Percent Total
Brahmin 701 15.5 3835 84.5 4536
Janjati 1855 26.2 5228 73.8 7083
Dalit 321 28.1 820 71.9 1141
Mixed 48 15.4 264 84.6 312
Madhesi 340 32.9 692 67.1 1032
Muslim 175 30.3 403 69.7 578
Other 7 31.8 15 68.2 221
Total 3447 23.4 11257 76.6 14704
Source: Field Survey
Table 4: Household size, by ethnicity
Ethnic Group Household size
Brahmin 4.6
Janjati 5.0
Dalit 5.1
Mixed 5.2
Madhesi 5.6
Muslim 6.5
Other 3.8
Total 5.0
Source: Field Survey, 2012
1 In the analysis the ‘mixed’ and ‘others’ categories are merged because of small frequency.
Gender (***) Illiterate Percent Literate Percent Total
Male 1114 15.7 5979 84.3 7093
Female 2333 30.7 5278 69.4 7611
Total 3447 23.4 11257 76.6 14704

50
Table 5: Household involvement in livelihood activities (full sample)
Livelihood activity Total HHs engaged in activity (n) Total HHs engaged in activity (%)
Agriculture 2510 79.1
Social protection transfers 1205 38.0
Casual labour (non-agric.) 1192 37.6
Casual labour (agric.) 787 24.8
Own business 659 20.8
Selling goods 535 16.9
Private sector job (non-agric.) 413 13.0
Public sector job 343 10.8
Migration (remittances) 51 1.6
Private sector job 35 1.1
Table 6: Household involvement in own agriculture, by district
Involvement in own cultivation livestock and fishery
Region (***) No Yes Total
Count Row % Count Row %
Rolpa 37 5.17 679 94.83 716
Bardiya 439 36.22 773 63.78 1212
Ilam 118 15.09 1058 84.91 1246
Total 664 20.92 2510 7908 3174
Table 7: Involvement in own agriculture, by ethnic group
Involvement in own cultivation livestock and fishery
Caste/ethnicity (***) No Yes Total
Count Row % Count Row %
Brahmin 229 21.7 824 78.3 1053
Janjati 241 16.0 1262 84.0 1503
Dalit 49 19.8 198 80.2 247
Madhesi 60 29.7 142 70.3 202
Muslim 70 72.2 27 27.8 97
Other 15 20.8 57 79.2 72
Total 664 20.9 2510 79.1 3174
Source: Field Survey 2012
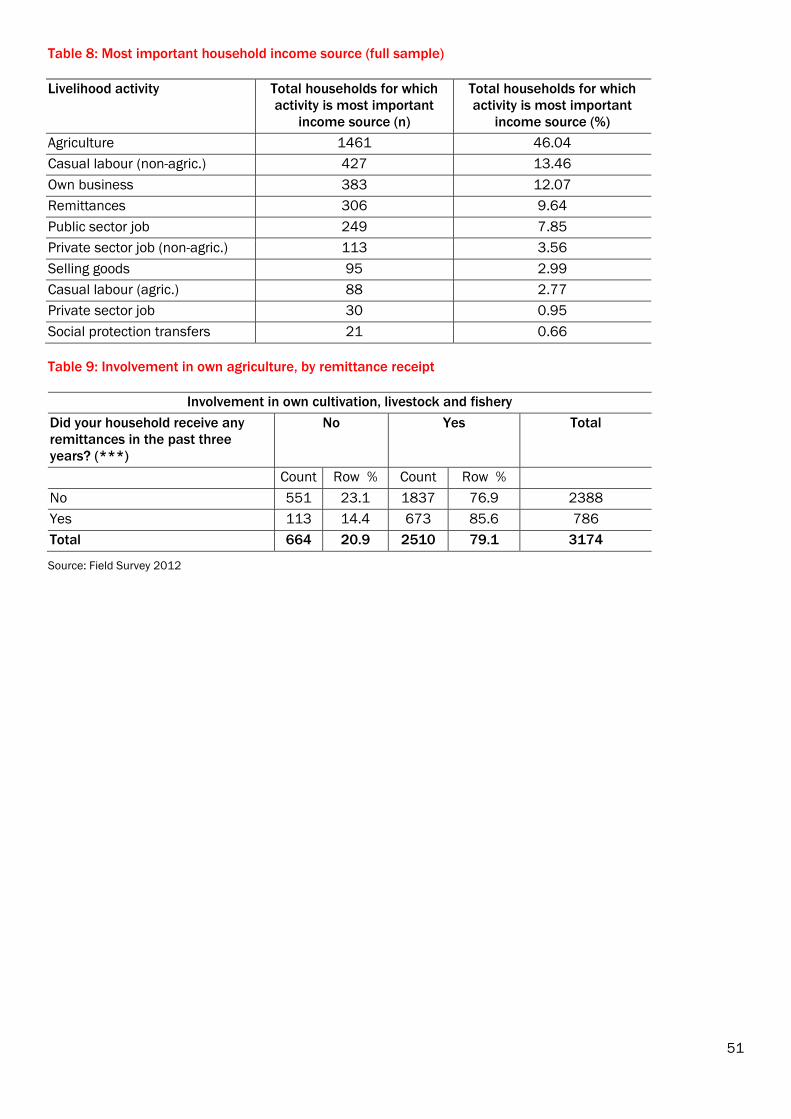
51
Table 8: Most important household income source (full sample)
Livelihood activity Total households for which
activity is most important
income source (n)
Total households for which
activity is most important
income source (%)
Agriculture 1461 46.04
Casual labour (non-agric.) 427 13.46
Own business 383 12.07
Remittances 306 9.64
Public sector job 249 7.85
Private sector job (non-agric.) 113 3.56
Selling goods 95 2.99
Casual labour (agric.) 88 2.77
Private sector job 30 0.95
Social protection transfers 21 0.66
Table 9: Involvement in own agriculture, by remittance receipt
Involvement in own cultivation, livestock and fishery
Did your household receive any
remittances in the past three
years? (***)
No Yes Total
Count Row % Count Row %
No 551 23.1 1837 76.9 2388
Yes 113 14.4 673 85.6 786
Total 664 20.9 2510 79.1 3174
Source: Field Survey 2012

52
Table 10: OLS regression of food insecurity score
Food Insecurity Score Coefficient Standard
Error
t-statistic P>t
Female Household Head -0.81 0.35 -2.34 0.02
Average Age in Household -0.05 0.01 -5.52 0.00
Main Income: Own Cultivation 0.13 0.19 0.66 0.51
Median Education Level -0.64 0.07 -8.88 0.00
Migrant Household 0.57 0.37 1.54 0.12
Household Receives Remittances -0.36 0.24 -1.49 0.14
Lived in Village all Respondent's
Life
0.10 0.19 0.52 0.60
Ethnic Minority 1.39 0.25 5.66 0.00
Dependency Ratio 0.07 0.15 0.48 0.63
Morris Index -0.03 0.00 -6.33 0.00
Urban 1.21 0.22 5.59 0.00
Conflict in Last 3 Years 0.05 0.19 0.26 0.80
Safe in Neighbourhood -0.98 0.31 -3.21 0.00
Access to Credit -2.62 0.33 -8.01 0.00
District: Rolpa 0.38 0.29 1.29 0.20
District: Bardiya 0.84 0.23 3.65 0.00
Total Shocks 0.04 0.02 1.63 0.10
Total crimes 0.10 0.03 3.26 0.00
Distance to Clinic 0.01 0.00 4.16 0.00
Distance to Water Source 0.00 0.01 0.38 0.70
Receiving Social Protection 0.52 0.20 2.61 0.01
Receiving Livelihood Transfer -0.32 0.24 -1.30 0.19
Overall Satisfied with Health 0.26 0.12 2.12 0.04
Water Clean and Safe -1.31 0.29 -4.55 0.00
Constant 9.02 0.75 11.97 0.00
Observations 2812.00
R-squared 0.19

53
Table 11: Food insecurity situation, by ethnicity
Caste/
Ethnicity (***)
No food
insecurity
Low food
insecurity
Medium food
insecurity
High food
insecurity
Total
Count Row % Count Row % Count Row % Count Row % Count
Brahmin 698 66.3 211 20.0 87 8.3 57 5.4 1053
Janjati/ indigenous
groups
847 56.4 282 18.8 169 11.2 205 13.6 1503
Dalit 95 38.5 53 21.5 50 20.2 49 19.8 247
Madhesi 66 32.7 23 11.4 40 19.8 73 36.1 202
Muslim 39 40.2 16 16.5 14 14.4 28 28.9 97
Other 38 52.8 20 27.8 8 11.1 6 8.3 72
Total 1783 56.2 605 19.1 368 11.6 418 13.2 3174
Source: Field Survey 2012
Table 12: Correlation of Food Security Index with other factors
Item Correlation with food insecurity index
Morris Index -.183**
Mean age of household -.117**
Household Size .088**
Percentage of household members involving in own
cultivation, livestock or fishing -0.022
Percentage of household members involving in
casual labour (agriculture/fishery) .241**
Percentage of household members involving in
casual labour (non-agriculture) .185**
Percentage of household members involving in
selling goods (agrl. products, petty trade) -.079**
Percentage of household members involving in own
business (hair dressing, food processing) -.102**
Percentage of household members involving in
private sector job in agri/fishery -0.019
Percentage of household members involving in
private sector job in non-agri/fishery -.044*
Percentage of household members involving in public
sector job -.111**
Percentage of household members involving in paid
housework and childcare -0.002
Time to reach to the nearest health clinic (in minutes) .085**
Time to fetch the drinking water (in minutes) .063**
Time for boys to reach to the primary school (in
minutes) -0.053
Time for girls to reach to the primary school (in
minutes) -0.008
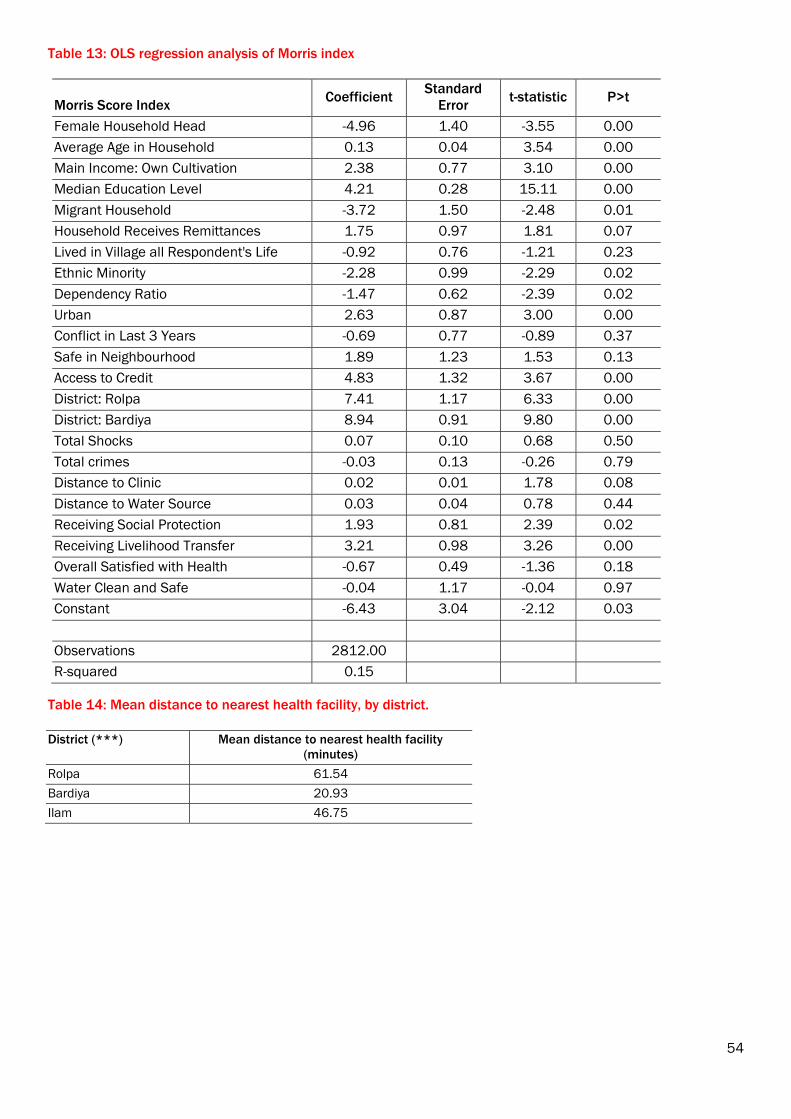
54
Table 13: OLS regression analysis of Morris index
Morris Score Index Coefficient
Standard
Error t-statistic P>t
Female Household Head -4.96 1.40 -3.55 0.00
Average Age in Household 0.13 0.04 3.54 0.00
Main Income: Own Cultivation 2.38 0.77 3.10 0.00
Median Education Level 4.21 0.28 15.11 0.00
Migrant Household -3.72 1.50 -2.48 0.01
Household Receives Remittances 1.75 0.97 1.81 0.07
Lived in Village all Respondent's Life -0.92 0.76 -1.21 0.23
Ethnic Minority -2.28 0.99 -2.29 0.02
Dependency Ratio -1.47 0.62 -2.39 0.02
Urban 2.63 0.87 3.00 0.00
Conflict in Last 3 Years -0.69 0.77 -0.89 0.37
Safe in Neighbourhood 1.89 1.23 1.53 0.13
Access to Credit 4.83 1.32 3.67 0.00
District: Rolpa 7.41 1.17 6.33 0.00
District: Bardiya 8.94 0.91 9.80 0.00
Total Shocks 0.07 0.10 0.68 0.50
Total crimes -0.03 0.13 -0.26 0.79
Distance to Clinic 0.02 0.01 1.78 0.08
Distance to Water Source 0.03 0.04 0.78 0.44
Receiving Social Protection 1.93 0.81 2.39 0.02
Receiving Livelihood Transfer 3.21 0.98 3.26 0.00
Overall Satisfied with Health -0.67 0.49 -1.36 0.18
Water Clean and Safe -0.04 1.17 -0.04 0.97
Constant -6.43 3.04 -2.12 0.03
Observations 2812.00
R-squared 0.15
Table 14: Mean distance to nearest health facility, by district.
District (***) Mean distance to nearest health facility
(minutes)
Rolpa 61.54
Bardiya 20.93
Ilam 46.75

55
Table 15: OLS regression of distance to health facilities
Distance to health centre Coefficient Standard Error t-statistic P>t
Female Household Head -0.96 2.61 -0.37 0.71
Average Age in Household 0.02 0.07 0.29 0.77
Main Income: Own Cultivation 9.13 1.44 6.32 0.00
Median Education Level -4.12 0.55 -7.46 0.00
Migrant Household 2.46 2.85 0.86 0.39
Household Receives Remittances 5.41 1.81 2.99 0.00
Lived in Village all Respondent's Life -3.72 1.42 -2.63 0.01
Ethnic Minority -5.02 1.87 -2.69 0.01
Dependency Ratio 0.84 1.11 0.76 0.45
Morris Index 0.11 0.04 2.82 0.01
Food Insecurity Index 0.59 0.14 4.15 0.00
Own Man-Powered Vehicle 6.14 1.96 3.14 0.00
Own Petrol-Powered Vehicle -4.39 2.90 -1.51 0.13
Urban -2.67 1.80 -1.48 0.14
Conflict in Last 3 Years -2.96 1.46 -2.03 0.04
Safe in Neighbourhood -3.32 2.32 -1.43 0.15
District: Rolpa 17.33 2.29 7.57 0.00
District: Bardiya -26.26 2.04 -12.89 0.00
Total Shocks 0.78 0.17 4.48 0.00
Total crimes -0.31 0.24 -1.30 0.19
Satisfied with Number of Qualified Personnel 1.40 2.09 0.67 0.51
Dissatisfied with Number of Qualified Personnel -0.23 3.89 -0.06 0.95
Satisfied with Availability of Medicine 2.25 1.95 1.16 0.25
Dissatisfied with Availability of Medicine -5.61 3.55 -1.58 0.11
Satisfied with Waiting Time -7.93 2.05 -3.87 0.00
Dissatisfied with Waiting Time -0.02 3.65 -0.01 1.00
Official Fees: Health Clinic 11.37 1.98 5.74 0.00
Informal Fees: Health Clinic 3.44 2.84 1.21 0.23
Clinic Run by Government 4.64 1.67 2.78 0.01
Community Meeting Held (Health) -2.11 2.80 -0.75 0.45
Attended Meeting on Health 7.03 3.44 2.04 0.04
Constant 41.92 5.59 7.50 0.00
Observations 2973
R-squared 0.24

56
Table 16: Multinomial logit regression of satisfaction with health facilities
Satisfaction with health centre Coefficient Standard Error t-statistic P>t
Satisfied (base outcome)
Neutral
Respondent is Female -0.07 0.17 -0.41 0.68
Age of respondent 0.00 0.01 0.26 0.79
Main Income: Own Cultivation 0.21 0.14 1.48 0.14
Highest education level of respondent 0.00 0.05 0.05 0.96
Migrant Household -0.41 0.32 -1.30 0.20
Household Receives Remittances -0.10 0.18 -0.55 0.59
Lived in Village all Respondent's Life 0.21 0.16 1.29 0.20
Ethnic Minority 0.00 0.19 0.00 1.00
Dependency Ratio 0.04 0.10 0.42 0.67
Morris Index 0.01 0.00 1.53 0.13
Food Insecurity Index 0.04 0.01 3.18 0.00
Urban -0.45 0.19 -2.43 0.02
Conflict in Last 3 Years 0.32 0.15 2.17 0.03
Safe in Neighbourhood -0.22 0.23 -0.95 0.34
District: Rolpa -0.51 0.23 -2.19 0.03
District: Bardiya -0.22 0.19 -1.14 0.26
Total Shocks 0.05 0.02 2.94 0.00
Total crimes -0.01 0.02 -0.34 0.73
Distance to Clinic 0.00 0.00 1.25 0.21
Satisfied with Number of Qualified Personnel -2.58 0.15 -16.71 0.00
Dissatisfied with Number of Qualified Personnel -0.11 0.39 -0.27 0.79
Satisfied with Availability of Medicine -2.22 0.15 -14.80 0.00
Dissatisfied with Availability of Medicine -0.06 0.31 -0.18 0.86
Satisfied with Waiting Time -1.41 0.18 -8.01 0.00
Dissatisfied with Waiting Time 0.25 0.32 0.79 0.43
Official Fees: Health Clinic 0.33 0.21 1.59 0.11
Informal Fees: Health Clinic 0.28 0.28 1.01 0.31
Clinic Run by Government 0.45 0.17 2.57 0.01
Community Meeting Held (Health) 0.30 0.26 1.15 0.25
Attended Meeting on Health -0.17 0.33 -0.52 0.60
Dissatisfied
Respondent is Female -0.28 0.30 -0.95 0.34
Age of respondent -0.01 0.01 -0.71 0.48
Main Income: Own Cultivation 0.34 0.26 1.28 0.20
Highest education level of respondent -0.04 0.09 -0.40 0.69
Migrant Household 0.56 0.50 1.13 0.26
Household Receives Remittances -0.06 0.33 -0.19 0.85
Lived in Village all Respondent's Life -0.05 0.29 -0.18 0.85
Ethnic Minority -0.17 0.36 -0.47 0.64
Dependency Ratio -0.37 0.21 -1.75 0.08
Morris Index 0.00 0.01 -0.30 0.77
Food Insecurity Index 0.04 0.03 1.56 0.12
Urban -0.54 0.32 -1.70 0.09
Conflict in Last 3 Years 0.20 0.27 0.75 0.45

57
Safe in Neighbourhood -0.74 0.39 -1.88 0.06
District: Rolpa -1.24 0.47 -2.67 0.01
District: Bardiya -1.04 0.36 -2.93 0.00
Total Shocks 0.08 0.02 3.34 0.00
Total crimes 0.01 0.04 0.22 0.83
Distance to Clinic 0.00 0.00 -0.41 0.68
Satisfied with Number of Qualified Personnel -2.28 0.31 -7.33 0.00
Dissatisfied with Number of Qualified Personnel 2.31 0.44 5.29 0.00
Satisfied with Availability of Medicine -2.03 0.33 -6.16 0.00
Dissatisfied with Availability of Medicine 1.91 0.37 5.17 0.00
Satisfied with Waiting Time -1.21 0.32 -3.72 0.00
Dissatisfied with Waiting Time 1.30 0.45 2.89 0.00
Official Fees: Health Clinic 1.41 0.45 3.12 0.00
Informal Fees: Health Clinic 0.87 0.52 1.68 0.09
Clinic Run by Government 1.37 0.36 3.77 0.00
Community Meeting Held (Health) 0.98 0.43 2.31 0.02
Attended Meeting on Health -0.53 0.54 -0.98 0.33
Constant -0.70 1.07 -0.65 0.51
Observations 2973.00
Pseudo R-squared 0.53

58
Table 17: OLS regression of distance to boys’ school
Distance to boys' school Coefficient
Standard
Error t-statistic P>t
Female Household Head 1.24 2.56 0.48 0.63
Average Age in Household -0.19 0.11 -1.73 0.08
Main Income: Own Cultivation 4.45 1.48 3.02 0.00
Median Education Level -1.91 0.64 -2.98 0.00
Migrant Household 2.90 2.88 1.01 0.31
Household Receives Remittances 4.36 1.90 2.29 0.02
Lived in Village all Respondent's Life 1.38 1.46 0.94 0.35
Ethnic Minority -3.89 1.76 -2.21 0.03
Dependency Ratio -0.13 1.07 -0.12 0.91
Morris Index 0.07 0.04 1.84 0.07
Food Insecurity Index -0.02 0.13 -0.18 0.86
Own Man-Powered Vehicle -1.90 1.99 -0.96 0.34
Own Petrol-Powered Vehicle -4.99 3.33 -1.50 0.14
Urban 5.34 1.82 2.94 0.00
Conflict in Last 3 Years -2.38 1.48 -1.62 0.11
Safe in Neighbourhood 0.92 2.35 0.39 0.70
District: Rolpa 4.08 2.24 1.82 0.07
District: Bardiya -10.90 2.12 -5.13 0.00
Total Shocks 0.20 0.18 1.10 0.27
Total crimes -0.06 0.27 -0.24 0.81
Satisfied with Number of Teachers (Boys) 2.66 2.57 1.04 0.30
Dissatisfied with Number of Teachers (Boys) -5.82 7.82 -0.74 0.46
Satisfied with Quality of Teaching(Boys) 1.56 2.23 0.70 0.48
Dissatisfied with Quality of Teaching(Boys) 4.72 7.68 0.61 0.54
Satisfied with Teacher Attendance (Boys) -1.39 2.71 -0.51 0.61
Dissatisfied with Teacher Attendance (Boys) 11.77 6.60 1.78 0.08
Satisfied with Class Size(Boys) -2.85 2.53 -1.12 0.26
Dissatisfied with Class Size(Boys) -5.21 7.98 -0.65 0.51
Satisfied with Quality of Infrastructure(Boys) 1.86 2.28 0.82 0.41
Dissatisfied with Quality of Infrastructure(Boys) -2.97 4.14 -0.72 0.47
Satisfied with Quality of Equipment (Boys) -0.46 2.55 -0.18 0.86
Dissatisfied with Quality of Equipment (Boys) -0.11 5.87 -0.02 0.99
Official Fees: Boys' School 0.56 2.00 0.28 0.78
Informal Fees: Boys' School 1.22 1.53 0.80 0.43
Boys' School Run by Government -5.66 2.22 -2.54 0.01
Community Meeting Held (Education) -2.82 2.62 -1.07 0.28
Attended Meeting on Education 0.84 2.84 0.29 0.77
Constant 34.04 6.49 5.24 0.00
Observations 1129.00
R-squared 0.16

59
Table 18: OLS regression of distance to girls’ school
Distance to girls' school Coefficient
Standard
Error t-statistic P>t
Female Household Head 5.26 2.61 2.01 0.04
Average Age in Household 0.07 0.11 0.64 0.52
Main Income: Own Cultivation 4.78 1.40 3.41 0.00
Median Education Level -0.92 0.61 -1.49 0.14
Migrant Household 3.93 2.82 1.39 0.16
Household Receives Remittances 0.84 1.74 0.48 0.63
Lived in Village all Respondent's Life -1.12 1.38 -0.81 0.42
Ethnic Minority -2.38 1.71 -1.39 0.16
Dependency Ratio 0.00 1.02 0.00 1.00
Morris Index 0.02 0.03 0.57 0.57
Food Insecurity Index 0.16 0.13 1.25 0.21
Own Man-Powered Vehicle -2.32 1.88 -1.23 0.22
Own Petrol-Powered Vehicle -3.66 3.02 -1.21 0.23
Urban 4.56 1.74 2.62 0.01
Conflict in Last 3 Years -0.48 1.42 -0.34 0.73
Safe in Neighbourhood 1.09 2.20 0.49 0.62
District: Rolpa 1.13 2.12 0.53 0.59
District: Bardiya -9.17 1.99 -4.61 0.00
Total Shocks 0.21 0.16 1.32 0.19
Total crimes -0.23 0.33 -0.69 0.49
Satisfied with Number of Teachers (Girls) 1.66 2.33 0.71 0.48
Dissatisfied with Number of Teachers (Girls) 2.23 5.43 0.41 0.68
Satisfied with Quality of Teaching(Girls) 1.10 2.05 0.54 0.59
Dissatisfied with Quality of Teaching(Girls) -6.74 5.51 -1.22 0.22
Satisfied with Teacher Attendance (Girls) -0.02 2.44 -0.01 0.99
Dissatisfied with Teacher Attendance (Girls) -5.38 6.40 -0.84 0.40
Satisfied with Class Size(Girls) -0.60 2.23 -0.27 0.79
Dissatisfied with Class Size(Girls) -5.67 5.36 -1.06 0.29
Satisfied with Quality of Infrastructure(Girls) 4.31 2.26 1.91 0.06
Dissatisfied with Quality of Infrastructure(Girls) 4.61 4.07 1.13 0.26
Satisfied with Quality of Equipment (Girls) -1.58 2.29 -0.69 0.49
Dissatisfied with Quality of Equipment (Girls) 0.51 4.60 0.11 0.91
Official Fees: Girls' School 1.65 1.85 0.89 0.37
Informal Fees: Girls' School 3.65 1.47 2.48 0.01
Girls' School run by Government 0.84 2.17 0.39 0.70
Community Meeting Held (Education) -1.52 2.54 -0.60 0.55
Attended Meeting on Education 0.57 2.75 0.21 0.84
Constant 16.38 6.30 2.60 0.01
Observations 1011.00
R-squared 0.14

60
Table 19: Logit regression of satisfaction with boys’ school
Satisfied with boys' school Coefficient
Standard
Error t-statistic P>t
Respondent is Female 0.14 0.33 0.42 0.67
Age of respondent 0.02 0.01 1.74 0.08
Main Income: Own Cultivation 0.16 0.29 0.54 0.59
Highest education level of respondent 0.20 0.12 1.66 0.10
Migrant Household -0.84 0.55 -1.52 0.13
Household Receives Remittances 0.85 0.35 2.44 0.02
Lived in Village all Respondent's Life 0.38 0.32 1.18 0.24
Ethnic Minority 0.09 0.36 0.25 0.80
Dependency Ratio -0.16 0.21 -0.78 0.43
Morris Index 0.00 0.01 0.22 0.83
Food Insecurity Index 0.05 0.02 2.28 0.02
Urban -0.78 0.39 -2.02 0.04
Conflict in Last 3 Years 0.35 0.29 1.20 0.23
Safe in Neighbourhood -0.11 0.40 -0.27 0.79
District: Rolpa -0.87 0.43 -2.01 0.04
District: Bardiya 0.21 0.38 0.56 0.57
Total Shocks 0.03 0.03 0.88 0.38
Total crimes 0.06 0.04 1.76 0.08
How far is it to the primary school you use? (in
minutes) 0.00 0.01 0.43 0.67
Satisfied with Number of Teachers (Boys) -1.59 0.35 -4.57 0.00
Dissatisfied with Number of Teachers (Boys) -1.77 1.31 -1.36 0.18
Satisfied with Quality of Teaching(Boys) -1.41 0.31 -4.58 0.00
Satisfied with Teacher Attendance (Boys) -2.01 0.34 -5.93 0.00
Dissatisfied with Teacher Attendance (Boys) -0.30 0.90 -0.33 0.74
Satisfied with Class Size(Boys) -1.22 0.34 -3.54 0.00
Dissatisfied with Class Size(Boys) 1.23 1.21 1.02 0.31
Satisfied with Quality of Infrastructure(Boys) -1.40 0.33 -4.23 0.00
Dissatisfied with Quality of Infrastructure(Boys) 1.33 0.53 2.51 0.01
Satisfied with Quality of Equipment (Boys) -1.30 0.34 -3.80 0.00
Dissatisfied with Quality of Equipment (Boys) -1.50 0.88 -1.72 0.09
Official Fees: Boys' School -0.33 0.38 -0.86 0.39
Informal Fees: Boys' School 0.23 0.31 0.75 0.45
Boys' School Run by Government 0.09 0.43 0.20 0.84
Community Meeting Held (Education) 0.51 0.47 1.08 0.28
Attended Meeting on Education -0.61 0.54 -1.12 0.26
Constant 2.96 1.20 2.46 0.01
Observations 1112.00
Pseudo R-squared 0.53

61
Table 20: Logit regression of satisfaction with girls’ school
Satisfied with girls' school Coefficient
Standard
Error t-statistic P>t
Respondent is Female -0.14 0.36 -0.39 0.69
Age of respondent -0.01 0.01 -0.91 0.36
Main Income: Own Cultivation -0.39 0.31 -1.24 0.22
Highest education level of respondent 0.20 0.12 1.59 0.11
Migrant Household -2.03 0.81 -2.51 0.01
Household Receives Remittances 0.16 0.33 0.47 0.64
Lived in Village all Respondent's Life -0.39 0.35 -1.12 0.26
Ethnic Minority 0.20 0.37 0.53 0.59
Dependency Ratio 0.25 0.19 1.32 0.19
Morris Index 0.00 0.01 0.24 0.81
Food Insecurity Index 0.05 0.03 2.08 0.04
Urban -1.28 0.45 -2.81 0.01
Conflict in Last 3 Years 0.53 0.31 1.71 0.09
Safe in Neighbourhood -0.52 0.43 -1.21 0.23
District: Rolpa 0.58 0.43 1.35 0.18
District: Bardiya 1.48 0.43 3.43 0.00
Total Shocks 0.03 0.03 1.13 0.26
Total crimes 0.00 0.05 0.09 0.93
How far is it to the primary school you use? (in minutes) 0.00 0.01 -0.11 0.91
Satisfied with Number of Teachers (Girls) -1.80 0.36 -4.95 0.00
Dissatisfied with Number of Teachers (Girls) -1.01 0.87 -1.17 0.24
Satisfied with Quality of Teaching(Girls) -2.09 0.33 -6.37 0.00
Dissatisfied with Quality of Teaching(Girls) -0.62 0.73 -0.85 0.40
Satisfied with Teacher Attendance (Girls) -1.61 0.36 -4.52 0.00
Dissatisfied with Teacher Attendance (Girls) -0.82 0.94 -0.87 0.39
Satisfied with Class Size(Girls) -0.96 0.34 -2.84 0.00
Dissatisfied with Class Size(Girls) 0.30 0.74 0.41 0.68
Satisfied with Quality of Infrastructure(Girls) -1.56 0.35 -4.41 0.00
Dissatisfied with Quality of Infrastructure(Girls) 1.35 0.56 2.41 0.02
Satisfied with Quality of Equipment (Girls) -1.53 0.34 -4.46 0.00
Dissatisfied with Quality of Equipment (Girls) -0.50 0.67 -0.75 0.46
Official Fees: Girls' School -0.65 0.39 -1.69 0.09
Informal Fees: Girls' School -0.03 0.31 -0.08 0.94
Girls' School run by Government -0.61 0.47 -1.31 0.19
Community Meeting Held (Education) -0.66 0.61 -1.08 0.28
Attended Meeting on Education 0.66 0.65 1.01 0.31
Constant 5.36 1.28 4.18 0.00
Observations 1011.00
Pseudo R-squared 0.57
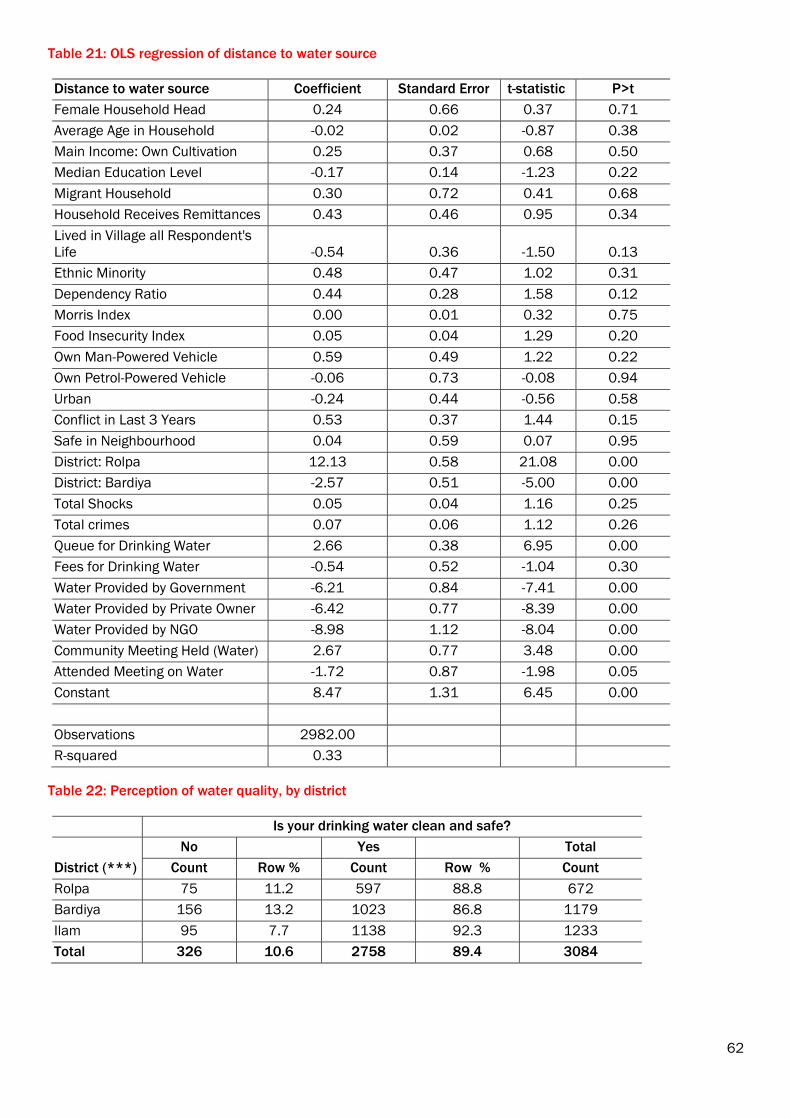
62
Table 21: OLS regression of distance to water source
Distance to water source Coefficient Standard Error t-statistic P>t
Female Household Head 0.24 0.66 0.37 0.71
Average Age in Household -0.02 0.02 -0.87 0.38
Main Income: Own Cultivation 0.25 0.37 0.68 0.50
Median Education Level -0.17 0.14 -1.23 0.22
Migrant Household 0.30 0.72 0.41 0.68
Household Receives Remittances 0.43 0.46 0.95 0.34
Lived in Village all Respondent's
Life -0.54 0.36 -1.50 0.13
Ethnic Minority 0.48 0.47 1.02 0.31
Dependency Ratio 0.44 0.28 1.58 0.12
Morris Index 0.00 0.01 0.32 0.75
Food Insecurity Index 0.05 0.04 1.29 0.20
Own Man-Powered Vehicle 0.59 0.49 1.22 0.22
Own Petrol-Powered Vehicle -0.06 0.73 -0.08 0.94
Urban -0.24 0.44 -0.56 0.58
Conflict in Last 3 Years 0.53 0.37 1.44 0.15
Safe in Neighbourhood 0.04 0.59 0.07 0.95
District: Rolpa 12.13 0.58 21.08 0.00
District: Bardiya -2.57 0.51 -5.00 0.00
Total Shocks 0.05 0.04 1.16 0.25
Total crimes 0.07 0.06 1.12 0.26
Queue for Drinking Water 2.66 0.38 6.95 0.00
Fees for Drinking Water -0.54 0.52 -1.04 0.30
Water Provided by Government -6.21 0.84 -7.41 0.00
Water Provided by Private Owner -6.42 0.77 -8.39 0.00
Water Provided by NGO -8.98 1.12 -8.04 0.00
Community Meeting Held (Water) 2.67 0.77 3.48 0.00
Attended Meeting on Water -1.72 0.87 -1.98 0.05
Constant 8.47 1.31 6.45 0.00
Observations 2982.00
R-squared 0.33
Table 22: Perception of water quality, by district
Is your drinking water clean and safe?
District (***)
No Yes Total
Count Row % Count Row % Count
Rolpa 75 11.2 597 88.8 672
Bardiya 156 13.2 1023 86.8 1179
Ilam 95 7.7 1138 92.3 1233
Total 326 10.6 2758 89.4 3084

63
Table 23: Perception of water quality, by agency providing water
Is your drinking water clean and safe?
Provider (***)
No Yes Total
Count Row % Count Row % Count
Government 61 7.7 734 92.3 795
Private / personal 220 11.8 1638 88.2 1858
NGO 7 5.0 132 95.0 139
Other 31 11.8 232 88.2 263
Total 319 10.4 2736 89.6 3055
Table 24: Perception of water quality, by food insecurity status
Food insecurity group (***)
Is your drinking water clean and safe?
No Yes Total
Count Row % Count Row % Count
No food insecurity 147 8.48 1587 91.52 1734
Low food insecurity 63 10.64 529 89.36 592
Medium food insecurity 37 10.36 320 89.64 357
High food insecurity 79 19.7 322 80.3 322
Total 326 10.57 2758 89.43 3084
Table 25: Logit regression of access to clean and safe water
Clean and safe water Coefficient Standard Error t-statistic P>t
Respondent is Female 0.22 0.15 1.45 0.15
Age of respondent 0.01 0.01 2.25 0.03
Main Income: Own Cultivation -0.17 0.13 -1.33 0.18
Highest education level of respondent 0.01 0.05 0.11 0.91
Migrant Household -0.17 0.23 -0.71 0.48
Household Receives Remittances -0.22 0.16 -1.36 0.17
Lived in Village all Respondent's Life 0.38 0.15 2.55 0.01
Ethnic Minority 0.27 0.17 1.59 0.11
Dependency Ratio -0.16 0.09 -1.84 0.07
Morris Index 0.00 0.00 -0.91 0.36
Food Insecurity Index -0.05 0.01 -4.96 0.00
Urban -0.60 0.16 -3.75 0.00
Conflict in Last 3 Years 0.11 0.13 0.80 0.42
Safe in Neighbourhood 0.24 0.19 1.26 0.21
District: Rolpa -0.70 0.22 -3.22 0.00
District: Bardiya -0.56 0.16 -3.40 0.00
Total Shocks -0.02 0.01 -1.61 0.11
Total crimes -0.01 0.02 -0.52 0.60
Queue for Drinking Water -0.26 0.13 -2.03 0.04
Fees for Drinking Water -0.58 0.19 -3.05 0.00
Water Provided by Government 0.85 0.31 2.77 0.01
Water Provided by Private Owner -0.09 0.27 -0.33 0.74
Water Provided by NGO 1.15 0.50 2.33 0.02
Community Meeting Held (Water) -0.15 0.28 -0.55 0.58

64
Attended Meeting on Water 0.28 0.32 0.87 0.38
Constant 2.32 0.49 4.77 0.00
Observations 2901.00
Pseudo R-squared 0.06
Table 26: Social protection access, by district
District (***)
Receiving at least one social protection
No Yes Total
Count Row % Count Row % Count
Rolpa 396 55.3 320 44.7 716
Bardiya 708 58.4 504 41.6 1212
Ilam 865 69.4 381 30.6 1246
Total 1969 62.0 1205 38.0 3174
Source: Field Survey 2012
Table 27: Social protection access, by household size
Household size
(***)
Receiving at least one social protection transfer
No Yes Total
Count Row % Count Row % Count
1 to 3 571 75.1 189 24.9 760
4 to 6 1124 62.4 678 37.6 1802
6 or above 274 44.8 338 55.2 612
Total 1969 62.0 1205 38.0 3174
Source: Field Survey 2012
Table 28: Social protection access, by ethnicity
Caste/ethnicity
(***)
Receiving at least one social protection
No Yes Total
Count Row % Count Row % Count
Brahmin 737 70.0 316 30.0 1053
Janjati 962 64.0 541 36.0 1503
Dalit 81 32.8 166 67.2 247
Madhesi 87 43.1 115 56.9 202
Muslim 54 55.7 43 44.3 97
Other 48 66.7 24 33.3 72
Total 1969 62.0 1205 38.0 3174
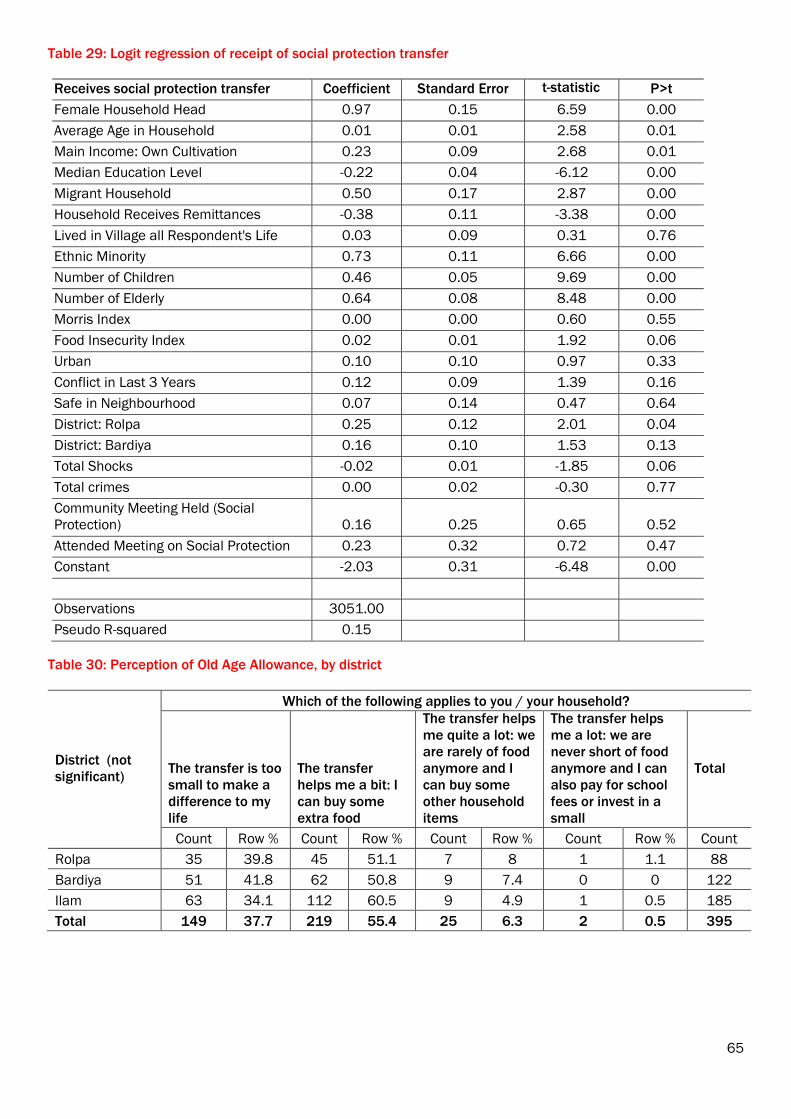
65
Table 29: Logit regression of receipt of social protection transfer
Receives social protection transfer Coefficient Standard Error t-statistic P>t
Female Household Head 0.97 0.15 6.59 0.00
Average Age in Household 0.01 0.01 2.58 0.01
Main Income: Own Cultivation 0.23 0.09 2.68 0.01
Median Education Level -0.22 0.04 -6.12 0.00
Migrant Household 0.50 0.17 2.87 0.00
Household Receives Remittances -0.38 0.11 -3.38 0.00
Lived in Village all Respondent's Life 0.03 0.09 0.31 0.76
Ethnic Minority 0.73 0.11 6.66 0.00
Number of Children 0.46 0.05 9.69 0.00
Number of Elderly 0.64 0.08 8.48 0.00
Morris Index 0.00 0.00 0.60 0.55
Food Insecurity Index 0.02 0.01 1.92 0.06
Urban 0.10 0.10 0.97 0.33
Conflict in Last 3 Years 0.12 0.09 1.39 0.16
Safe in Neighbourhood 0.07 0.14 0.47 0.64
District: Rolpa 0.25 0.12 2.01 0.04
District: Bardiya 0.16 0.10 1.53 0.13
Total Shocks -0.02 0.01 -1.85 0.06
Total crimes 0.00 0.02 -0.30 0.77
Community Meeting Held (Social
Protection) 0.16 0.25 0.65 0.52
Attended Meeting on Social Protection 0.23 0.32 0.72 0.47
Constant -2.03 0.31 -6.48 0.00
Observations 3051.00
Pseudo R-squared 0.15
Table 30: Perception of Old Age Allowance, by district
District (not
significant)
Which of the following applies to you / your household?
The transfer is too
small to make a
difference to my
life
The transfer
helps me a bit: I
can buy some
extra food
The transfer helps
me quite a lot: we
are rarely of food
anymore and I
can buy some
other household
items
The transfer helps
me a lot: we are
never short of food
anymore and I can
also pay for school
fees or invest in a
small
Total
Count Row % Count Row % Count Row % Count Row % Count
Rolpa 35 39.8 45 51.1 7 8 1 1.1 88
Bardiya 51 41.8 62 50.8 9 7.4 0 0 122
Ilam 63 34.1 112 60.5 9 4.9 1 0.5 185
Total 149 37.7 219 55.4 25 6.3 2 0.5 395

66
Table 31: Multinomial logit regression of impact of Old Age Allowance
Impact of old age transfer Coefficient Standard Error t-statistic P>t
The transfer is too small to make a difference to
my life (base outcome)
The transfer helps me a bit: I can buy some extra
food
Respondent is Female 0.87 0.24 -0.49 0.63
Age of respondent 1.01 0.01 0.88 0.38
Main Income: Own Cultivation 1.11 0.30 0.39 0.69
Highest education level of respondent 1.10 0.12 0.81 0.42
Migrant Household 0.33 0.18 -2.08 0.04
Household Receives Remittances 0.93 0.27 -0.23 0.82
Lived in Village all Respondent's Life 0.73 0.20 -1.12 0.26
Ethnic Minority 1.31 0.47 0.75 0.45
Children_sum 1.00 0.10 0.02 0.98
Elder_sum 0.98 0.24 -0.08 0.94
Morris Index 1.01 0.01 1.14 0.26
Food Insecurity Index 0.98 0.03 -0.72 0.47
Urban 1.01 0.30 0.05 0.96
Conflict in Last 3 Years 0.90 0.24 -0.41 0.69
Safe in Neighbourhood 2.85 1.27 2.36 0.02
District: Rolpa 1.37 0.54 0.79 0.43
District: Bardiya 0.50 0.16 -2.19 0.03
Total Shocks 0.91 0.04 -2.18 0.03
Total crimes 1.42 0.23 2.19 0.03
Transfer Not Always Right Amount 0.56 0.30 -1.10 0.27
Transfer Sometimes on Time 1.16 0.45 0.38 0.71
Transfer Never on Time 0.02 0.02 -3.54 0.00
Community Meeting Held (Social Protection) 0.60 0.40 -0.77 0.44
Attended Meeting on Social Protection 1.51 1.31 0.47 0.64
Constant 0.61 0.60 -0.51 0.61
The transfer helps me quite a lot: we are rarely
short of food anymore and I can buy some other
household items
Respondent is Female 0.73 0.40 -0.57 0.57
Age of respondent 1.00 0.02 -0.09 0.93
Main Income: Own Cultivation 0.54 0.27 -1.22 0.22
Highest education level of respondent 1.25 0.26 1.07 0.28
Migrant Household 1.19 1.09 0.19 0.85
Household Receives Remittances 0.54 0.34 -0.99 0.32
Lived in Village all Respondent's Life 0.64 0.35 -0.82 0.41
Ethnic Minority 1.27 0.80 0.38 0.70
Children_sum 0.83 0.18 -0.85 0.39
Elder_sum 1.78 0.78 1.31 0.19
Morris Index 0.98 0.02 -0.98 0.33
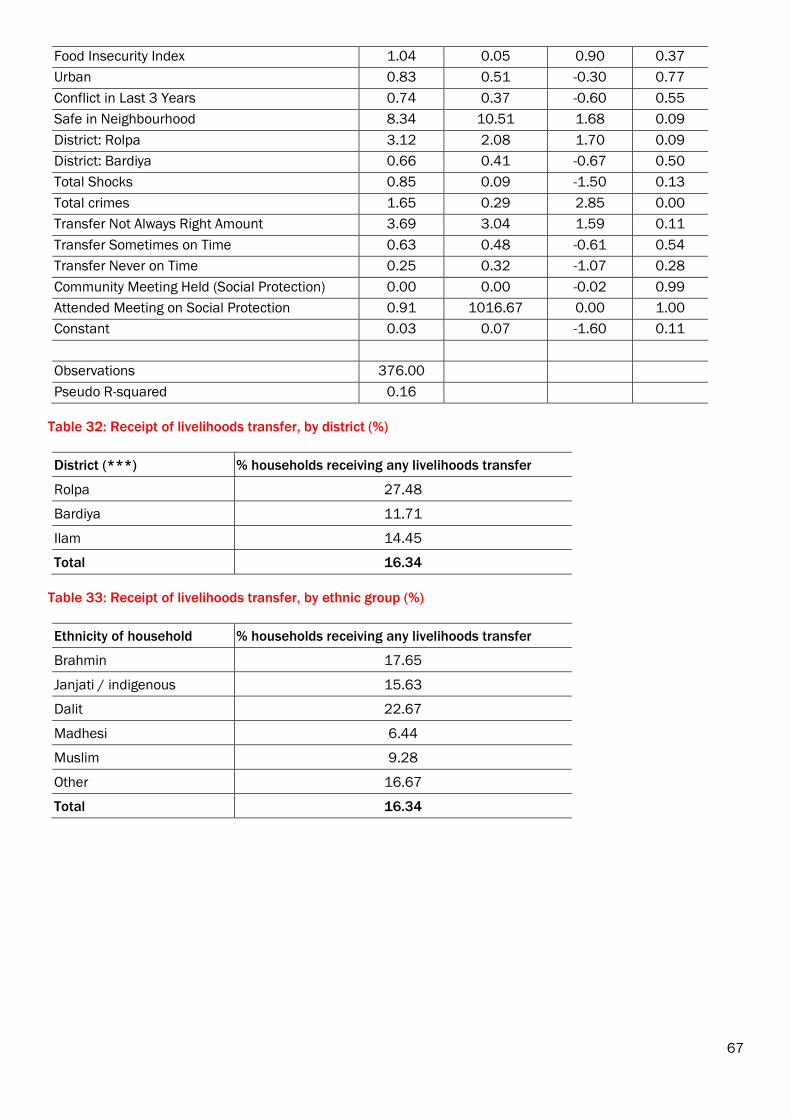
67
Food Insecurity Index 1.04 0.05 0.90 0.37
Urban 0.83 0.51 -0.30 0.77
Conflict in Last 3 Years 0.74 0.37 -0.60 0.55
Safe in Neighbourhood 8.34 10.51 1.68 0.09
District: Rolpa 3.12 2.08 1.70 0.09
District: Bardiya 0.66 0.41 -0.67 0.50
Total Shocks 0.85 0.09 -1.50 0.13
Total crimes 1.65 0.29 2.85 0.00
Transfer Not Always Right Amount 3.69 3.04 1.59 0.11
Transfer Sometimes on Time 0.63 0.48 -0.61 0.54
Transfer Never on Time 0.25 0.32 -1.07 0.28
Community Meeting Held (Social Protection) 0.00 0.00 -0.02 0.99
Attended Meeting on Social Protection 0.91 1016.67 0.00 1.00
Constant 0.03 0.07 -1.60 0.11
Observations 376.00
Pseudo R-squared 0.16
Table 32: Receipt of livelihoods transfer, by district (%)
District (***) % households receiving any livelihoods transfer
Rolpa 27.48
Bardiya 11.71
Ilam 14.45
Total 16.34
Table 33: Receipt of livelihoods transfer, by ethnic group (%)
Ethnicity of household % households receiving any livelihoods transfer
Brahmin 17.65
Janjati / indigenous 15.63
Dalit 22.67
Madhesi 6.44
Muslim 9.28
Other 16.67
Total 16.34
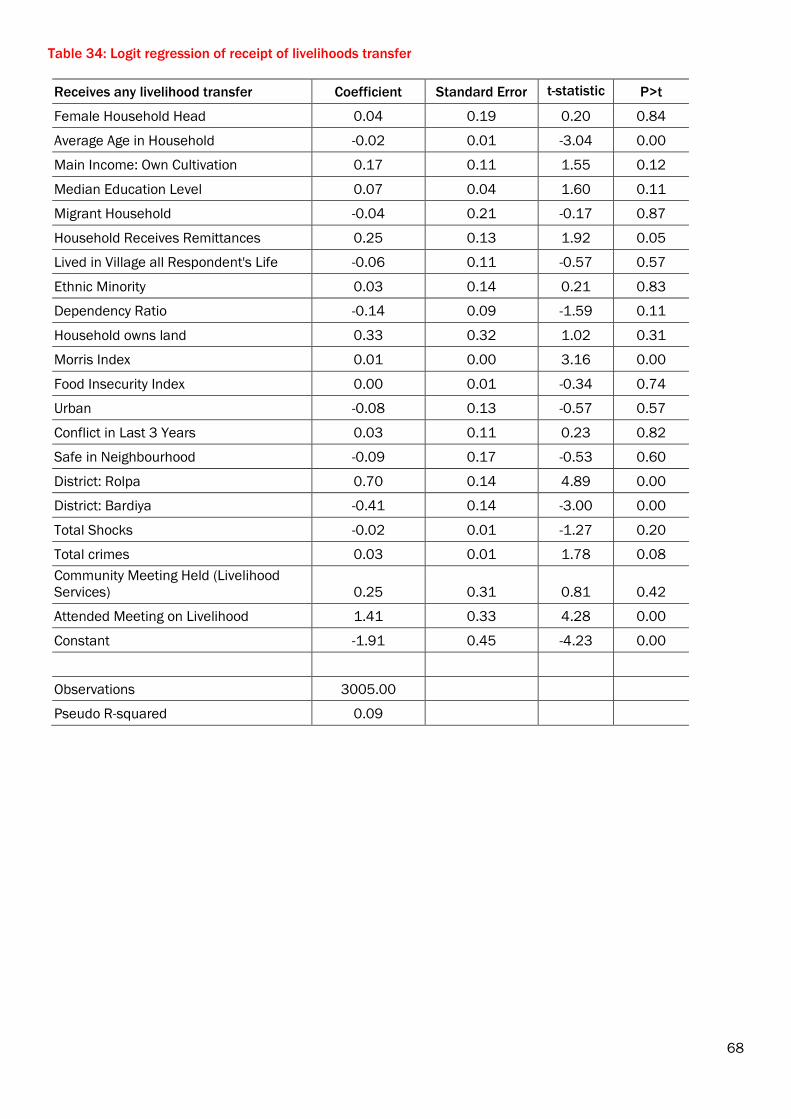
68
Table 34: Logit regression of receipt of livelihoods transfer
Receives any livelihood transfer Coefficient Standard Error t-statistic P>t
Female Household Head 0.04 0.19 0.20 0.84
Average Age in Household -0.02 0.01 -3.04 0.00
Main Income: Own Cultivation 0.17 0.11 1.55 0.12
Median Education Level 0.07 0.04 1.60 0.11
Migrant Household -0.04 0.21 -0.17 0.87
Household Receives Remittances 0.25 0.13 1.92 0.05
Lived in Village all Respondent's Life -0.06 0.11 -0.57 0.57
Ethnic Minority 0.03 0.14 0.21 0.83
Dependency Ratio -0.14 0.09 -1.59 0.11
Household owns land 0.33 0.32 1.02 0.31
Morris Index 0.01 0.00 3.16 0.00
Food Insecurity Index 0.00 0.01 -0.34 0.74
Urban -0.08 0.13 -0.57 0.57
Conflict in Last 3 Years 0.03 0.11 0.23 0.82
Safe in Neighbourhood -0.09 0.17 -0.53 0.60
District: Rolpa 0.70 0.14 4.89 0.00
District: Bardiya -0.41 0.14 -3.00 0.00
Total Shocks -0.02 0.01 -1.27 0.20
Total crimes 0.03 0.01 1.78 0.08
Community Meeting Held (Livelihood
Services) 0.25 0.31 0.81 0.42
Attended Meeting on Livelihood 1.41 0.33 4.28 0.00
Constant -1.91 0.45 -4.23 0.00
Observations 3005.00
Pseudo R-squared 0.09
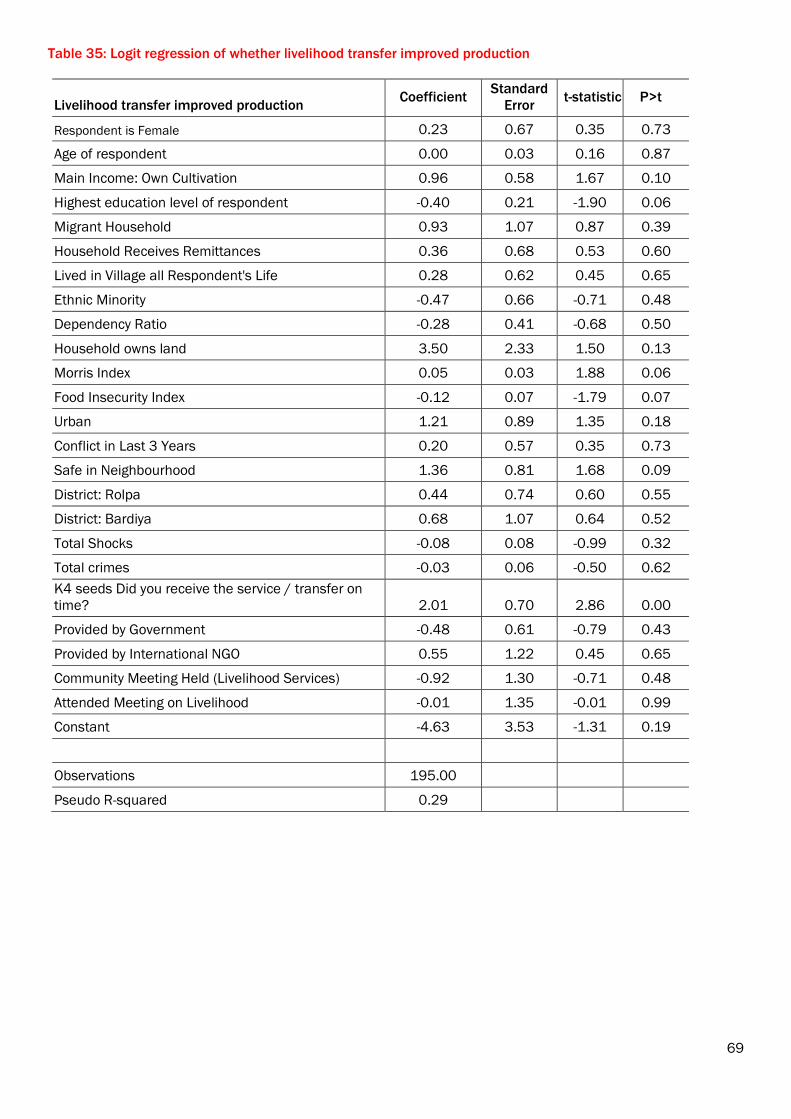
69
Table 35: Logit regression of whether livelihood transfer improved production
Livelihood transfer improved production Coefficient
Standard
Error t-statistic P>t
Respondent is Female 0.23 0.67 0.35 0.73
Age of respondent 0.00 0.03 0.16 0.87
Main Income: Own Cultivation 0.96 0.58 1.67 0.10
Highest education level of respondent -0.40 0.21 -1.90 0.06
Migrant Household 0.93 1.07 0.87 0.39
Household Receives Remittances 0.36 0.68 0.53 0.60
Lived in Village all Respondent's Life 0.28 0.62 0.45 0.65
Ethnic Minority -0.47 0.66 -0.71 0.48
Dependency Ratio -0.28 0.41 -0.68 0.50
Household owns land 3.50 2.33 1.50 0.13
Morris Index 0.05 0.03 1.88 0.06
Food Insecurity Index -0.12 0.07 -1.79 0.07
Urban 1.21 0.89 1.35 0.18
Conflict in Last 3 Years 0.20 0.57 0.35 0.73
Safe in Neighbourhood 1.36 0.81 1.68 0.09
District: Rolpa 0.44 0.74 0.60 0.55
District: Bardiya 0.68 1.07 0.64 0.52
Total Shocks -0.08 0.08 -0.99 0.32
Total crimes -0.03 0.06 -0.50 0.62
K4 seeds Did you receive the service / transfer on
time? 2.01 0.70 2.86 0.00
Provided by Government -0.48 0.61 -0.79 0.43
Provided by International NGO 0.55 1.22 0.45 0.65
Community Meeting Held (Livelihood Services) -0.92 1.30 -0.71 0.48
Attended Meeting on Livelihood -0.01 1.35 -0.01 0.99
Constant -4.63 3.53 -1.31 0.19
Observations 195.00
Pseudo R-squared 0.29

70
Table 36: Perception of local government, by district
District
(***)
To what extent do you feel that the decisions of those in power at the local government reflect your
own priorities
Never Almost never Only in some
areas To a large extent Completely Total
Count Row % Count Row % Count Row % Count Row % Count Row % Count
Rolpa 259 49.5 70 13.4 175 33.5 18 3.4 1 0.2 523
Bardiya 693 61.6 105 9.3 278 24.7 48 4.3 1 0.1 1125
Ilam 633 55.2 93 8.1 389 33.9 28 2.4 4 0.4 1147
Total 1585 56.7 268 9.6 842 30.1 94 3.4 6 0.2 2795
Table 37: Perception of local government, by urban area
Context
(***)
To what extent do you feel that the decisions of those in power at the local government reflect
your own priorities?
Never Almost never Only in some areas To a large extent Completely Total
Count Row % Count Row % Count Row % Count Row% Count Row % Count
Urban 525 54.2 76 7.9 322 33.3 43 4.4 2 0.2 968
Rural 1060 58 192 10.5 520 28.5 51 2.8 4 0.2 1827
Total 1585 56.7 268 9.6 842 30.1 94 3.4 6 0.2 2795
Table 38: Perception of local government, by respondent gender
Table 39: Perception of local government, by ethnic group
Caste/
ethnicity (**)
To what extent do you feel that the decisions of those in power at the local government reflect
your own priorities?
Never Almost never
Only in some
areas To a large extent Completely Total
Count Row % Count Row % Count Row % Count Row % Count Row % Count
Brahmin 534 55.5 78 8.1 317 33 29 3 4 0.4 962
Janjati 710 55.2 145 11.3 383 29.8 48 3.7 1 0.1 1287
Dalit 112 55.7 12 6 68 33.8 8 4 1 0.5 201
Madhesi 130 68.1 16 8.4 42 22 3 1.6 0 0 191
Muslim 60 65.2 11 12 16 17.4 5 5.4 0 0 92
Other 39 62.9 6 9.7 16 25.8 1 1.6 0 0 62
Total 1585 56.7 268 9.6 842 30.1 94 3.4 6 0.2 2795
Gender
(***)
To what extent do you feel that the decisions of those in power at the local government reflect your
own priorities
Never Almost never Only in some areas To a large extent Completely Total
Count Row % Count Row % Count Row % Count Row % Count Row % Count
Male 675 52.6 124 9.7 433 33.8 47 3.7 4 0.3 1283
Female 910 60.2 144 9.5 409 27.1 47 3.1 2 0.1 1512
Total 1585 56.7 268 9.6 842 30.1 94 3.4 6 0.2 2795

71
Table 40: Logit regression of perception that local government cares about opinions
Local government cares about opinions Coefficient
Standard
Error t-statistic P>t
Respondent is Female -0.12 0.11 -1.08 0.28
Age of respondent 0.00 0.00 1.09 0.28
Main Income: Own Cultivation 0.02 0.10 0.25 0.80
Highest education level of respondent 0.06 0.03 1.75 0.08
Migrant Household 0.16 0.18 0.92 0.36
Household Receives Remittances 0.34 0.12 2.90 0.00
Lived in Village all Respondent's Life 0.01 0.11 0.07 0.95
Ethnic Minority -0.16 0.13 -1.28 0.20
Dependency Ratio 0.03 0.07 0.36 0.72
Household owns land 0.16 0.25 0.64 0.52
Morris Index 0.00 0.00 2.03 0.04
Food Insecurity Index -0.01 0.01 -0.65 0.51
Urban 0.02 0.13 0.15 0.88
Conflict in Last 3 Years -0.28 0.10 -2.75 0.01
Safe in Neighbourhood 0.02 0.16 0.15 0.88
District: Rolpa 0.07 0.17 0.40 0.69
District: Bardiya -0.69 0.13 -5.39 0.00
Total Shocks 0.02 0.01 1.36 0.18
Total crimes -0.05 0.03 -1.90 0.06
Distance to Clinic 0.00 0.00 -0.84 0.40
Distance to Water Source -0.01 0.01 -1.68 0.09
Receiving Social Protection 0.03 0.10 0.26 0.80
Receiving Livelihood Transfer 0.20 0.12 1.59 0.11
Not Satisfied with Health Service Overall 0.05 0.16 0.29 0.77
Water Clean and Safe -0.15 0.15 -1.00 0.32
Satisfied with Number of Qualified Personnel 0.14 0.15 0.88 0.38
Dissatisfied with Number of Qualified Personnel -0.16 0.26 -0.62 0.53
Satisfied with Availability of Medicine 0.28 0.14 2.01 0.05
Dissatisfied with Availability of Medicine -0.05 0.23 -0.20 0.84
Satisfied with Waiting Time -0.40 0.14 -2.87 0.00
Dissatisfied with Waiting Time 0.11 0.24 0.44 0.66
Queue for Drinking Water 0.17 0.11 1.54 0.12
Official Fees: Health Clinic -0.17 0.13 -1.28 0.20
Informal Fees: Health Clinic -0.54 0.20 -2.64 0.01
Fees for Drinking Water 0.03 0.14 0.19 0.85
Clinic Run by Government 0.29 0.11 2.57 0.01
Water Provided by Government 0.41 0.24 1.69 0.09
Water Provided by Private Owner 0.51 0.22 2.26 0.02
Water Provided by NGO 0.54 0.30 1.82 0.07
Experienced Problem with Service (Aggregate) -0.20 0.05 -3.83 0.00
Know How to Make a Grievance (Aggregate) 0.14 0.02 5.50 0.00
Know About a Community Meeting (Aggregate) 0.00 0.00 -1.10 0.27
Attended Community Meeting (Aggregrate) 0.13 0.05 2.62 0.01
Consulted about Local Services (Aggregate) 0.11 0.05 2.13 0.03
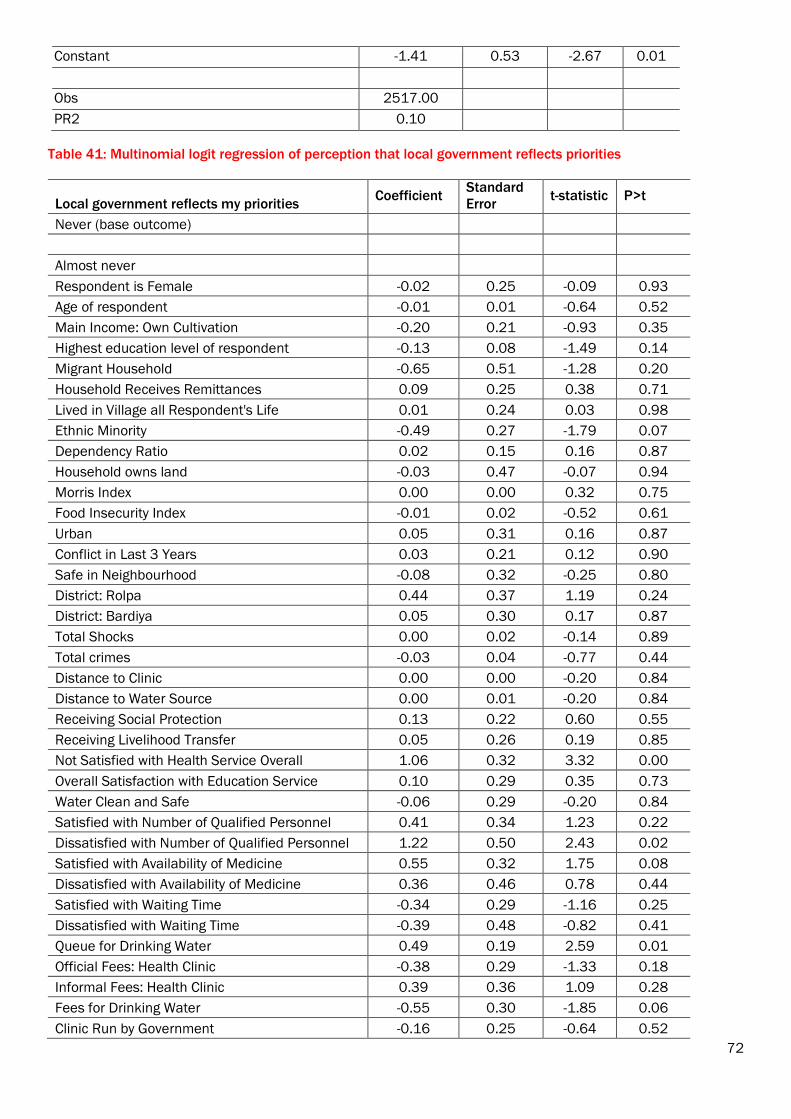
72
Constant -1.41 0.53 -2.67 0.01
Obs 2517.00
PR2 0.10
Table 41: Multinomial logit regression of perception that local government reflects priorities
Local government reflects my priorities Coefficient
Standard
Error t-statistic P>t
Never (base outcome)
Almost never
Respondent is Female -0.02 0.25 -0.09 0.93
Age of respondent -0.01 0.01 -0.64 0.52
Main Income: Own Cultivation -0.20 0.21 -0.93 0.35
Highest education level of respondent -0.13 0.08 -1.49 0.14
Migrant Household -0.65 0.51 -1.28 0.20
Household Receives Remittances 0.09 0.25 0.38 0.71
Lived in Village all Respondent's Life 0.01 0.24 0.03 0.98
Ethnic Minority -0.49 0.27 -1.79 0.07
Dependency Ratio 0.02 0.15 0.16 0.87
Household owns land -0.03 0.47 -0.07 0.94
Morris Index 0.00 0.00 0.32 0.75
Food Insecurity Index -0.01 0.02 -0.52 0.61
Urban 0.05 0.31 0.16 0.87
Conflict in Last 3 Years 0.03 0.21 0.12 0.90
Safe in Neighbourhood -0.08 0.32 -0.25 0.80
District: Rolpa 0.44 0.37 1.19 0.24
District: Bardiya 0.05 0.30 0.17 0.87
Total Shocks 0.00 0.02 -0.14 0.89
Total crimes -0.03 0.04 -0.77 0.44
Distance to Clinic 0.00 0.00 -0.20 0.84
Distance to Water Source 0.00 0.01 -0.20 0.84
Receiving Social Protection 0.13 0.22 0.60 0.55
Receiving Livelihood Transfer 0.05 0.26 0.19 0.85
Not Satisfied with Health Service Overall 1.06 0.32 3.32 0.00
Overall Satisfaction with Education Service 0.10 0.29 0.35 0.73
Water Clean and Safe -0.06 0.29 -0.20 0.84
Satisfied with Number of Qualified Personnel 0.41 0.34 1.23 0.22
Dissatisfied with Number of Qualified Personnel 1.22 0.50 2.43 0.02
Satisfied with Availability of Medicine 0.55 0.32 1.75 0.08
Dissatisfied with Availability of Medicine 0.36 0.46 0.78 0.44
Satisfied with Waiting Time -0.34 0.29 -1.16 0.25
Dissatisfied with Waiting Time -0.39 0.48 -0.82 0.41
Queue for Drinking Water 0.49 0.19 2.59 0.01
Official Fees: Health Clinic -0.38 0.29 -1.33 0.18
Informal Fees: Health Clinic 0.39 0.36 1.09 0.28
Fees for Drinking Water -0.55 0.30 -1.85 0.06
Clinic Run by Government -0.16 0.25 -0.64 0.52

73
Water Provided by Government 0.71 0.48 1.50 0.14
Water Provided by Private Owner 0.37 0.44 0.85 0.40
Water Provided by NGO -1.63 1.12 -1.46 0.15
Experienced Problem with Service (Aggregate) -0.06 0.10 -0.61 0.54
grievance_know 0.07 0.06 1.19 0.24
meeting_know 0.00 0.00 0.49 0.62
Attended Community Meeting (Aggregate) 0.12 0.11 1.10 0.27
Consulted about Local Services (Aggregate) 0.16 0.11 1.48 0.14
Only in some areas
Respondent is Female -0.22 0.16 -1.43 0.15
Age of respondent 0.00 0.01 0.76 0.44
Main Income: Own Cultivation 0.33 0.14 2.39 0.02
Highest education level of respondent 0.15 0.05 3.01 0.00
Migrant Household 0.38 0.26 1.47 0.14
Household Receives Remittances 0.13 0.17 0.78 0.44
Lived in Village all Respondent's Life 0.02 0.15 0.13 0.90
Ethnic Minority -0.13 0.17 -0.78 0.43
Dependency Ratio 0.04 0.10 0.40 0.69
Household owns land 0.20 0.35 0.57 0.57
Morris Index 0.00 0.00 0.83 0.41
Food Insecurity Index -0.01 0.01 -0.60 0.55
Urban 0.04 0.19 0.22 0.82
Conflict in Last 3 Years -0.06 0.14 -0.44 0.66
Safe in Neighbourhood 0.15 0.22 0.65 0.52
District: Rolpa -0.01 0.23 -0.06 0.95
District: Bardiya -0.43 0.19 -2.28 0.02
Total Shocks 0.01 0.02 0.41 0.68
Total crimes 0.02 0.03 0.86 0.39
Distance to Clinic 0.00 0.00 -0.74 0.46
Distance to Water Source 0.00 0.01 -0.52 0.60
Receiving Social Protection 0.19 0.14 1.31 0.19
Receiving Livelihood Transfer 0.16 0.17 0.97 0.33
Not Satisfied with Health Service Overall 0.35 0.22 1.55 0.12
Overall Satisfaction with Education Service -0.31 0.21 -1.49 0.14
Water Clean and Safe 0.24 0.21 1.16 0.25
Satisfied with Number of Qualified Personnel 0.24 0.22 1.10 0.27
Dissatisfied with Number of Qualified Personnel 0.55 0.38 1.44 0.15
Satisfied with Availability of Medicine 0.29 0.20 1.47 0.14
Dissatisfied with Availability of Medicine -0.13 0.33 -0.38 0.71
Satisfied with Waiting Time -0.76 0.19 -4.04 0.00
Dissatisfied with Waiting Time -0.18 0.32 -0.57 0.57
Queue for Drinking Water -0.12 0.15 -0.82 0.41
Official Fees: Health Clinic -0.53 0.19 -2.87 0.00
Informal Fees: Health Clinic 0.05 0.26 0.21 0.83
Fees for Drinking Water -0.16 0.19 -0.86 0.39
Clinic Run by Government -0.01 0.16 -0.09 0.93
Water Provided by Government 0.48 0.32 1.52 0.13

74
Water Provided by Private Owner 0.16 0.29 0.57 0.57
Water Provided by NGO 0.29 0.41 0.71 0.48
Experienced Problem with Service (Aggregate) -0.17 0.07 -2.30 0.02
grievance_know 0.07 0.04 1.93 0.05
meeting_know 0.00 0.00 -1.56 0.12
Attended Community Meeting (Aggregate) 0.19 0.07 2.71 0.01
Consulted about Local Services (Aggregate) 0.06 0.07 0.86 0.39
Largely or completely
Respondent is Female -0.30 0.41 -0.72 0.47
Age of respondent 0.02 0.01 1.54 0.12
Main Income: Own Cultivation 0.48 0.37 1.30 0.19
Highest education level of respondent 0.24 0.12 2.03 0.04
Migrant Household -0.32 0.72 -0.44 0.66
Household Receives Remittances 0.43 0.43 1.00 0.32
Lived in Village all Respondent's Life -0.10 0.39 -0.26 0.80
Ethnic Minority 0.31 0.42 0.74 0.46
Dependency Ratio -0.35 0.32 -1.08 0.28
Household owns land 12.86 533.91 0.02 0.98
Morris Index 0.00 0.01 0.19 0.85
Food Insecurity Index -0.02 0.04 -0.50 0.61
Urban 0.20 0.51 0.39 0.70
Conflict in Last 3 Years -0.14 0.37 -0.38 0.71
Safe in Neighbourhood -1.05 0.46 -2.29 0.02
District: Rolpa 0.94 0.68 1.39 0.17
District: Bardiya 1.10 0.51 2.18 0.03
Total Shocks 0.10 0.03 3.43 0.00
Total crimes -0.14 0.15 -0.95 0.34
Distance to Clinic -0.01 0.01 -0.88 0.38
Distance to Water Source -0.01 0.02 -0.46 0.65
Receiving Social Protection 0.01 0.37 0.03 0.98
Receiving Livelihood Transfer 0.59 0.40 1.46 0.14
Not Satisfied with Health Service Overall 0.16 0.56 0.29 0.77
Overall Satisfaction with Education Service -0.13 0.56 -0.24 0.81
Water Clean and Safe -0.94 0.44 -2.14 0.03
Satisfied with Number of Qualified Personnel -0.51 0.51 -1.00 0.32
Dissatisfied with Number of Qualified Personnel -0.37 0.98 -0.38 0.71
Satisfied with Availability of Medicine 1.95 0.68 2.87 0.00
Dissatisfied with Availability of Medicine 1.85 0.84 2.21 0.03
Satisfied with Waiting Time -0.46 0.48 -0.95 0.34
Dissatisfied with Waiting Time -0.34 0.88 -0.39 0.70
Queue for Drinking Water 0.15 0.37 0.40 0.69
Official Fees: Health Clinic -0.33 0.46 -0.71 0.48
Informal Fees: Health Clinic 1.15 0.56 2.05 0.04
Fees for Drinking Water -0.02 0.50 -0.04 0.97
Clinic Run by Government 0.71 0.40 1.76 0.08
Water Provided by Government -0.70 0.85 -0.82 0.41
Water Provided by Private Owner -0.92 0.80 -1.16 0.25

75
Water Provided by NGO -1.56 1.37 -1.14 0.25
Experienced Problem with Service (Aggregate) -0.90 0.27 -3.40 0.00
grievance_know 0.28 0.09 3.10 0.00
meeting_know 0.00 0.00 0.06 0.95
Attended Community Meeting (Aggregate) -0.10 0.17 -0.58 0.56
Consulted about Local Services (Aggregate) 0.32 0.15 2.12 0.03
Constant -16.79 533.92 -0.03 0.98
Observations 1417.00
Pseudo-R2 0.10
Table 42: Logit regression of perception that local government cares about opinions including education
variables
Local government cares about opinions Coefficient
Standard
Error t-statistic P>t
Respondent is Female -1.12 0.38 -2.93 0.00
Age of respondent 0.00 0.01 0.33 0.74
Main Income: Own Cultivation -0.37 0.33 -1.12 0.26
Highest education level of respondent 0.07 0.13 0.54 0.59
Migrant Household -0.27 0.63 -0.42 0.67
Household Receives Remittances 0.44 0.39 1.12 0.27
Lived in Village all Respondent's Life -0.03 0.36 -0.08 0.94
Ethnic Minority 0.00 0.37 0.01 0.99
Dependency Ratio -0.28 0.27 -1.02 0.31
Household owns land 1.87 1.15 1.63 0.10
Morris Index -0.01 0.01 -1.55 0.12
Food Insecurity Index 0.04 0.03 1.47 0.14
Urban 0.03 0.47 0.07 0.95
Conflict in Last 3 Years 0.07 0.34 0.19 0.85
Safe in Neighbourhood 0.36 0.52 0.68 0.49
District: Rolpa -0.39 0.56 -0.69 0.49
District: Bardiya -1.12 0.50 -2.24 0.03
Total Shocks 0.07 0.05 1.39 0.17
Total crimes 0.01 0.06 0.17 0.86
Distance to Clinic 0.00 0.00 0.70 0.48
Distance to Water Source -0.01 0.02 -0.53 0.60
Receiving Social Protection 0.02 0.36 0.06 0.95
Receiving Livelihood Transfer 0.07 0.38 0.18 0.86
Not Satisfied with Health Service Overall 0.63 0.57 1.11 0.27
Water Clean and Safe -0.70 0.42 -1.66 0.10
Satisfied with Number of Qualified Personnel 0.31 0.57 0.54 0.59
Dissatisfied with Number of Qualified Personnel 0.91 1.00 0.91 0.36
Satisfied with Availability of Medicine 0.92 0.54 1.69 0.09
Dissatisfied with Availability of Medicine 0.30 0.79 0.38 0.70
Satisfied with Waiting Time -0.05 0.44 -0.12 0.91
Dissatisfied with Waiting Time 0.52 0.78 0.66 0.51
Queue for Drinking Water -0.65 0.39 -1.66 0.10
Satisfied with Number of Teachers (Boys) 0.04 0.63 0.06 0.95

76
Satisfied with Quality of Teaching(Boys) -1.47 1.49 -0.99 0.32
Dissatisfied with Quality of Teaching(Boys) 42.24 2475.26 0.02 0.99
Satisfied with Teacher Attendance (Boys) -0.90 1.23 -0.73 0.47
Dissatisfied with Teacher Attendance (Boys) 14.10 1200.31 0.01 0.99
Satisfied with Class Size(Boys) -2.86 1.23 -2.32 0.02
Satisfied with Quality of Infrastructure(Boys) -2.26 1.11 -2.05 0.04
Dissatisfied with Quality of Infrastructure(Boys) -3.06 2.14 -1.43 0.15
Satisfied with Quality of Equipment (Boys) 1.30 1.32 0.99 0.33
Dissatisfied with Quality of Equipment (Boys) -31.33 1696.56 -0.02 0.99
Official Fees: Boys' School 3.66 1.13 3.24 0.00
Satisfied with Quality of Teaching(Girls) 2.11 1.45 1.46 0.15
Dissatisfied with Quality of Teaching(Girls) -41.96 2475.26 -0.02 0.99
Satisfied with Teacher Attendance (Girls) 1.44 1.28 1.12 0.26
Dissatisfied with Teacher Attendance (Girls) -14.98 1200.31 -0.01 0.99
Satisfied with Class Size(Girls) 1.52 1.27 1.20 0.23
Dissatisfied with Class Size(Girls) 1.95 1.79 1.09 0.28
Satisfied with Quality of Infrastructure(Girls) 1.20 1.07 1.12 0.26
Dissatisfied with Quality of Infrastructure(Girls) 4.55 2.32 1.96 0.05
Satisfied with Quality of Equipment (Girls) 1.31 1.21 1.09 0.28
Dissatisfied with Quality of Equipment (Girls) 32.41 1696.56 0.02 0.99
Official Fees: Health Clinic 0.09 0.42 0.21 0.83
Informal Fees: Health Clinic -0.49 0.76 -0.64 0.52
Fees for Drinking Water 0.06 0.46 0.14 0.89
Clinic Run by Government -0.07 0.37 -0.19 0.85
Informal Fees: Boys' School -1.22 0.98 -1.25 0.21
Official Fees: Girls' School -3.68 1.11 -3.31 0.00
Informal Fees: Girls' School 0.35 0.99 0.36 0.72
Water Provided by Government 0.68 0.80 0.84 0.40
Water Provided by Private Owner 0.58 0.76 0.77 0.44
Water Provided by NGO 1.21 0.93 1.30 0.19
Experienced Problem with Service (Aggregate) -0.62 0.20 -3.12 0.00
Know how to make a grievance (aggregate) 0.31 0.08 3.74 0.00
Know about a community meeting (aggregate) 0.00 0.00 0.82 0.41
Attended Community Meeting (Aggregate) 0.31 0.17 1.83 0.07
Consulted about Local Services (Aggregate) -0.09 0.18 -0.48 0.63
Constant -4.53 2.17 -2.09 0.04
Obs 396.00
PR2 0.30

77
Table 43: Perception of central government, by district
District
(***)
To what extent do you feel that the decisions of those in power at the central government
reflect your own priorities
Never Almost never Only in some
areas To a large extent Completely Total
Count Row % Count Row % Count Row % Count Row % Count Row % Count
Rolpa 240 53.8 64 14.3 129 28.9 13 2.9 0 0 446
Bardiya 816 75.8 115 10.7 123 11.4 22 2 1 0.1 1077
Ilam 768 70.3 96 8.8 208 19 19 1.7 1 0.1 1092
Total 1824 69.8 275 10.5 460 17.6 54 2.1 2 0.1 2615
Table 44: Perception of central government, by ethnic group
Caste/
ethnicity
(***)
To what extent do you feel that the decisions of those in power at the central government
reflect your own priorities
Never Almost never Only in some
areas
To a large
extent Completely Total
Count Row
% Count
Row
% Count
Row
% Count Row % Count
Row
% Count
Brahmin 646 69.8 94 10.2 171 18.5 15 1.6 0 0 926
Janjati 811 68.3 138 11.6 212 17.8 25 2.1 2 0.2 1188
Dalit 118 66.7 13 7.3 37 20.9 9 5.1 0 0 177
Madhesi 155 84.2 16 8.7 11 6 2 1.1 0 0 184
Muslim 64 75.3 6 7.1 13 15.3 2 2.4 0 0 85
Other 30 54.5 8 14.5 16 29.1 1 1.8 0 0 55
Total 1824 69.8 275 10.5 460 17.6 54 2.1 2 0.1 2615
Source: Field Survey 2012
Table 45: Perception of central government, by respondent’s gender
Gender (not
significant)
To what extent do you feel that the decisions of those in power at the central government reflect
your own priorities
Never Almost never Only in some areas To a large extent Completely Total
Count Row % Count Row % Count Row % Count Row % Count Row % Count
Male 819 68.4 126 10.5 228 19.1 23 1.9 1 0.1 1197
Female 1005 70.9 149 10.5 232 16.3 31 2.2 1 0.1 1418
Total 1824 69.8 275 10.5 460 17.6 54 2.1 2 0.1 2615

78
Table 46: Logit regression of perception that central government cares about opinions
Central government cares about opinions Coefficient Standard Error t-statistic P>t
Respondent is Female -0.07 0.13 -0.53 0.59
Age of respondent 0.00 0.00 0.76 0.45
Main Income: Own Cultivation -0.29 0.12 -2.44 0.02
Highest education level of respondent 0.08 0.04 1.98 0.05
Migrant Household 0.47 0.21 2.25 0.02
Household Receives Remittances 0.12 0.14 0.87 0.38
Lived in Village all Respondent's Life 0.23 0.13 1.82 0.07
Ethnic Minority -0.27 0.16 -1.68 0.09
Dependency Ratio -0.08 0.09 -0.88 0.38
Household owns land -0.15 0.27 -0.54 0.59
Morris Index 0.00 0.00 0.17 0.87
Food Insecurity Index 0.01 0.01 1.15 0.25
Urban 0.33 0.15 2.17 0.03
Conflict in Last 3 Years -0.13 0.12 -1.05 0.29
Safe in Neighbourhood 0.30 0.21 1.43 0.15
District: Rolpa 0.57 0.20 2.86 0.00
District: Bardiya -1.00 0.16 -6.33 0.00
Total Shocks -0.02 0.02 -1.05 0.29
Total crimes -0.01 0.02 -0.57 0.57
Distance to Clinic 0.00 0.00 -1.06 0.29
Distance to Water Source 0.00 0.01 0.12 0.91
Receiving Social Protection 0.19 0.12 1.58 0.11
Receiving Livelihood Transfer 0.18 0.14 1.25 0.21
Not Satisfied with Health Service Overall 0.11 0.19 0.56 0.58
Water Clean and Safe 0.08 0.19 0.44 0.66
Satisfied with Number of Qualified Personnel 0.06 0.19 0.29 0.77
Dissatisfied with Number of Qualified Personnel -0.18 0.30 -0.60 0.55
Satisfied with Availability of Medicine 0.32 0.17 1.93 0.05
Dissatisfied with Availability of Medicine 0.03 0.27 0.12 0.90
Satisfied with Waiting Time -0.27 0.16 -1.67 0.10
Dissatisfied with Waiting Time 0.01 0.28 0.02 0.99
Queue for Drinking Water -0.13 0.14 -0.95 0.34
Official Fees: Health Clinic -0.43 0.16 -2.75 0.01
Informal Fees: Health Clinic -0.21 0.25 -0.82 0.41
Fees for Drinking Water 0.07 0.17 0.43 0.67
Clinic Run by Government 0.17 0.13 1.30 0.19
Water Provided by Government 0.83 0.33 2.48 0.01
Water Provided by Private Owner 0.80 0.32 2.51 0.01
Water Provided by NGO 0.86 0.39 2.20 0.03
Experienced Problem with Service (Aggregate) -0.15 0.06 -2.34 0.02
Know How to Make a Grievance (Aggregate) 0.13 0.03 4.47 0.00
Know About a Community Meeting (Aggregate) 0.00 0.00 -0.17 0.86
Attended Community Meeting (Aggregate) 0.13 0.06 2.27 0.02
Consulted about Local Services (Aggregate) 0.09 0.05 1.67 0.09
Constant -2.52 0.65 -3.88 0.00
Obs 2393.00
PR2 0.13
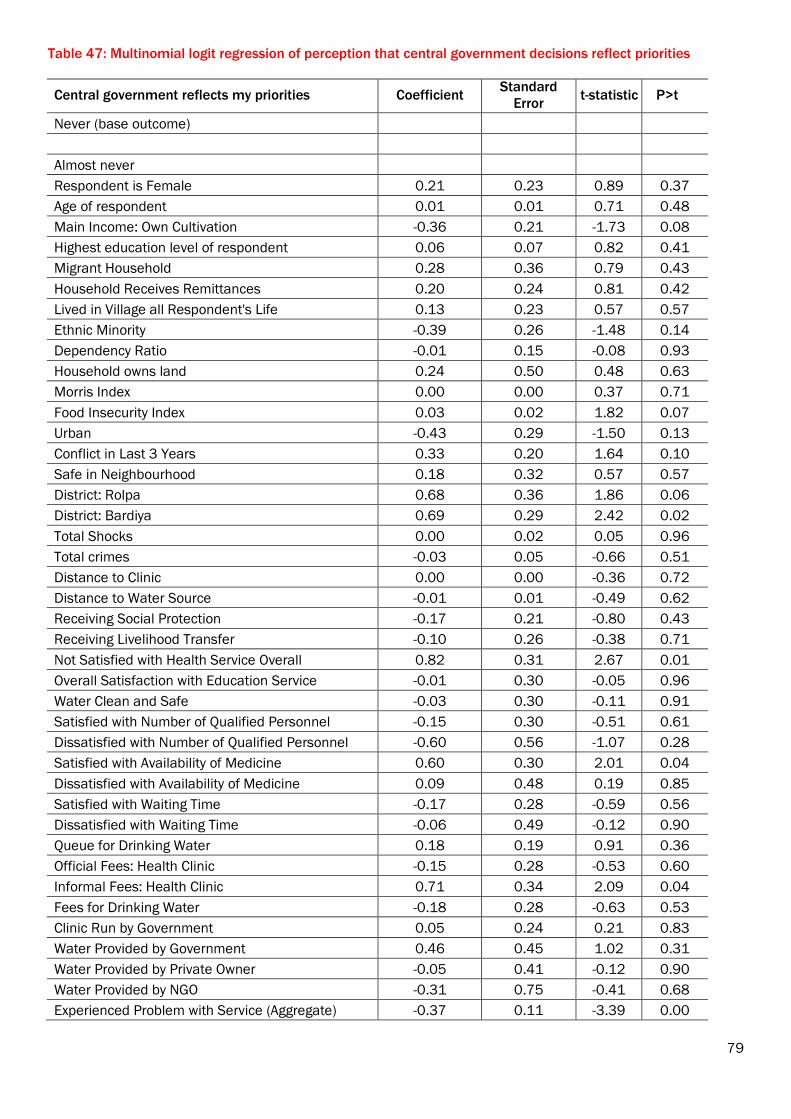
79
Table 47: Multinomial logit regression of perception that central government decisions reflect priorities
Central government reflects my priorities Coefficient Standard
Error t-statistic P>t
Never (base outcome)
Almost never
Respondent is Female 0.21 0.23 0.89 0.37
Age of respondent 0.01 0.01 0.71 0.48
Main Income: Own Cultivation -0.36 0.21 -1.73 0.08
Highest education level of respondent 0.06 0.07 0.82 0.41
Migrant Household 0.28 0.36 0.79 0.43
Household Receives Remittances 0.20 0.24 0.81 0.42
Lived in Village all Respondent's Life 0.13 0.23 0.57 0.57
Ethnic Minority -0.39 0.26 -1.48 0.14
Dependency Ratio -0.01 0.15 -0.08 0.93
Household owns land 0.24 0.50 0.48 0.63
Morris Index 0.00 0.00 0.37 0.71
Food Insecurity Index 0.03 0.02 1.82 0.07
Urban -0.43 0.29 -1.50 0.13
Conflict in Last 3 Years 0.33 0.20 1.64 0.10
Safe in Neighbourhood 0.18 0.32 0.57 0.57
District: Rolpa 0.68 0.36 1.86 0.06
District: Bardiya 0.69 0.29 2.42 0.02
Total Shocks 0.00 0.02 0.05 0.96
Total crimes -0.03 0.05 -0.66 0.51
Distance to Clinic 0.00 0.00 -0.36 0.72
Distance to Water Source -0.01 0.01 -0.49 0.62
Receiving Social Protection -0.17 0.21 -0.80 0.43
Receiving Livelihood Transfer -0.10 0.26 -0.38 0.71
Not Satisfied with Health Service Overall 0.82 0.31 2.67 0.01
Overall Satisfaction with Education Service -0.01 0.30 -0.05 0.96
Water Clean and Safe -0.03 0.30 -0.11 0.91
Satisfied with Number of Qualified Personnel -0.15 0.30 -0.51 0.61
Dissatisfied with Number of Qualified Personnel -0.60 0.56 -1.07 0.28
Satisfied with Availability of Medicine 0.60 0.30 2.01 0.04
Dissatisfied with Availability of Medicine 0.09 0.48 0.19 0.85
Satisfied with Waiting Time -0.17 0.28 -0.59 0.56
Dissatisfied with Waiting Time -0.06 0.49 -0.12 0.90
Queue for Drinking Water 0.18 0.19 0.91 0.36
Official Fees: Health Clinic -0.15 0.28 -0.53 0.60
Informal Fees: Health Clinic 0.71 0.34 2.09 0.04
Fees for Drinking Water -0.18 0.28 -0.63 0.53
Clinic Run by Government 0.05 0.24 0.21 0.83
Water Provided by Government 0.46 0.45 1.02 0.31
Water Provided by Private Owner -0.05 0.41 -0.12 0.90
Water Provided by NGO -0.31 0.75 -0.41 0.68
Experienced Problem with Service (Aggregate) -0.37 0.11 -3.39 0.00

80
grievance_know 0.08 0.05 1.39 0.17
meeting_know 0.00 0.00 0.11 0.91
Attended Community Meeting (Aggregate) 0.02 0.10 0.21 0.84
Consulted about Local Services (Aggregate) 0.24 0.10 2.49 0.01
Only in some areas
Respondent is Female 0.00 0.20 0.01 0.99
Age of respondent 0.01 0.01 1.76 0.08
Main Income: Own Cultivation -0.31 0.17 -1.75 0.08
Highest education level of respondent 0.17 0.06 2.82 0.01
Migrant Household 0.31 0.33 0.96 0.34
Household Receives Remittances -0.02 0.21 -0.07 0.94
Lived in Village all Respondent's Life 0.09 0.19 0.45 0.65
Ethnic Minority -0.01 0.21 -0.06 0.96
Dependency Ratio -0.18 0.12 -1.43 0.15
Household owns land 0.79 0.51 1.55 0.12
Morris Index 0.00 0.00 -0.95 0.34
Food Insecurity Index 0.01 0.02 0.56 0.58
Urban 0.31 0.24 1.28 0.20
Conflict in Last 3 Years -0.08 0.18 -0.45 0.66
Safe in Neighbourhood 0.54 0.30 1.83 0.07
District: Rolpa 0.87 0.28 3.13 0.00
District: Bardiya -0.49 0.24 -2.02 0.04
Total Shocks -0.01 0.02 -0.48 0.63
Total crimes 0.02 0.04 0.63 0.53
Distance to Clinic 0.00 0.00 -0.94 0.35
Distance to Water Source 0.00 0.01 -0.05 0.96
Receiving Social Protection 0.04 0.18 0.25 0.80
Receiving Livelihood Transfer 0.26 0.20 1.28 0.20
Not Satisfied with Health Service Overall 0.50 0.28 1.78 0.08
Overall Satisfaction with Education Service 0.15 0.25 0.61 0.54
Water Clean and Safe -0.20 0.24 -0.82 0.41
Satisfied with Number of Qualified Personnel 0.71 0.30 2.39 0.02
Dissatisfied with Number of Qualified Personnel -0.32 0.50 -0.64 0.52
Satisfied with Availability of Medicine 0.52 0.25 2.02 0.04
Dissatisfied with Availability of Medicine 0.50 0.40 1.25 0.21
Satisfied with Waiting Time -0.56 0.23 -2.37 0.02
Dissatisfied with Waiting Time -0.30 0.41 -0.73 0.46
Queue for Drinking Water -0.04 0.17 -0.26 0.79
Official Fees: Health Clinic -0.53 0.22 -2.39 0.02
Informal Fees: Health Clinic 0.25 0.32 0.79 0.43
Fees for Drinking Water -0.09 0.23 -0.41 0.68
Clinic Run by Government 0.30 0.19 1.54 0.12
Water Provided by Government 0.22 0.40 0.54 0.59
Water Provided by Private Owner 0.00 0.37 -0.01 1.00
Water Provided by NGO 0.85 0.48 1.78 0.08
Experienced Problem with Service (Aggregate) -0.23 0.09 -2.42 0.02
grievance_know 0.05 0.04 1.04 0.30

81
meeting_know 0.00 0.00 -1.69 0.09
Attended Community Meeting (Aggregate) 0.20 0.08 2.49 0.01
Consulted about Local Services (Aggregate) -0.05 0.09 -0.51 0.61
Largely or completely
Respondent is Female 0.02 0.51 0.03 0.98
Age of respondent -0.01 0.02 -0.51 0.61
Main Income: Own Cultivation 1.04 0.51 2.05 0.04
Highest education level of respondent -0.07 0.17 -0.39 0.70
Migrant Household -1.23 1.17 -1.05 0.30
Household Receives Remittances 0.80 0.57 1.41 0.16
Lived in Village all Respondent's Life 0.03 0.50 0.05 0.96
Ethnic Minority 0.31 0.52 0.59 0.56
Dependency Ratio -0.63 0.43 -1.46 0.15
Household owns land -0.37 1.20 -0.31 0.76
Morris Index 0.01 0.01 2.31 0.02
Food Insecurity Index 0.03 0.05 0.70 0.48
Urban -0.23 0.70 -0.33 0.74
Conflict in Last 3 Years -1.13 0.57 -2.00 0.05
Safe in Neighbourhood -0.78 0.70 -1.12 0.26
District: Rolpa 0.62 0.86 0.73 0.47
District: Bardiya 0.47 0.73 0.64 0.52
Total Shocks -0.13 0.10 -1.30 0.20
Total crimes -0.34 0.25 -1.35 0.18
Distance to Clinic -0.01 0.01 -1.46 0.14
Distance to Water Source -0.02 0.03 -0.64 0.52
Receiving Social Protection 1.04 0.50 2.06 0.04
Receiving Livelihood Transfer -0.10 0.53 -0.19 0.85
Not Satisfied with Health Service Overall -0.39 0.79 -0.49 0.63
Overall Satisfaction with Education Service -0.07 0.78 -0.09 0.93
Water Clean and Safe -0.84 0.60 -1.40 0.16
Satisfied with Number of Qualified Personnel 1.18 0.93 1.27 0.21
Dissatisfied with Number of Qualified Personnel -15.57 788.19 -0.02 0.98
Satisfied with Availability of Medicine 1.49 0.90 1.66 0.10
Dissatisfied with Availability of Medicine 2.89 1.37 2.11 0.04
Satisfied with Waiting Time -1.08 0.63 -1.72 0.09
Dissatisfied with Waiting Time -0.22 1.18 -0.18 0.86
Queue for Drinking Water 0.36 0.42 0.86 0.39
Official Fees: Health Clinic -1.05 0.58 -1.82 0.07
Informal Fees: Health Clinic 1.46 0.73 2.01 0.05
Fees for Drinking Water 1.19 0.67 1.77 0.08
Clinic Run by Government 0.43 0.51 0.84 0.40
Water Provided by Government -0.57 1.02 -0.55 0.58
Water Provided by Private Owner -0.47 0.98 -0.48 0.63
Water Provided by NGO -0.68 1.39 -0.49 0.63
Experienced Problem with Service (Aggregate) -0.68 0.33 -2.06 0.04
grievance_know 0.34 0.11 2.98 0.00
meeting_know 0.00 0.00 -0.38 0.70

82
Attended Community Meeting (Aggregate) 0.15 0.22 0.69 0.49
Consulted about Local Services (Aggregate) 0.40 0.19 2.09 0.04
Constant -3.29 2.54 -1.30 0.19
Observations 1312.00
Pseudo-R2 0.13
Table 48: Logit regression of perception that central government cares about opinions including education
variables
Central government cares about opinions Coefficient
Standard
Error t-statistic P>t
Respondent is Female 0.13 0.46 0.28 0.78
Age of respondent -0.01 0.02 -0.38 0.70
Main Income: Own Cultivation -0.48 0.40 -1.20 0.23
Highest education level of respondent 0.10 0.15 0.65 0.52
Migrant Household 0.21 0.83 0.25 0.80
Household Receives Remittances -0.56 0.48 -1.17 0.24
Lived in Village all Respondent's Life 0.91 0.45 2.02 0.04
Ethnic Minority -0.15 0.46 -0.34 0.74
Dependency Ratio -0.20 0.35 -0.57 0.57
Household owns land 1.50 1.27 1.18 0.24
Morris Index 0.00 0.01 -0.44 0.66
Food Insecurity Index 0.01 0.04 0.18 0.86
Urban 0.69 0.57 1.20 0.23
Conflict in Last 3 Years -0.40 0.44 -0.92 0.36
Safe in Neighbourhood 0.85 0.76 1.13 0.26
District: Rolpa 0.61 0.70 0.87 0.39
District: Bardiya -1.88 0.61 -3.10 0.00
Total Shocks 0.04 0.06 0.65 0.51
Total crimes 0.17 0.10 1.67 0.10
Distance to Clinic 0.00 0.01 -0.46 0.65
Distance to Water Source -0.02 0.03 -0.64 0.52
Receiving Social Protection -0.20 0.44 -0.44 0.66
Receiving Livelihood Transfer 0.30 0.45 0.68 0.50
Not Satisfied with Health Service Overall 1.63 0.76 2.16 0.03
Water Clean and Safe -0.66 0.54 -1.22 0.22
Satisfied with Number of Qualified Personnel 2.51 0.82 3.06 0.00
Dissatisfied with Number of Qualified Personnel 1.75 1.18 1.48 0.14
Satisfied with Availability of Medicine 0.26 0.67 0.39 0.70
Dissatisfied with Availability of Medicine 0.09 0.98 0.10 0.92
Satisfied with Waiting Time 0.54 0.56 0.97 0.33
Dissatisfied with Waiting Time 0.99 0.96 1.03 0.30
Queue for Drinking Water -1.41 0.59 -2.39 0.02
Satisfied with Number of Teachers (Boys) 0.45 0.91 0.49 0.62
Satisfied with Quality of Teaching(Boys) -3.39 1.98 -1.71 0.09
Dissatisfied with Quality of Teaching(Boys) 5.15 1563.20 0.00 1.00
Satisfied with Teacher Attendance (Boys) 0.83 1.51 0.55 0.59
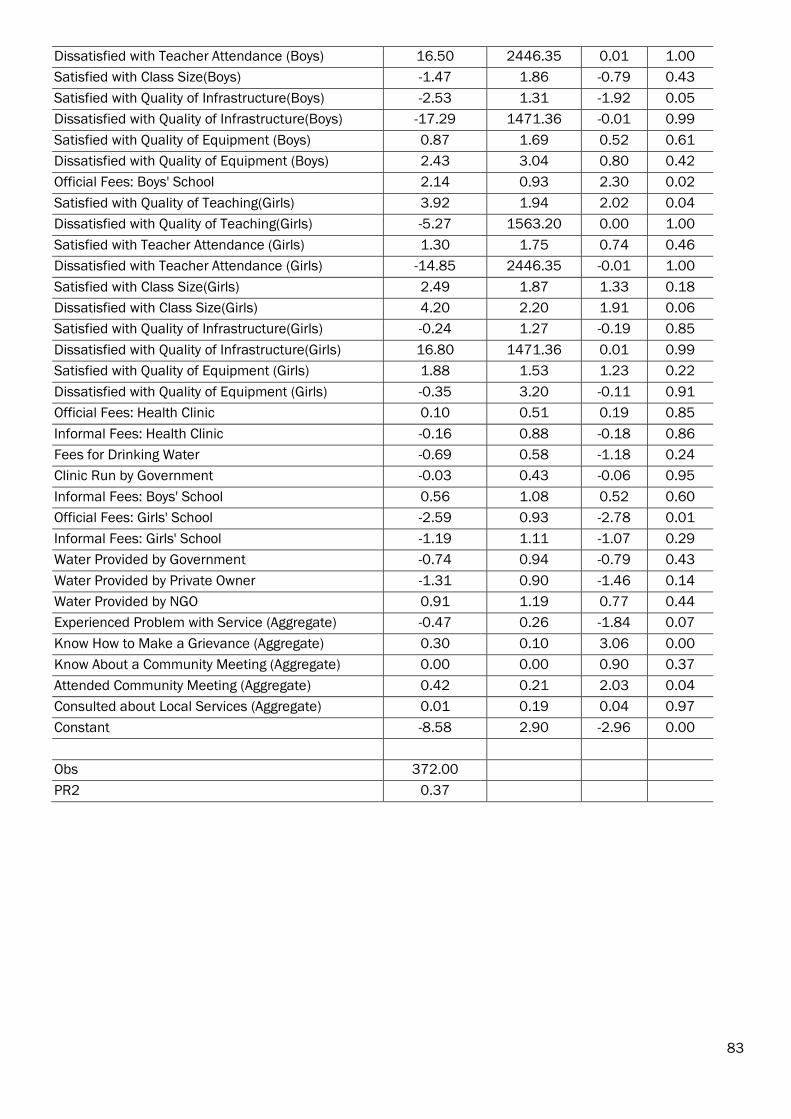
83
Dissatisfied with Teacher Attendance (Boys) 16.50 2446.35 0.01 1.00
Satisfied with Class Size(Boys) -1.47 1.86 -0.79 0.43
Satisfied with Quality of Infrastructure(Boys) -2.53 1.31 -1.92 0.05
Dissatisfied with Quality of Infrastructure(Boys) -17.29 1471.36 -0.01 0.99
Satisfied with Quality of Equipment (Boys) 0.87 1.69 0.52 0.61
Dissatisfied with Quality of Equipment (Boys) 2.43 3.04 0.80 0.42
Official Fees: Boys' School 2.14 0.93 2.30 0.02
Satisfied with Quality of Teaching(Girls) 3.92 1.94 2.02 0.04
Dissatisfied with Quality of Teaching(Girls) -5.27 1563.20 0.00 1.00
Satisfied with Teacher Attendance (Girls) 1.30 1.75 0.74 0.46
Dissatisfied with Teacher Attendance (Girls) -14.85 2446.35 -0.01 1.00
Satisfied with Class Size(Girls) 2.49 1.87 1.33 0.18
Dissatisfied with Class Size(Girls) 4.20 2.20 1.91 0.06
Satisfied with Quality of Infrastructure(Girls) -0.24 1.27 -0.19 0.85
Dissatisfied with Quality of Infrastructure(Girls) 16.80 1471.36 0.01 0.99
Satisfied with Quality of Equipment (Girls) 1.88 1.53 1.23 0.22
Dissatisfied with Quality of Equipment (Girls) -0.35 3.20 -0.11 0.91
Official Fees: Health Clinic 0.10 0.51 0.19 0.85
Informal Fees: Health Clinic -0.16 0.88 -0.18 0.86
Fees for Drinking Water -0.69 0.58 -1.18 0.24
Clinic Run by Government -0.03 0.43 -0.06 0.95
Informal Fees: Boys' School 0.56 1.08 0.52 0.60
Official Fees: Girls' School -2.59 0.93 -2.78 0.01
Informal Fees: Girls' School -1.19 1.11 -1.07 0.29
Water Provided by Government -0.74 0.94 -0.79 0.43
Water Provided by Private Owner -1.31 0.90 -1.46 0.14
Water Provided by NGO 0.91 1.19 0.77 0.44
Experienced Problem with Service (Aggregate) -0.47 0.26 -1.84 0.07
Know How to Make a Grievance (Aggregate) 0.30 0.10 3.06 0.00
Know About a Community Meeting (Aggregate) 0.00 0.00 0.90 0.37
Attended Community Meeting (Aggregate) 0.42 0.21 2.03 0.04
Consulted about Local Services (Aggregate) 0.01 0.19 0.04 0.97
Constant -8.58 2.90 -2.96 0.00
Obs 372.00
PR2 0.37

SLRC Working Papers present research questions, methods, analysis and discussion of research results (from case studies or desk-based research) on issues relating to livelihoods, basic services and social protection in conflict-affected situations. They are intended to stimulate debate on policy implications of research findings.
This and other SLRC reports are available from www.secureliveilhoods.org. Funded by DFID, the EC and Irish Aid.
The views presented in this paper are those of the author(s) and not necessarily the views of SLRC, DFID the EC and Irish Aid. ©SLRC 2014.
Readers are encouraged to quote or reproduce material from SLRC Working Papers for their own publications. As copyright holder, SLRC requests due acknowledgement and a copy of the publication.
Secure Livelihoods Research Consortium (SLRC) Overseas Development Institute (ODI) 203 Blackfriars Road London SE1 8NJ, UK
T +44 (0)20 7922 8249 F +44 (0)20 7922 0399 E [email protected]


