

Kalpataru Power Transmission Limited
Investor Presentation

Investor Presentation
Disclaimer
2
This presentation may include statements which may constitute forward-looking statements. All statements that address expectations or projections aboutthe future, including, but not limited to, statements about the strategy for growth, business development, market position, expenditures and financial resultsare forward looking statements. Forward looking statements are based on certain assumptions and expectations of future events. The company cannotguarantee that these assumptions and expectations are accurate or will be realised. The actual results, performance or achievements, could thus differmaterially from those projected in any such forward looking statements.
The information contained in these materials has not been independently verified. None of the companies, its Directors, Promoters or affiliates, nor any of itsor their respective employees, advisors or representatives or any other person accepts any responsibility or liability whatsoever, whether arising in tort,contract or otherwise, for any errors, omissions or inaccuracies in such information or opinions or for any loss, cost or damage suffered or incurredhowsoever arising, directly or indirectly, from any use of this document or its contents or otherwise in connection with this document and makes norepresentation or warranty, express or implied for the contents of this document including its accuracy, fairness, completeness or verification or for any otherstatement made or purported to be made by any of them or on behalf of them and nothing in this document or at this presentation shall be relied upon as apromise or representation in this respect, whether as to the past or the future. The information and opinions contained in this presentation are current and ifnot stated otherwise as of the date of this presentation. The company undertakes no obligation to update or revise any information or the opinionsexpressed in this presentation as a result of new information, future events or otherwise. Any opinions or information expressed in this presentation aresubject to change without notice.
This presentation does not constitute or form part of any offer or invitation or inducement to sell or issue, or any solicitation of any offer to purchase orsubscribe for, any securities of Kalpataru Power Transmission Ltd (the “Company”), nor shall it, or any part of it or the fact of its distribution form the basis of,or be relied on in connection with, any contract or commitment therefore. Any person/party intending to provide finance/invest in the shares/business of thecompany should do so after seeking their own professional advice and after carrying out their own due diligence procedure to ensure that they are makingan informed decision. This presentation is strictly confidential and may not be copied or disseminated, in whole or in part, and in any manner or for anypurpose. No person is authorized to give any information or to make any representation not contained in or inconsistent with this presentation andif given or made, such information or representation must not be relied upon as having been authorized by any person. Failure to comply with thisrestriction may constitute a violation of the applicable securities laws. The distribution of this document in certain jurisdictions may be restricted by lawand persons into whose possession this presentation comes should inform themselves about and observe any such restrictions. By participating in thispresentation or by accepting any copy of the slides presented, you agree to be bound by the foregoing limitations.

Investor Presentation 3
Table of content
Key Facts & Figures
Group Overview
Vision Value System
Business Segments
• Power Transmission & Distribution
• Infrastructure EPC - Oil & Gas Pipeline & Railways
• Asset Creation – BOOT Projects & Biomass Plants
• Subsidiaries – JMC Projects & SSL
Key Management
Financial Highlights
Stock Information
CSR Activities
Clientele
04
05
06
08
09
10
12
22
23
25
26
30

Investor Presentation
KPTL – Key Facts & Figures
Footprints - Over 40 countries
Order book- INR 90 Bn & Turnover- INR 50 Bn
(As on 31st March 2017)
Experience - Over 3 decades
Market capitalisation - INR 49.5 Bn (As on 31st March 2017)
Strong technical manpower - 2000+
Completed transmission line contracts of Over 17,500 Km length
across the globe.
Certifications - ISO 9001:2008, ISO 14001:2004 &
OHSAS 18001:2007
Experience of laying of 3,200+ Kms Oil & Gas Pipelines and Setting
up 80+ Oil & Gas Stations
Railways - Capability of offering services globally
Leading EPC player in Power Transmission and Oil & Gas
Infrastructure Sector
Annual production capacity of transmission towers - Over 180,000 MT
4
Investor Presentation
Group Overview
5
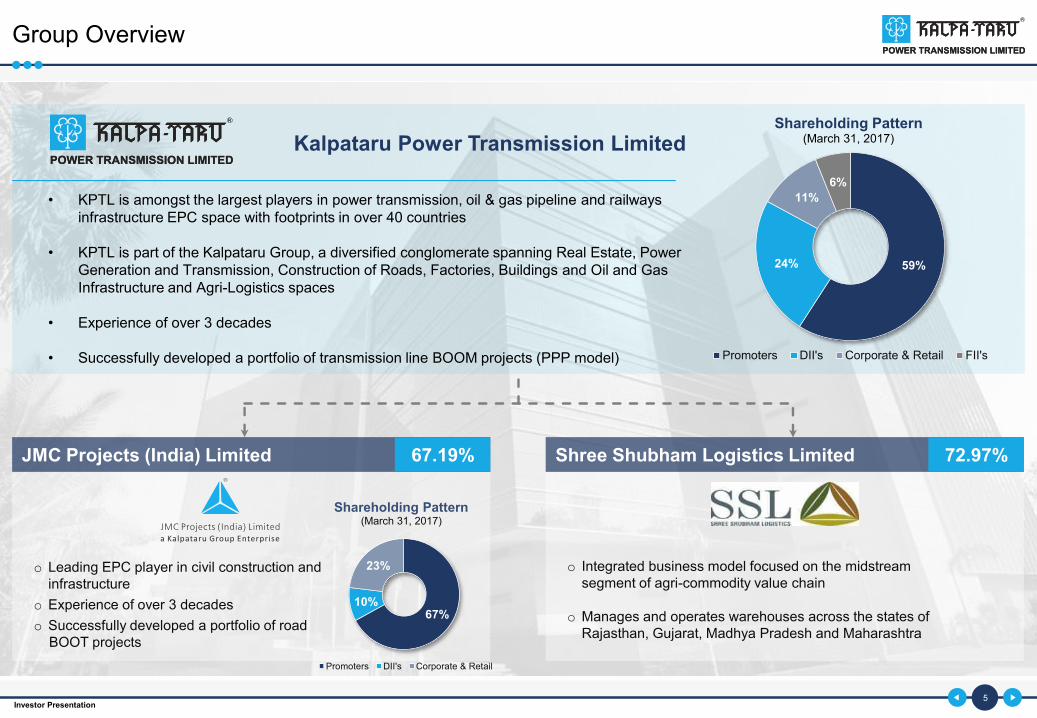
• KPTL is amongst the largest players in power transmission, oil & gas pipeline and railways infrastructure EPC space with footprints in over 40 countries
• KPTL is part of the Kalpataru Group, a diversified conglomerate spanning Real Estate, Power Generation and Transmission, Construction of Roads, Factories, Buildings and Oil and Gas Infrastructure and Agri-Logistics spaces
• Experience of over 3 decades
• Successfully developed a portfolio of transmission line BOOM projects (PPP model)
59%24%
11%
6%
Shareholding Pattern(March 31, 2017)
Promoters DII's Corporate & Retail FII's
o Leading EPC player in civil construction and infrastructure
o Experience of over 3 decades
o Successfully developed a portfolio of roadBOOT projects
67%10%
23%
Shareholding Pattern(March 31, 2017)
Promoters DII's Corporate & Retail
o Integrated business model focused on the midstream segment of agri-commodity value chain
o Manages and operates warehouses across the states of Rajasthan, Gujarat, Madhya Pradesh and Maharashtra
JMC Projects (India) Limited Shree Shubham Logistics Limited
Kalpataru Power Transmission Limited
67.19% 72.97%

Investor Presentation
KPTL Vision & Value System
6
Business
Ethics
Customer
Centric
Approach
Team
WorkQuality
PrideRespect
KPTL
Value System
KP
TL
VA
LU
ES
Permanent & intrinsic ideologies that defines KPTL’s day-to-day functioning
KPTL devotes its resources to deliver quality & sustainable energy transmission solutions. Thereby contributing towards betterment of economies & society
Core principles that define commitment to all stakeholders
Vision
“To be a dependable leader in energy transmission and construction industry globally while enhancing the value offering in other infrastructure verticals and increase stakeholders’ value”
Value System

Investor Presentation 7
Over 100 in-house design engineers
Delivered over 40,000 towers across the world
3D drafting, analysing & designing software to optimize steel fabrication requirements.
Special Designing capabilities for different type of foundations including tower designs and detailing
One of the largest tower fabrication capabilities in the world integrated with quality control system and material testing.
Galvanizing facilities with a capacity of 1,80,000 MT per annum.
Designing
&
Engineering
Manufacturing
Milestones
Established tower manufacturing plants in Gujarat
First turnkey transmission line project - 400 KV from NTPC
First 800KV and 1200 KV tower supply
First overseas turnkey contract –380KV Turkey.
Expanded fabrication capacity to 108,000 MTs
Won first BOOT transmission project in Haryana.
Won largest international transmission contract of India – MEW Kuwait US$ 250 Mn.
Setup new plant of 55,000 MT’s at Raipur.
Crossed turnover of INR 72 Bn (consolidated)
Global footprints expanded to over 40 countries
POWER TRANSMISSION & DISTRIBUTION
1983-95
2015
2016
2001-04
2008
2013
2009
Business Segments

Investor Presentation
Business Segments
8
POWER TRANSMISSION & DISTRIBUTION
o Currently live projects in over 20 countries.
o Selected as one of the empanelled substation EPC contractor for PGCIL, TBCB projects upto 400 KV AIS
o Secured 1st international substation contract in Africa region.
T&D
Turnkey
Solution
Substation
o Helicopter testing facility to test upto 85 metres tower
o Tested over 350 towers for domestic and international clients
Tower
Testing And
R&D
Center
Large base of high-end construction equipment and experience to execute projects globally with a workforce of over 15,000 people.
World class in-house engineering and construction team to execute high voltage substations and delivery of special substations for railways in India and overseas.
Fully automatic tower testing facility (upto 1,200 kv tower), helicopter erection simulation of tower through tower crane including R&D stations
Investor Presentation
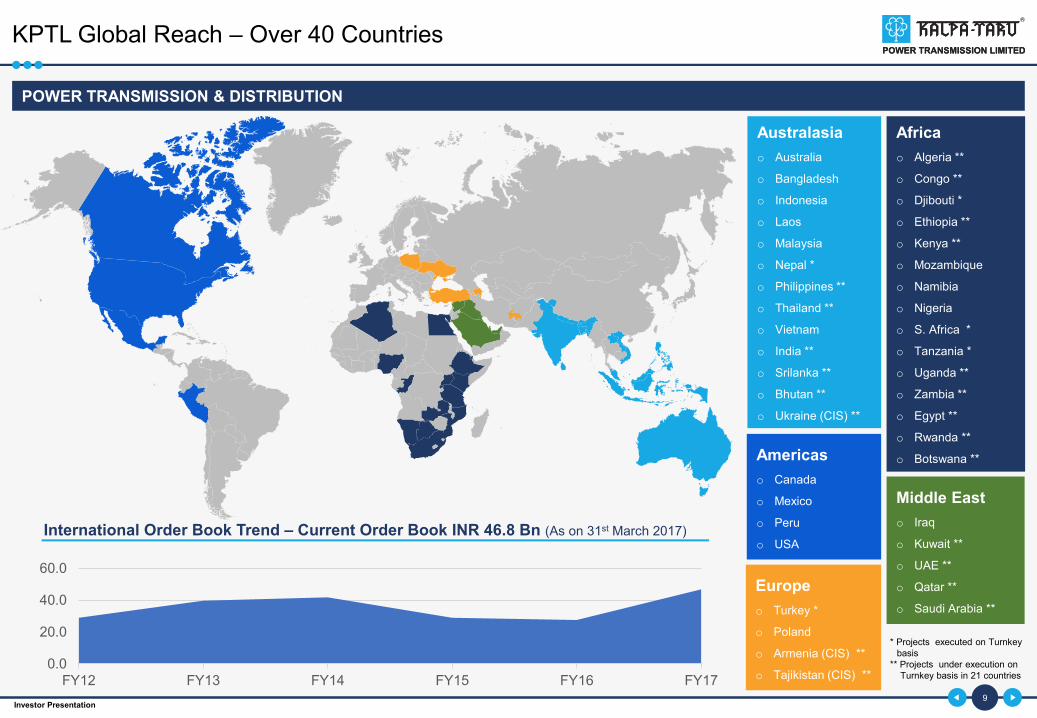
KPTL Global Reach – Over 40 Countries
9
Australasia
o Australia
o Bangladesh
o Indonesia
o Laos
o Malaysia
o Nepal *
o Philippines **
o Thailand **
o Vietnam
o India **
o Srilanka **
o Bhutan **
o Ukraine (CIS) **
Africa
o Algeria **
o Congo **
o Djibouti *
o Ethiopia **
o Kenya **
o Mozambique
o Namibia
o Nigeria
o S. Africa *
o Tanzania *
o Uganda **
o Zambia **
o Egypt **
o Rwanda **
o Botswana **
Middle East
o Iraq
o Kuwait **
o UAE **
o Qatar **
o Saudi Arabia **
Americas
o Canada
o Mexico
o Peru
o USA
Europe
o Turkey *
o Poland
o Armenia (CIS) **
o Tajikistan (CIS) **
* Projects executed on Turnkey basis
** Projects under execution on Turnkey basis in 21 countries
International Order Book Trend – Current Order Book INR 46.8 Bn (As on 31st March 2017)
POWER TRANSMISSION & DISTRIBUTION
0.0
20.0
40.0
60.0
FY12 FY13 FY14 FY15 FY16 FY17
Investor Presentation 10
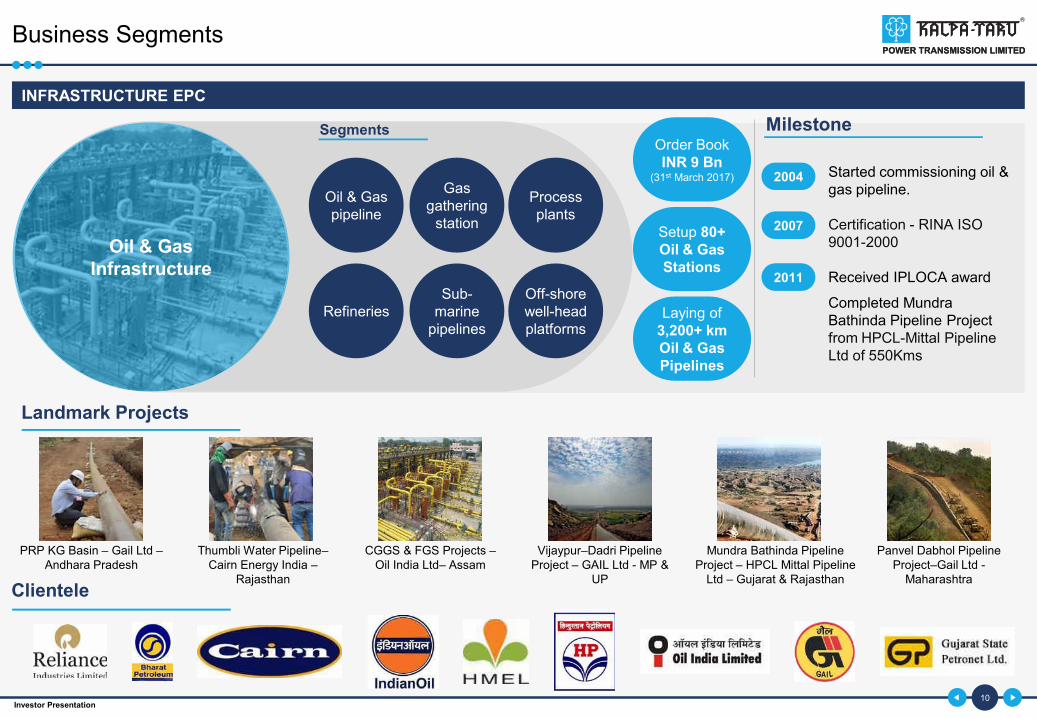
INFRASTRUCTURE EPC
Oil & Gas
Infrastructure
Clientele
Segments
Landmark Projects
PRP KG Basin – Gail Ltd –Andhara Pradesh
Mundra Bathinda Pipeline Project – HPCL Mittal Pipeline
Ltd – Gujarat & Rajasthan
Thumbli Water Pipeline–Cairn Energy India –
Rajasthan
CGGS & FGS Projects –Oil India Ltd– Assam
Vijaypur–Dadri Pipeline Project – GAIL Ltd - MP &
UP
Panvel Dabhol Pipeline Project–Gail Ltd -
Maharashtra
Milestone
2004 Started commissioning oil & gas pipeline.
Certification - RINA ISO 9001-2000
Received IPLOCA award
Completed Mundra Bathinda Pipeline Project from HPCL-Mittal Pipeline Ltd of 550Kms
Order BookINR 9 Bn
(31st March 2017)
Setup 80+
Oil & Gas
Stations
Laying of 3,200+ km
Oil & Gas
Pipelines
Oil & Gas pipeline
Gas gathering
station
Process plants
RefineriesSub-
marine pipelines
Off-shore well-head platforms
2007
2011
Business Segments

Investor Presentation 11
Railway
Infrastructure
Tamluk – Basulya (West Bengal) – RVNLTata Steel Plant – Kalinganagar (Odisha)
Ahmedabad-Palanpur (Gujarat) - Core
Milestones
Landmark Projects
Taljhari – Maharajpur (West Bengal)
Services
Order Book
INR 9 Bn(31st March 2017)
Gearing up to cater
DFC*
opportunities
New tracklaying &
rehabilitation work
Metro Railway &
Private railways sidings
Railway & Overhead
electrification
Bridges & Tunnels
Signalling & Telecommunication (S&T)
Station Buildings &
facilities
Power systems
Platforms & Traction sub-
station
2010 Started operations 2012 Won first international project in Bangladesh
2016 Started participating in DFC opportunities
Business Segments
INFRASTRUCTURE EPC

Investor Presentation
KPTL - Order Book Profile
12
FY17 Order Book – Transmission (International)
FY17 Order Book – Transmission (Domestic)Order Inflow (in INR Bn)
32.0
5.0
3.0
3.0
4.0
Order Book of INR 46.8 Bn
Africa (69.2%)
S. Asia (11.5%)
CIS/Europe & Far East (5.8%)
SAARC (5.8%)
MENA (7.7%)
3034
26
75
62
FY13 FY14 FY15 FY16 FY17
10.8
7.2
7.2
Order Book of INR 25.2 Bn
PGCIL (55%)
SEB (6%)
Private (39%)
Historical Order Book (in INR Bn)
39% 35% 27% 27%
51%28%
49%58%
64%
56%
33%52%
12%
7% 9%
17%
16%20%
FY12 FY13 FY14 FY15 FY16 FY17
Transmission - Domestic Transmission - Overseas
Infra - Pipeline & Railways
59
6865
52
8390

Investor Presentation
KPTL - Financial Highlights (Standalone)
13
Revenue & EBITDA* Margin PBT, PAT & Margins
Net worth Gross Debt+ & D/E Ratio
33.3
40.644.2 44.1
50.1
9.7% 9.5% 9.6%10.3% 10.6%
FY13 FY14 FY15 FY16 FY17
Revenue Margin
(INR Bn) (INR Bn)
2.0 2.22.5
3.0
4
1.4 1.5 1.7 1.9
2.7
5.9%5.4%
5.7%
6.7%
8.0%
4.1%3.6% 3.7%
4.4%
5.4%
FY13 FY14 FY15 FY16 FY17
PBT PAT PBT Margin PAT Margin
18.419.5
20.722.1
24.8
FY13 FY14 FY15 FY16 FY17
(INR Bn) (INR Bn)
5.9
7.9
9.7
6.06.9
0.32
0.40
0.47
0.27 0.28
FY13 FY14 FY15 FY16 FY17
Total Debt Debt-Equity
* Core EBITDA Margin + Total Gross Debt (including maturities)
Free CF
Investor Presentation
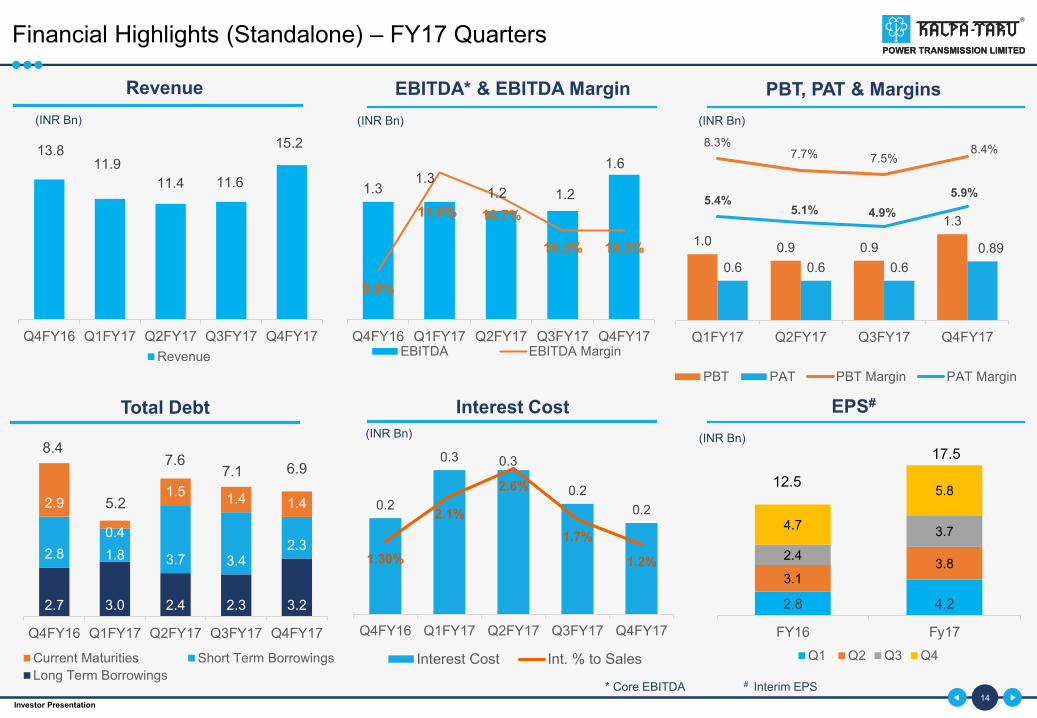
Financial Highlights (Standalone) – FY17 Quarters
EBITDA* & EBITDA Margin PBT, PAT & MarginsRevenue
(INR Bn)
Interest Cost
(INR Bn)
EPS#
(INR Bn)
(INR Bn) (INR Bn)
2.7 3.0 2.4 2.3 3.2
2.8 1.8 3.7 3.42.3
2.9
0.4
1.51.4 1.4
Q4FY16 Q1FY17 Q2FY17 Q3FY17 Q4FY17
Current Maturities Short Term Borrowings
Long Term Borrowings
Total Debt
8.4
5.2
7.67.1
* Core EBITDA # Interim EPS14
6.9
13.811.9
11.4 11.6
15.2
Q4FY16 Q1FY17 Q2FY17 Q3FY17 Q4FY17
Revenue
1.31.3
1.2 1.2
1.6
9.8%
11.0% 10.7%
10.3% 10.3%
9.2%
9.4%
9.6%
9.8%
10.0%
10.2%
10.4%
10.6%
10.8%
11.0%
11.2%
Q4FY16 Q1FY17 Q2FY17 Q3FY17 Q4FY17EBITDA EBITDA Margin
2.8 4.2
3.13.8
2.4
3.74.7
5.8
FY16 Fy17
Q1 Q2 Q3 Q4
12.5
17.5
1.00.9 0.9
1.3
0.6 0.6 0.6
0.89
8.3%7.7% 7.5%
8.4%
5.4%5.1% 4.9%
5.9%
Q1FY17 Q2FY17 Q3FY17 Q4FY17
PBT PAT PBT Margin PAT Margin
0.2
0.3 0.3
0.2
0.2
1.30%
2.1%
2.6%
1.7%
1.2%
Q4FY16 Q1FY17 Q2FY17 Q3FY17 Q4FY17
Interest Cost Int. % to Sales

Investor Presentation 15
ASSET CREATION
Successfully developed a portfolio of transmission line BOOT project in India
Power
Transmission
Line BOOT
Projects
DBFOT/BOOM Projects
Milestones
2009
2012
2013
Won first transmission line DBFOT project in Haryana
Commissioned first transmission DBFOT project
Received early Completion of Transmission Award for the year 2012 by Ministry of Power.
2016Won third transmission line BOOM project
Projects Jhajjar KT Transco Pvt. Ltd.Kalpataru Satpura Transco
Pvt. Ltd.Alipurduar Transmission Ltd. Kohima Mariani Transmission Ltd.
Model Annuity based Annuity based Annuity based Annuity based
Project Scope400 kv/220 kv transmission line of 100kms in Haryana
400 kv Satpura–Ashta DCDS transmission line of 240 kms in MP
Transmission system for transfer of power from new hydro electric power projects in Bhutan on BOOM basis
Transmission system for North Eastern Region Strengthening Scheme (NERSS VI) on BOOM basis
SPV ownershipKalpataru Power - 51% & Techno electric - 49%
Kalpataru Power - 100% Kalpataru Power - 100% To be finalised
Project Cost INR 4.5 Bn INR 3.4 Bn INR 11.5 Bn To be finalised
Concession Period 25 yrs.+ 10 yrs. extendable 25 yrs.+ 10 yrs. extendable 35 Yrs. 35 Yrs.
Current StatusGenerating revenue of INR 540 Mnpa
Generating revenue of INR 380 Mnpa
Under Development, Achievedfinancial closer
SPV Acquired
Completion dateCommenced operation in March 2012
Commenced operation in April 2015
FY19 FY20
2015Executed second transmission line DBFOT project in MP
Business Segments
2017Won fourth transmission line BOOM project

Investor Presentation
Particulars Plant 1 Plant 2
LocationPadampur in Ganganagar District, Rajasthan.
Uniara in Tonk District, Rajasthan.
Plant
ConsumptionAgricultural waste and crop residues (biomass) as inputs.
Capacity 7.8 MW 8 MW
Registrations &
Certifications
- UNFCCC in 2003- Benefited from CERs (Certified
Emission Reduction) in 10 years.- Achieved Gold Standard Certification
in 2012.
Achieved Gold Standard Certification in 2009.
16
ASSET CREATION
Biomass Plants
*Gold Standard is the only premium quality standard for carbon emission reduction projects with added sustainable development benefits and guaranteed environmental integrity.
Logistics infrastructure to collect
~200,000 MTs of waste
Gold Standard
Certification*
o Operating 2 biomass based power generation plants of around 16 MW in Rajasthan
o PPA’s with state electricity boards
o Both plants earns Certified Emission Reductions (CER’s) on usage of agriculture residues
Business Segments

Investor Presentation 17
Major Operating Subsidiaries
Strong Clientele
Factories
Buildings
Power BOP
Infrastructure(Roads, Metro, Water)
Experience of
over 30 YearsEmployees
~3,500
JMC Projects Limited is a full-scale infrastructure EPC player in all verticals viz. Buildings & factory, Roads & Flyovers, Water & Railways, Industrial and Power BOP
Turnkey Service Provider
Civil Firefighting
Mechanical
High-voltageAir-conditioning (HVAC)
Electrical Landscaping
JMC Projects Ltd.
Turnover
INR 23.4 Bn(FY17)
Market Cap.
INR 8.9 Bn(31st Mar.2017)
Key Projects
Power Grid Corpn.,Gurgaon
Indian Institute ofManagement, Ahmedabad
Cadila Healthcare,Ahmedabad
Infosys Technologies, Bangalore
Elevated Metro Stations, DMRC, Delhi
“Thyagaraj Sports Complex” Commonwealth Games 2010, New
Delhi
Investor Presentation
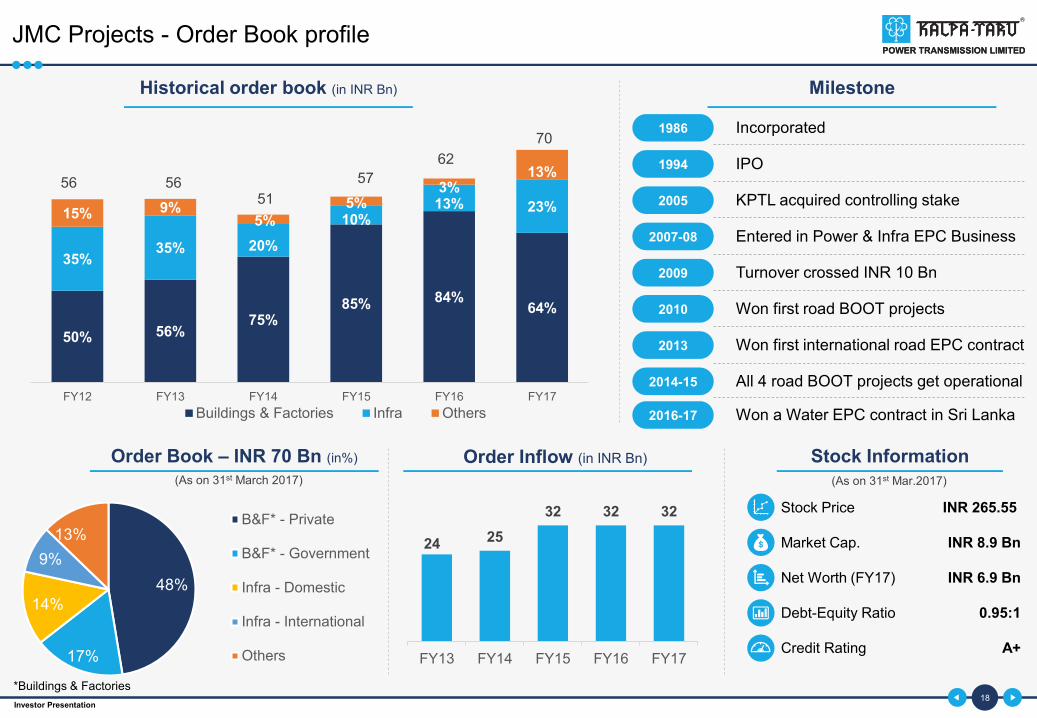
JMC Projects - Order Book profile
18
50% 56%75%
85% 84%64%
35%35% 20%
10%13% 23%15% 9%
5%
5%3%
13%
FY12 FY13 FY14 FY15 FY16 FY17
Buildings & Factories Infra Others
Historical order book (in INR Bn) Milestone
1986 Incorporated
1994 IPO
2005 KPTL acquired controlling stake
2007-08 Entered in Power & Infra EPC Business
2009 Turnover crossed INR 10 Bn
2010 Won first road BOOT projects
2013 Won first international road EPC contract
2014-15 All 4 road BOOT projects get operational
48%
17%
14%
9%
13%B&F* - Private
B&F* - Government
Infra - Domestic
Infra - International
Others
Order Book – INR 70 Bn (in%)
*Buildings & Factories
Stock Information
Stock Price
Market Cap.
Net Worth (FY17)
Debt-Equity Ratio
Credit Rating
INR 265.55
INR 8.9 Bn
INR 6.9 Bn
0.95:1
A+
(As on 31st March 2017) (As on 31st Mar.2017)
2016-17 Won a Water EPC contract in Sri Lanka
56 5651
57
62
70
Order Inflow (in INR Bn)
24 25
32 32 32
FY13 FY14 FY15 FY16 FY17

Investor Presentation
JMC - Financial Highlights (Standalone)
19
Revenue & EBITDA Margin* PAT & PAT Margin
Net worth Gross Debt+ & D/E Ratio
25.426.6
24.1 24.0 23.3
5.0%5.4%
7.4%
8.9% 9.1%
FY13 FY14 FY15 FY16 FY17
Revenue Margin
(INR Bn) (INR Bn)
4.34.5 4.7
6.46.9
FY13 FY14 FY15 FY16^ FY17
(INR Bn)
3.84.3
6.77.3
6.4
0.90 0.96
1.41
1.110.92
FY13 FY14 FY15 FY16 FY17
Total Debt Debt-Equity
(INR Bn)
* Core EBITDA Margin + Total Debt (including maturities) ^ Right issue of INR1.5Bn in Jan.2016
0.16
0.300.44
0.65
0.84
0.20 0.200.30
0.43
0.59
0.6%
1.1%
1.8%
2.7%
3.6%
0.70%0.90%
1.20%
1.80%
2.6%
FY13 FY14 FY15 FY16 FY17
PBT PAT PBT Margin PAT Margin

Investor Presentation
JMC Projects - Road BOOT Projects
20
ProjectsKurukshetra
Expressway Pvt Ltd.
Brij Bhoomi
Expressway Pvt Ltd.
Wanganga
Expressway Pvt Ltd.
Vindhyachal
Expressway Pvt Ltd.
Model Toll Based Toll Based Toll Based Toll Based
Project Scope
Four laning of 83 kms on NH 71 in Haryana under NHDP Phase III between Rohtal to Bawal
2 laning of 79 kms of Agra – Aligarh section on NH 93
4 laning of 45 kms Nagpur – Wainganga section on NH 6, connecting Kolkata & Surat
Four laning of 89 kms on NH 7 from Rewa bypass to hanumana border (MP/UP border)
SPV ownership
JMC Projects 51%JMC Projects
100%JMC Projects
100%JMC Projects
100%
SREI Infrastructure
49%
Project Cost INR 10.35 Bn INR 2.65 Bn INR 4.5 Bn INR 5 Bn
Debt INR 7.9 Bn INR 1.6 Bn INR 3.3 Bn INR 5 Bn
Grant - INR 0.5 Bn - -
Equity INR 2.4 Bn INR 0.5 Bn INR 1.2 Bn INR 1.9 Bn
Premium Payment INR 0.12 Bn. p.a. - INR 0.3 Bn. p.a. INR 0.04 Bn. p.a.
Concession Period 28 Years 15 Years 18 Years 27 Years
5.05.9
Q1FY16 Q1FY17
Avg. Daily Revenue of
all BOOT Projects
4.6 5.1
Q2FY16 Q2FY17
5.3 5.6
Q3FY16 Q3FY17
5.4 6.0
Q4FY16 Q4FY17
19%
10%
6%
10%
(INR Mn/day)

Investor Presentation 21
Major Operating Subsidiaries
Offering One-stop solutions across value chain
Turnover
INR 0.56
Bn(FY17)
Employees
~300
o Post-harvest value chain for agri-commodities with services that include warehousing, procurement, primary processing, trading, collateral management, funding facilitation, funding, testing & certification, and pest management
o Warehouses across the states of Rajasthan, Gujarat, Madhya Pradesh and Maharashtra
o SSL has been approved as an assayer and a warehouse service provider to market trade participants
Storage
(Dry & Cold)
Shree Shubham Logistics Ltd
Weigh
Bridge
Testing &
Certification
Funding
Facilitation
Collateral
Management
Processing
Procurement
KPTL owns
73% stake
ISO
9001:2008
&
22000:2005
certified co.
2007
Timeline
2009
2010
2011
2013
Incorporated
Accreditation with NCDEX as warehouse service provider
Entered into MOU with RSWC for management of their warehouse
WDRA accreditation
PE investments

Investor Presentation
Opportunity
22
Opportunity worth INR 1.4Tn over FY17-22
Overall capex of
USD1.8tn over FY14-30.
Opportunities worth
INR1.2tn over FY17-22
Over INR 5.0tn of
investment in next 5 years (MoRTH)
Opportunity worth
INR 1 Tn for
building 100 Smart cities over FY17-22
25-30% of the
opportunity coming toIndian manufacturers
Over INR 25Bn of orders in pipeline
for FY17-18
Estimated spending of
INR 8.5Tn over next 5 yrsExpect 10,000 kms of
line electrification by 20207000 kms of
broad gauge lines in FY19
Domestic International Substations
Overall Electrification Broad Gauge Lines
Roads Smart Cities Factories Metro
Power T & D
Railway
Infrastructure
Construction
Investor Presentation
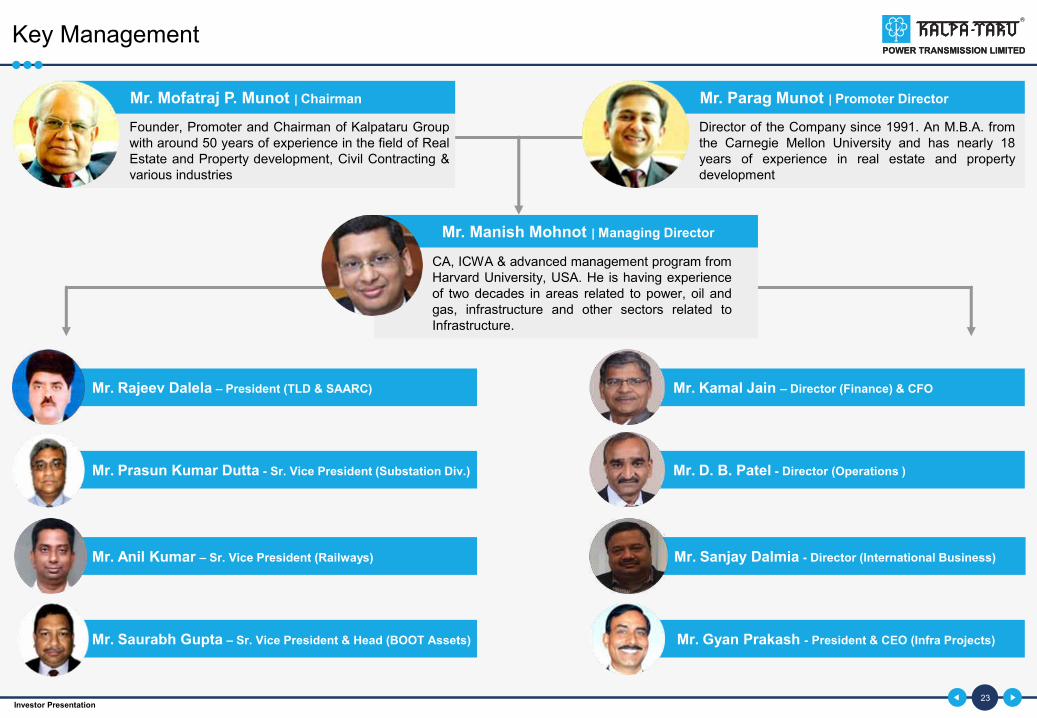
Key Management
23
Mr. Parag Munot | Promoter DirectorMr. Mofatraj P. Munot | Chairman
Founder, Promoter and Chairman of Kalpataru Group with around 50 years of experience in the field of Real Estate and Property development, Civil Contracting & various industries
Director of the Company since 1991. An M.B.A. fromthe Carnegie Mellon University and has nearly 18years of experience in real estate and propertydevelopment
Mr. Manish Mohnot | Managing Director
Mr. Rajeev Dalela – President (TLD & SAARC)
Mr. Prasun Kumar Dutta - Sr. Vice President (Substation Div.)
Mr. Anil Kumar – Sr. Vice President (Railways)
Mr. Saurabh Gupta – Sr. Vice President & Head (BOOT Assets) Mr. Gyan Prakash - President & CEO (Infra Projects)
Mr. Kamal Jain – Director (Finance) & CFO
Mr. D. B. Patel - Director (Operations )
Mr. Sanjay Dalmia - Director (International Business)
CA, ICWA & advanced management program fromHarvard University, USA. He is having experienceof two decades in areas related to power, oil andgas, infrastructure and other sectors related toInfrastructure.

Investor Presentation
Financial Highlights (Consolidated)
24
Revenue & EBITDA Margin* PBT, PAT & Margins
Net worth Gross Debt+ & D/E Ratio
60.8
70.9 71.9 73.176.5
7.8%
8.3%
9.8%11.1%
11.6%
FY13 FY14 FY15 FY16 FY17
Revenue Margin
(INR Bn) (INR Bn)
19.421.0
22.224.0
25.7
FY13 FY14 FY15 FY16 FY17
18.3
27.3
36.833.4
28.6
0.94
1.30
1.66
1.44
1.11
FY13 FY14 FY15 FY16 FY17
Total Debt Debt-Equity
1.9 2.2 2.21.7
3.0
1.3 1.2 1.20.8
1.57
3.2% 3.0% 3.1%
2.3%
3.9%
2.3%1.7% 1.7%
1.0%
2.1%
FY13 FY14 FY15 FY16 FY17
PBT PAT PBT Margin PAT Margin
* Core EBITDA Margin + Total Debt (including maturities)

Investor Presentation
Stock Information
25
Top Institutional Holders
HDFC Asset Management Co. Ltd.
HSBC Global Asset Management (Hong Kong) Ltd.
ICICI Prudential Life Insurance Co. Ltd.
Reliance Nippon Life Asset Mangement Ltd.
DSP BlackRock Investment Managers Pvt Ltd.
ICICI Prudential Asset Management Co. Ltd.
Dimensional Fund Advisors LP
Sundaram Asset Management Co. Ltd.
62
28
25
18
18
16
11
09
7.38%
3.38%
3.00%
2.16%
2.12%
1.95%
1.27%
1.01%
Market Value
(in USD Mn) %O/S
Stock Data - NSE (as on 31st March 2017)
Stock Price
52 Week High/Low
Avg. Volume (1 month)
Market Capitalization
Shares Outstanding
Free Float
INR 322.70
322.70 / 202.00
66462 shares
INR 49.5 Bn
153 Mn
INR 20 Bn / 40.6%
59%24%
11%
6%Promoters
DII's
Corporate & Retail
FII's
Credit Rating
FY17
AA
(As on 31st March 2017)
Source: Factset & NSE India
Shareholding Pattern (as on 31st March 2017)
Investor Presentation
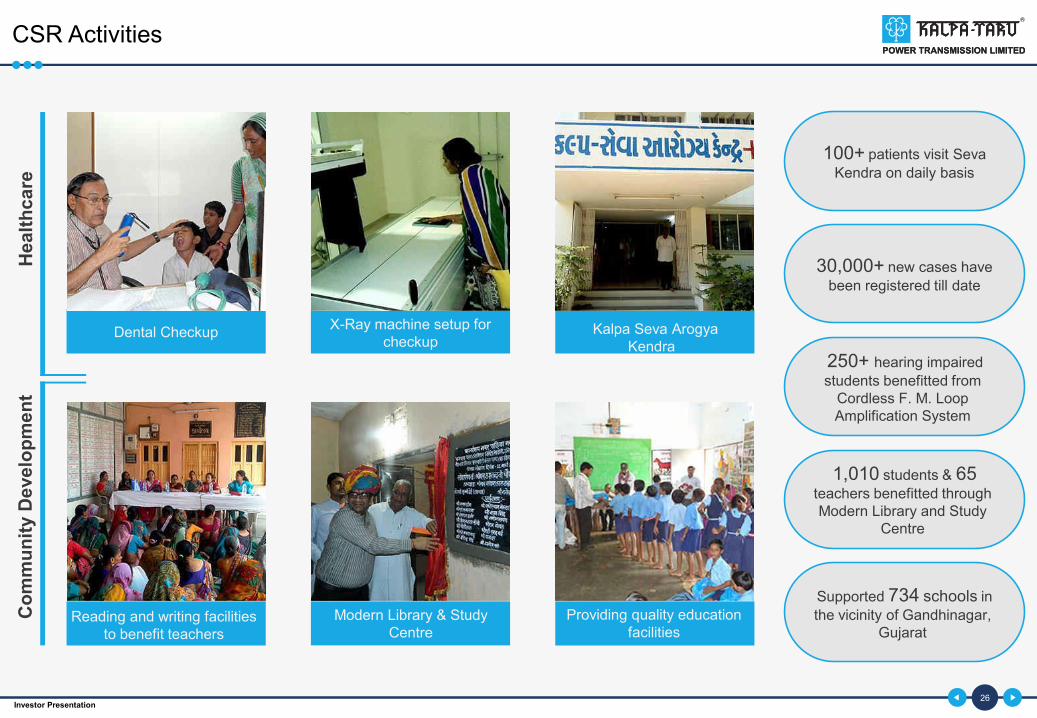
CSR Activities
26
Dental CheckupX-Ray machine setup for
checkup
Reading and writing facilities to benefit teachers
Modern Library & Study Centre
Providing quality education facilities
Kalpa Seva Arogya Kendra
100+ patients visit Seva
Kendra on daily basis
30,000+ new cases have
been registered till date
250+ hearing impaired
students benefitted from Cordless F. M. Loop Amplification System
1,010 students & 65teachers benefitted through Modern Library and Study
Centre
Supported 734 schools in
the vicinity of Gandhinagar, Gujarat
Co
mm
un
ity D
eve
lop
me
nt
He
alt
hc
are

Investor Presentation
Learning & Development
27
Running In-house Training Centre over 10 years with state-of art infrastructure
Spread over 120,000 sqft area Training halls for 300 students Additional discussion rooms
Well-resourced library Hi-tech Computer Centre Boarding for 100 students
* Ahmedabad Education Society
Tie-ups with esteemed education
institutes like NIRMA
& AES* to groom managerial skills
Imparted training to
over 10,000 man-days
Conducted over 500 training programs

Investor Presentation
GYANODAYA Kalpa-Saathi
SWAGAT
Coffee with HOD Maan Ki Baat
“Kalpa – Gaurav”
Career Progression Review Speak-Out Communication Meeting
Employee Initiatives
28
A ‘Saathi” is assigned to newjoiners for acquaintance with theorganizations Culture, Systemsand Processes
A 2 days Employee OrientationProgramme for all new entrants
Employees get to know each otherover a cup of coffee in a relaxedcanvas
Platform for expressing concerns/suggestions & ideas from newentrants and providing properguidance where necessary
An assessment and future road ofemployees’ career growth withinthe organisation
An opportunity to understandorganizations progress & instituteemployees about the way forwardset by management.
Inculcates behavioural & technicalcompetencies for fostering betterpersonal performance, growth &operational excellence
Rewards & recognition foroutstanding contribution & promoteand encourage hard work/ pride/trust/ innovation & improvementamongst employees
Investor Presentation
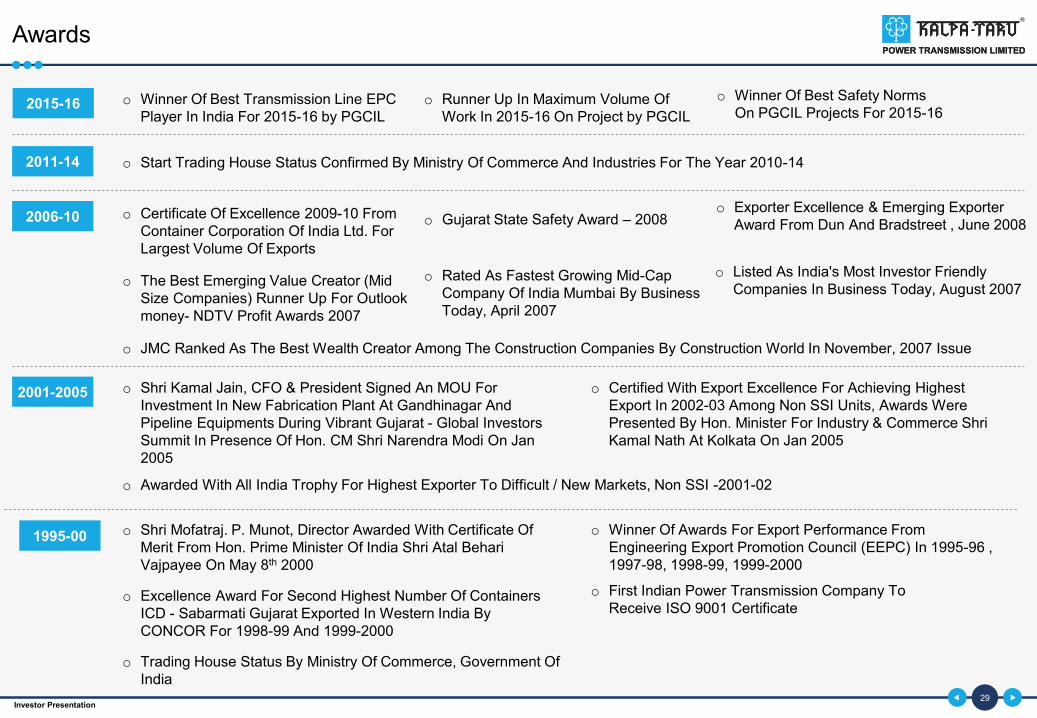
Awards
29
2015-16 o Winner Of Best Transmission Line EPC Player In India For 2015-16 by PGCIL
o The Best Emerging Value Creator (Mid Size Companies) Runner Up For Outlook money- NDTV Profit Awards 2007
o Start Trading House Status Confirmed By Ministry Of Commerce And Industries For The Year 2010-14
o Gujarat State Safety Award – 2008
o Shri Kamal Jain, CFO & President Signed An MOU For Investment In New Fabrication Plant At Gandhinagar And Pipeline Equipments During Vibrant Gujarat - Global Investors Summit In Presence Of Hon. CM Shri Narendra Modi On Jan 2005
o Certified With Export Excellence For Achieving Highest Export In 2002-03 Among Non SSI Units, Awards Were Presented By Hon. Minister For Industry & Commerce Shri Kamal Nath At Kolkata On Jan 2005
o Awarded With All India Trophy For Highest Exporter To Difficult / New Markets, Non SSI -2001-02
o Shri Mofatraj. P. Munot, Director Awarded With Certificate Of Merit From Hon. Prime Minister Of India Shri Atal Behari Vajpayee On May 8th 2000
o First Indian Power Transmission Company To Receive ISO 9001 Certificate
o Winner Of Awards For Export Performance From Engineering Export Promotion Council (EEPC) In 1995-96 , 1997-98, 1998-99, 1999-2000
o Excellence Award For Second Highest Number Of Containers ICD - Sabarmati Gujarat Exported In Western India By CONCOR For 1998-99 And 1999-2000
o Trading House Status By Ministry Of Commerce, Government Of India
2011-14
2006-10
2001-2005
1995-00
o Runner Up In Maximum Volume Of Work In 2015-16 On Project by PGCIL
o Winner Of Best Safety Norms On PGCIL Projects For 2015-16
o Exporter Excellence & Emerging Exporter Award From Dun And Bradstreet , June 2008
o Certificate Of Excellence 2009-10 From Container Corporation Of India Ltd. For Largest Volume Of Exports
o JMC Ranked As The Best Wealth Creator Among The Construction Companies By Construction World In November, 2007 Issue
o Listed As India's Most Investor Friendly Companies In Business Today, August 2007
o Rated As Fastest Growing Mid-Cap Company Of India Mumbai By Business Today, April 2007
Investor Presentation
Existing Clientele
30
Asia /
India
Middle
East
South
East
Asia
Africa
North
America
And Many More….

Registered: Plot No. 101, Part-III, GIDC Estate, Sector -28, Gandhinagar-382028,Gujarat, India.Phone: 079 – 23214000Fax: 079 – 23211966Email: [email protected]
Corporate Office: 101, Kalpataru Synergy, Opp. Grand Hyatt, Vakola, Santacruz (E), Mumbai 400055. IndiaPhone: +91 22 30645000 (Board)Email: [email protected]
Thank You
Contact


