Download - JOST Brokerage Report Update 4th of May 2009

8/8/2019 JOST Brokerage Report Update 4th of May 2009
http://slidepdf.com/reader/full/jost-brokerage-report-update-4th-of-may-2009 1/131
rokerage Report Update
hof May, 2009
ECOMMENDATION: HOLD URRENT PRICE:
ARGET PRICE:
JD2.84
JD3.01
ector Coverage Team:
AREK YAGHMOUR
sistant Vice President search Department
el: +962 6 5200330 Ext. [email protected]
ASSER MOU'MEN
search Analyst search Department
el: +962 6 5200330 Ext. [email protected]
ales & Trading contact:
WISSAM AL-HOURANI curities Unit
el: (962 6) 5200330 Ext. 262x: (962 6) 5685508mail: [email protected]
JORDAN STEEL COMPANY
(JOST)
Share Information 2008 2009F 2010F 2011F
EPS (JD) (0.281) 0.235 0.215 0.236
P/E (x) NM 12.08 13.22 12.03
Number of Shares Outstanding (000's) 35.00 35.00 35.00 35.00 Earnings figures are in JD, and share prices as of 3/5/2009. NM: Not meaningful
Key Financial Indicators
(JD million ,, unless indicated otherwise)
2008 2009F 2010F 2011F
Sales 106.35 64.50 66.79 69.20
COGS (Excluding Depreciation) (110.48) (49.80) (51.68) (53.36)
EBITDA (3.86) 14.75 13.59 14.24
Net Income (9.82) 8.23 7.52 8.26
Total Assets 80.36 73.27 72.16 73.49
Shareholders’ Equity 44.61 50.38 54.40 59.16
Total Debt / Total Assets (%) 38.7% 26.3% 19.7% 14.5%
ROaA (%) (14.1%) 10.7% 10.3% 11.3%
ROaE (%) (21.4%) 17.3% 14.4% 14.6%
Net Margin (%) (9.2%) 12.8% 11.3% 11.9%
LATEST DEVELOPMENTS
• In the first quarter of 2009, JOST revealed a slight drop in its sales figures
despite the significant fall in average selling prices which dropped by more
than 30% compared to the same period last year. Sales during the first three
months of 2009 have fallen by 4.45% to reach JD20.3 million compared to
the same period in 2008.
• During the first quarter of 2009, JOST reported a 47.8% drop in its net profit
which reached JD2.98 million compared to JD5.72 million in the same period
last year.
• After reviewing JOST's latest financial results, we revised our projections and
fair value target upwards. However, we downgraded our recommendation on
JOST's shares to HOLD with an updated target of JD3.01 per share, implying
a 6.0% upside potential to the current price of JD2.84 per share.
F: Capital Investments' estimates.

8/8/2019 JOST Brokerage Report Update 4th of May 2009
http://slidepdf.com/reader/full/jost-brokerage-report-update-4th-of-may-2009 2/13
2
CONTENTS
THE GLOBAL SCENE…………………………………………………. .3
LOCAL STEEL PRICES ………………………………………………. .5
FINANCIAL ANALYSIS…………….……………………………………….……..7
STOCK PERFORMANCE …...……………………………………… ….…...…...10
VALUATION & RECOMMENDATION ..…………………………….………….11
FINANCIALS…………………………………………………………….…………12

8/8/2019 JOST Brokerage Report Update 4th of May 2009
http://slidepdf.com/reader/full/jost-brokerage-report-update-4th-of-may-2009 3/13
3
THE GLOBAL SCENE
World steel production drops for the first time in 10 years
The global economic downturn is having a severe impact on the global steel industry
as production, prices, and demand for key raw materials such as iron ore have
declined sharply.
According to the World Steel Association, worldwide steel production fell by 1.2%
in 2008, declining for the first time in 10 years. Total output reached 1,329.7 million
metric tons (mmt) by the end of 2008 compared to 1,345.4 mmt in 2007 as
production dropped in nearly all the major steel producing regions including the EU,
North America, South America and the CIS.
However, Asia and the Middle East showed positive growth in 2008 where
production increased by 1.9% and 1.2% respectively.
World Steel Production by Region (mmt)
2004 2005 2006 2007 2008 % 07/08
EU 202.3 195.5 206.8 209.6 198.6 -5.3%
CIS 113.4 113.2 119.9 124.2 114.1 -8.1%
Other Europe 24 24.9 28.1 30.4 31.1 2.3%
North America 134 127.6 131.8 132.7 125.4 -5.5%
South America 45.9 45.3 45.3 48.2 47.6 -1.4%
Africa 16.7 18 18.8 18.8 17.4 -7.4%
Middle East 14.3 15.3 15.4 16.5 16.6 1.2%
Asia 510.1 598.1 676.2 756.3 770.5 1.9%
Oceania 8.3 8.6 8.7 8.8 8.4 -4.1
Total 1069.0 1146.5 1250.3 1345.4 1329.7 -1.2%
Source: World Steel Association
Market prospects for 2009 are still weak
The prospects for the construction activity which is highly sensitive to the
availability of capital have softened significantly in the past few months. Moreover,
consumer spending on steel-intensive goods such as automobiles and household
appliances is also likely to be modest, affected by lower availability of consumer
loans, rising unemployment and low consumer confidence; as a result, the short-term
outlook for steel demand will remain weak and concerning with no indication of
when any improvement in economic conditions will favor increased production and
sales.
According to World Steel Dynamics, a US steel consultancy firm, world steel outputcould fall by around 14% in 2009 compared to its level in 2008. Furthermore, Credit
Worldwide crude steel production fell by 1.2%in 2008, reaching1,329.7 mmt
World steel output could fall by around 14% in2009

8/8/2019 JOST Brokerage Report Update 4th of May 2009
http://slidepdf.com/reader/full/jost-brokerage-report-update-4th-of-may-2009 4/13
4
Suisse, which is slightly less gloomy, is forecasting a y-o-y drop of 10% in 2009,
with a pickup expected in the second half of the year.
Evidently, world crude steel production in the first quarter of 2009 amounted to
263.65 mmt, a drop of 22.8% compared to the same period last year. Production
witnessed a downward trend in nearly all the major producing countries except for
Iran and China.
Monthly World Crude Steel Production (mmt)
0
50
100
150
200
250
300
350
Jan Feb Mar Q1
2008 2009
Source: World Steel Association
Demand was particularly weak in North America, Europe, and even regions such as
the Middle East where stocks have reached high levels. China’s steel demand, which
accounted for 48% of the world total in the first three months of 2009, is also
showing signs of weakening as production grew by only 1.4%, with steel traders
halting purchases in order to reduce inventories.
Steel prices have dropped by around 70% from their peak levels
Declining global demand has sent steel prices down sharply in most regions over the
last several months and prices in some markets are down by more than 70% from
their summer peak levels. The price of steel billets is currently around $410 per ton
FOB Dubai coming from Russia and Ukraine; this represents a drop of 66.3% from
its peak recorded in July 2008.
In the past few months, sentiment across all manufacturing sectors has deteriorated
further and the prospect of a major recovery in the prices of steel during the first half
of 2009 has turned sour. Prices for all steel products are, therefore, expected to
decline or stabilize in the near-term as many end users struggle under current
economic conditions. Another factor is the anticipated decline in steelmakers' raw
material costs for 2009 which is also expected to add further pressure on
The price of steel billetsis currently around $410
per ton FOB Dubai
-23.4% -21.2% -23.5%
-22.8%
In the first quarter of 2009, world crude steel
production fell by 22.8%

8/8/2019 JOST Brokerage Report Update 4th of May 2009
http://slidepdf.com/reader/full/jost-brokerage-report-update-4th-of-may-2009 5/13
5
international steel prices as buyers will try to benefit from the producers' reduced
costs.
However, output cuts and capacity reductions should bring the supply-demand
balance more into equilibrium and help to stabilize prices in the second half of the
year. Consequently, many industry experts are anticipating that steel prices may not
move to figures considerably above current levels before the year 2010.
LOCAL STEEL PRICES
Local Steel Prices have plummeted by more than 60% since July 2008
Owing to the significance of steel billets to local steel manufacturers' production
costs, estimated at 80% of the total cost, prices of local steel rebars are to a large
extent determined by international prices of billets.
Local vs International Steel Prices
150
250
350
450
550
650
750
850
950
1050
J a n - 0 5
A p r - 0 5
J u l - 0 5
O c t - 0 5
J a n - 0 6
A p r - 0 6
J u l - 0 6
O c t - 0 6
J a n - 0 7
A p r - 0 7
J u l - 0 7
O c t - 0 7
J a n - 0 8
A p r - 0 8
J u l - 0 8
O c t - 0 8
J a n - 0 9
A p r - 0 9
(JD)
Russian Billets
Local Rebars
Source: Bloomberg & JCCA1
Accordingly, local steel prices witnessed a substantial fall, similar to that of
international steel prices, during the second half of 2008 and reached a bottom atJD360 excluding sales tax in March 2008. Moreover, local steel prices are currently
hovering around JD415 due to the recent rise in international prices of billets.
Local Rebars VS Imported Billets
The chart below illustrates the price difference in Jordanian Dinars between imported
steel billets and local steel rebars in the Jordanian market. As can be seen, the
average difference between billet and rebar prices hovered around JD110 in the
period from 2005 to mid 2008. However, in the second half of 2008 and due to the
sharp fall in international steel prices, the spread increased significantly and reached
1 The Jordanian Construction Contractors Association
Steel billets areestimated to constitutearound 80% of the total
production cost
Local steel prices are
currently hoveringaround JD415

8/8/2019 JOST Brokerage Report Update 4th of May 2009
http://slidepdf.com/reader/full/jost-brokerage-report-update-4th-of-may-2009 6/13
6
around JD297 by the end October due to the protective actions made by local steel
producers in an attempt to avoid huge losses from their high cost inventory.
Nevertheless, the following months witnessed a sharp fall in the prices of local rebars
bringing down the spread to more acceptable levels.
Spread Between Local Rebars & Imported Steel Billets
50
90
130
170
210
250
290
J a n - 0 5
A p r - 0 5
J u l - 0 5
O c t - 0 5
J a n - 0 6
A p r - 0 6
J u l - 0 6
O c t - 0 6
J a n - 0 7
A p r - 0 7
J u l - 0 7
O c t - 0 7
J a n - 0 8
A p r - 0 8
J u l - 0 8
O c t - 0 8
J a n - 0 9
A p r - 0 9
(JD)
Spread
Avg. Spread
Source: JCCA
Going forward, we expect this spread to stabilize at its historical levels of around
JD110 giving JOST healthy margins and streamlined revenue.
Jordanian Steel Production IndexAfter recording its highest level for the year at 171.4 points in May 2008, the steel
production index has slumped considerably to reach 61.8 points in October as steel
traders and real estate developers halted purchases in order to take advantage of
producers' lower cost of production.
Steel Production Index
35
55
75
95
115
135
155
175
195
J a n - 0 8
F e b - 0 8
M a r - 0 8
A p r - 0 8
M a y - 0 8
J u n - 0 8
J u l - 0 8
A u g - 0 8
S e p - 0 8
O c t - 0 8
N o v - 0 8
D e c - 0 8
J a n - 0 9
F e b - 0 9
P o i n t s
Source: Central Bank of Jordan
The steel productionindex has slumped considerably to reach 61
points in October, 2008

8/8/2019 JOST Brokerage Report Update 4th of May 2009
http://slidepdf.com/reader/full/jost-brokerage-report-update-4th-of-may-2009 7/13
7
It is important to note, however, that in the first two months of 2009, the index has
recorded consecutive rises indicating a probable upward trend in the medium term.
Financial Analysis
Sales
JOST's total sales grew by a remarkable 45.8% in the year 2008 reaching JD106.35
million despite the 4% decrease in quantities sold due to weaker demand in the last
quarter of the year. This growth was driven by higher average selling prices
compared to 2007 as average prices witnessed a y-o-y increase of 51.86%.
In the first quarter of 2009, JOST revealed a slight drop in its sales figures in spite of
the significant fall in average selling prices which dropped by more than 30%compared to the same period last year. Sales during the first three months of 2009
reached JD20.3 million, a drop of 4.45% compared to the same period in 2008.
53.6
61.4
72.9
106.4
64.5 66.8 69.2
2005 2006 2007 2008 2009F 2010F 2011F
JOST's Sales (JD Million)
Going foreword, we believe that weak global demand and slowing construction
activity in the kingdom will negatively affect JOST's top line; as a result, we expect
sales' volumes to be around 170,000 tons while average selling prices will plunge by
45.3% compared to last year and stabilize at around JD380/ton by the end of 2009.
Moreover, it is worth noting that JOST's sales have followed a steady upward trend
since the year 2003, making the year 2009 the first in six years to witness a fall in
sales' figures.
Profitability
Despite the hefty growth in sales in 2008, JOST reported a loss of JD9.82 million for
the first time since its inception in 1995. The main reason behind this loss was the
Sales grew by aremarkable 45.8% in the
year 2008 reaching JD106.35
Average selling pricesare expected to stabilize
at around JD380/ ton bythe end of 2009

8/8/2019 JOST Brokerage Report Update 4th of May 2009
http://slidepdf.com/reader/full/jost-brokerage-report-update-4th-of-may-2009 8/13
8
JD10.57 million inventory write-down as a result of the sudden fall in international
steel prices during the second half of the year.
However, in the first quarter of 2009, JOST has been able to turn things around and
report a net income of JD2.98 million.
Cost of Goods Sold
JOST's Cost of Goods Sold (COGS) can be divided into raw materials and
manufacturing expenses, the later, which consists of energy expenses in addition to
chemicals and spare parts, has increased by more than three-fold by the end of 2008
compared to its level in 2007 due to the acquisition of the smelting plant.
2007 2008 2009F 2010F 2011F
COGS (Excl. Dep) 65.519 110.477 49.799 51.680 53.356
Gross Margin (%) 10.2% (3.9%) 22.8% 22.6% 22.9%
Raw materials, which represent imported billets and scrap steel, have also witnessed
substantial growth, increasing by 45.26% from their 2007 levels as a result of rising
prices of steel billets and local scrap in the first three quarters of 2008.
As for the year 2009, increased reliance on the smelting plant is expected to hold
manufacturing expenses from falling sharply, as it is estimated that these expenses
will fall by a relatively modest 7.52% despite plummeting sales.
The cost of raw materials, on the other hand, is expected to drop by 67.5% due to a
combination of lower steel prices and increased reliance on the smelting plant,
reducing expensive steel billet imports used to manufacture steel rebars in favor of
cheaper steel scrap.
Operating Expenses
Selling & Distribution expenses continued with their downward trend for the third
year in a row with a 20.2% drop in 2008. This decline is attributed to reduced
expenses relating to foreign sales as JOST is focusing more on local sales which
require less marketing and freight expenses.
General & Administrative expenses on the other hand have increased steadily since
2005. In 2008 alone, and due to the full acquisition of the smelting plant, G&A
expenses surged by 24.6% to reach JD1.25 million compared to JD1.00 in 2007.
In the first quarter of 2009, JOST reported a
net income of JD2.98million.
Selling & Distributionexpenses dropped by20.2% in 2008

8/8/2019 JOST Brokerage Report Update 4th of May 2009
http://slidepdf.com/reader/full/jost-brokerage-report-update-4th-of-may-2009 9/13
9
Leverage
In the first quarter of 2008, JOST's management made considerable changes to its
capital structure as it increased its debt exposure to reach 31.29% of total assets in
order to partly finance the full acquisition of the Consolidated Jordanian Iron & Steel
Works Company.
As of December 31 2008, debt as a percentage of total assets stood at 38.74%;
however, we believe the company will be able to reduce its debt in 2009 to 25.19%
of total assets by repaying most of its short-term debt.
Liquidity
In the period between 2005 and 2007, JOST enjoyed sufficient liquidity levels;
however in 2008 JOST’s current and quick ratios have fallen to 1.80x and 0.30x
respectively due to higher short-term debt levels which rose from JD5.6 million to
JD13.4 million, while current assets have witnessed a drop of 4.6%.
Current Ratio & Quick Ratio
1.80
2.97
4.52
1.47
0.37
0.95 1.08
0.30
0.00
1.00
2.00
3.00
4.00
5.00
2005 2006 2007 2008
Current Ratio (x) Quick Ratio (x)
Accounts Receivable
In the past two years, JOST has been adopting a more lenient policy with regards to
its credit sales as accounts receivable jumped to JD4.135 million by the end of 2008,
up from around JD0.953 million in 2006. As a result, JOST's receivable days
outstanding (collection period) increased from 12.2 to 18.0 days respectively.
RECEIVABLES
TURNOVER RATE
RECEIVABLE DAYS
OUTSTANDING
2005 32.09 11.37
2006 30.02 12.16
2007 19.95 18.30
2008 20.27 18.01
JOST’s liquidity ratios
have fallen significantlydue to higher short-termdebt levels

8/8/2019 JOST Brokerage Report Update 4th of May 2009
http://slidepdf.com/reader/full/jost-brokerage-report-update-4th-of-may-2009 10/13
10
Going forward, we expect JOST's receivable days outstanding to increase to 20.7
days in 2009 before going back to stabilize around 18 days in the period 2010 –
2015.
Inventory JOST's inventory turnover rate has been improving over the past several years,
reaching 6.78x in 2008, up from 3.36x in 2005. Nevertheless, we are not anticipating
any improvement in the inventory turnover rate in 2009 as the expected decrease in
inventory levels affected by falling international steel prices will be offset by much
lower sales figures. In the following years, we are expecting JOST's turnover rate to
improve and stabilize at around 4.65x.
It is also worth noting that the improvement in the turnover rate in the year 2008 was
mainly attributed to the JD10.57 million inventory write down. However, when
eliminating the effect of this write down, the inventory turnover rate drops
significantly to 4.63x.
STOCK PERFORMANCE
JOST's share price recorded extraordinary gains in the first seven months of 2008
and reached its all time high in July as it reached JD8.23 representing a 207% year-
to-date increase.
JOST's Share Price vs ASE Free Float Index
-45%
30%
105%
180%
255%
J a n - 0 7
M a r - 0 7
M a y - 0 7
J u l - 0 7
S e p - 0 7
N o v - 0 7
J a n - 0 8
M a r - 0 8
M a y - 0 8
J u l - 0 8
S e p - 0 8
N o v - 0 8
J a n - 0 9
M a r - 0 9
C h a n g e ( % )
JOST
ASE Index
Source: Amman Stock Exchange
INVENTORY
TURNOVER RATE
INVENTORY DAYS
OUTSTANDING 2005 3.36 108.69
2006 4.44 82.29
2007 5.75 63.45
2008 6.78 53.82
JOST's shares arecurrently trading upby 90.6% from their level at the beginningof the year
Going forward, we areexpecting JOST'sinventory turnover rateto improve and stabilizeat around 4.65x.

8/8/2019 JOST Brokerage Report Update 4th of May 2009
http://slidepdf.com/reader/full/jost-brokerage-report-update-4th-of-may-2009 11/13
11
However, declining steel prices during the second half of the year in addition to
weaker demand from the construction sector have pushed the share price to its lowest
level since the year 2001. More recently, the share price has gained momentum and
is currently trading up by 90.6% from its level at the beginning of the year.
VALUATION & RECOMMENDATION
The updated fair value target of JOST's shares was derived using a Discounted Cash
Flow (DCF) valuation model.
Key assumptions used:
A Risk-free rate of 5.5% based on the projected yield on the next 5-year
Jordanian government bond
A Market risk premium of 8.9%2
A beta of 1.003
A Weighted Average Cost of Capital (WACC) of 12.15% was calculated
A perpetual growth rate of 1.5% was chosen
A D/E ratio of 26.0%4
Perpetual Growth
1.25% 1.5% 1.75%
11.65% 3.13 3.18 3.24
12.15% 2.97 3.01 3.06 W A C C
12.65% 2.81 2.85 2.89
The table above illustrates the sensitivity of the company's value to different market
conditions and the effect of variances in perpetual growth rate and WACC on JOST’s
share price. Our base scenario assumes a perpetual growth rate of 1.5% and a WACC
of 12.15% indicating a target value of JD3.01 per share.
2 Damodaran Country Default Spreads & Risk Premiums, Jan 2009 3 Bloomberg 4 The D/E ratio was calculated using the book value of debt and the market value of equity

8/8/2019 JOST Brokerage Report Update 4th of May 2009
http://slidepdf.com/reader/full/jost-brokerage-report-update-4th-of-may-2009 12/13
12
Income Statement 2008 2009F 2010F 2011F
(JD Million)
Sales 106.351 64.501 66.791 69.196
Cost of Sales (Excluding Depreciation) (110.477) (49.799) (51.680) (53.356)Gross Profit (4.126) 14.703 15.112 15.840
Administrative Expenses (1.205) (1.205) (1.265) (1.329)
Selling and Distribution Expenses (0.199) (0.249) (0.262) (0.275)
Other Operating Income 1.671 1.500 0.000 0.000
EBITDA (3.859) 14.749 13.585 14.237
Depreciation (4.291) (4.715) (4.784) (4.854)
EBIT (8.150) 10.033 8.801 9.383
Interest Income (1.612) (1.009) (0.670) (0.497)Interest Expense 0.112 0.114 0.222 0.292
Other Non-Operating Income 0.098 0.000 0.000 0.000
Pretax Income (9.552) 9.139 8.354 9.178
Income Taxes (0.266) (0.914) (0.835) (0.918)
Net Income (9.818) 8.225 7.518 8.260
Weighted Average Shares (in millions) 35.000 35.000 35.000 35.000
Earnings Per Share (EPS) (0.281) 0.235 0.215 0.236
8/8/2019 JOST Brokerage Report Update 4th of May 2009
http://slidepdf.com/reader/full/jost-brokerage-report-update-4th-of-may-2009 13/13
13
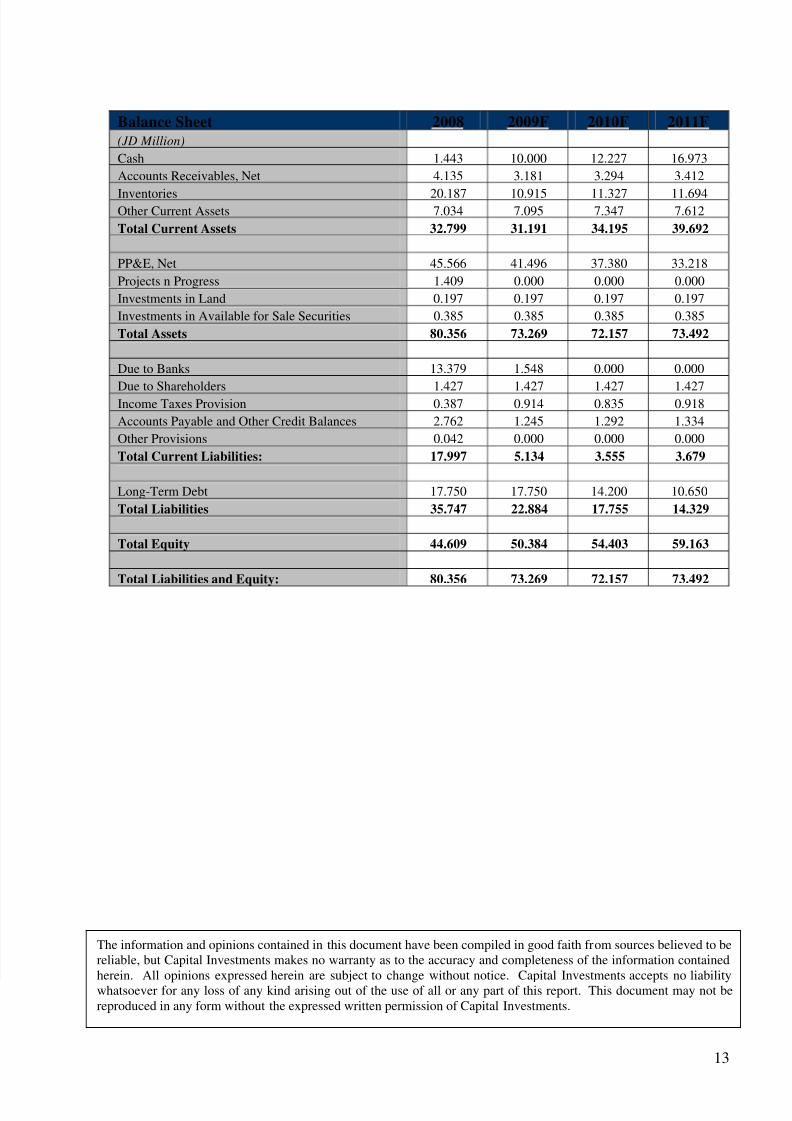
Balance Sheet 2008 2009F 2010F 2011F
(JD Million)
Cash 1.443 10.000 12.227 16.973
Accounts Receivables, Net 4.135 3.181 3.294 3.412
Inventories 20.187 10.915 11.327 11.694Other Current Assets 7.034 7.095 7.347 7.612
Total Current Assets 32.799 31.191 34.195 39.692
PP&E, Net 45.566 41.496 37.380 33.218
Projects n Progress 1.409 0.000 0.000 0.000
Investments in Land 0.197 0.197 0.197 0.197
Investments in Available for Sale Securities 0.385 0.385 0.385 0.385
Total Assets 80.356 73.269 72.157 73.492
Due to Banks 13.379 1.548 0.000 0.000
Due to Shareholders 1.427 1.427 1.427 1.427Income Taxes Provision 0.387 0.914 0.835 0.918
Accounts Payable and Other Credit Balances 2.762 1.245 1.292 1.334
Other Provisions 0.042 0.000 0.000 0.000
Total Current Liabilities: 17.997 5.134 3.555 3.679
Long-Term Debt 17.750 17.750 14.200 10.650
Total Liabilities 35.747 22.884 17.755 14.329
Total Equity 44.609 50.384 54.403 59.163
Total Liabilities and Equity: 80.356 73.269 72.157 73.492
The information and opinions contained in this document have been compiled in good faith from sources believed to bereliable, but Capital Investments makes no warranty as to the accuracy and completeness of the information contained
herein. All opinions expressed herein are subject to change without notice. Capital Investments accepts no liabilitywhatsoever for any loss of any kind arising out of the use of all or any part of this report. This document may not bereproduced in any form without the expressed written permission of Capital Investments.


![[Jürgen jost] postmodern_analysis](https://cdn.vdocuments.site/doc/165x107/5560c3acd8b42a033c8b5961/jurgen-jost-postmodernanalysis.jpg)


