
Japan’sAsset Management Business2017/2018
FOREWORD Can Japan’s asset management industry meet the public’s expectations?
CHAPTER 1 Japanese investor trends
CHAPTER 2 Current state of asset management business
CHAPTER 3 Market trends and product strategies by client segment

FOREWORD Can Japan’s asset management industry meet
the public’s expectations?
The Japanese asset management industry’s AUM increased by ¥30trn during
FY2016. Fresh asset inflows, however, were limited to ETF purchases by
the BOJ and banks’ investments in private funds. Such private fund inflows
have slowed in FY2017. While the asset management industry’s growth has
thus ostensibly downshifted, we find that, beneath the surface, fundamental
conditions are falling into place for asset management services to become
more broadly entrenched in Japanese society.
In the public investment trust market, investment trusts are being used less
as a source of dividend income and more as a vehicle for generating stable
long-term returns. For asset management companies, offering top-notch
investment products suitable for inclusion in portfolios whose objective
is steady capital appreciation will become increasingly important. In the
market for funds offered to banks, AUM growth has slowed somewhat but
will likely reaccelerate as banks make further progress in upgrading their
risk management. Asset management companies could better serve their
bank clients through such means as providing detailed data that afford
look-through visibility to underlying fund holdings while otherwise offering
support based on their extensive portfolio management expertise, including
helping banks to manage in-house securities portfolios. In the pension
market segment, competition will likely intensify further as pension funds,
particularly public ones, diversify their investment universes and revamp their
fee structures for external managers, setting the stage for asset managers to
compete based more on their portfolio management capabilities.
The changes mentioned above have long been on the asset management
industry’s wish list. So far, however, they have not fully taken root as clear
trends. Asset management companies need to take action to ensure that
incipient changes develop into full-fledged trends. This report aims to
highlight signs of change through various innovative analyses. We hope
to refine such analyses through discussion. We warmly welcome candid
feedback from readers.
Hisashi KanekoLead author of Japan’s Asset Management Business 2017/2018
Nomura Research Institute, Ltd.Business Planning & Financial IT Marketing Department
December 2017

CHAPTER
1
Resumed growth in financial assets
The Japanese asset management industry resumed
growing in FY2016 after its previous multiyear growth
streak stalled in FY2015. Its renewed growth was
driven primarily by banks continuing to invest in
securities via funds, albeit at a slower pace than
in the past. Nonetheless, the asset management
industry is faced with a challenging environment.
While public investment trusts are experiencing a
slowdown in asset inflows, dividend distributions
have yet to come down much from their peak level.
Investment trust AUM are at an all-time high but with
fund distributors struggling to come up with business
models that comply with the FSA’s Principles for
Customer-Oriented Business Conduct, investment
trust sales could remain volatile. One bright spot
is that eligibility for individual defined contribution
(iDeCo) retirement accounts has been expanded to
encompass civil servants et al., enlarging the pool of
potential investment trust investors. This development
bodes favorably for steady growth in investment trust
assets.
Exhibit 1 presents a simplified overview of the
Japanese asset management market at March
31, 2017, in terms of products and players, the
latter comprising investors, asset managers and
distributors. It shows which types of asset managers
manage money for which investor classes, how
Japanese investor trends
Securities brokerages
Households: ¥1,665trn(excluding assets in
corporate pension plans)
Japanese AMCs
Japanese AMCs
Japanese AMCs
Foreign AMCs
Foreign AMCs
Foreign AMCs
Foreign AMCs
Life insurers
Foreign gatekeepers
Trust banks/life insurers
Foreign AMCs
Foreign AMCs
Securities brokerages
Online-only distributors
Banks
Banks
Securities brokerages
Consultants
Securities brokerages
Investors (customers) Products Sales channels Asset Management Cos. Subadvisors
Banks: ¥424trn1)
(securities investments)
Insurers: ¥333trn
Pension funds: ¥315trn
Public investment trusts: ¥99trn
Variable annuities: ¥13trn
(Foreign-domiciled investment trusts: ¥5trn)
Private investment trusts
REITS, etc.: ¥30trn
Private investment trusts
Separate accounts
Separate accounts
Commingled accounts: ¥29trn(excluding general account assets)
Real estatemgmt companies
Exhibit 1. Overview of Japan’s asset management business
Note 1: Excludes Norinchukin Bank and Zenkyoren.Source: NRI, based on data from various sources
(as of March 31, 2017)
©2017 Nomura Research Institute, Ltd. All rights reserved. 2

investor assets are allocated, and how asset flows
are intermediated. Asset management companies
(AMCs) in Japan mainly serve three types of clients:
retail investors (households), corporations including
financial institutions, and pension funds. Adjusted to
take into account that financial institutions’ securities
portfolios are largely funded with retail customers’
deposits, Japanese investors’ financial asset holdings
at March 31, 2017, totaled an estimated ¥1,970trn,
a ¥114trn year-on-year increase almost entirely
attributable to the household sector. Specifically,
household financial assets accounted for ¥104trn of
the ¥114trn increase while pension assets accounted
for the ¥10trn remainder.
The ¥1,970trn of total financial assets’ professionally
managed subtotal was ¥514trn1), up ¥32trn from a
year earlier and above the ¥500trn mark for the first
time ever. With professionally managed assets’ share
of total financial assets approaching 30%, AMCs’
presence should continue to expand.
Developments among households,
pension funds and financial institutions
Household financial assets at March 31, 2017,
totaled roughly ¥1,655trn, a ¥104trn increase from a
year earlier. Their composition has remained largely
unchanged, with bank deposits and insurance
products accounting for nearly 80% of the total.
Although the postwar baby boomers’ retirement
wave has already crested, we expect new retirees’
lump-sum retirement benefits, together with working
households’ monthly savings from wages, to remain
a key funding source for household financial asset
holdings. We estimate that over the next five years
such retirement benefits and savings wil l f low
into financial assets at a rate of ¥20trn annually,
augmented by an additional ¥3trn of proceeds from
sales of households’ existing equity and other asset
holdings. Of these ¥23trn of total annual financial
asset inflows, we estimate that roughly 80%, around
¥18trn, will end up in bank accounts or insurance
products and the remainder, a bit over ¥5trn, will
flow into risk assets, mainly equity investment trusts.
Investment trust outflows in the form of dividend
distributions have recently started to gradually
decrease after running as high as ¥5trn annually. Their
prospective rate of descent is hard to predict, but if
they were to hypothetically fall to 50% of their current
level, our estimate of annual investment trust inflows
over the next five years would be to ¥3trn once
dividend distributions are netted out. In addition to
these net inflows, we estimate based on NRI survey
data that NISA (Nippon Individual Savings Accounts)
550500450400350300250200150100
500
(¥trn)
05/3 06/3 07/3 08/3 09/3 10/3 11/3 12/3 13/3 14/3 15/3 16/3 17/3
Advisory (discretionary accounts) Advisory (advisory accounts) Private investment trusts Public investment trustsReal estate funds Trust banks Life insurers
Exhibit 2. AMCs’ AUM
Note: Life insurer AUM are DB pension asset mandates and do not include general-account assets with guaranteed returns.Source: NRI, based on Investment Trusts Association of Japan and Japan Securities Investment Advisers Association data and financial statements in AMCs’ business reports submitted to the FSA and Ministry of Finance’s Kanto Local Finance Bureau
3Japan's Asset Management Business 2017/2018

inflows will amount to nearly ¥3trn annually until
2014-vintage NISAs’ tax exemption on investment
returns expires in two years. For the subsequent three
years of our five-year forecast horizon, we assume
that NISA inflows and outflows will roughly negate
each other. We estimate that nearly 70% of the NISA
inflows will be invested in equity investment trusts, in
which case average annual investment trust inflows
via NISAs over the next five years would approach
¥1trn. Inclusive of these NISA-intermediated inflows
plus an estimated ¥500bn of additional investment
trust inflows via defined contribution retirement
accounts, we estimate total investment trust net-
inflows over the next five years at around ¥4-5trn
per year. Although NISAs and defined contribution
retirement plans have substantial potential, they are
unlikely to drive much market growth for quite a while.
Pension funds, Japan’s largest institutional investors,
collectively had an estimated ¥315trn of assets as
of March 31, 2017. Public pension funds’ share of
this total was ¥207trn, with corporate and other
private pension funds accounting for the remaining
¥108trn. Relative to a year earl ier, the former
increased by ¥12trn while the latter decreased by
¥2trn. The resultant ¥10trn net increase in total
pension assets was mainly attributable to improved
capital market returns. Meanwhile, the Government
Pension Investment Fund (GPIF) experienced asset
inflows due to dissolution of companies’ Employees’
Pension Funds (EPFs) and re-nationalization of a
portion of their assets. The GPIF, having inaugurated
a new management committee with a collective
decision-making model from October 2017, will likely
proceed with further investment reforms, including
increased portfolio allocations to alternative assets
and adoption of a full-fledged performance-based
compensation scheme for external managers. The
GPIF’s external managers can look forward to earning
high management fees if they deliver high returns like
in the past.
Financial institutions’ investment securities holdings
at March 31, 2017, totaled about ¥758trn, a ¥20trn
decrease from a year earlier. Of this total, banks (ex
Japan Post Bank) accounted for ¥218trn, shinkin
banks and credit unions for ¥68trn, Japan Post Bank
for ¥139trn, life insurers for ¥310trn (Japan Post
Insurance’s share of which was ¥64trn) and nonlife
insurers for ¥24trn.
Amid Japan’s ultra-low interest rate environment
and the Bank of Japan’s ongoing massive JGB
purchases, financial institutions have a strong need
to diversify their investment securities portfolios
into higher-yielding assets. They will presumably
continue investing in “other securities,” mainly fund
products and foreign securities, but with the FSA
stepping up oversight of financial institutions’ risk
management of securities portfolios, conditions are
no longer conducive to continued steady growth in
other securities holdings. That said, Japan Post Bank
and Japan Post Insurance continue to upgrade their
securities portfolio management capabilities. Financial
institutions will likely remain strategically important
clients for AMCs.
1) With respect to trusts and life insurers, this total includes only
assets managed on behalf of pension/annuity customers. In the
case of life insurers in particular, the total includes only special-
account balances, not general-account assets with guaranteed
returns (e.g., fixed-amount insurance, fixed annuities).
©2017 Nomura Research Institute, Ltd. All rights reserved. 4

CHAPTER
In this chapter, we look at the state of AMCs’
business based on various data, including proprietary
surveys (we define AMCs as firms specializing in
investment trust management and/or investment
advisory services).
Revenues down 5% in FY2016
Exhibit 3 plots annual changes in AMCs’ AUM
disaggregated by causative factor. First, in the
institutional market segment (leftward graph: total of
discretionary investment advisory AUM and private
investment trust AUM), asset price appreciation,
mainly in domestic and overseas equity markets,
added some ¥8trn to AMCs’ AUM in FY2016.
Meanwhile, net inflows of new assets boosted AMCs’
AUM by whopping ¥41trn, ¥29trn of which flowed
into discretionary investment advisory accounts.
However, nearly all (about ¥27trn2) ) of these ¥29trn
of inflows stem from consolidation and functional
reorganization of major Japanese financial and
insurance groups’ affiliated AMCs. Certain public
pension funds, most notably Mutual Aid Associations,
outsourced management of more of their assets to
external managers again in FY2016. Such outsourcing
generated asset inflows for some AMCs but these
inflows were largely offset by continued redemptions
and mild outflows of private, mostly corporate,
pension assets. On balance, the pension segment as
a whole did not contribute much to AMCs’ asset net-
inflows in FY2016.
Private investment trusts, a product mainly for
financial institutions, saw net inflows of roughly ¥12trn
in FY2016. Outsourcing of portfolio management by
financial institutions to AMCs via private investment
Current state of asset management business2
1 Current state of asset management business
0
20
10
30
40
50
60(¥trn)
2014 20152009 2010 2011 20132012(FY)
2014 20152016 20162009 2010 2011 20132012(FY)Cash flow Market price movements
-20
-10
-5
5
0
10
15
20(¥trn)
DistributionsCash flow Market price movements
-15
-10
Institutional investors (discretionary investment advisory, private investment trusts) Retail investors (open-end equity investment trusts ex ETFs)
Exhibit 3. Changes in AUM broken down by causative factor
Source: NRI, based largely on data from the Investment Trusts Association of Japan, Japan Securities Investment Advisers Association and NRI Fundmark
5Japan's Asset Management Business 2017/2018
trusts has been growing rapidly in recent years.
Although private investment trust net-inflows were
about ¥2.5trn lower in FY2016 than in FY2015, their
previous growth trend essentially remained intact.
In the retail market segment (rightward graph: open-
end public equity investment trust (ex ETF) AUM),
asset price appreciation accounted for roughly ¥4trn
of AUM growth in FY2016. Retail investment trusts’
inflows from sales of new units exceeded redemptions
by a mere ¥1trn in FY2016. Retail investment trust
inflows had been robust until FY15 but have since
slowed precipitously. Adjusted to factor in some ¥5trn
of distributions of investment returns, retail investment
trusts collectively experienced a net outflow of
assets in FY2016. Even inclusive of incremental AUM
stemming from asset price appreciation, growth
in retail investment trust AUM (net assets) was
essentially nil. Retail investment trust distributions
decreased in absolute terms for the first time in a
while, down about ¥1trn from FY2015. With retail
investment trust AUM largely unchanged year on
year at fiscal year-end, this decrease in distributions
was due to a reduction in the overall investment trust
market’s average distribution yield3), which has fallen
below 8% from around 10% as of March 31, 2016.
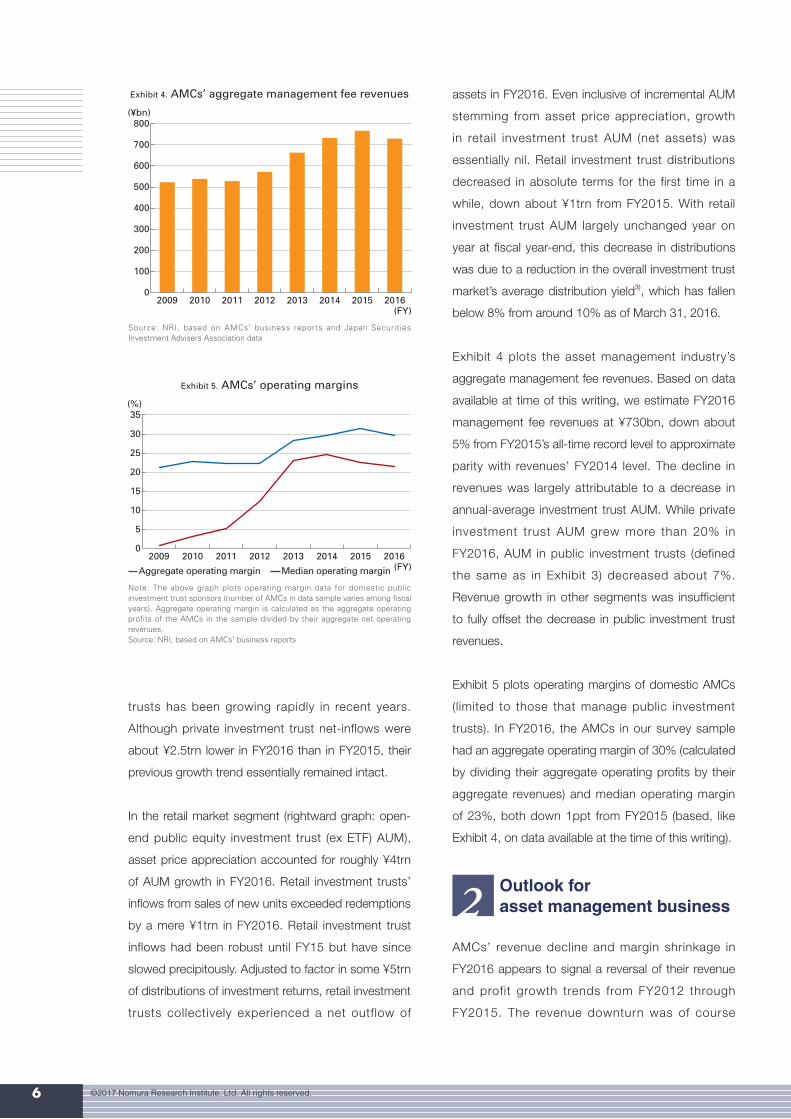
Exhibit 4 plots the asset management industry’s
aggregate management fee revenues. Based on data
available at time of this writing, we estimate FY2016
management fee revenues at ¥730bn, down about
5% from FY2015’s all-time record level to approximate
parity with revenues’ FY2014 level. The decline in
revenues was largely attributable to a decrease in
annual-average investment trust AUM. While private
investment trust AUM grew more than 20% in
FY2016, AUM in public investment trusts (defined
the same as in Exhibit 3) decreased about 7%.
Revenue growth in other segments was insufficient
to fully offset the decrease in public investment trust
revenues.
Exhibit 5 plots operating margins of domestic AMCs
(limited to those that manage public investment
trusts). In FY2016, the AMCs in our survey sample
had an aggregate operating margin of 30% (calculated
by dividing their aggregate operating profits by their
aggregate revenues) and median operating margin
of 23%, both down 1ppt from FY2015 (based, like
Exhibit 4, on data available at the time of this writing).
AMCs’ revenue decline and margin shrinkage in
FY2016 appears to signal a reversal of their revenue
and profit growth trends from FY2012 through
FY2015. The revenue downturn was of course
35
30
25
20
15
10
5
0
(%)
2010 2011 20122009 2013 20152014 2016(FY)Aggregate operating margin Median operating margin
Exhibit 5. AMCs’ operating margins
Note: The above graph plots operating margin data for domestic public investment trust sponsors (number of AMCs in data sample varies among fiscal years). Aggregate operating margin is calculated as the aggregate operating profits of the AMCs in the sample divided by their aggregate net operating revenues.Source: NRI, based on AMCs’ business reports
800
700
600
500
400
300
200
100
0
(¥bn)
2010 2011 2013 2014 2015 201620122009(FY)
Exhibit 4. AMCs’ aggregate management fee revenues
Source: NRI, based on AMCs’ business reports and Japan Securities Investment Advisers Association data
2 Outlook for asset management business
©2017 Nomura Research Institute, Ltd. All rights reserved. 6

mainly due to a decrease in (average-annual) AUM,
which in turn reflects capital market trends. Japan’s
major capital markets’ average valuations in FY2017
through the time of this writing were mostly 10-15%
higher than in the year-earlier period. If these valuation
gains are sustained, AMCs’ revenues and profit
should grow in FY2017.
However, AMCs have business strategies aimed at
capturing asset inflows irrespective of market factors.
We annually survey AMCs’ management (NRI Survey
of Asset Management Companies’ Management
Priorities4) ) to ascertain the asset management
industry’s consensus outlook and latest business
conditions. The remainder of this chapter looks
at how AMCs perceive their near-term business
environment and what they are doing in response, as
revealed by survey responses.
Bullish growth expectations persist;
outlook largely unchanged
First, in terms of AMCs’ overall revenue outlook,
Exhibit 6 plots the percentages of survey respondents
forecasting revenue growth (due to asset net inflows,
excluding revenue growth driven by AUM growth due
to asset price appreciation) in excess of 10% over
the next 3-5 years on a company-wide basis and by
business line (investor segment). Some 40% of the
respondents expect their total revenues to grow more
than 10%. The investor segment in which the most
respondents are forecasting revenue growth of over
10% is the financial institution segment, followed in
descending order by the pension and retail segments.
Figure 7 compares revenue forecasts between
our latest and previous year’s surveys by plotting
percentages of upwardly and downwardly revised
revenue forecasts among respondents that
participated in both surveys. Nearly all domestic-
AMC respondents and around 60% of the foreign-
AMC respondents l e f t the i r company-w ide
revenue forecasts unchanged from the previous
year. The remaining roughly 40% of foreign-AMC
respondents were almost evenly split between
upward and downward revisions. Notwithstanding
this divergence in outlook among a sizable minority of
foreign AMCs, the overall revenue outlook generally
remained unchanged from the preceding year. By
investor segment, many more foreign than domestic
respondents raised their revenue forecasts for the
retail and pension segments. In the financial institution
segment, the vast majority of respondents left their
forecasts unchanged, but more domestic than foreign
60
50
40
30
20
10
0
(%)
Totalrevenue(n=56)
Retailsegment
(n=34)
Pensionsegment
(n=48)
FIsegment
(n=47)
Exhibit 6. Percentage of survey respondents forecasting revenue growth in excess of 10% over next 3-5 years
Note: FI: financial institutionSource: NRI Survey of Asset Management Companies' Management Priorities
50
40
30
20
10
0
-10
-20
-30
(%) Overall Retail Pension FI
DomesticAMCs(n=15)
ForeignAMCs(n=26)
DomesticAMCs(n=16)
ForeignAMCs(n=26)
DomesticAMCs(n=12)
ForeignAMCs(n=15)
DomesticAMCs(n=20)
ForeignAMCs(n=28)
Upward revision Downward revision
Exhibit 7. Percentage of survey respondents that revised their revenue growth forecasts in 2017 relative to 2016 (overall and by business segment)
Note: Data samples are limited to AMCs that participated in survey in both 2016 and 2017. FI: financial institution segment.Source: NRI Survey of Asset Management Companies' Management Priorities
7Japan's Asset Management Business 2017/2018

respondents raised their forecasts.
The asset management industry’s growth in recent
years has been largely driven by a series of favorable
changes in the industry’s external environment (e.g.,
establishment/expansion of programs to promote
household wealth accumulation, adoption of more
sophisticated asset management practices by public
pension funds, suppression of domestic interest
rates, bullish equity market performance). However,
these developments’ positive impact is already
factored into AMCs’ revenue forecasts. Nothing new
happened over the past year that materially changed
the revenue outlook.
Exhibit 8 plots, by asset class, percentages of survey
respondents that revised their asset inflow forecasts
upward or downward relative to their previous-year
forecasts. Overall, somewhat more respondents
revised their forecasts downward than upward.
Downward revisions outweighed upward revisions
most prominently in the domestic bond, foreign
bond and domestic real estate asset classes, likely
reflecting these asset classes’ recent performance
and lofty valuations amid the current interest rate
environment as well as the fact that the GPIF finished
revamping its foreign bond manager structure in
2015. The top-ranked asset classes in terms of
upwardly revised inflow forecasts were foreign
equities, emerging market bonds and private equity.
In comparison to previous surveys, however, upward
revisions did not markedly outweigh downward
revisions in these three asset classes. Indeed, these
asset classes’ forecast revisions were roughly evenly
split between up and down. Such a split in opinion is
another indication of an absence of major changes in
the external environment over the past year5).
AMCs focusing more on working-age
investors in retail investment trust business;
foreign AMCs shifting their institutional
businesses strategies toward major investors
Our survey inquired about AMCs’ priorities in each
investor segment. The survey results shed light on
how such priorities are changing.
First, Exhibit 9 shows the breakdown of respondents
(limited to those that manage public investment
trusts) between those that cater more to retirees than
to working-age investors in their retail investment trust
businesses and those that do the opposite. Public
investment trust investors today are mainly retirees
but the working-age demographic is expected to
emerge as another important retail investor subclass,
given the advent and expansion of NISAs, defined-
contribution (DC) retirement plans and other such
wealth accumulation vehicles for the working-age
20
10
0
-10
-20
-30
-40
(%)
Upward revision Downward revision
Domesticequities(n=36)
Foreignequities(n=38)
Domesticbonds(n=20)
Foreignbonds(n=38)
EMequities(n=33)
EMbonds(n=30)
Domesticreal estate
(n=10)
Foreignreal estate
(n=20)
Commodities(n=11)
Hedgefunds(n=28)
Multi-asset (n=30)
Privateequity(n=18)
Exhibit 8. Percentage of survey respondents that revised their asset in/outflow forecasts in 2017 relative to 2016 (by asset class)
Note: Data samples are limited to AMCs that participated in survey in both 2016 and 2017.Source: NRI Survey of Asset Management Companies' Management Priorities
©2017 Nomura Research Institute, Ltd. All rights reserved. 8
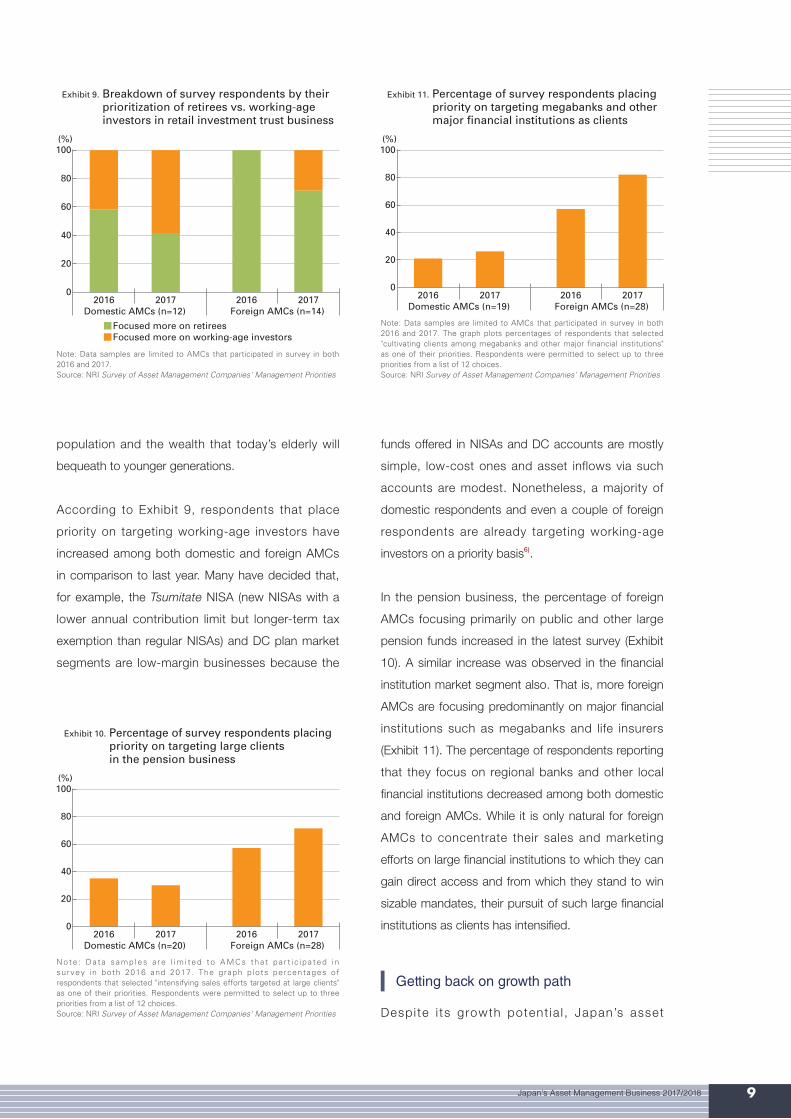
population and the wealth that today’s elderly will
bequeath to younger generations.
According to Exhibit 9, respondents that place
priority on targeting working-age investors have
increased among both domestic and foreign AMCs
in comparison to last year. Many have decided that,
for example, the Tsumitate NISA (new NISAs with a
lower annual contribution limit but longer-term tax
exemption than regular NISAs) and DC plan market
segments are low-margin businesses because the
funds offered in NISAs and DC accounts are mostly
simple, low-cost ones and asset inflows via such
accounts are modest. Nonetheless, a majority of
domestic respondents and even a couple of foreign
respondents are already targeting working-age
investors on a priority basis6).
In the pension business, the percentage of foreign
AMCs focusing primarily on public and other large
pension funds increased in the latest survey (Exhibit
10). A similar increase was observed in the financial
institution market segment also. That is, more foreign
AMCs are focusing predominantly on major financial
institutions such as megabanks and life insurers
(Exhibit 11). The percentage of respondents reporting
that they focus on regional banks and other local
financial institutions decreased among both domestic
and foreign AMCs. While it is only natural for foreign
AMCs to concentrate their sales and marketing
efforts on large financial institutions to which they can
gain direct access and from which they stand to win
sizable mandates, their pursuit of such large financial
institutions as clients has intensified.
Getting back on growth path
Despi te i ts growth potent ia l , Japan’s asset
100
80
60
40
20
0
(%)
2016Domestic AMCs (n=12) Foreign AMCs (n=14)
2017 2016 2017
Focused more on working-age investorsFocused more on retirees
Exhibit 9. Breakdown of survey respondents by their prioritization of retirees vs. working-age investors in retail investment trust business
Note: Data samples are limited to AMCs that participated in survey in both 2016 and 2017.Source: NRI Survey of Asset Management Companies' Management Priorities
100
80
60
40
20
0
(%)
2016Domestic AMCs (n=20) Foreign AMCs (n=28)
2017 2016 2017
Exhibit 10. Percentage of survey respondents placing priority on targeting large clients in the pension business
Note : Da ta samp les a re l im i ted t o AMCs tha t pa r t i c i pa ted i n survey in both 2016 and 2017. The graph p lots percentages of respondents that selected "intensifying sales efforts targeted at large clients" as one of their priorities. Respondents were permitted to select up to three priorities from a list of 12 choices.Source: NRI Survey of Asset Management Companies' Management Priorities
100
80
60
40
20
0
(%)
2016Domestic AMCs (n=19) Foreign AMCs (n=28)
2017 2016 2017
Exhibit 11. Percentage of survey respondents placing priority on targeting megabanks and other major financial institutions as clients
Note: Data samples are limited to AMCs that participated in survey in both 2016 and 2017. The graph plots percentages of respondents that selected "cultivating clients among megabanks and other major financial institutions" as one of their priorities. Respondents were permitted to select up to three priorities from a list of 12 choices.Source: NRI Survey of Asset Management Companies' Management Priorities
9Japan's Asset Management Business 2017/2018

management industry has recently been showing
signs of stagnation, including a downshift in asset
inflows. To achieve growth in such an environment,
AMCs must f igure out how to increase their
competitiveness in the face of inexorable qualitative
changes in investment flows, including an emerging
interest in investing among working-age novices,
increasingly sophisticated public pension fund
management and regulatory reforms targeted at
financial institutions. If AMCs intend to pursue long-
term growth, they need not take their existing
competitiveness as a given but should instead
develop whatever level of competitiveness they
require to realize their management vision. The
resultant improvement in their customers’ investment
experience should help AMCs to not only gain new
customers themselves but also expand the industry’s
overall pool of customers.
The visibility that AMCs currently enjoy with respect
to impending changes in the external environment
affords a good opportunity for them to accurately
reassess their environment, rethink their current and
future positioning and update their long-term business
strategies.
2) This ¥27trn includes an estimated ¥15trn of GPIF and other public
pension fund mandates transferred by Mizuho Trust & Banking to
Asset Management One plus an estimated ¥12trn of AUM that
Mizuho Trust & Banking turned over to Asset Management One.
3) Calculated as trailing-12-month distributions divided by net assets.
4) NRI has conducted this survey annually since FY2007, most
recently in September 2017. The 2017 survey's sample of valid
responses encompassed 61 AMCs (32 Japanese, 29 foreign) that
collectively account for 76% of the Japanese asset management
industry's total AUM.
5) See the third chapter's fourth section for information on absolute
demand levels on a product-by-product basis.
6) However, such foreign AMCs did not upwardly revise their revenue
forecasts for their investment trust businesses. While over 40%
of foreign respondents revised their investment trust revenue
forecasts upward as shown in Exhibit 7, nearly all that did so are in
the subgroup that is placing priority on retirees in Exhibit 9.
©2017 Nomura Research Institute, Ltd. All rights reserved. 10
CHAPTER
Pension assets bounce back to
level of two years earlier
Japanese pension assets at March 31, 2017, totaled
an estimated ¥315trn, up ¥10trn year on year to
approximate parity with their level of two years earlier.
Of this ¥315trn total, public pension schemes (National
Pension, Employees’ Pension Insurance and Mutual
Aid Associations) accounted for ¥207trn, a ¥12trn
year-on-year increase that boosted public pension
schemes’ share of total pension assets to around 66%.
Corporate pension plans and other pension schemes
(National Pension Funds and the Small-scale Enterprise
Mutual Aid System) accounted for the remaining
¥108trn, a ¥2trn decrease from a year earlier.
Since employee pension benefits were standardized
across al l public pension schemes about two
years ago, the GPIF manages National Pension
reserves and the portion of Employees’ Pension
Insurance reserves earmarked for benefits payable
to private-sector employees. Meanwhile, Mutual Aid
Associations manage pension reserves for benefits
payable to their respective constituencies, including
civil servants and private school employees.
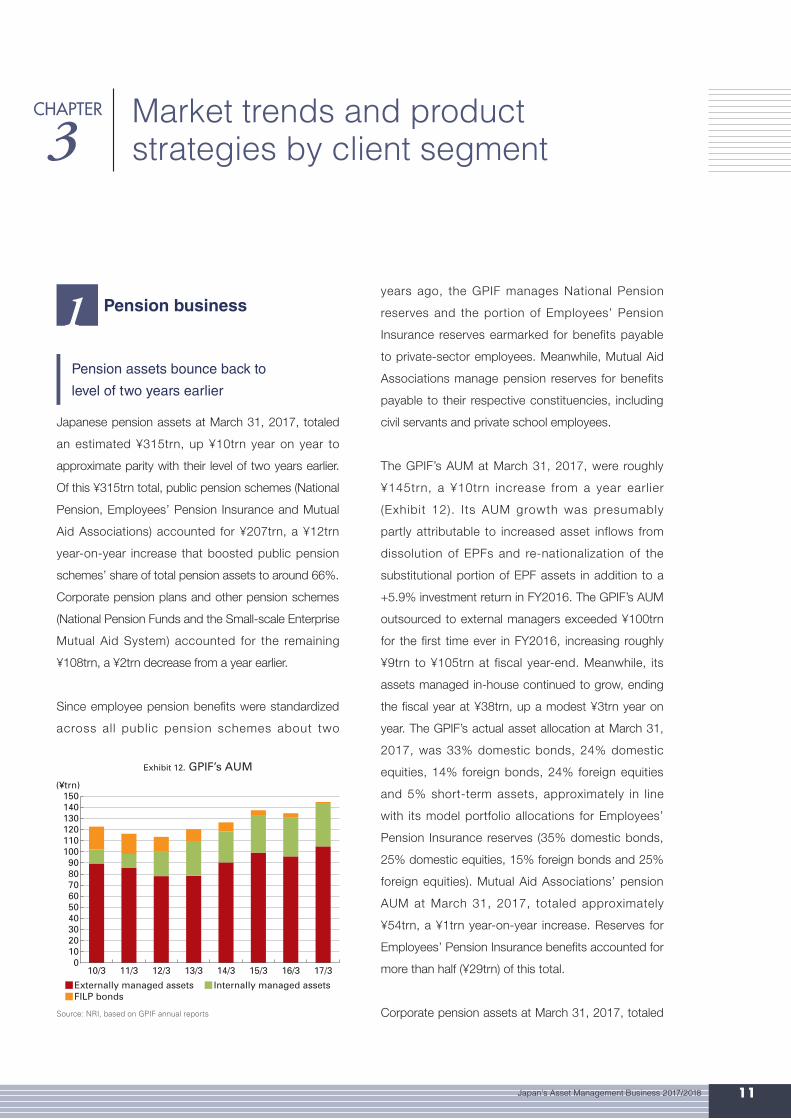
The GPIF’s AUM at March 31, 2017, were roughly
¥145trn, a ¥10trn increase from a year earlier
(Exhibit 12). Its AUM growth was presumably
partly attributable to increased asset inflows from
dissolution of EPFs and re-nationalization of the
substitutional portion of EPF assets in addition to a
+5.9% investment return in FY2016. The GPIF’s AUM
outsourced to external managers exceeded ¥100trn
for the first time ever in FY2016, increasing roughly
¥9trn to ¥105trn at fiscal year-end. Meanwhile, its
assets managed in-house continued to grow, ending
the fiscal year at ¥38trn, up a modest ¥3trn year on
year. The GPIF’s actual asset allocation at March 31,
2017, was 33% domestic bonds, 24% domestic
equities, 14% foreign bonds, 24% foreign equities
and 5% short-term assets, approximately in line
with its model portfolio allocations for Employees’
Pension Insurance reserves (35% domestic bonds,
25% domestic equities, 15% foreign bonds and 25%
foreign equities). Mutual Aid Associations’ pension
AUM at March 31, 2017, totaled approximately
¥54trn, a ¥1trn year-on-year increase. Reserves for
Employees’ Pension Insurance benefits accounted for
more than half (¥29trn) of this total.
Corporate pension assets at March 31, 2017, totaled
Market trends and product strategies by client segment3
1 Pension business
150140130120110100
908070605040302010
0
(¥trn)
10/3 11/3 12/3 13/3 14/3 15/3 16/3 17/3
Externally managed assets Internally managed assetsFILP bonds
Exhibit 12. GPIF’s AUM
Source: NRI, based on GPIF annual reports
11Japan's Asset Management Business 2017/2018

roughly ¥95trn, a ¥2trn year-on-year decrease (Exhibit
13). Defined-benefit (DB) pension plans’ share of
this total was ¥79trn, a nearly ¥4trn reduction from a
year earlier. Despite presumably positive investment
returns, total corporate pension assets continued to
decrease for a second straight fiscal year in the wake
of continued dissolution of EPFs and re-nationalization
of the substitutional portion of EPF assets. In FY2016,
110 EPFs were dissolved and 36 were converted into
other types of plans, leaving 110 still in existence at
fiscal year-end. The remaining EPFs ended FY2016
with ¥19trn in assets and 1.39mn participants, down
¥5trn and 1.15mn from a year earlier. In the first
five months of FY2017, an additional 43 EPFs were
dissolved, reducing the remaining EPF population to
67. DB Corporate Pension plans (non-EPF DB plans)
ended FY2016 with assets of ¥59trn, a year-on-year
increase of barely over ¥1trn. While the number of
contractual DB Corporate Pension plans has been
decreasing, 86 new fund-type plans were established
in FY2016, increasing the total number of DB
Corporate Pension plans to 705 as of April 1, 2017.
Corporate DC pension plans ended FY2016 with
over 5.9mn members and total assets of ¥10.5trn, a
year-on-year increase of nearly ¥1trn. DC plans are
growing briskly in both number and enrollment but
not fast enough to offset the ongoing decline in DB
plans, particularly EPFs. Effective from January 2017,
a major DC pension reform expanded iDeCo (individual
DC retirement) account eligibility to civil servants, non-
working spouses and even employees at companies
with corporate pension plans. Nearly everyone under
age 60 is now eligible to open an iDeCo account.
iDeCo enrollment had previously been growing
continuously since the program’s inception, but since
eligibility was expanded iDeCo enrollment has more
than doubled from around 300,000 at December 31,
2016, to 620,000 at August 31, 2017 (Exhibit 14).
iDeCo accounts’ growing popularity has been fueled
by various advertising and promotional campaigns.
iDeCo assets at March 31, 2017, totaled ¥1.4trn, a
¥160bn increase from a year earlier. Going forward,
however, iDeCo assets’ growth curve will likely
steepen in the wake of continued contributions by
participants and accumulation of investment returns.
Banks reduce their investment securities
holdings for fourth straight year
According to Japan Bankers Association (JBA) data,
Japanese banks ended FY2016 with investment
securities holdings totaling ¥218trn7), a ¥23trn
decrease from a year earlier. Their investment
securities’ share of their total assets likewise declined,
down 9.4 points to 20%. Banks have reduced their
securities holdings for four consecutive years since
700,000
600,000
500,000
400,000
300,000
200,000
100,000
010/3 11/3 12/3 13/3 14/3 15/3 16/3 17/1 2 3 4 5 6 7 8
Self-employed Private-sector employeesCivil servants Non-working spouses
Exhibit 14. Individual DC (iDeCo) plan enrollment
Source: Ministry of Health, Labor and Welfare and National Pension Fund Association
2 Securities investment by banks
110100
908070605040302010
0
(¥trn)
12/3 13/3 14/3 15/3 16/3 17/311/310/3
DB Corporate Pension plans EPFsTax-Qualified Pension plans DC pension plansSERAMA plans
Exhibit 13. Corporate pension assets
Note: SERAMA: Smaller Enterprise Retirement Allowance Mutual AidSource: NRI, based on data from the Trust Companies Association of Japan, Federation of Pension Plan Administrators, and Organization for Workers’ Retirement Allowance Mutual Aid
©2017 Nomura Research Institute, Ltd. All rights reserved. 12

the BOJ launched quantitative and qualitative easing
(QQE) in April 2013. QQE was intended to spur
banks to reallocate assets from JGBs to risk assets,
particularly loans, but banks subsequently continued
to accumulate excess reserves on deposit at the BOJ
instead of lending out those funds or investing them
in securities in accord with QQE’s intent. In response,
the BOJ adopted a negative interest rate policy8)
(NIRP) in February 2016, subjecting a portion of
banks’ excess reserves to negative interest charges
of 0.1% per annum once the reserves exceed a
certain threshold. Despite this deterrent, banks’
deposits receivable have since continued to increase.
In FY2016, they grew a whopping ¥36trn to ¥202trn
at fiscal year-end. Such growth was attributable to
not only city banks but regional banks also. City
banks ended FY2016 with deposits receivable of
¥138trn (up ¥22trn year on year); regional banks
with ¥31trn (up ¥9trn); second-tier regional banks
with ¥6trn (up ¥1.2trn); and trust banks with ¥26trn
(up ¥3trn). However, with excess reserves now
approaching the threshold at which the BOJ will start
charging negative interest, banks are unlikely to keep
accumulating excess reserves.
Banks’ investment security holdings decreased in
FY2016 across all categories of banks. City banks
reduced theirs by ¥15trn to ¥102trn; regional banks by
¥3trn to ¥76trn; second-tier regional banks by ¥800bn
to ¥16trn; and trust banks by ¥3.7trn to ¥21trn9).
Banks pare down their JGB and
“other securities” holdings
Of banks total investment securities holdings at March
31, 2017 (Exhibit 15), JGBs accounted for ¥80trn,
¥18trn less than a year earlier. This ¥18trn decrease
reduced JGBs’ share of banks’ securities holdings
to a 10-year low of 37%. Behind JGBs, the second-
biggest reduction was in “other securities10)” holdings,
which decreased ¥5.7trn in FY2016 to ¥71trn at fiscal
year-end. In place of the divested JGBs and “other
securities,” banks increased their municipal bond and
equity holdings in FY2016, the former by ¥1.2trn year
to ¥14trn and the latter by ¥900bn to ¥25trn. The
growth in municipal bond holdings was the result of
not only local financial institutions but even city banks
subscribing to municipal bond offerings to capture
minuscule yield premia over JGBs. The growth in
banks’ equity holdings was attributable to the equity
market rally in the second half of FY2016.
“Other securities” trading patterns differed among the
various types of banks. While city banks reduced their
“other securities” holdings by a big ¥6.4trn to ¥35trn
in FY2016, regional banks increased theirs by roughly
¥1trn to ¥19trn. Second-tier regional banks followed
suit, increasing their “other securities” holdings by
some ¥400bn to ¥4trn.
Continued growth in non-foreign
“other securities”
Since the BOJ launched QQE, banks have been
diversifying into assets offering higher yields than
JGBs do. Such yield seeking led them to purchase
“other securities” (e.g., funds, foreign securities).
In FY2016, however, banks reduced their “other
securities” holdings for the first time in years, as noted
above (Exhibit 16). According to the BOJ’s Domestic
Bank Assets and Liabilities, banks held ¥61trn of
“other securities” (excluding securities held in foreign
branch accounts) at March 31, 2017, having reduced
350
300
250
200
150
100
50
0
(¥trn)
07/3 08/3 09/3 10/3 11/3 12/3 13/3 14/3 15/3 17/316/3
JGBs (left scale) "Other securities" (left scale)Municipal bonds (left scale) Corporate bonds (left scale)Equities (left scale)Share of total assets at FY-end (right scale)
35
30
25
20
15
10
5
0
(%)
Exhibit 15. Japanese banks’ investment securities holdings by asset class
Source: NRI, based on JBA’s Financial Statements of All Banks
13Japan's Asset Management Business 2017/2018

such holdings by a hefty ¥6.8trn during FY2016.
More specifically, they substantially reduced their
foreign securities holdings while continuing to increase
their holdings of non-foreign “other securities” (e.g.,
funds11), hedge funds, structured bonds). Their
foreign securities holdings ended FY2016 at ¥46trn,
down ¥10trn from a year earlier. This large reduction
was the result of banks offloading foreign bonds in
response to the backup in US yields in the second
half of FY2016. Meanwhile, banks increased their
non-foreign “other securities” holdings by ¥3trn to
¥15trn as of FY2016-end. For banks, investment
in non-foreign “other securities” has become an
important tool for diversifying their securities portfolios
and enhancing their earnings.
Non-foreign “other securities” holdings increased across
all types of banks (Exhibit 17). City banks reduced
their overall “other securities” in FY2016 by ¥7trn to
¥27trn, foreign securities’ share of which was ¥24trn,
a big year-on-year decrease of ¥7.5trn. Meanwhile,
city banks increased their non-foreign “other securities”
holdings, albeit by a mere ¥500bn, to ¥2.5trn. Regional
banks ended FY2016 with “other securities” holdings
of ¥19trn, ¥11trn of which were foreign securities.
While regional banks reduced their foreign securities
holdings by ¥500bn in FY2016, their non-foreign “other
securities” holdings increased by ¥1.5trn for second
straight year to end FY2016 at ¥7.8trn. Regional banks
have apparently been becoming increasingly active
investors in funds and other such products recently.
Second-tier regional banks ended FY2016 with ¥4trn
of “other securities” holdings, a majority of which were
non-foreign. Their foreign securities holdings remained
unchanged in FY2016 at ¥1.9trn while their non-
foreign “other securities” holdings increased ¥500bn
to ¥2.2trn. With few management resources (e.g.,
staff, investment know-how) allocated to securities
investment in comparison to the megabanks, regional
banks and second-tier regional banks have been
becoming increasingly dependent on investment in
non-foreign “other securities” year after year.
According to the BOJ12), products in which Japanese
banks are now investing include equity funds, real
estate funds, laddered bond funds (overseas rates
products) and structured bonds. Some banks invest
exclusively in ETFs to avoid the hassle of complying
with look-through requirements, but many banks
prefer private funds to better navigate constraints
such as capital adequacy regulations (e.g., double-
gearing restrictions) and their own investment policies.
Banks’ securities investment activity
in FY2017
In FY2017, holdings of “other securities,” particularly
foreign ones, have resumed growing across all
categories of banks. Banks are again accumulating
60
50
40
30
20
10
0
(¥trn)
07/3 08/3 09/3 10/3 11/3 12/3 13/3 14/3 15/3 17/316/3
City banks1) Regional banksSecond-tier regional banks
Exhibit 16. "Other securities" holdings by bank type (excluding overseas branch accounts)
Note 1: City banks are Mizuho Bank, Bank of Tokyo-Mitsubishi UFJ, Sumitomo Mitsui Banking Corporation, Resona Bank and Saitama Resona Bank.Source: NRI, based on BOJ’s Domestic Bank Assets and Liabilities
35
30
25
20
15
10
5
0
(¥trn)
City banks1)
07/3
08/3
09/3
10/3
11/3
12/3
13/3
Regional banks Second-tier regional banks
14/3
15/3
16/3
17/3
07/3
08/3
09/3
10/3
11/3
12/3
13/3
14/3
15/3
16/3
17/3
07/3
08/3
09/3
10/3
11/3
12/3
13/3
14/3
15/3
16/3
17/3
Foreign securities (left scale) Other (left scale)
70
60
50
40
30
20
10
0
(%)
Non-foreign share of total (right scale)
Exhibit 17. Year-to-year changes in "other securities" holdings by bank type
Note 1: City banks are Mizuho Bank, Bank of Tokyo-Mitsubishi UFJ, Sumitomo Mitsui Banking Corporation, Resona Bank and Saitama Resona Bank.Source: NRI, based on BOJ’s Domestic Bank Assets and Liabilities
©2017 Nomura Research Institute, Ltd. All rights reserved. 14

foreign securities after ridding their portfolios of
unrealized losses on foreign securities positions. For
city banks and major regional banks that are active
overseas lenders, one key objective of investing in
foreign bonds is foreign-currency liquidity management.
Banks’ non-foreign “other securities” holdings
remained roughly unchanged in size from April 2017
until July, when city banks substantially added to their
holdings. They did so partly in pursuit of even modestly
higher investment returns amid an increasingly
adverse banking environment. Another motivation for
increasing investments in products such as equity
funds was to hedge growing foreign bond holdings.
One regulatory reform that will affect banks’ securities
investment programs is a new set of requirements for
managing interest rate risk in banking books effective
from the end of FY2017. Once this reform takes
effect, internationally active banks will have to quantify
hypothetical changes in the economic value of their
equity and net interest income on a currency-by-
currency basis in response to prescribed interest rate
shocks scenarios and disclose the resultant amounts
together with their regulatory capital. Japanese banks
subject to only domestic regulatory standards will
also have to comply with the same requirements,
albeit from the end of FY2018. In preparation,
Japanese banks are already analyzing how the new
requirements will affect their interest-rate risk taking
and deciding how to adjust their policies accordingly.
Japanese banks’ securities portfolios have always
been sensitive to interest rate risk, given their outsized
JGB allocations. The pending regulatory tightening is
expected to induce banks to exercise more restraint
vis-à-vis interest rate risk. Banks may become more
cautious about investing in long-term bonds and/or
assets denominated in foreign currencies.
What should banks do to stabilize
investment returns?
With banks’ loan books growing slowly amid a
protracted low interest rate environment, securities
investment’s importance to banks as an earnings
source is unlikely to change much. Banks are
therefore l ikely to continue investing in “other
securities,” particularly non-foreign ones, to stabilize
their overall earnings.
Banks that have stepped up their risk-taking through
securities investment are facing pressure from
regulators to commensurately upgrade their risk
management when investing in high-risk assets13).
After rapidly diversifying their securities portfolios
over the past five years or so, banks now face the
imperative of implementing controls tailored to their
securities portfolios’ risk profiles. At all but the largest
banks, risk management has yet to catch up with
diversification of securities portfolios’ risk profiles in the
wake of growth in banks’ “other securities” holdings.
Risk management deficiencies are a potential source
of instability in banks’ securities investment returns.
In other words, banks lack the expertise to maximize
opportunities to profit from securities investment.
One factor cited as a major reason for banks’
underdeveloped investment capabilities is inadequate
understanding of securities investment risks among
banks’ top management. Very few C-suite executives
at Japanese banks, including major ones, have any
asset management experience. In today’s chronically
low interest rate environment, banks have come to
keenly recognize the importance of having a well-
balanced mix of earnings from both lending and
securities investment instead of prioritizing one over
the other. Recruiting outside directors to strengthen
securities investment capabilities from the top down
should help to stabilize earnings going forward.
Cultivating human resources with expertise in portfolio
management is an urgent task for Japanese banks,
especially regional banks. Banks should approach this
task from a long-term perspective, as such human
resource development obviously takes considerable
time. In the meantime, banks must devise short-
15Japan's Asset Management Business 2017/2018

term measures to compensate for human resource
deficiencies. For example, they could proactively
computerize back-office securities investment
functions currently still performed manually or with
Excel spreadsheets at many banks. The resultant
improvement in efficiency would enable banks to
manage bigger portfolios at their existing staffing level
and devote more man-hours to high-value-added
functions such as investment analysis and valuation.
Another option when in-house expertise in certain
portfolio management functions is lacking is to
outsource those functions to qualified outsiders.
Some regional banks have recently been teaming up
to jointly acquire equity stakes in AMCs. While pooling
of assets offers the benefit of economies of scale,
banks’ top management needs to ensure effective
governance with respect to outsourced asset
management mandates.
Yet another option is for banks to centralize securities
investment operations within their respective
groups14). The latest amendment of the Banking Act
allows banks to consolidate common or duplicative
operations within a single group. Banks could realize
economies of scale and deploy their human resources
more efficiently by consolidating their groups’ asset
management operations into one group company.
A final option is to aggressively recruit outsiders.
Operating without sufficient expertise poses risks.
It is important for banks to recruit senior executives
who are capable of effective governance and fully
accountable to top management instead of just hiring
more junior staff.
Investment trust market
showing signs of inertia
Japanese public investment trust AUM totaled
¥98.8trn at March 31, 2017. Equity investment
trusts accounted for ¥85.9trn of this total while bond
investment trusts, including money reserve funds,
accounted for the remaining ¥12.8trn (Exhibit 18).
Equity investment trust AUM at March 31, 2017, was
¥7.4trn (9.4%) higher than a year earlier. With AUM
growing nearly 10% in FY2016, the investment trust
industry may seem to be thriving but it is actually
closer to stagnating.
One reason we make this claim is that most AMCs
have not experienced AUM growth anywhere near
the reported 9.4% growth rate. Equity investment
trust AUM growth in FY2016 was entirely attributable
to ETFs, a subcategory of equity investment trusts.
While ETF AUM grew ¥7.5trn in FY2016, other equity
investment trusts’ aggregate AUM shrank by ¥100bn.
Moreover, ETFs’ rapid AUM growth was driven
predominantly by the BOJ’s ETF purchases (¥5.6trn
in FY2016). All investors other than the BOJ were
collectively a net seller of ETFs by a ¥200bn margin.
The ETFs traded in Japan are sponsored by a mere
handful of AMCs.
Another factor contributing to the investment trust
market’s sense of stagnation is that optimism about
the programs launched in recent years to promote
investment has been steadily subsiding. After debuting
in 2014, the tax-exempt NISA program has undergone
a series of enhancements, including an increase in
3 Retail business
100
90
80
70
60
50
40
30
20
10
0
(¥trn)
10/3 11/3 12/3 13/3 14/3 15/3 16/3 17/3
Equity funds (ex ETFs) ETFs Bond funds
Exhibit 18. Public equity investment trust AUM
Source: Japan Investment Trusts Association
©2017 Nomura Research Institute, Ltd. All rights reserved. 16
the annual contribution limit and the launch of Junior
NISAs for minors and Tsumitate NISAs for those
who want to invest in small, frequent installments.
Additionally, individual DC (iDeCo) retirement account
eligibility was expanded in 2017 to essentially anyone
under age 60. While these programs’ usership has
been steadily growing as expected, it has become
quite apparent that the programs will take a long
time to have a noticeable impact on the investment
trust market’s size. Of the 10.77mn NISAs that had
been opened as of March 2017, the percentage
that actually hold investments is reportedly around
60%. Two-thirds of the ¥3trn annually invested in
NISAs to date have flowed into equity investment
trusts. Annual NISA investment trust outflows due to
redemptions and distributions are estimated at around
20% of AUM. If such outflows’ run rate remains
largely unchanged, NISA-intermediated investment
trust AUM would grow to nearly ¥6trn at year-end
2018 from ¥4.1trn at year-end 2016. From 2019,
however, NISAs’ aggregate investment trust holdings
will likely plateau (disregarding changes in underlying
assets’ market prices) because NISAs’ tax-exempt
status is limited to a maximum of five years. NISA-
intermediated investment trust AUM are unlikely to
grow much going forward unless NISA usership
dramatically increases, NISAs’ tax-exempt period is
extended or asset prices appreciate sharply.
The same is true of DC pension plans. iDeCo account
holders look likely to increase by nearly 500,000
in 2017 to reach 700,000-800,000 by year-end.
Based on NRI survey data, however, we expect
iDeCo enrollment growth to slow to around 100,000
new accounts per year from 2018. If so, total DC
plan enrollment, including both iDeCo accounts and
corporate DC plans, would be growing by about
500,000 participants annually. Annual DC plan
contributions currently total around ¥1trn and are
projected to increase some ¥70bn annually for the
time being. Of total annual DC plan contributions, 40-
45% flow into the investment trust market, implying
that cumulative investment trust inflows via DC plans
over the next five years would amount to only ¥2.8trn.
Neither NISAs nor DC plans have a realistic chance of
expanding the investment trust market much over the
next few years.
With the overall investment trust market thus drifting
toward stagnation, the asset management industry is
hankering for a renewed growth scenario.
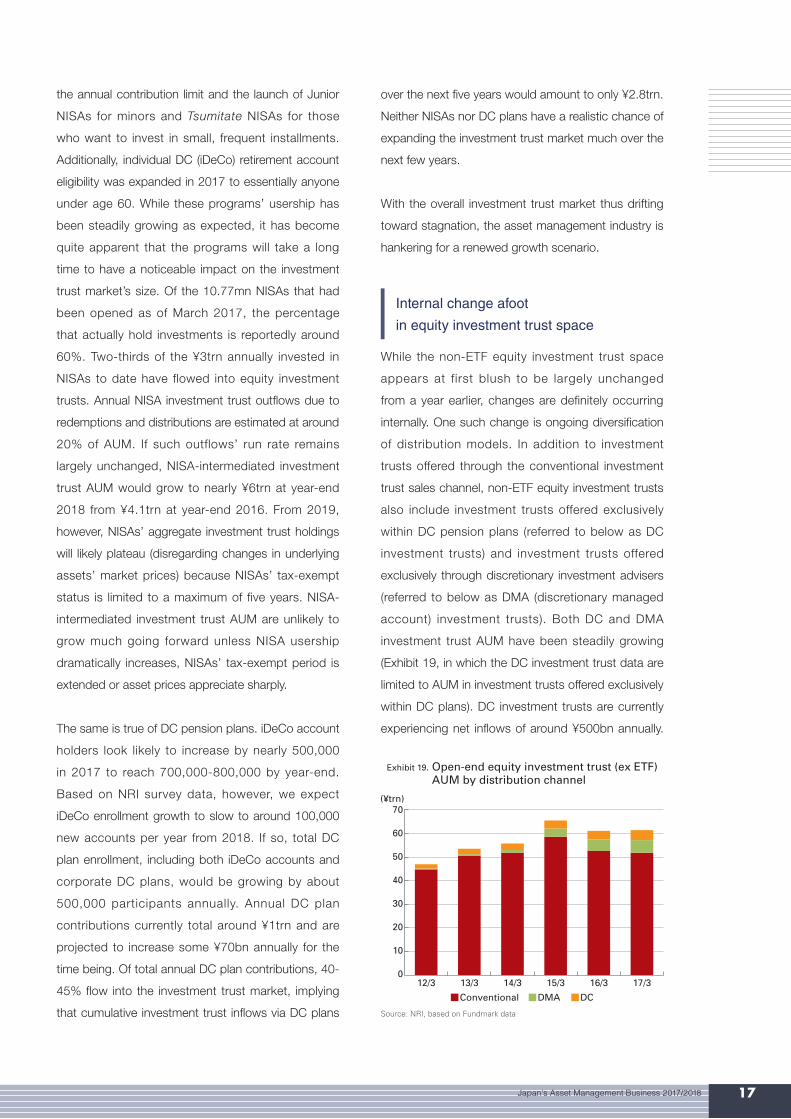
Internal change afoot
in equity investment trust space
While the non-ETF equity investment trust space
appears at first blush to be largely unchanged
from a year earlier, changes are definitely occurring
internally. One such change is ongoing diversification
of distribution models. In addition to investment
trusts offered through the conventional investment
trust sales channel, non-ETF equity investment trusts
also include investment trusts offered exclusively
within DC pension plans (referred to below as DC
investment trusts) and investment trusts offered
exclusively through discretionary investment advisers
(referred to below as DMA (discretionary managed
account) investment trusts). Both DC and DMA
investment trust AUM have been steadily growing
(Exhibit 19, in which the DC investment trust data are
limited to AUM in investment trusts offered exclusively
within DC plans). DC investment trusts are currently
experiencing net inflows of around ¥500bn annually.
70
60
50
40
30
20
10
0
(¥trn)
12/3 13/3 14/3 15/3 16/3 17/3
Conventional DMA DC
Exhibit 19. Open-end equity investment trust (ex ETF) AUM by distribution channel
Source: NRI, based on Fundmark data
17Japan's Asset Management Business 2017/2018

Such inflows are stable in size because a portion
of DC plan contributions flow into investment trusts
every month.
DMA se rv i ces ava i l ab l e to re ta i l i n ves to rs
predominantly take the form of separately managed
accounts (SMAs) or fund wrap accounts. Investment
trusts offered in both types of accounts are mostly
open-end equity investment trusts customized for
such accounts. Although securities brokerages in
Japan have been offering DMA services since 2004,
the services did not gain much popularity until around
FY2014, when DMA investment trusts saw asset
inflows in excess of ¥2trn. Such inflows subsequently
shrank to ¥350bn in FY2016 but they have resumed
growing since April 2017 in the wake of an increase
in providers of retail DMA services. As a value-added
service related to investment trusts, fund distributors
are increasingly focusing on maintaining ongoing
contact with their customers after selling them
investment trusts. This trend is expected to draw
even more financial institutions into the DMA services
market. Any such influx of market entrants would
likely be accompanied by resumed growth in DMA
investment trust inflows.
Dividend fund AUM shrinking
Another change within the investment trust complex
is shrinkage in dividend funds’ AUM. The decrease
in conventional investment trust AUM in recent years
shown in Exhibit 19 is primarily attributable to dividend
funds (Exhibit 20). Dividend funds are investment trusts
that pay out quarterly or more frequent distributions
consisting mostly of investment returns. They grew in
popularity from the early 2000s, mainly among retirees
seeking regular income. Their AUM peaked in March
2015 in the vicinity of ¥45trn, three years after their
share of non-ETF open-end equity investment trust
AUM had peaked at nearly 80%. Over the two years
since March 2015, dividend fund AUM decreased by
some ¥10trn. Dividend funds’ share of total open-end
equity investment trust AUM has dropped almost to
50% as of late. Their annual net inflows (sales minus
redemptions) have diminished to a mere ¥500bn
from a peak level of over ¥12trn. Meanwhile, their
asset outflows due to dividend distributions have not
decreased much, slowing to ¥4.7trn in FY2016 from a
peak of ¥5.7trn in FY2015. In FY2017, dividend funds’
asset outflows may exceed inflows. Their AUM will
likely continue shrinking.
Growth in investment trust AUM
outside of dividend funds
In contrast to dividend funds, other investment trusts’
AUM are growing. Investment trust AUM outside of
dividend funds stood at ¥17.3trn as of March 2017
and ¥20trn six months later, up from less than ¥9trn
as of March 2012.
Among non-dividend funds, asset allocation funds
have experienced the most pronounced AUM growth
(Exhibit 21). Over the five years through March 2017,
their AUM has increased 250% to ¥2.5trn. Asset
allocation funds invest in an assortment of asset
classes. They were once one of the hardest types of
funds for fund distributors to sell, partly because of
the time required to explain all of the asset classes in
which they invest to prospective customers. Recently,
however, even fund distributors have come to view
asset allocation funds as a good vehicle for delivering
80
70
60
50
40
30
20
10
0
(¥trn)
12/3 13/3 14/3 15/3 16/3 17/3
Dividend funds (left scale) Non-dividend funds (left scale)DC/DMA funds (left scale) Dividend funds’ share (right scale)
80
70
60
50
40
30
20
10
0
(%)
Exhibit 20. Open-end equity investment trust (ex ETF) AUM
Source: NRI, based on Fundmark data
©2017 Nomura Research Institute, Ltd. All rights reserved. 18

stable investment returns to customers.
Another category of non-dividend funds that has
recently experienced rapid AUM growth is index funds
outside of the domestic equity asset class. Their
aggregate AUM, though only ¥700bn as of March
2017, had tripled over the preceding five years.
Asset allocation funds and index funds are generally
regarded as core portfolio building blocks for investors
with a medium/long-term investment horizon. As
dividend funds’ popularity has waned, other types of
investment trusts, particularly asset allocation funds
and both domestic and foreign equity and bond index
funds, have started to gain favor. This shift implies
that retail investors’ image of investment trusts is
gradually changing. Specifically, retail investors now
see investment trusts more as a vehicle for medium/
long-term wealth accumulation and less as a source
of income to cover current expenses.
Investment trust market has
substantial potential
If the image of investment trusts as a vehicle for
investing in DC plans, fund wrap accounts or other
DMAs or as a core portfolio building block becomes
entrenched in retail investors’ minds, it could lead to
expansion of the investment trust market.
Investment trusts have hitherto been generally
regarded as a short-term trading vehicle. Even
among experienced investors, investment trusts
have a strong image as a speculative product, not a
means of saving for the future, as was evident from
rankings of best-selling investment trusts a couple
of years ago. A 2015 NRI survey of retail investors
asked its respondents to classify their financial
asset holdings into three buckets: money for near-
term living expenses, savings for the future and
aggressive growth investments. We then classified
the respondents into three categories based on
their investment experience (experienced investors,
aspiring investors and non-investors with no interest
in investing) and estimated how much assets are in
each bucket within each of the three experience-
based categories (Exhibit 22).
By our estimate, experienced retail investors have
some ¥140trn of aggressive growth investments
in addition to ¥300trn saved for the future. Retail
investors currently hold ¥200trn of investment
products split roughly equally between listed equities
and investment trusts. These investment holdings
presumably correspond to the experienced investors’
¥140trn of aggressive growth investments plus a
portion (¥60trn) of their savings for the future.
If investment trusts gain mass recognition as an
18
16
14
12
10
8
6
4
2
0
(¥trn)
12/3 13/3 14/3 15/3 16/3 17/3
Index Active REIT Asset-allocation Other
Exhibit 21. Non-dividend-fund investment trust AUM by fund type
Note: The graph plots AUM in non-dividend-fund investment trusts excluding ETFs and DMA/DC investment trusts. The "Index" and "Active" categories include only funds that invest in a single conventional asset class (i.e., domestic equity, foreign equity, domestic bond or foreign bond).Source: NRI, based on Fundmark data
350
300
250
200
150
100
50
0
(¥trn)
Experiencedinvestors
Aspiringinvestors
Non-investors(uninterested)
Aggressive growth investmentsSavings for futureMoney for living expenses
Exhibit 22. Household financial assets (excluding pensions and life insurance)
Source: Estimates based on 2015 NRI survey of individuals’ investment activity and BOJ Flow of Funds data
19Japan's Asset Management Business 2017/2018

investment vehicle that delivers stable returns over
the long term, the image of investment trusts as a
product in which to invest money saved for the future
should broadly take root. In such an event, a larger
share of experienced investors’ roughly ¥300trn of
savings for the future may flow into the investment
trust market. Experienced investors are not the
only ones with savings. Aspiring investors and non-
investors collectively have some ¥240trn of savings
for the future. As investment trusts shed their existing
image as a high-risk product, individuals in these
other two categories could successively start to build
wealth through investment trusts.
Investment trust business is
under pressure to evolve
The extent to which investment trusts gain widespread
recognition as investment vehicles that deliver stable
long-term returns hinges largely on how many financial
institutions adopt the approach of recommending
portfolios customized to their customers’ investment
objectives and preferences. Only a tiny minority of the
general public possesses enough financial knowledge
to construct a balanced, diversified portfolio without
professional assistance. If faced with a customer who
wants to aggressively invest even in high-risk products
in pursuit of high returns, a financial institution
should mainly fulfill the role of identifying suitable
products and explaining their risk/return profiles to the
customer. If a customer is seeking more of a balance
between safety and returns, the financial institution
should ascertain the customer’s risk tolerance and
recommend a suitable portfolio. Additionally, as
market conditions or customers’ life stages change,
financial institutions should recommend portfolio
adjustments to maintain portfolio suitability.
If financial institutions start offering such services, they
would need to change their business models because
prevailing business models that rely mainly on sales
commissions would give rise to timing mismatches
between service delivery and receipt of compensation
for that service. Given such mismatches, financial
institutions would be unable to properly evaluate
their performance internally or ultimately maintain
an adequate level of service for customers. Many
fund distributors are consequently likely to be forced
to switch to an AUM-based fee model. As already
mentioned, some fund distributors have started to
offer DMA services such as wrap accounts as a
channel for providing investment trusts. Those that do
charge fees for such services based on customers’
account balances. While such services are currently
available from only a small minority of brokerages
and banks, their availability is expected to continue to
expand. Financial institutions should consider AUM-
based fee structures even for non-DMA services. In
such cases, they could ask AMCs to offer separate
share classes to diversify their investment trust
fee levels to accommodate fund distributors’ fee
structures.
Additionally, financial institutions need to seriously
rethink their approach to retirees who own dividend
funds for income. Like working-age investors, retirees
with a long remaining life expectancy need to invest
their assets to generate stable returns over the
medium to long term. In recent years, the financial
services industry has been intent on expanding the
investor population, mainly among working-age
generations. In Japan, the importance of promoting
investment among younger generations goes without
saying, but to change investment trusts’ image
among the working-age population who will become
future investment trust customers, the industry must
first change investment trusts’ image among existing
customers, namely retirees. Doing so makes sense
business-wise also. Over 70% of the aforementioned
experienced investors’ ¥300trn of savings earmarked
for the future is owned by senior citizens aged 60 and
older. Capturing enough demand among retirees to
sufficiently scale up a business should be easier than
in younger age groups.
Serving retirees requires not only stable and efficient
©2017 Nomura Research Institute, Ltd. All rights reserved. 20

portfolio management but also systematic cash-
flow generation. It requires financial institutions to
coordinate asset management and customer account
management functions, with the former tailoring asset
allocations to customer age brackets and the latter
facilitating conversion of invested assets into cash. In
the US, some mutual fund sponsors offer retirement
income funds, but the Japanese investment trust
industry does not yet possess sufficient expertise
with such funds. However, as the world’s most
aged society, Japan cannot afford to wait for other
countries to set a precedent for it to follow. Japan’s
investment trust industry must rethink its approach to
matters such as division of roles between AMCs and
fund distributors and reporting to customers.
We have created product opportunity maps for three
investor segments (retail, pension funds, and financial
institutions) based on data from our Survey of Asset
Management Companies’ Management Priorities.
These maps plot the strength of investor demand for
various products (as assessed by AMCs) against the
products’ current availability (assessed based on the
number of providers that offer each product). They
are useful for identifying promising products (strongly
demanded products offered by few providers (upper
left quadrant)) and competitively disadvantaged
products (poorly demanded products offered by many
providers (lower right quadrant)). Exhibit 23 presents
our product opportunity maps for a subset of products.
First, in the retail investor segment, domestic and
foreign REITs, last year’s top-ranked products on the
demand scale, are ranked much lower this year. REITs
had been popular by virtue of high dividend yields.
Since 2015, however, retail inflows to REITs have
downshifted in the wake of a series of dividend cuts
by major REITs, leading to the drop in REITs’ demand
rating. Periodic-dividend funds remain highly ranked
on the demand scale, though their ranking has been
sliding downward for several years, including 2017.
REITs have been supplanted by actively managed
foreign equity funds as the top-ranked products on
the retail demand scale. The types of foreign equity
funds that are attracting the heaviest asset inflows
include thematic funds and country/regional funds.
One new product offering ranked near the top of the
retail demand scale is funds with a redemption floor
(i.e., guaranteed minimum NAV at redemption). Such
funds are currently offered by only a few AMCs but
they are expected to become more widely available.
Retail demand for broadly defined balanced funds,
including multi-asset balanced funds and target-
volatility funds in addition to redemption-floor funds, is
generally strong. Other asset classes enjoying strong
retail demand include high-yield bonds and emerging
market (EM) equities, both of which have performed
well in recent years. Many AMCs apparently sense a
general shift in demand from dividend-focused funds
to funds that pursue capital appreciation.
The pension and financial institution segments have
much in common on the demand side, reflecting that
the domestic interest rate environment constitutes a
stiff headwind for both pension funds and financial
institutions. With domestic bond yields suppressed
to microscopic levels, foreign fixed-income products
remain in strong demand among pension funds and
financial institutions as a source of yield pickup and
diversifier of yen interest rate risk. Other products
that remain in strong demand include multi-asset
and illiquid investment strategies, the latter of which
include private equity, private debt and domestic and
foreign private real estate funds (including REITs).
One difference between pension funds and financial
institutions is that the latter’s investment needs have
a strong bias toward fixed-income products while
pension fund demand encompasses a more diverse
range of products, including ESG investments and
securities linked to property and casualty (P&C)
insurance. In 2017, the GPIF began passively investing
4 Product market trends by client segment
21Japan's Asset Management Business 2017/2018

(b) Products for pension funds
EM equityActive quant
HY bond
Commodities
Concentrated/long-term equity
DM balanced (equity/bond)
Domestic bond
Domestic long-term bonds
Life-insurance-linked
P&C-insurance-linked Bank loan
Dynamichedging
Outsourced CIO
Multi-asset w/ dynamic asset
allocationReal assets (infrastructure, etc.)
Hedged foreign bondForeign bond
EM bond (local currency)Domestic equity
Domestic private real estate
Foreign private real estate
Activist
ESGequity
PE
Global macro/GTAA
Bond smart beta
Domestic industrial bonds
Privatedebt
Unconstrained bond
Equity smart beta
Core-plus bond
Foreign aggregate bond (incl. industrials)
Foreign equityMarket-neutral/long-short equity
Mezzanine strategies
Low-volatility equity
Foreign industrial bond
Domestic REIT
EM bond (USD)
Global REIT
Number of providersfew
low
hig
hR
epo
rted
dem
and
many
(a) Products for retail investors
Ethical equity (ESG, SRI)
Passive foreign bond
Active foreign bond
Active foreign equity
Active domestic equity
Bull/bear funds
Passive domestic bond
Chinese (including China-related) equity
Infrastructure-related equity
EMequity
EM bond
Non-JapanAsian bond
Currency-choice funds
Target-volatility funds
HY bond
Periodic-dividend funds
NAV-floor funds
Global REIT
Domestic REIT
Lifecycle funds
Liquid alternatives
Commodities
Concentrated/long-term equity
DM balanced(equity/bond)
Hedged foreign bond
Foreign inflation-linked
bond
Multi-asset balanced
Bank loan
Number of providersfewlo
wh
igh
Rep
ort
ed d
eman
dmany
Exhibit 23. Product supply and demand maps by client segment
©2017 Nomura Research Institute, Ltd. All rights reserved. 22

in Japanese equity indices whose constituents are
selected based partly on ESG assessments. The
possibility of other public pension funds following
suit may account for ESG products’ high ranking on
the demand scale. Strategies that invest in securities
linked to P&C insurance are offered by AMCs affiliated
with nonlife insurers. Together with real estate,
such strategies have become a popular alternative
investment among corporate pension funds.
The emergence of retail demand for long-term wealth
accumulation products and institutional portfolios’
progressive diversification are inexorable trends, not
transient fads. AMCs’ long-term growth prospects
hinge largely on how well AMCs can align themselves
with such long-term trends while building solid
operational foundations that enable them to capitalize
on their respective strengths.
(c) Products for financial institutions
EM equity
Global REIT
Domestic REIT
Domestic bond
Traditional asset ETFMulti-asset w/ dynamic asset allocation
HY bond
Hedged foreign bond
Foreign bond
EM bond (USD)
EM bond(local currency)
Domestic equity
ESG equity
Bond smart beta
Foreign industrial bond
Mezzanine strategies
Unconstrained bond
Equity smart beta
Core-plus bond
Foreign aggregate bond (incl. industrials)
Foreign equity
Market-neutral/long-short equity
Domestic industrial bond
Low-volatility equity
PE
PrivatedebtDomestic private
real estate
Activist
Bear fund
Domestic long-term bond
Non-Japan Asian equityDM balanced
(equity/bond)
Hedge fund
Real assets (infrastructure,
etc.)
Foreign private real estate
Number of providersfew
low
hig
hR
epo
rted
dem
and
many
Note: The vertical scale is an indexed scale of the strength of demand from clients (based on AMCs’ assessment of demand). The horizontal scale represents the number of AMCs that offer the product (scaled by number of providers not by value).Source: NRI, based on Survey of Asset Management Companies’ Management Priorities
financial institutions avoid concentrated exposures to specific
asset classes/risks in light of the possibility of them making
high-risk investments to boost their earnings in a low interest
rate environment. The BOJ's On-Site Examination Policy for
Fiscal 2017 states that BOJ examiners will scrutinize whether
financial institutions (1) appropriately identify and analyze their
securities holdings and overall portfolios’ risks by risk factor, (2)
ensure that their risk management staff monitors market prices,
risk exposures and compliance with risk limits with sufficient
granularity as warranted by risk profiles and investment methods
and (3) periodically review risk-measurement methods' adequacy
and limitations through, e.g., backtesting, adjust those methods
as necessary and stress-test their risk management frameworks.
14) A 2017 Banking Act amendment permits banks to centralize
common and duplicative functions within a single group.
7) JBA data includes overseas branch accounts.
8) As the name implies, NIRP is a central bank policy of setting a
nominal policy rate below 0%.
9) The JBA total differs from the sum of the city bank, regional bank,
second-tier regional bank and trust bank subtotals because it
includes Shinsei Bank and Aozora Bank's securities holdings also.
10) “Other securities” are foreign securities and domestic securities
other than JGBs, corporate bonds, municipal bonds and equities.
11) Fund holdings reported by banks. Some financial institutions
report fund holdings as the funds' underlying assets based on
look-through information.
12) BOJ, Financial System Report (April 2017).
13) The FSA's Strategic Directions and Priorities 2016-17, published
in October 2016, state that the FSA plans to monitor financial
institutions' investment portfolios to ensure that Japanese
23Japan's Asset Management Business 2017/2018

Date of Issue
Publication
Publisher
Editor-in-Chief
Editing
Inquiries to:
Author's Profile
The entire content of this report is subject to copyright with all rights reserved. Reproduction in Whole or in part use for any public purpose is permitted only with the prior written approval of Nomura Research Institute, Ltd..In no event shall Nomura Research Institute, Ltd. be liable for any loss or damage arising in connection with the use of this information.
Japan's Asset Management Business2017/2018
December 27, 2017
Nomura Research Institute, Ltd., Otemachi Financial City Grand Cube, 1-9-2 Otemachi, Chiyoda-ku, Tokyo 100-0004, Japan http://www.nri.com/global
Shigeki Hayashi
Hiroyuki Yamagishi
Business Planning & Financial IT Marketing Department
Business Planning & Financial IT Marketing Department [email protected]
Senior ResearcherHitomi Kawahashi
ConsultantHiroko Tominaga
Business Planning & Financial IT Marketing Department
Business Planning & Financial IT Marketing Department
Business Planning & Financial IT Marketing Department
Senior ResearcherHisashi Kaneko

Japan’sAsset Management Business
Japan's
Asset
Management
Business
2017/2018


