
© James P.G. Sterbenz ITTC
04 February 2016 © 2002-2016 James P.G. Sterbenz rev. 16.1
Science of Communication Networks The University of Kansas EECS 784
Internet Topology and Graph Spectra
James P.G. Sterbenz
Department of Electrical Engineering & Computer Science
Information Technology & Telecommunications Research Center
The University of Kansas
http://www.ittc.ku.edu/~jpgs/courses/scinets

© James P.G. Sterbenz ITTC
04 February 2016 KU EECS SCN – Science of Nets – Graph Spectra SCN-ST-2
Internet Topology and Graph Spectra Outline
ST.1 Multilevel graphs
ST.2 Internet topology
ST.3 Graph spectra

© James P.G. Sterbenz ITTC
04 February 2016 KU EECS SCN – Science of Nets – Graph Spectra SCN-ST-3
Internet Topology Complexity
• Modelling the Internet
– Internet is really complex system (more later)
• scale: number of nodes (graph theoretic order)
• hierarchy: backbones, regional access, subscribers
• differing structural (graph theoretic properties) of each

© James P.G. Sterbenz ITTC
04 February 2016 KU EECS SCN – Science of Nets – Graph Spectra SCN-ST-4
Internet Topology Multilevel
• Modelling the Internet
– Internet is really complex system (more later)
• scale: number of nodes (graph theoretic order)
• hierarchy: backbones, regional access, subscribers
• differing structural (graph theoretic properties) of each
– Internet is multilevel graph
• physical infrastructure (fibre, wireless links, L2 muxes, switches)
• engineering underlay (MPLS)
• IP (layer 3) router topology
• AS (service provider) graph
• end-to-end (layer 4) transport flows
• social interaction graph

© James P.G. Sterbenz ITTC
04 February 2016 KU EECS SCN – Science of Nets – Graph Spectra SCN-ST-5
Internet Topology Tomography
• No Internet map
– service provider secret
• Impedes research on
– physical structure
– traffic patterns
– application use
• Internet tomography – probe to infer structure
– logical maps only, e.g.
• IP address structure
• AS relationships [Britt wikipedia Image:Internet_map_1024.jpg]

© James P.G. Sterbenz ITTC
04 February 2016 KU EECS SCN – Science of Nets – Graph Spectra SCN-ST-6
Internet Topology Approximating Router Topology
• IP and routing tomography
– infer router interconnectivity of a particular service provider
– provides an approximate map of L3 connectivity
– does not provide L2 and physical topology
– does not provide peering information
• Rocketfuel ISP topology mapping engine
[http://www.cs.washington.edu/research/networking/rocketfuel]

© James P.G. Sterbenz ITTC
04 February 2016 KU EECS SCN – Science of Nets – Graph Spectra SCN-ST-7
Multilevel Network Topology Example: Sprint L3 IP PoP Topology
L3
L2.5
L1

© James P.G. Sterbenz ITTC
04 February 2016 KU EECS SCN – Science of Nets – Graph Spectra SCN-ST-8
Multilevel Network Topology Example: Sprint L3 overlay on L2.5
L3
L2.5
L1

© James P.G. Sterbenz ITTC
04 February 2016 KU EECS SCN – Science of Nets – Graph Spectra SCN-ST-9
Multilevel Network Topology Example: Sprint L2.5 MPLS PoP Topology
L3
L2.5
L1

© James P.G. Sterbenz ITTC
04 February 2016 KU EECS SCN – Science of Nets – Graph Spectra SCN-ST-10
Multilevel Network Topology Example: Sprint L2.5 overlay on L2/1
L3
L2.5
L1

© James P.G. Sterbenz ITTC
04 February 2016 KU EECS SCN – Science of Nets – Graph Spectra SCN-ST-11
Multilevel Network Topology Example: Sprint L1 Physical Fiber Topology
L3
L2.5
L1

© James P.G. Sterbenz ITTC
04 February 2016 KU EECS SCN – Science of Nets – Graph Spectra SCN-ST-12
Multilevel Network Topology Example: Sprint L1–3 Topology
L3
L2.5
L1

© James P.G. Sterbenz ITTC
04 February 2016 KU EECS SCN – Science of Nets – Graph Spectra SCN-ST-13
Multilevel Network Analysis Abstraction of Internet Topology
physical level topology
ISP 1 ISP 2
ISP 3 ISP 4
IXP 2
IXP 1
IXP 3
router level topology
AS level topology AS 1
AS 3
AS 2
AS 4
E2E topology
users and apps
© James P.G. Sterbenz ITTC
04 February 2016 KU EECS SCN – Science of Nets – Graph Spectra SCN-ST-14
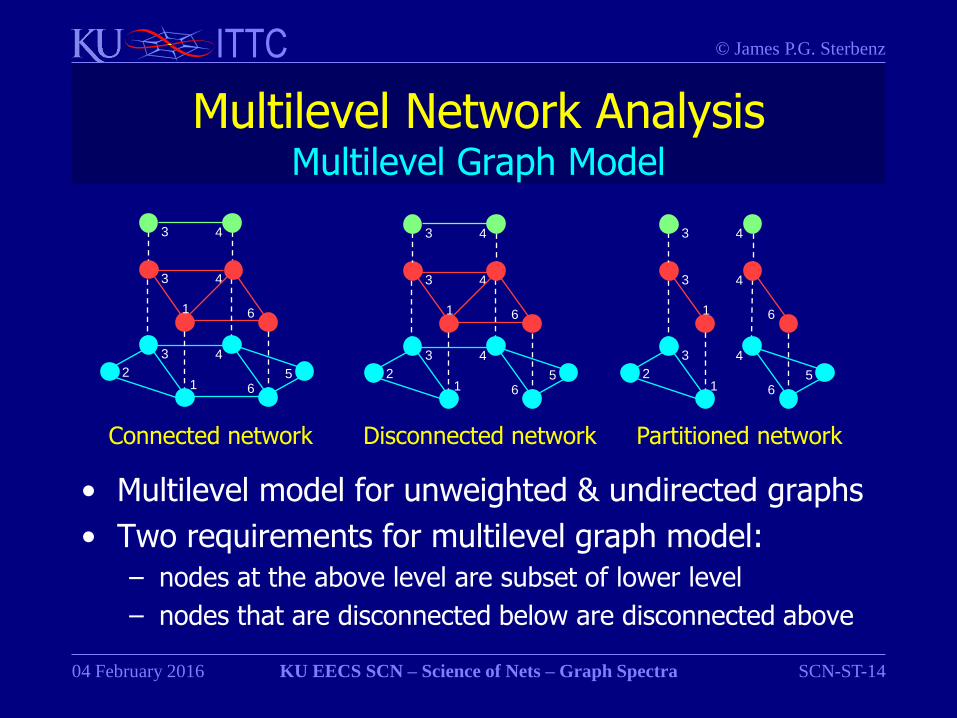
Multilevel Network Analysis Multilevel Graph Model
• Multilevel model for unweighted & undirected graphs
• Two requirements for multilevel graph model:
– nodes at the above level are subset of lower level
– nodes that are disconnected below are disconnected above
2 5 1
3
6
4
1
3
6
4
3 4
2 5 1
3
6
4
3
6
4
3 4
1
2 5 1
3
6
4
3
6
4
3 4
1
Connected network Disconnected network Partitioned network
© James P.G. Sterbenz ITTC
04 February 2016 KU EECS SCN – Science of Nets – Graph Spectra SCN-ST-15
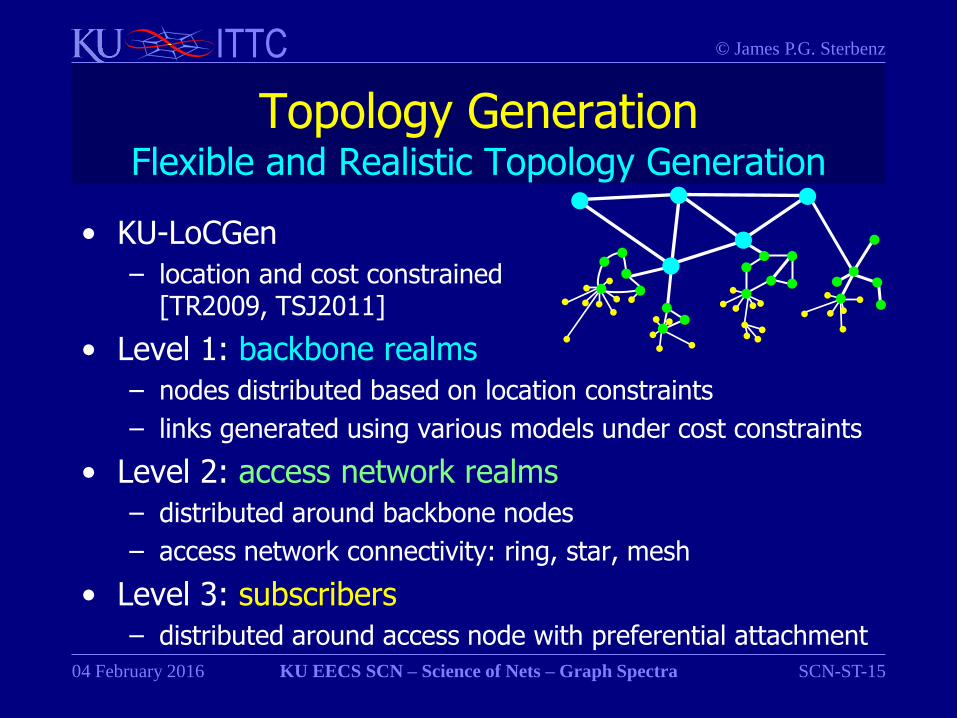
Topology Generation Flexible and Realistic Topology Generation
• KU-LoCGen
– location and cost constrained [TR2009, TSJ2011]
• Level 1: backbone realms
– nodes distributed based on location constraints
– links generated using various models under cost constraints
• Level 2: access network realms
– distributed around backbone nodes
– access network connectivity: ring, star, mesh
• Level 3: subscribers
– distributed around access node with preferential attachment

© James P.G. Sterbenz ITTC
04 February 2016 KU EECS SCN – Science of Nets – Graph Spectra SCN-ST-16
KU-LoCGen 2-level example using Sprint PoP Locations

© James P.G. Sterbenz ITTC
04 February 2016 KU EECS SCN – Science of Nets – Graph Spectra SCN-ST-17
KU-LoCGen REAL POPS Population Based Node Generation Example
actual US PoPs:
Sprint + AT&T + Level3 population-based [CCNet-GLOBECOM 2010]
© James P.G. Sterbenz ITTC
04 February 2016 KU EECS SCN – Science of Nets – Graph Spectra SCN-ST-18
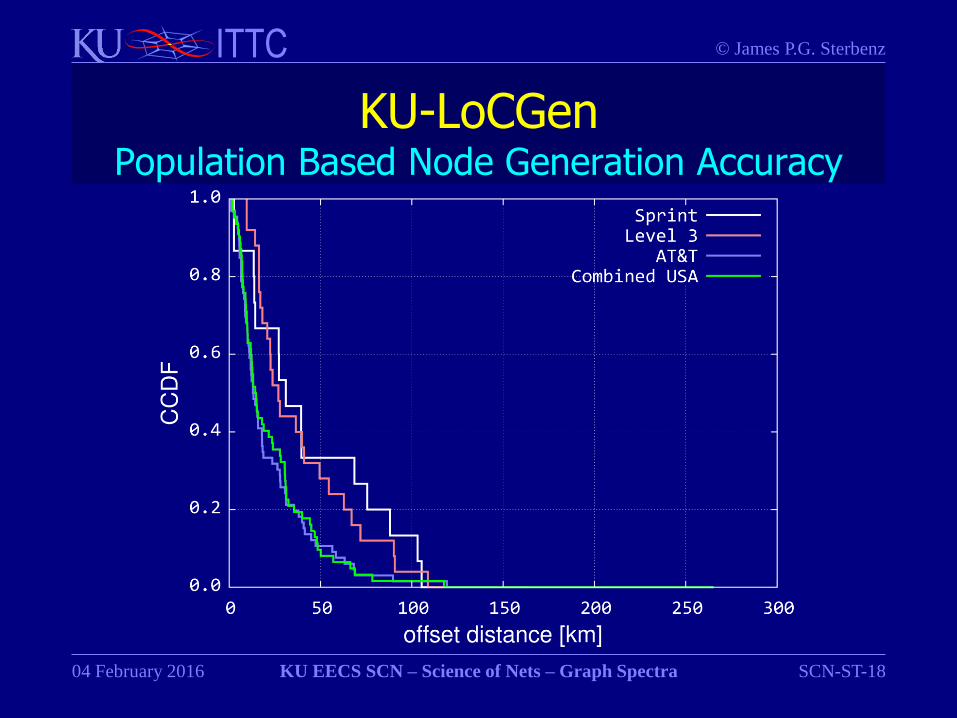
KU-LoCGen Population Based Node Generation Accuracy
© James P.G. Sterbenz ITTC
04 February 2016 KU EECS SCN – Science of Nets – Graph Spectra SCN-ST-19
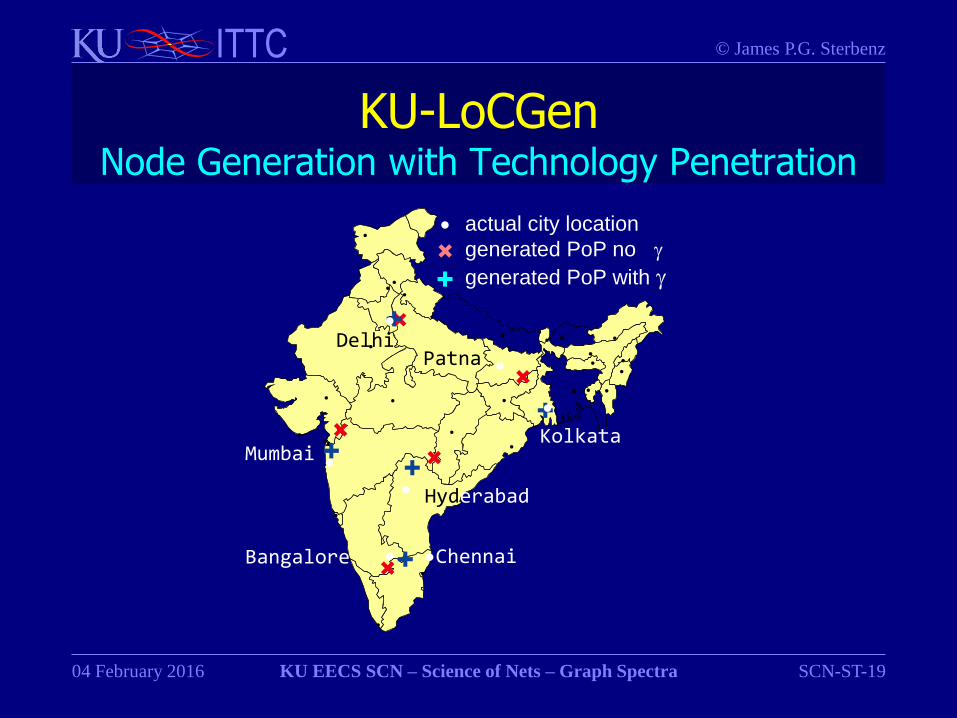
KU-LoCGen Node Generation with Technology Penetration
Delhi
Chennai
Hyderabad
Mumbai
Bangalore
Kolkata
Patna
actual city location
generated PoP no
generated PoP with

© James P.G. Sterbenz ITTC
04 February 2016 KU EECS SCN – Science of Nets – Graph Spectra SCN-ST-20
Internet Topology and Graph Spectra Internet Topology
ST.1 Multilevel graphs
ST.2 Internet topology
ST.3 Graph spectra

© James P.G. Sterbenz ITTC
04 February 2016 KU EECS SCN – Science of Nets – Graph Spectra SCN-ST-21
Internet Prehistory Early Packet Switching Research
• 1961-1973: Early packet-switching principles
– 1961: Kleinrock – queueing theory shows effectiveness of packet-switching
– 1964: Baran – packetised voice switching in military nets
– 1965: Davies proposes UK packet switched network
• coins term packet
– 1967: NPL begins construction of UK experimental network
– 1967: ARPANET conceived by US DOD ARPA
– 1972: CYCLADES project planning in France
– 1973: first CYCLADES packet switch demonstration

© James P.G. Sterbenz ITTC
04 February 2016 KU EECS SCN – Science of Nets – Graph Spectra SCN-ST-22
Internet Prehistory Early Packet Switching: NPL Topology
Plymouth
Brighton Southampton
Hull Leeds
Liverpool
Manchester
Norwich
London
Bristol Cardiff
Swansea
Birmingham
Dudley
Peterborough Leicester
Greenwich Teddington

© James P.G. Sterbenz ITTC
04 February 2016 KU EECS SCN – Science of Nets – Graph Spectra SCN-ST-23
Internet Prehistory Early Packet Switching: CYCLADES 1978
Grenoble
Nice Toulouse
Lyon
Paris Nancy
Rennes
St. Etienne
CIGALE
packet switch
[adapted from Pouzin-1982]

© James P.G. Sterbenz ITTC
04 February 2016 KU EECS SCN – Science of Nets – Graph Spectra SCN-ST-24
Internet History Early Packet Switching: ARPANET
• 1967-1972: ARPANET emergence
– 1967: ARPANET conceived by US DoD ARPA
– 1969:
• BBN awarded contract to build IMPs (interface msg processors)
• first ARPANET nodes operational at UCLA, SRI, UCSB, Utah
– 1972:
• ARPANET demonstrated publicly
• NCP (Network Control Protocol) first host-host protocol
• first e-mail program
• ARPANET has 15 nodes
– 1979: ARPANET has 200 nodes
• but access limited to research institutions with ARPA contracts

© James P.G. Sterbenz ITTC
04 February 2016 KU EECS SCN – Science of Nets – Graph Spectra SCN-ST-25
Internet History ARPANET Design Principles
• Minimalism, autonomy
– no internal changes required to interconnect networks
• Best effort service model
• Robust to failures (or attack)
– stateless gateways (routers)
– decentralized control
– most functionality in end systems
• note: very different from end-to-end arguments!

© James P.G. Sterbenz ITTC
04 February 2016 KU EECS SCN – Science of Nets – Graph Spectra SCN-ST-26
Internet History ARPANET 1969
SRI
UCLA
Utah
UCSB

© James P.G. Sterbenz ITTC
04 February 2016 KU EECS SCN – Science of Nets – Graph Spectra SCN-ST-27
Internet History ARPANET 1970
SRI
UCLA
Utah
UCSB
BBN
MIT
Harvard
SDC
Rand
LA
Boston

© James P.G. Sterbenz ITTC
04 February 2016 KU EECS SCN – Science of Nets – Graph Spectra SCN-ST-28
Internet History ARPANET 1971
SRI
UCLA
Utah
UCSB
BBN
MIT
Harvard
SDC
Rand
CMU UIUC
Case
Lincoln
Mitre Burroughs
Ames
Stanford
Boston
LA

© James P.G. Sterbenz ITTC
04 February 2016 KU EECS SCN – Science of Nets – Graph Spectra SCN-ST-29
Internet History ARPANET 1975
CMU UIUC
Burroughs
UCLA SDC
Rand
Utah
USC-ISI
USC
SCRL Hawaii (SATNET)
Ames
LBL Moffett
SRI
LLL SRI Xerox Tymshare
FNWC Sumex
ISI
UCSD
DOCB
AFWL
AFGWC
Argonne Purdue
RML Patrick
Elgin
Gunter
Mitre ARPA
SDAC
NSA
London
NORSAIR (SATNET)
NBS
ETAC
Aberdeen Belvoir SDAC
WPAFB
BBN
MIT-MAC
Lincoln
RADC
Rutgers Harvard NYU
RCC NCC
BBN IOX
CCA
MIT-IPC
Boston
LA
Si Valley
Washington
UCSB
Stanford

© James P.G. Sterbenz ITTC
04 February 2016 KU EECS SCN – Science of Nets – Graph Spectra SCN-ST-30
Internet History CSNET
• 1981–1996: CSNET (Comp. Sci. Research Network) – 1979: first link meeting at Wisc. [Landweber]
– 1981: initial funding from NSF
– network for researchers without ARPANET access • ARPANET restricted to certain DOD research contracts
– TCP/IP and other services from ARPANET over: • X.25 public networks (initially Telenet)
• Phonenet (MMDF over leased lines)
• ARPANET for institutions with ARPA contracts
– 1989: merged with CSNET into CREN • Corporation for Research and Educational Networking
[Denning, Hearn, Kern, ACM SIGCOMM 1983]

© James P.G. Sterbenz ITTC
04 February 2016 KU EECS SCN – Science of Nets – Graph Spectra SCN-ST-31
Internet History CSNET

© James P.G. Sterbenz ITTC
04 February 2016 KU EECS SCN – Science of Nets – Graph Spectra SCN-ST-32
EASYnet
Internet History Gatewayed Networks to ARPANET/CSNET
• Simplified logical structure – some nets use links of others (e.g. PSTN dialup/leased lines)
• Gateways interconnect – no seamless addressing – mixed formats through gateways (e.g. %-hack)
ARPANET
CSNET
BITNET
UUCPNET
GW
GW
Telenet
VNET
corporate
enterprise
networks
public
data
networks
GW
GW Internet
GW
GW
PSTN
© James P.G. Sterbenz ITTC
04 February 2016 KU EECS SCN – Science of Nets – Graph Spectra SCN-ST-33
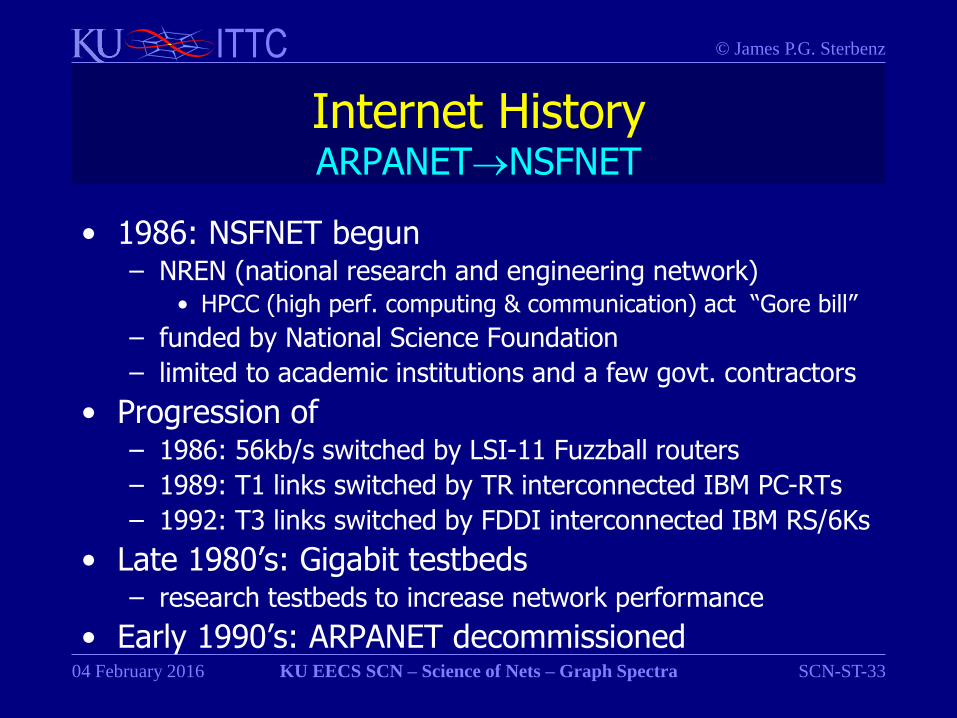
Internet History ARPANETNSFNET
• 1986: NSFNET begun – NREN (national research and engineering network)
• HPCC (high perf. computing & communication) act “Gore bill”
– funded by National Science Foundation
– limited to academic institutions and a few govt. contractors
• Progression of – 1986: 56kb/s switched by LSI-11 Fuzzball routers
– 1989: T1 links switched by TR interconnected IBM PC-RTs
– 1992: T3 links switched by FDDI interconnected IBM RS/6Ks
• Late 1980’s: Gigabit testbeds – research testbeds to increase network performance
• Early 1990’s: ARPANET decommissioned

© James P.G. Sterbenz ITTC
04 February 2016 KU EECS SCN – Science of Nets – Graph Spectra SCN-ST-34
Internet History Role of Al Gore
• Al Gore was critical in funding the Internet (NSFNET)
– he never claimed to have invented the Internet, rather:
“During my service in the United States Congress, I took the initiative in creating the Internet. I took the initiative in moving forward a whole range of initiatives that have proven to be important to our country's economic growth and environmental protection, improvements in our educational system.” – Al Gore, 9 March 1999 on CNN
– his role & statements have been defended by those who did
“Bob [Kahn] and I believe that the vice president deserves significant credit for his early recognition of the importance of what has become the Internet. … Gore was talking about and promoting the Internet long before most people were listening.” – Bob Kahn and Vint Cerf, 28 Sep. 2000

© James P.G. Sterbenz ITTC
04 February 2016 KU EECS SCN – Science of Nets – Graph Spectra SCN-ST-35
EASYnet
Internet History NSFNET Emerges
• Simplified logical structure – some nets use links of others (e.g. PSTN dialup/leased lines)
• Gateways interconnect – no seamless addressing – mixed formats through gateways (e.g. %-hack)
– UUNET becomes main UUCPNET–Internet gateway
ARPANET
CSNET
BITNET
UUCPNET
GW
GW
VNET
corporate
enterprise
networks
GW Internet
GW
GW
PSTN
MILNET
NSFNET
UUNET

© James P.G. Sterbenz ITTC
04 February 2016 KU EECS SCN – Science of Nets – Graph Spectra SCN-ST-36
Internet History 56 kb/s NSFNET Backbone
Princeton
Ithaca
Pittsburgh
Urbana- Champaign
Boulder
San Diego
Fuzzball Router
DEC LSI-11
56 kb/s leased PSTN lines
1986 – 1988
© James P.G. Sterbenz ITTC
04 February 2016 KU EECS SCN – Science of Nets – Graph Spectra SCN-ST-37
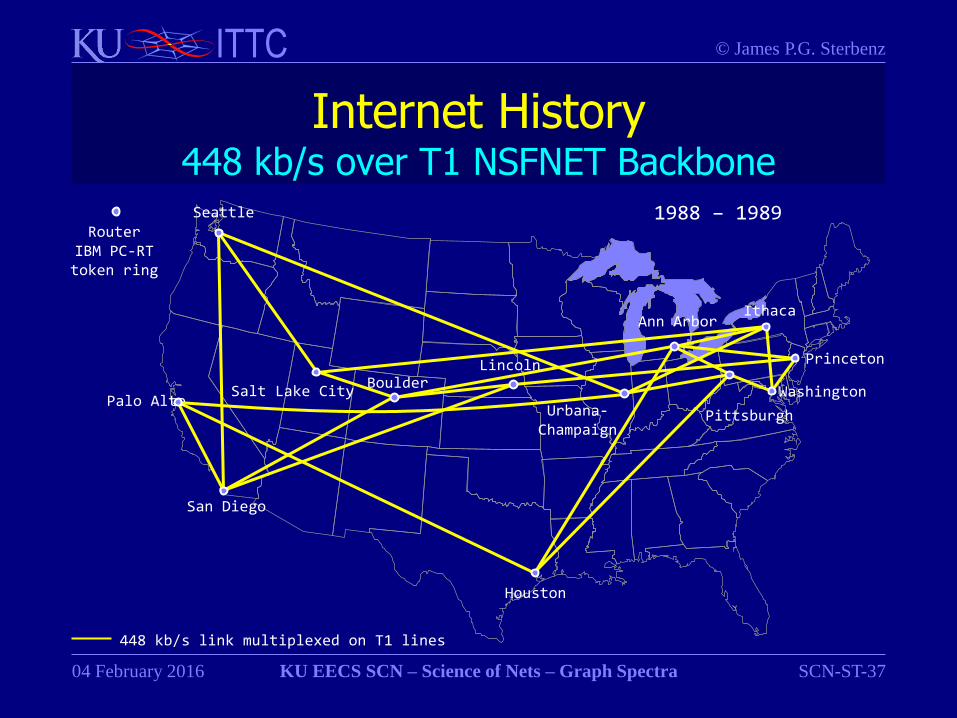
Internet History 448 kb/s over T1 NSFNET Backbone
Princeton
Ithaca
Pittsburgh Urbana- Champaign
Boulder
San Diego
Router IBM PC-RT token ring
448 kb/s link multiplexed on T1 lines
Seattle
Palo Alto
Houston
Salt Lake City
Lincoln
Ann Arbor
Washington
1988 – 1989

© James P.G. Sterbenz ITTC
04 February 2016 KU EECS SCN – Science of Nets – Graph Spectra SCN-ST-38
Internet History 1.5 Mb/s T1 NSFNET Backbone
Princeton
Ithaca
Pittsburgh
Urbana- Champaign
Boulder
San Diego
Router IBM PC-RT token ring
Seattle
Palo Alto
Houston
Salt Lake City Lincoln
Ann Arbor
Washington
1989 – 1990
15 Mb/s T1 lines

© James P.G. Sterbenz ITTC
04 February 2016 KU EECS SCN – Science of Nets – Graph Spectra SCN-ST-39
Internet History 1.5 Mb/s T1 NSFNET Backbone
Princeton
Ithaca
Pittsburgh
Urbana- Champaign
Boulder
San Diego
Router IBM PC-RT token ring
15 Mb/s T1 lines
Seattle
Palo Alto
Houston
Salt Lake City Lincoln
Ann Arbor
Washington
1990 – 1992
Atlanta
Boston

© James P.G. Sterbenz ITTC
04 February 2016 KU EECS SCN – Science of Nets – Graph Spectra SCN-ST-40
Internet History 45 Mb/s T3 NSFNET Backbone
Ithaca
Pittsburgh
Urbana- Champaign
Boulder
San Diego
core edge Router
IBM RS/6000 FDDI
45 Mb/s T3 core network links
Seattle
Palo Alto
Houston
Salt Lake City
Lincoln
Ann Arbor
45 Mb/s T3 edge network links
1992 – 1994
Atlanta
Boston
SF
LA
DEN Ames
STL
CHI
Argonne
CLE NYC HFD
GRO
WAS College Park FIX-east
Princeton
SEA
HOS

© James P.G. Sterbenz ITTC
04 February 2016 KU EECS SCN – Science of Nets – Graph Spectra SCN-ST-41
Internet History NSFNET Hierarchical Structure
• NSFNET Backbone – evolved from 56kb/s leased lines to 45Mb/s DS3
• Regional networks – MIDnet, NEARnet, NYSERnet, SURAnet, etc.
• Campus networks – KU, WashUStL, UMass, etc.
NSFNET backbone
NEARnet
KU
MIDnet
WUStL
UMass

© James P.G. Sterbenz ITTC
04 February 2016 KU EECS SCN – Science of Nets – Graph Spectra SCN-ST-42
Internet History NSFNET Hierarchical Structure
• Strict hierarchal structure
– advantages?

© James P.G. Sterbenz ITTC
04 February 2016 KU EECS SCN – Science of Nets – Graph Spectra SCN-ST-43
Internet History NSFNET Hierarchical Structure
• Strict hierarchal structure
– simple to understand, measure, and analyse
– traffic locality exploited
– each level engineered for
• local traffic characteristics
• transit traffic between lower levels

© James P.G. Sterbenz ITTC
04 February 2016 KU EECS SCN – Science of Nets – Graph Spectra SCN-ST-44
Internet History NSFNET Regional Network Examples
MIDnet: Midwest Network
NEARnet: New England
Academic and Research Network
MIDNET nodes
UIUC
WUStL
KU KSU
UNL
ISU UI
UArk
OU
OSU Tulsa
NSFNET access

© James P.G. Sterbenz ITTC
04 February 2016 KU EECS SCN – Science of Nets – Graph Spectra SCN-ST-45
EASYnet
Internet History NSFNET and MILNET become the US Internet
• Simplified logical structure – some nets use links of others (e.g. PSTN dialup/leased lines)
• Global Internet with NSFNET as backbone – seamless addressing using user@DNS and IP addresses – corporate networks convert to TCP/IP – MILNET is separate but interconnected US military backbone
MILNET
NSFNET
VNET corporate
enterprise
networks
Internet
PSTN

© James P.G. Sterbenz ITTC
04 February 2016 KU EECS SCN – Science of Nets – Graph Spectra SCN-ST-46
Internet History Privatisation
• 1991: NSF lifts access restrictions on NSFNET
– use of email and netnews explodes
• 1993: NSF solicitation for privatisation plans
• 1995: NSF awards for
– NAPs: network access point for ISP traffic exchange
– RA: routing arbiter
– vBNS: very high performance backbone network service
• 1995 April: NSFNET backbone decomissioned
• 1995 Sept.: NSF ends DNS registration subsidies
• 1998: NAPs and RA transferred to private sector

© James P.G. Sterbenz ITTC
04 February 2016 KU EECS SCN – Science of Nets – Graph Spectra SCN-ST-47
Internet History Research Networks
• Internet precursors were research networks
– privatisation constrained use by researchers
– drove need for research infrastructure
• separate from but attached to public Internet
• Research networks
– US: Internet2 and NLR
– Canada: CANARIE (Canadian Advanced Network and Research for Industry and Education)
– Europe: GÉANT
– UK: JANET
© James P.G. Sterbenz ITTC
04 February 2016 KU EECS SCN – Science of Nets – Graph Spectra SCN-ST-48
Research Networks Internet2 Overview
• 1996: Internet2 forms among 34 universities
– not an alternate or replacement for the Internet
• this is a common misconception by the public
– consortium of Universities and other research institutions
– operates network infrastructure with fee to access
• 1999: Abilene OC-48 links upgraded in 2004 to OC-192 links
• 2006: Internet2 network with 10×10Gb/s WDM links
© James P.G. Sterbenz ITTC
04 February 2016 KU EECS SCN – Science of Nets – Graph Spectra SCN-ST-49
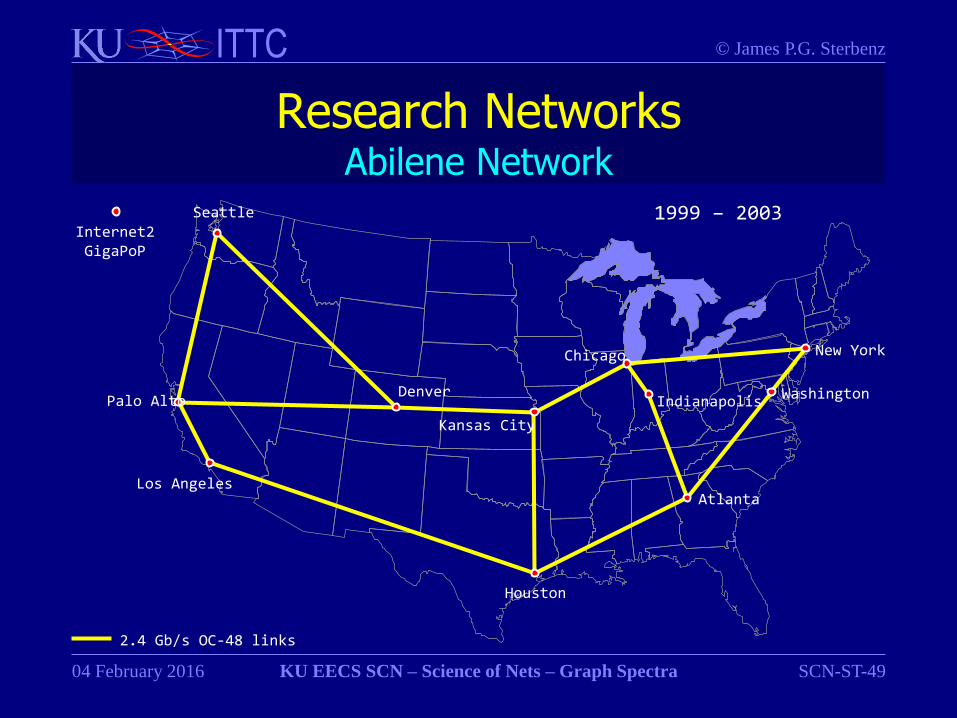
Research Networks Abilene Network
Seattle
Palo Alto
Houston
Atlanta
Washington
New York
2.4 Gb/s OC-48 links
Los Angeles
1999 – 2003 Internet2 GigaPoP
Kansas City
Denver Indianapolis
Chicago

© James P.G. Sterbenz ITTC
04 February 2016 KU EECS SCN – Science of Nets – Graph Spectra SCN-ST-50
Research Networks Abilene Network
Seattle
Palo Alto
Houston
Atlanta
Washington
New York
10 Gb/s OC-192 links
Los Angeles
2004 – 2006
Kansas City
Denver Indianapolis
Chicago

© James P.G. Sterbenz ITTC
04 February 2016 KU EECS SCN – Science of Nets – Graph Spectra SCN-ST-51
Research Networks Internet2 Network
Sunnyvale
Houston
Atlanta
Indianapolis Washington
New York
1010 Gb/s links
Los Angeles
2006 –
Portland
El Paso
Baton Rouge
Jacksonville
Charlotte
Philadelphia
Boston
Tulsa
Salt Lake
Seattle
Louisville
Nashville
Kansas City
Denver
Albuquerque
Chicago Cleveland
Pittsburgh

© James P.G. Sterbenz ITTC
04 February 2016 KU EECS SCN – Science of Nets – Graph Spectra SCN-ST-52
Research Networks Internet2 Network with L2
Sunnyvale
Houston
Atlanta
Indianapolis Washington
New York
Los Angeles
2006 –
Portland
El Paso
Baton Rouge
Jacksonville
Charlotte
Philadelphia
Boston
Tulsa
Salt Lake
Seattle
Louisville
Nashville
1010 Gb/s links
Kansas City
Denver
Albuquerque
Chicago Cleveland
Pittsburgh
© James P.G. Sterbenz ITTC
04 February 2016 KU EECS SCN – Science of Nets – Graph Spectra SCN-ST-53
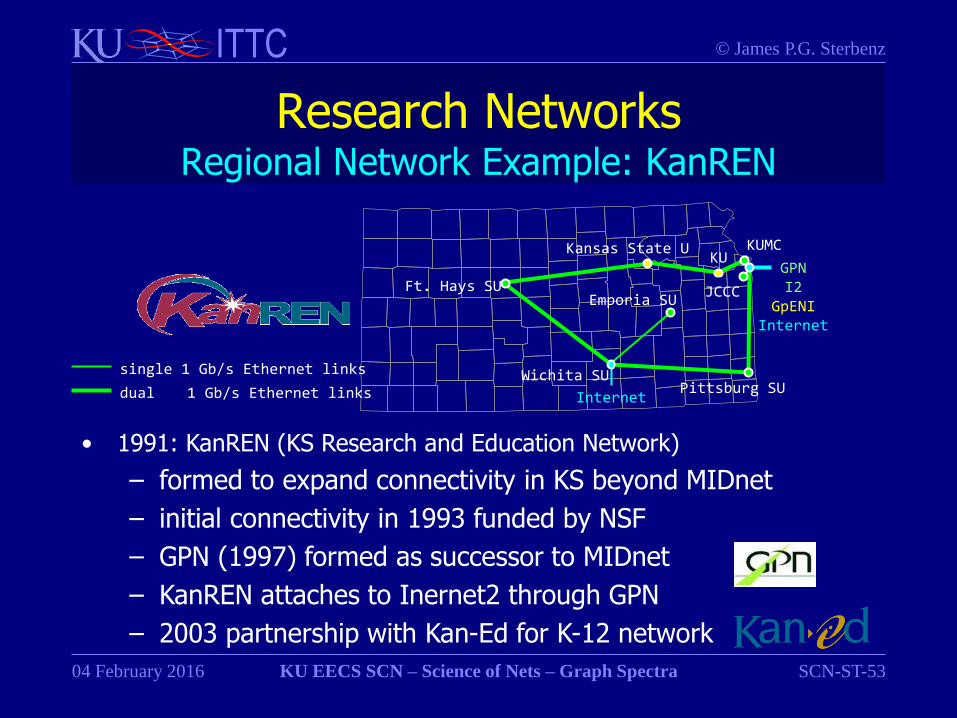
Research Networks Regional Network Example: KanREN
• 1991: KanREN (KS Research and Education Network)
– formed to expand connectivity in KS beyond MIDnet
– initial connectivity in 1993 funded by NSF
– GPN (1997) formed as successor to MIDnet
– KanREN attaches to Inernet2 through GPN
– 2003 partnership with Kan-Ed for K-12 network
KU Kansas State U
Ft. Hays SU
Wichita SU Pittsburg SU
Emporia SU
KUMC
JCCC
Internet
GPN I2
GpENI Internet
dual 1 Gb/s Ethernet links
single 1 Gb/s Ethernet links

© James P.G. Sterbenz ITTC
04 February 2016 KU EECS SCN – Science of Nets – Graph Spectra SCN-ST-54
Internet Architecture Current Structure: Tier 1
• Loose hierarchy but with many interconnections
– no longer a map of the Internet; ISP internals proprietary
• Tier-1 backbone providers
– largest with national or international high-speed backbones
– interconnect with one-another at IXPs
• Internet exchange points formerly NAP (network access points)
• peering without charging one-another for traffic
– by bilateral agreement, e.g. Sprint, AT&T
• or sometimes not: Level3–Cogent peering war in 2005
– do not purchase transit service from anyone else

© James P.G. Sterbenz ITTC
04 February 2016 KU EECS SCN – Science of Nets – Graph Spectra SCN-ST-55
Internet Architecture Current Structure: Tier-1 Providers
• Tier 1 backbone providers [Wikipedia Feb 2016] – at&t AS7018 2403
– Centurylink (Qwest + SAVVIS) AS0209 1580
– Cogent AS0174 4212
– Deutsche Telekom AS3320 557
– Global Telecom (Tinet/Tiscali Italy) AS3257 1432
– Level 3 with Global Crossing (GX) AS1/3356/3549 4260
– NTT Communications (formerly Verio) AS2914 1279
– Orange AS5551 143
– Sprint ? AS1239
– Tata (India) AS6543 653
– Telecom Italia AS6762 489
– Telefonica (Spain) AS12956 174
– TeliaSonera (Sweden – Finland) AS1299 1139
– Verizon Business (formerly UUNET) AS0701/702/703 1373
– XO AS2828 1159
– Zayo (formerly AboveNet) AS6461 1489

© James P.G. Sterbenz ITTC
04 February 2016 KU EECS SCN – Science of Nets – Graph Spectra SCN-ST-56
Internet Architecture Current Structure Tiers 2 and 3
• Loose hierarchy but with many interconnections
– no longer a map of the Internet; ISP internals proprietary
• Tier-1 backbone providers
• Tier-2 ISPs
– purchases some transit traffic from tier-1 providers
– peer directly with some networks (tier-1 and tier-2)
– e.g. BT (AS5400) purchases from GX and Sprint
• Tier-3 local ISPs buys all transit service
– purchases all transit traffic (from tier-2 and perhaps tier-1)
– provide local Internet access
– e.g. Sunflower from Sprint & Level3 [cidr-report.org]

© James P.G. Sterbenz ITTC
04 February 2016 KU EECS SCN – Science of Nets – Graph Spectra SCN-ST-57
Internet Architecture Current Structure
tier-1 providers
NAP NAP
tier-2
providers
local ISPs
access lines
peering points

© James P.G. Sterbenz ITTC
04 February 2016 KU EECS SCN – Science of Nets – Graph Spectra SCN-ST-58
Internet Topology and Graph Spectra Graph Spectra
ST.1 Multilevel graphs
ST.2 Internet topology
ST.3 Graph spectra

© James P.G. Sterbenz ITTC
04 February 2016 KU EECS SCN – Science of Nets – Graph Spectra SCN-ST-59
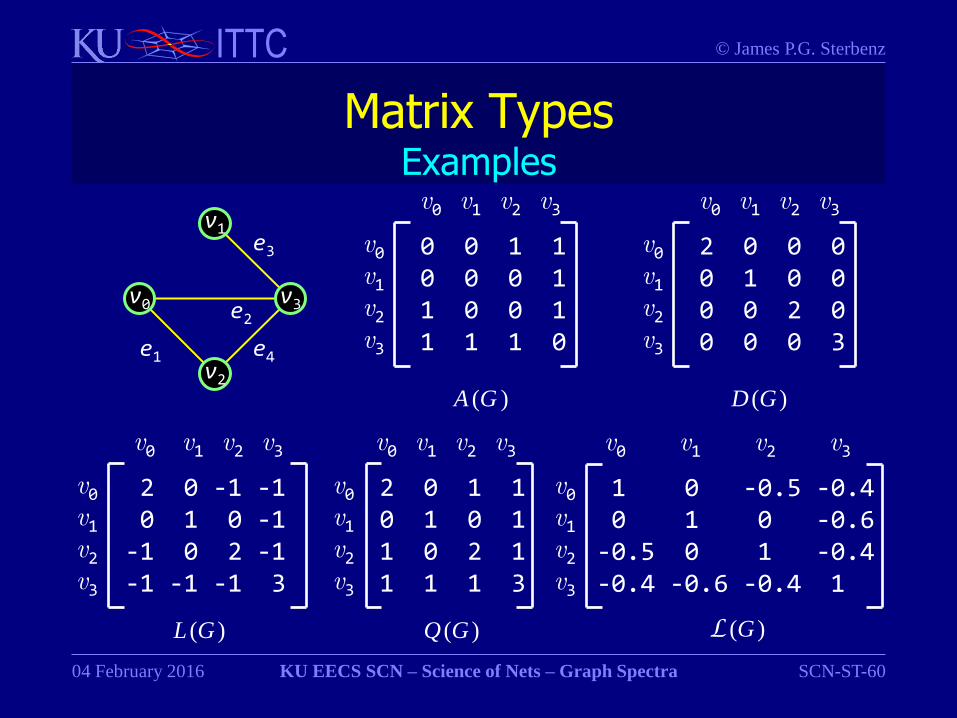
Representation of Graphs Matrix Types
• Adjacency matrix A (G )
– if nodes i and j are connected, aij=1 ; else 0
• Laplacian matrix – L (G ) = D (G ) − A (G )
– D (G ) is diagonal matrix of node degrees
– L+ (G ) = Q (G ) is signless Laplacian
• Normalised Laplacian matrix 1 , if i = j and di≠ 0
L (G ) = –1 / √didj , if vi and vj are adjacent
0 , otherwise
– allow us to compare structure of graphs of different sizes
© James P.G. Sterbenz ITTC
04 February 2016 KU EECS SCN – Science of Nets – Graph Spectra SCN-ST-60
Matrix Types Examples
v0
v1
v2
v3
e1
e2
e4
e3
1 0 -0.5 -0.4 0 1 0 -0.6 -0.5 0 1 -0.4 -0.4 -0.6 -0.4 1
v0 v1 v2 v3
v0 v1 v2 v3
0 0 1 1 0 0 0 1 1 0 0 1 1 1 1 0
v0 v1 v2 v3
v0 v1 v2 v3
2 0 0 0 0 1 0 0 0 0 2 0 0 0 0 3
v0 v1 v2 v3
v0 v1 v2 v3
2 0 -1 -1 0 1 0 -1 -1 0 2 -1 -1 -1 -1 3
v0 v1 v2 v3
v0 v1 v2 v3
A (G ) D (G )
L (G ) L (G )
2 0 1 1 0 1 0 1 1 0 2 1 1 1 1 3
v0 v1 v2 v3
v0 v1 v2 v3
Q (G )

© James P.G. Sterbenz ITTC
04 February 2016 KU EECS SCN – Science of Nets – Graph Spectra SCN-ST-61
Graph Spectra Eigenvalues and Eigenvectors
• Given a matrix M , eigenvalues , and eigenvectors x
• Eigenvalues and eigenvectors satisfy,
– M x = x
• Eigenvalues are roots of characteristic polynomial
– det ( M− I ) for x ≠ 0
• Spectrum of M is its eigenvalues and multiplicities
– multiplicity is the number of occurrences of an eigenvalue
© James P.G. Sterbenz ITTC
04 February 2016 KU EECS SCN – Science of Nets – Graph Spectra SCN-ST-62
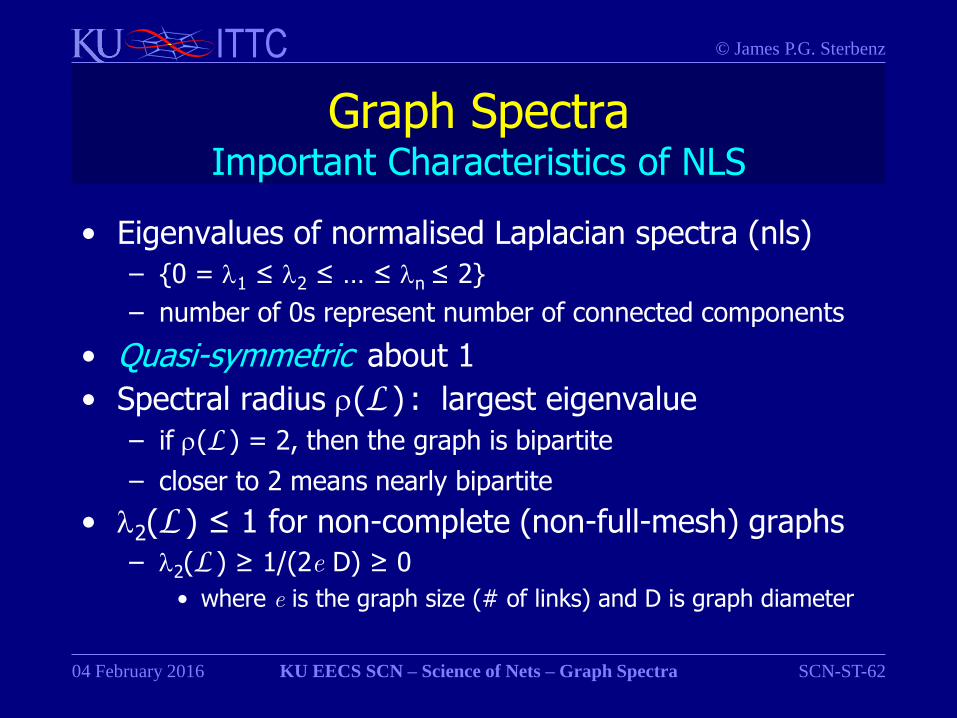
Graph Spectra Important Characteristics of NLS
• Eigenvalues of normalised Laplacian spectra (nls)
– {0 = 1 ≤ 2 ≤ … ≤ n ≤ 2}
– number of 0s represent number of connected components
• Quasi-symmetric about 1
• Spectral radius (L ) : largest eigenvalue
– if (L ) = 2, then the graph is bipartite
– closer to 2 means nearly bipartite
• 2(L ) ≤ 1 for non-complete (non-full-mesh) graphs
– 2(L ) ≥ 1/(2e D) ≥ 0
• where e is the graph size (# of links) and D is graph diameter

© James P.G. Sterbenz ITTC
04 February 2016 KU EECS SCN – Science of Nets – Graph Spectra SCN-ST-63
Topological Dataset US Interstate Highways
• Added 5 highways, 6 interchange nodes, 2 pendants [AASHTO]
© James P.G. Sterbenz ITTC
04 February 2016 KU EECS SCN – Science of Nets – Graph Spectra SCN-ST-64
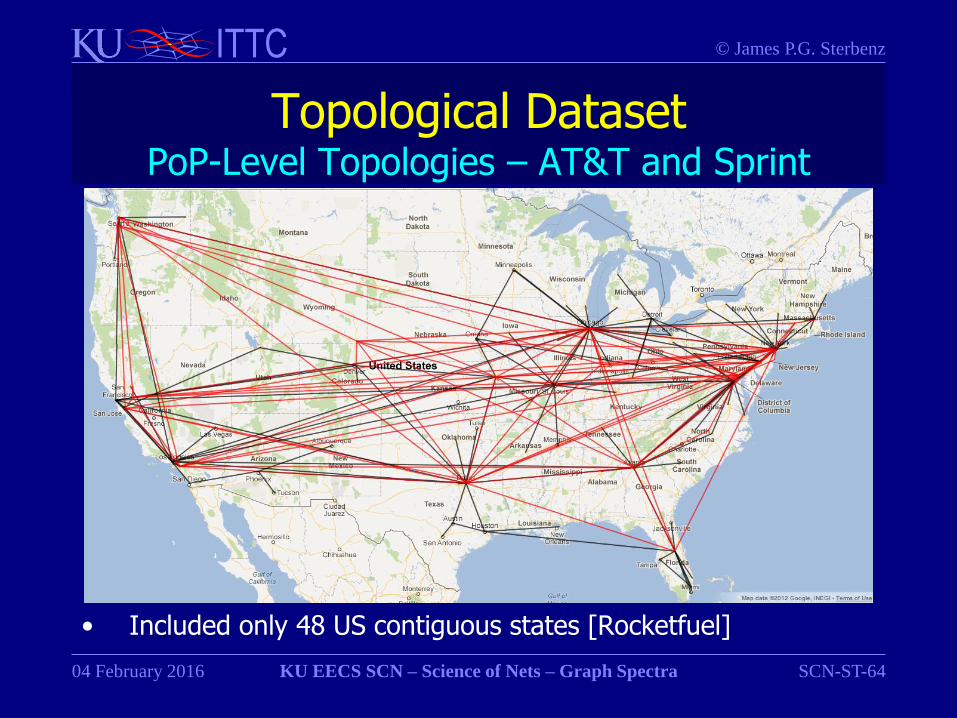
Topological Dataset PoP-Level Topologies – AT&T and Sprint
• Included only 48 US contiguous states [Rocketfuel]

© James P.G. Sterbenz ITTC
04 February 2016 KU EECS SCN – Science of Nets – Graph Spectra SCN-ST-65
Topological Dataset Fibre-Optic Routes – AT&T and Sprint
• Included only 48 US contiguous states [KMI]

© James P.G. Sterbenz ITTC
04 February 2016 KU EECS SCN – Science of Nets – Graph Spectra SCN-ST-66
Topology Analysis of Graphs Metrics
• Baseline networks Lecture SCN-RN – star, linear, tree, ring, grid, toroid, mesh
– order (number of nodes) of the baseline graphs: 10 and 100
• Average degree is same for star, linear, tree
– do these graphs share same structural properties?
• Clustering coefficient is too coarse for baseline graphs
– except for mesh which the value is 1, rest is 0
• Algebraic connectivity a (G ):
– second smallest eigenvalue of the Laplacian matrix
– a (G ) = 0.1 for n=10 (linear) and n=100 (grid)
– not very useful for comparing different order graphs

© James P.G. Sterbenz ITTC
04 February 2016 KU EECS SCN – Science of Nets – Graph Spectra SCN-ST-67
Topological Analysis via Metrics Baseline Networks with n=10
Topology Star Linear Tree Ring Grid Toroid Mesh
Number of nodes 10 10 10 10 10 10 10
Number of links 9 9 9 10 13 15 45
Maximum degree 9 2 3 2 3 3 9
Average degree 1.8 1.8 1.8 2 2.6 3 9
Degree assortativity -1 -0.13 -0.53 1 0.28 1 1
Node closeness 0.58 0.29 0.37 0.36 0.44 0.53 1
Clustering coefficient 0 0 0 0 0 0 1
Algebraic connectivity 1 0.1 0.18 0.38 0.38 1.38 10
Network diameter 2 9 5 5 5 3 1
Network radius 1 5 3 5 3 3 1
Average hop count 1.8 3.67 2.82 2.78 2.3 1.89 1
Node betweenness 36 20 26 8 11 4 0
Link betweenness 9 25 24 13 12 6 1

© James P.G. Sterbenz ITTC
04 February 2016 KU EECS SCN – Science of Nets – Graph Spectra SCN-ST-68
Topological Analysis via Metrics Baseline Networks with n=100
Topology Star Linear Tree Ring Grid Toroid Mesh
Number of nodes 100 100 100 100 100 100 100
Number of links 99 99 99 100 180 200 4950
Maximum degree 99 2 3 2 4 4 99
Average degree 1.98 1.98 1.98 2 3.6 4 99
Degree assortativity -1 -0.01 -0.34 1 0.57 1 1
Node closeness 0.51 0.03 0.13 0.04 0.15 0.20 1
Clustering coefficient 0 0 0 0 0 0 1
Algebraic connectivity 1 0.001 0.01 0.004 0.1 0.38 100
Network diameter 2 99 12 50 18 10 1
Network radius 1 50 6 50 10 10 1
Average hop count 1.98 33.7 7.8 25.3 6.67 5.05 1
Node betweenness 4851 2450 3068 1201 616 200 0
Link betweenness 99 2500 2496 1250 341 200 1
© James P.G. Sterbenz ITTC
04 February 2016 KU EECS SCN – Science of Nets – Graph Spectra SCN-ST-69
Topology Analysis of Graphs Spectra
• Normalised Laplacian spectrum – since normalised, eigenvalues range [0,2]
• Calculate: – RF: relative frequency [BJ2009]
– RCF: relative cumulative frequency [VHE2002]
• Eigenvalue of 2 indicates how bipartite a graph is
• Eigenvalue 1 multiplicity indicates node duplications – nodes having similar neighbours
• Spectrum is symmetric around 1
© James P.G. Sterbenz ITTC
04 February 2016 KU EECS SCN – Science of Nets – Graph Spectra SCN-ST-70
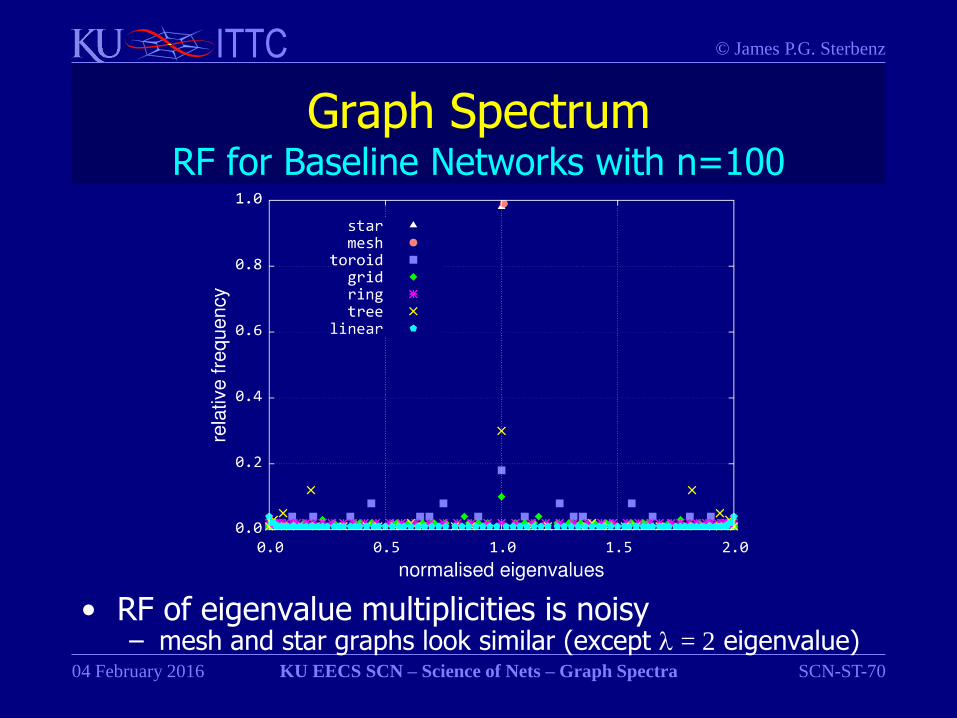
Graph Spectrum RF for Baseline Networks with n=100
• RF of eigenvalue multiplicities is noisy – mesh and star graphs look similar (except = 2 eigenvalue)

© James P.G. Sterbenz ITTC
04 February 2016 KU EECS SCN – Science of Nets – Graph Spectra SCN-ST-71
Graph Spectrum RCF for Baseline Networks with n=100

© James P.G. Sterbenz ITTC
04 February 2016 KU EECS SCN – Science of Nets – Graph Spectra SCN-ST-72
Topology Analysis of Real Networks Metrics and Spectra
• Communication and transportation networks
• Metrics indicate:
– physical topologies are closer to transportation network
– difference between physical and logical topologies
• higher number of nodes in physical topologies
• rich connectivity in logical topologies

© James P.G. Sterbenz ITTC
04 February 2016 KU EECS SCN – Science of Nets – Graph Spectra SCN-ST-73
Topological Analysis via Metrics Real Networks
Topology Sprint Physical
Sprint Logical
AT&T Physical
AT&T Logical
US Highways
Number of nodes 263 28 361 107 400
Number of links 311 76 466 140 540
Maximum degree 6 14 7 23 7
Average degree 2.37 5.43 2.58 2.62 2.7
Degree assortativity -0.17 -0.23 -0.16 -0.4 0.11
Node closeness 0.07 0.48 0.08 0.3 0.08
Clustering coefficient 0.03 0.41 0.05 0.09 0.05
Algebraic connectivity 0.0053 0.6844 0.0061 0.1324 0.0059
Network diameter 37 4 37 6 40
Network radius 19 2 19 3 21
Average hop count 14.78 2.19 13.57 3.38 13.34
Node betweenness 11159 100 15970 2168 22798
Link betweenness 9501 27 14270 661 18585

© James P.G. Sterbenz ITTC
04 February 2016 KU EECS SCN – Science of Nets – Graph Spectra SCN-ST-74
Graph Spectrum RCF for Real Networks
• Spectrum of physical topologies resemble motorways

© James P.G. Sterbenz ITTC
04 February 2016 KU EECS SCN – Science of Nets – Graph Spectra SCN-ST-75
Network Topology Fiber Relation to Other Infrastructure
L1
Class 1 rail mainlines
Interstate freeways

© James P.G. Sterbenz ITTC
04 February 2016 KU EECS SCN – Science of Nets – Graph Spectra SCN-ST-76
Spectral Properties of Real Networks cTGD vs. Algebraic Conn. & Spectral Radius Topology cTGD cTGD
Rank a(G) a(G)
Rank (L) (L)
Rank
Level 3 0.4494 1 0.9518 3 1.5033 2
AboveNet 0.4386 2 0.9645 2 1.4978 1
Exodus 0.3617 3 1.0083 1 1.7408 4
EBONE 0.3113 4 0.6477 4 1.7335 3
Tiscali 0.2641 5 0.5255 5 1.7470 5
Sprint 0.2407 6 0.3817 6 1.7853 6
Verio 0.2009 7 0.2448 8 1.8463 7
VSNL 0.1783 8 0.3402 7 1.9053 9
GEANT2 phys. 0.1668 9 0.1515 9 1.8518 8
AT&T 0.1446 10 0.1324 10 1.9127 10
Telstra 0.0941 11 0.0454 11 1.9797 11
AT&T phys. 0.0348 12 0.0061 12 1.9892 13
Sprint phys. 0.0307 13 0.0053 13 1.9839 12

© James P.G. Sterbenz ITTC
04 February 2016 KU EECS SCN – Science of Nets – Graph Spectra SCN-ST-77
Graph Spectrum RCF for Communication Networks
• Spectrum of physical topologies resemble motorways – Level 3 is richly connected and have small spectral radius

© James P.G. Sterbenz ITTC
04 February 2016 KU EECS SCN – Science of Nets – Graph Spectra SCN-ST-78
Analysis of Internet Infrastructure Summary
• Physical topologies resemble motorways
– known: but not rigorously studied
– grid-like structures
• The normalised Laplacian spectrum is powerful
– spectral radius indicates bipartiteness
– = 1 multiplicity indicates duplicates (i.e. star-like structures)
• Future work:
– study other physical critical infrastructures
• railways, power grid, pipelines
– investigate metrics and relationship to resiliency/connectivity

© James P.G. Sterbenz ITTC
04 February 2016 KU EECS SCN – Science of Nets – Graph Spectra SCN-ST-79
Analysis of Internet Infrastructure Review of Graph Spectra
• All but structural graphs have same nodes

© James P.G. Sterbenz ITTC
04 February 2016 KU EECS SCN – Science of Nets – Graph Spectra SCN-ST-80
Graph Theory References and Further Reading
• [CARS2012] Egemen K. Çetinkaya, Mohammed J.F. Alenazi, Justin P. Rohrer, and James P.G. Sterbenz, “Topology Connectivity Analysis of Internet Infrastructure Using Graph Spectra”, in Proc. of the IEEE/IFIP RNDM , St. Petersburg, October 2012
• [AASHTO] American Association of State Highway and Transportation Officials, “Guidelines for the Selection of Supplemental Guide Signs for Traffic Generators Adjacent to Freeways”, Washington, D.C., 2001
• [KMI] KMI Corporation, “North American Fiberoptic Long-haul Routes Planned and in Place”, 1999
• [KU-TopView] https://www.ittc.ku.edu/resilinets/maps
• [Rocketfuel] http://www.cs.washington.edu/research/networking/rocketfuel
© James P.G. Sterbenz ITTC
04 February 2016 KU EECS SCN – Science of Nets – Graph Spectra SCN-ST-81
Graph Spectra References and Further Reading
• [C1994] Fan R. K. Chung, Spectral Graph Theory , American Mathematical Society, 1994
• [M2011] Piet van Mieghem, Graph Spectra for Complex Networks , Cambridge University Press, 2011
• [BH2012] Andries E. Brouwer and Willem H. Haemers, Spectra of Graphs , Springer, 2012
• [CRS2010] Dragoš Cvetković, Peter Rowlinson, and Slobodan Simić, An Introduction to the Theory of Graph Spectra , London Mathematical Society, 2010
• [B1993] Norman Biggs, Algebraic Graph Theory , Cambridge University Press, 1993
© James P.G. Sterbenz ITTC
04 February 2016 KU EECS SCN – Science of Nets – Graph Spectra SCN-ST-82
Graph Spectra References and Further Reading
• [GN2006] M. T. Gastner and M. E. Newman, “The spatial structure of networks”,The European Physical Journal B , vol. 49, no. 2, January 2006, pp. 247 – 252
• [JWM2006] Almerima Jamaković, Huijuan Wang, and Piet van Mieghem, “Topological Characteristics of the Dutch Road Infrastructure”, in Infrastructure Reliability Seminar , Delft, June 2006

© James P.G. Sterbenz ITTC
04 February 2016 KU EECS SCN – Science of Nets – Graph Spectra SCN-ST-83
Graph Spectra References and Further Reading
• [CS2011] Dragoš Cvetković and Slobodan Simić, “Graph spectra in Computer Science”, Linear Algebra and its Applications , vol. 434, no. 6, March 2011, pp. 1545 – 1562
• [VHE2002] Danica Vukadinović, Polly Huang, and Thomas Erlebach, “On the Spectrum and Structure of Internet Topology Graphs”, in Proc. of the IICS , June 2002, pp. 83 – 95
• [BJ2009] Anirban Banerjee and Jürgen Jost, “Spectral Characterization of Network Structures and Dynamics”, Dynamics On and Of Complex Networks , 2009, pp. 117 – 132

© James P.G. Sterbenz ITTC
04 February 2016 KU EECS SCN – Science of Nets – Graph Spectra SCN-ST-84
End of Foils


