1
I T C L I M I T E D
Presen tation forCII - National Award for Excellence in Water Manage ment 2008
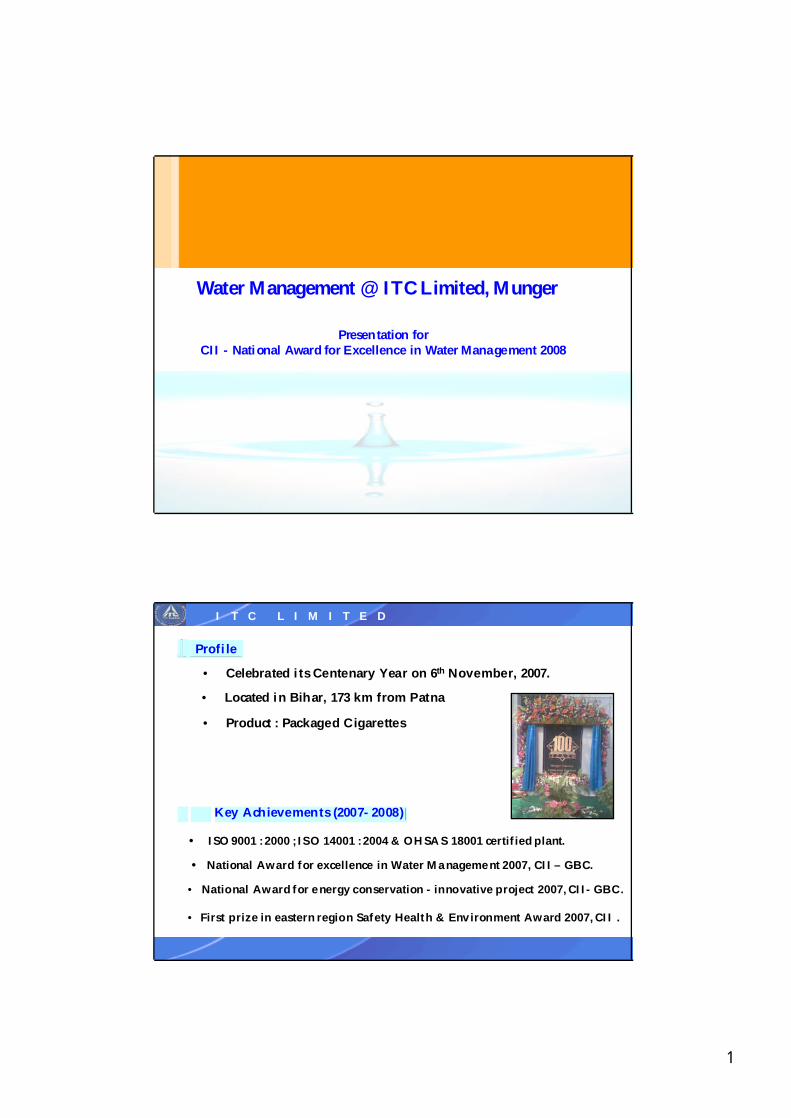
Water Management @ ITC Limited, Munger
I T C L I M I T E D
Profile
• Celebrated its Centenary Year on 6th November, 2007.
• Located in Bihar, 173 km from Patna
Key Achievements (2007- 2008)
• ISO 9001 : 2000 ; ISO 14001 : 2004 & OHSAS 18001 certified plant.
• National Award for excellence in Water Ma nageme nt 2007, CII – GBC.
• National Award for e nergy conservation - innovative project 2007, CII- GBC.
• Product : Packaged Cigarettes
• First prize in eastern region Safety Health & Environment Award 2007, CII .

2
I T C L I M I T E D
ITC’s Sustainabil ity Report
I T C L I M I T E D
Water Management Approach
• Establish Overall Water Bal ance
• Reduce at source
• Reuse in other beneficial applications after treatment (land scaping,
toile t flushing, cooling tower applications and civil constructi ons etc.,)
• Recycle back to process appl ications after appropriate treatment

3
I T C L I M I T E D
Water Consumptio n Trend
Please Note: Please Note: Water consumption increased by 8.7 % as production increased by 15.0 % compared to last year however the specific water consumption is reduced by 6 %.
400
450
500
550
600
650
700
750
800
KLD
Year
Water Consumption
Ser ies1 775 712 682 526 463 467 5 08
0 1- 02 02- 03 0 3-04 04- 05 05- 06 06- 07 07 -08
I T C L I M I T E D
Specif ic Consumptio n
Please Note: Speci fic Water Consumption has reduced by 6 %
Specific Water Consumption
11.5210.11
8.80
5.89 5.33 5.02
0.00
2.00
4.00
6.00
8.00
10.00
12.00
14.00
02- 03 03-04 04-05 05-06 06-07 07-08
Index kl/mnc
4
I T C L I M I T E D
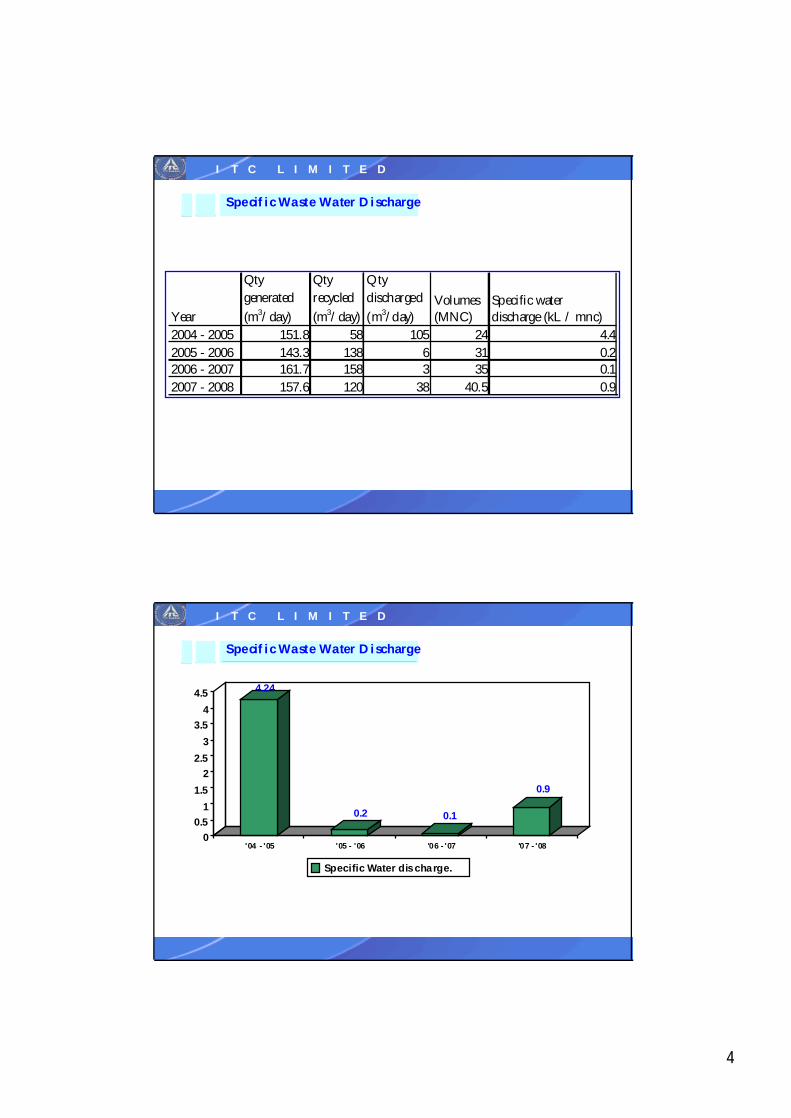
Specif ic Waste Water Discharge
Year
Qty generated (m3/day)
Qty recycled (m3/day)
Qty discharged (m3/day)
Volumes (MNC)
Specific water discharge (kL / mnc)
2004 - 2005 151.8 58 105 24 4.42005 - 2006 143.3 138 6 31 0.22006 - 2007 161.7 158 3 35 0.12007 - 2008 157.6 120 38 40.5 0.9
I T C L I M I T E D
Specif ic Waste Water Discharge
4.24
0.2 0.1
0.9
00.5
11.5
22.5
33.5
44.5
'04 - '05 '05 - '06 '06 - '07 '07 - '08
Specific Water discharge.
5
I T C L I M I T E D
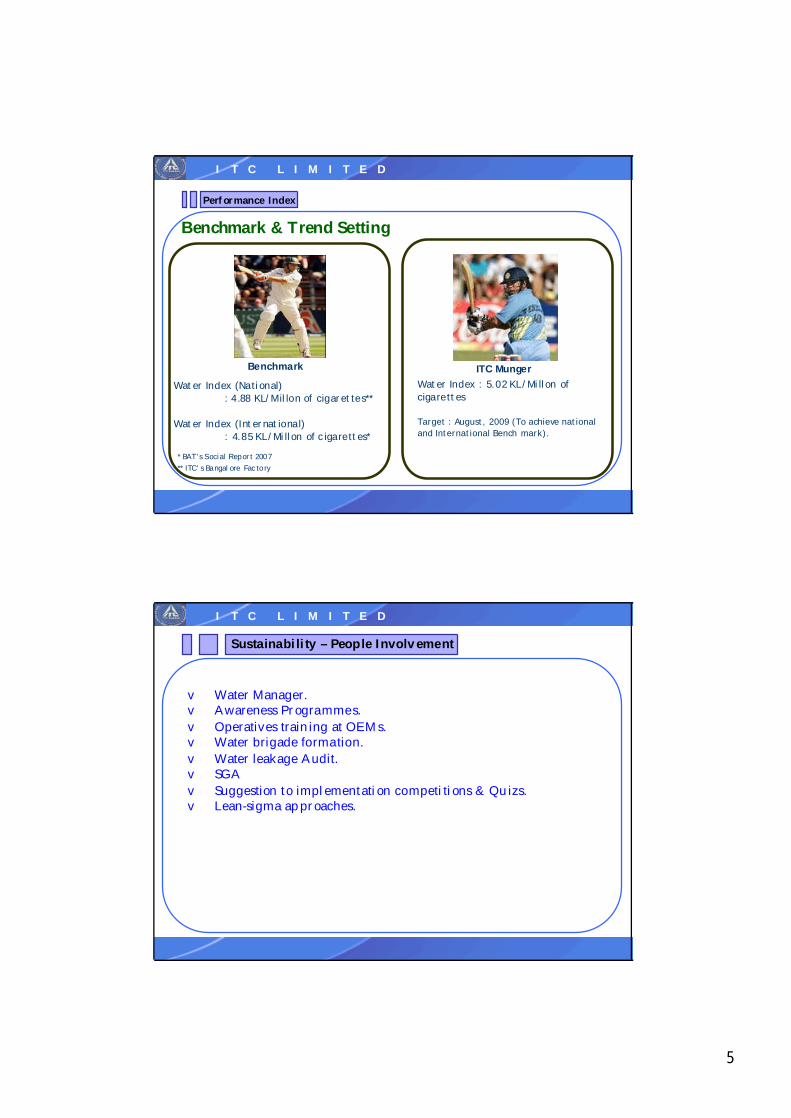
Water Index : 5.02 KL/Millon of cigarettes
Target : August, 2009 (To achieve national and International Bench mark).
Performance Index
Benchmark & Trend Setting
Benchmark ITC Munger
Water Index (National): 4 .88 KL/M illon of cigarettes**
Water Index (International): 4.85 KL/Millon of c igarettes*
* BAT’s S ocial Report 2007** ITC’ s Bangal ore Fac tory
I T C L I M I T E D
Sustainability – People Involv ement
v Water Manager.v Awareness Programmes.v Operatives training at OEMs.v Water brigade formation.v Water leakage Audit.v SGAv Suggestion to implementation competi tions & Quizs.v Lean-sigma approaches.

6
I T C L I M I T E D
Sustainability – People Involv ement
v Water Manager.v Awareness Programmes.v Operatives training at OEMs.v Water brigade formation.v Water leakage Audit.v SGAv Suggestion to implementation competi tions & Quizs.v Lean-sigma approaches.
I T C L I M I T E D
Sustainability – People Involv ement
v Water Manager.v Awareness Programmes.v Operatives training at OEMs.v Water brigade formation.v Water leakage Audit.v SGAv Suggestion to implementation competi tions & Quizs.v Lean-sigma approaches.

7
I T C L I M I T E D
Sustainabili ty – Review & Moni torin g
Daily ü Water Analysis Report ü Effluent Report
Monthly
ü Management Review (BM)ü Report to Chief Engineer.
Yearlyü Annual Water & EHS Reportü Director’s Reportü Unit Achievement Report
Beyond Equipm ent Performance….
ü Performance appraisal of M anagers
I T C L I M I T E D
Water Conserv ation Projects
160 m3/dayTotal
65 m3/dayRO reject for gardening & Toi let flashing s
50 m3/dayRO product for CT make-up15 m3/dayReduction in domestic water consumption
30 m3/dayReduction through recy cle of MGF /IRF b/w water160 m3/dayEffluen t discharge (2005 – 2006)
• Earlier Treated Discharge Water is being us ed by
•Local farmers for irrigation
•Small scale gardeni ng i nside factory
• CII Water Audit carried out in 2005-06. The following savi ngs potentials were identifi ed:

8
I T C L I M I T E D
Proposal # 1 : Recycle of Backwash Water
Raw watertank Soft
Water
– pH – 7.2-7.3– TSS – 15-20 ppm– TH – 500-550 ppm– TDS – 800-1000 ppm Backwash
Water
MGF IRF Soften er
– pH – 7.2-7.3– TSS – 40-50 ppm– TH – 500-525 ppm– TDS – 900-1000 ppm
Backwash water31 m3/day
SludgeTo dis posal
ExistingRaw wate r tankBy gra vit y( TSS <20 mg/l)
MF IRF
Impl emented
I T C L I M I T E D
Proposal # 1 Acco mplished
Tube Settler Plant
Savings: 30 m3/day (10500 m3/day annually )

9
I T C L I M I T E D
Proposal # 2 : Reduction in domestic Water
• Dual Flash
• e- Flash
• e- Ta p
I T C L I M I T E D
Proposal # 2 Acco mplished
Domestic Water Sav ing s
E-Taps
People Awa reness
Dual Flash
Foam- Taps

10
I T C L I M I T E D
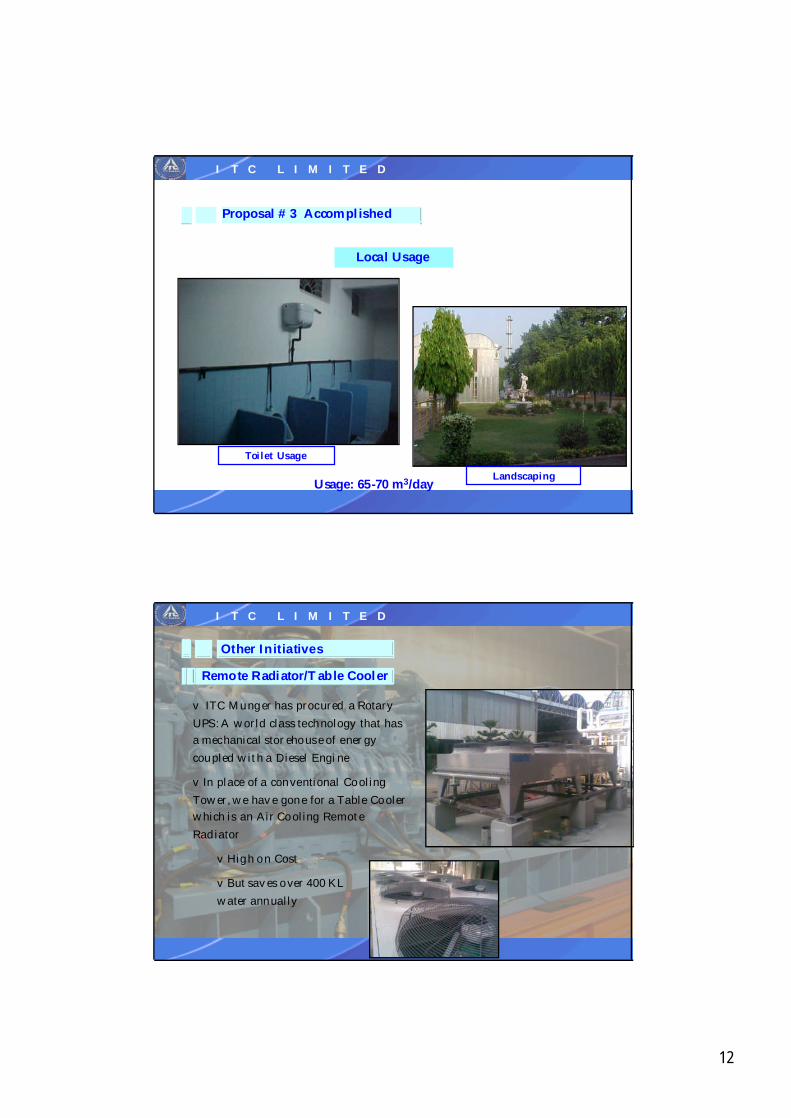
Proposal # 3 Accomplished
Local Usage
Usage: 65-70 m3/day
Toilet Usage
Landscaping
I T C L I M I T E D
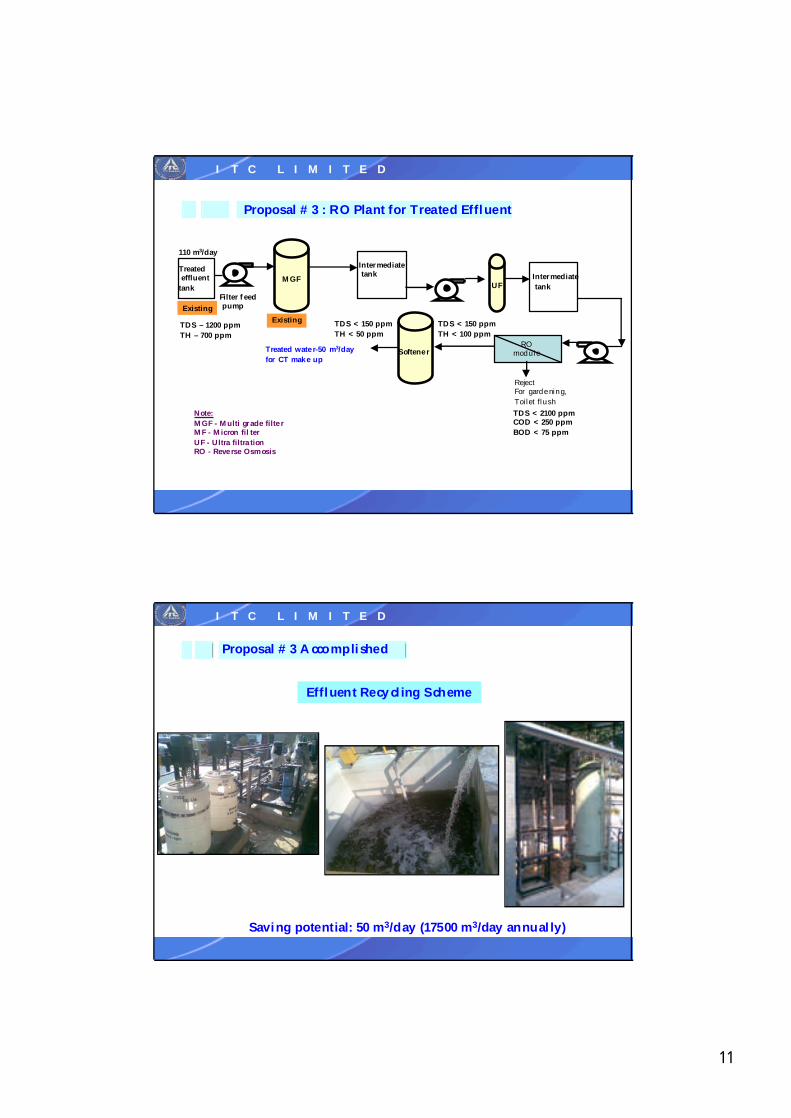
Proposal # 3 : RO Plant for Treated Effluent
vSegregate High T DS stream and directly pump to Final eff luent tank
ØAvoid the unnecessary TDS load to Aeration
ØHelp improve the Aeratio n tank performance
vTreat the final effluent through RO – 115 m3/day
Ø50 m3/day output as Cooling Tower Make-up
Ø65 m3/day reject to garden use, toilet flush
11
I T C L I M I T E D
Proposal # 3 : RO Plant for Treated Effluent
UF
110 m3/day
Treatedeffluent
tankMGF
Note:MGF - Multi grade filte rMF - Micron fil terUF - Ultra filtra tionRO - Reve rse Osmosis
Filter feedpump
Intermediatetank Intermediate
tank
RO module
RejectFor garde ning,Toilet flush
Treated wate r-50 m3/day for CT make up
ExistingExisting
Softene r
TDS – 1200 ppmTH – 700 ppm
TDS < 2100 ppmCOD < 250 ppmBOD < 75 ppm
TDS < 150 ppmTH < 100 ppm
TDS < 150 ppmTH < 50 ppm
I T C L I M I T E D
Proposal # 3 Acco mplished
Effluent Recy cling Scheme
Saving potential: 50 m3/day (17500 m3/day annually)
12
I T C L I M I T E D
Proposal # 3 Accomplished
Local Usage
Usage: 65-70 m3/day
Toilet Usage
Landscaping
I T C L I M I T E D
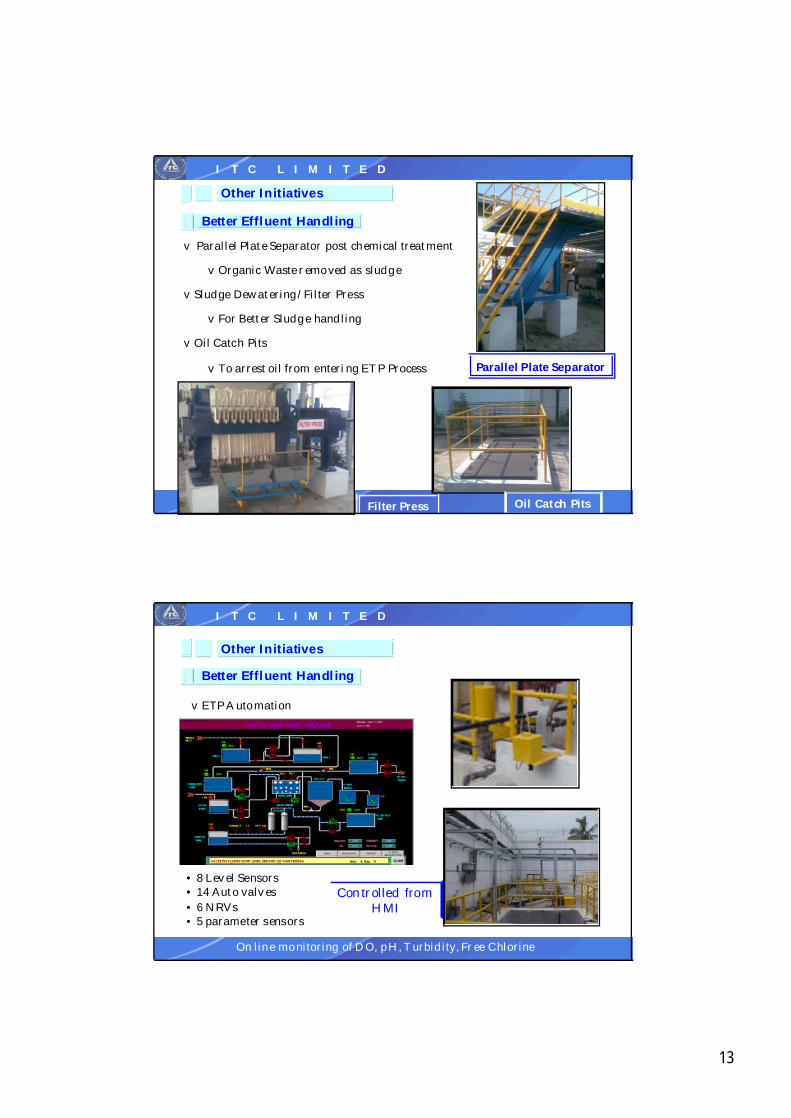
Other Initiatives
Remo te Radiator/T able Cooler
v ITC Munger has procured a Rotary UPS : A world class technology that has a mechanical stor ehous e of ener gy coupled with a Diesel Engi ne
vIn place of a conventional Cooling Tower, we have gone for a Table Cooler which is an Air Cooling Remote Radiator
vHigh on Cost
vBut saves over 400 KL water annually
13
I T C L I M I T E D
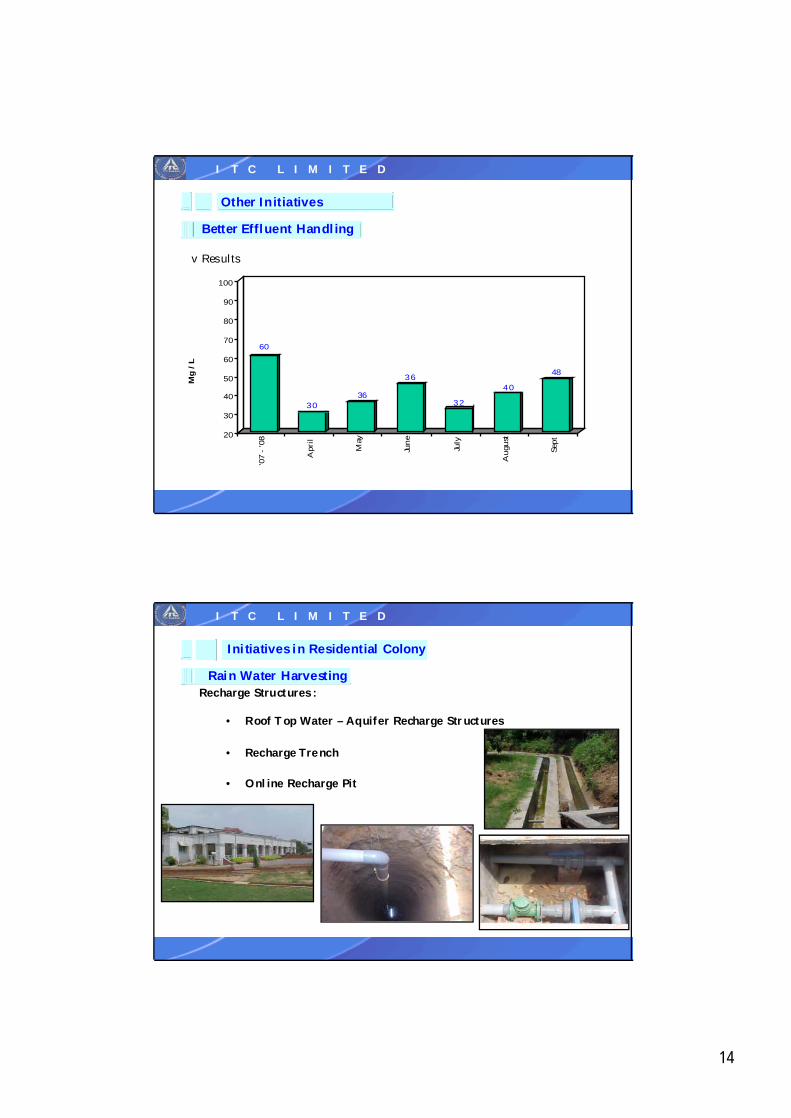
Other Initiatives
Better Effluent Handling
v Parallel Plate Separator post chemical treatment
vOrganic Waste r emoved as sludge
vSludge Dewatering/Filter Press
vFor Better Sludge handling
vOil Catch Pits
vTo arrest oil from enteri ng ET P Process
Filter Press Oil Catch Pits
Parallel Plate Separator
I T C L I M I T E D
Other Initiatives
Better Effluent Handling
vETP Automation
• 8 Level Sensors• 14 Auto valves• 6 NRVs• 5 parameter s ens ors
Controlled from HMI
On line monitoring of DO, pH, T urbidity, Fr ee Chlorine
14
I T C L I M I T E D
Other Initiatives
Better Effluent Handling
vRes ults
60
3036
36
32
40
48
20
30
40
50
60
70
80
90
100
Mg
/ L
'07
- '0
8
Apr
il
May
June
July
Aug
ust
Sept
I T C L I M I T E D
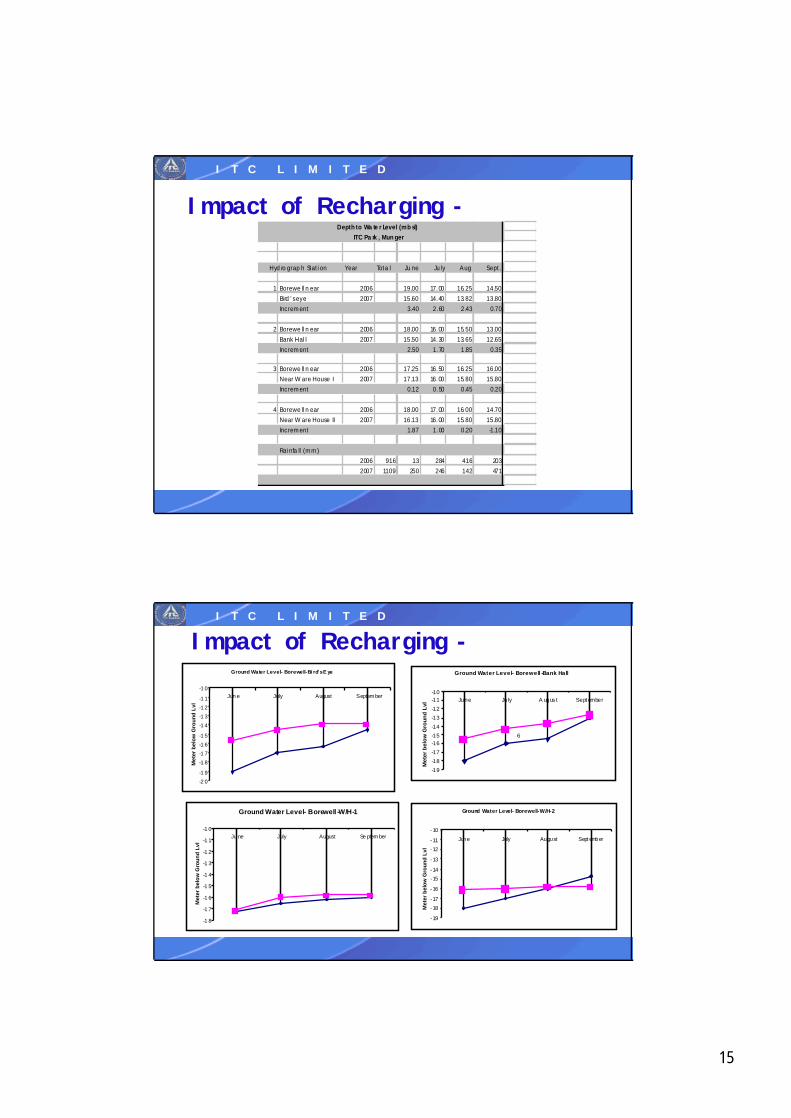
Initiatives in Residential Colony
Recharge Structures :
• Roof Top Water – Aquifer Recharge Str uctures
• Recharge Tre nch
• Online Recharge Pit
Rain Water Harvesting
15
I T C L I M I T E D
Impact of Recharging -
Year Total Ju ne Ju ly Aug Sept.
1 Borewe ll n ear 2006 19.00 17.00 16.25 14.50Bird’s eye 2007 15.60 14.40 13.82 13.80Increment 3.40 2.60 2.43 0.70
2 Borewe ll n ear 2006 18.00 16.00 15.50 13.00Bank Hal l 2007 15.50 14.30 13.65 12.65Increment 2.50 1.70 1.85 0.35
3 Borewe ll n ear 2006 17.25 16.50 16.25 16.00Near W are House I 2007 17.13 16.00 15.80 15.80Increment 0.12 0.50 0.45 0.20
4 Borewe ll n ear 2006 18.00 17.00 16.00 14.70Near W are House II 2007 16.13 16.00 15.80 15.80Increment 1.87 1.00 0.20 -1.10
2006 916 13 284 416 2032007 1109 250 246 142 471
Depth to Wate r Level (mbsl)IT C Park , Mun ger
Hydrograph Stati on
Rai nfall (mm)
I T C L I M I T E D
Impact of Recharging -Ground Water Level- Borewell-Bi rd' s E ye
-2 0-1 9
-1 8-1 7-1 6-1 5
-1 4-1 3-1 2-1 1
-1 0Jun e July August Septem ber
Met
er b
elow
Gro
und
Lvl
Ground Water Level- Borewell -Bank Hall
-19-18-17-16-15-14-13-12-11-10
June July A ugus t Sept ember
Met
er b
elow
Gro
und
Lvl
6
Ground Water Level- Borewell -W/H-1
-1 8
-1 7
-1 6
-1 5
-1 4
-1 3
-1 2
-1 1
-1 0Ju ne July August Se ptem ber
Met
er b
elow
Gro
und
Lvl
Ground Water Level- Borewell-W/H-2
-19
-18-17
-16
-15-14
-13
-12-11
-10June July August Sept ember
Met
er b
elow
Gro
und
Lvl

16
I T C L I M I T E D
We understand the worth of water,Even when the well is full of water.
Thank You


