
Office of Research and DevelopmentFull Name of Lab, Center, Office, Division or Staff goes here. <Go to View, Master, Slide Master to change>Office of Research and DevelopmentNational Health and Environmental Effects Research Laboratory/ Atlantic Ecology Division July 16, 2013
EPA/ORD/NHEERL/NERL
Naval Research Laboratory/StennisSpace Center
ISS Hyperspectral Imager for the CoastalOcean (HICO): Application of Space-basedHyperspectral Imagery for the Protection of
the Nation’s Coastal Resources
Jessica Aukamp USEPA/NHEERL/Gulf Ecology DivisionDonald Cobb USEPA/NHEERL/Atlantic Ecology DivisionRobyn Conmy USEPA/National Risk Management
Research Laboratory/Land Remediationand Pollution Control
George Craven USEPA/NHEERL/Gulf Ecology DivisionRichard Gould Naval Research Laboratory/ Bio-optical
Physical Processes and Remote SensingSection
James Hagy USEPA/NHEERL/Gulf Ecology DivisionDarryl Keith* USEPA/NHEERL/Atlantic Ecology DivisionJohn Lehrter USEPA/NHEERL/Gulf Ecology DivisionRoss Lunetta USEPA/National Exposure Research
Laboratory/Environmental Services DivisionMichael Murrell USEPA/NHEERL/Gulf Ecology DivisionKenneth Rocha USEPA/NHEERL/Atlantic Ecology DivisionBlake Schaeffer USEPA/NHEERL/Gulf Ecology Division
*email: [email protected]

Office of Research and DevelopmentFull Name of Lab, Center, Office, Division or Staff goes here. <Go to View, Master, Slide Master to change>Office of Research and DevelopmentNational Health and Environmental Effects Research Laboratory/ Atlantic Ecology Division
1
The U.S. Environmental ProtectionAgency’s mandate to protect human healthand the environment requires innovativeand sustainable solutions for addressingthe Nation’s environmental problems.
HICO offers EPA and the environmentalmonitoring community an unprecedentedopportunity to observe changes in coastaland estuarine water quality across a rangeof spatial scales not possible with field-based monitoring.
Office of Research and DevelopmentFull Name of Lab, Center, Office, Division or Staff goes here. <Go to View, Master, Slide Master to change>Office of Research and DevelopmentNational Health and Environmental Effects Research Laboratory/ Atlantic Ecology Division
2
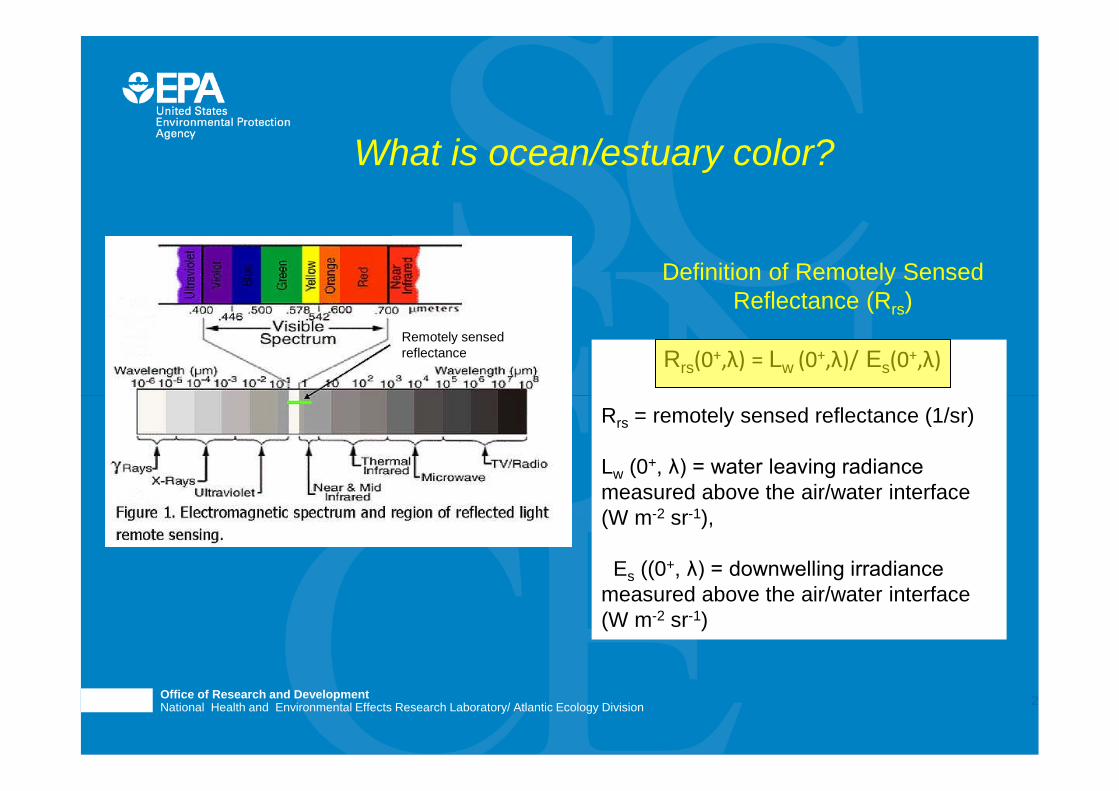
What is ocean/estuary color?
Rrs(0+,λ) = Lw (0+,λ)/ Es(0+,λ)
Rrs = remotely sensed reflectance (1/sr)
Lw (0+, λ) = water leaving radiance measured above the air/water interface(W m-2 sr-1),
Es ((0+, λ) = downwelling irradiance measured above the air/water interface(W m-2 sr-1)
Definition of Remotely SensedReflectance (Rrs)
Remotely sensedreflectance
Remotely sensedreflectance
Office of Research and DevelopmentFull Name of Lab, Center, Office, Division or Staff goes here. <Go to View, Master, Slide Master to change>Office of Research and DevelopmentNational Health and Environmental Effects Research Laboratory/ Atlantic Ecology Division
3
Use HICO imagery to develop a novel space-basedenvironmental monitoring system that providesinformation for the sustainable management ofcoastal ecosystems.
To demonstrate that water quality informationderived from HICO could be incorporated into aprototype smart phone application to disseminatedata to managers in the EPA Office of Water.
Program Objectives
Water quality news reports may change the social and economicdynamics for the Nation to not only be aware of its water qualityconditions but support sustainable practices to maintain orimprove conditions at their favorite recreational areas.
Office of Research and DevelopmentFull Name of Lab, Center, Office, Division or Staff goes here. <Go to View, Master, Slide Master to change>Office of Research and DevelopmentNational Health and Environmental Effects Research Laboratory/ Atlantic Ecology Division
4
• HICO is intended as a pathfinder for follow-on sensors designed with betterresolution and for routine observations of coastal, riverine, and estuarinewaters (Lucke et al., 2011).
• Built on the legacy of the NRL Ocean Portable Hyperspectral Imager for Low-LightSpectroscopy (Ocean PHILLS) airborne imagers and funded as an InnovativeNaval Prototype by the Office of Naval Research
• January, 2007: HICO selected to fly on the International Space Station (ISS)
• November, 2007: Construction began following the Critical Design Review
• September, 2008: Space-qualified instrument delivered to the DOD Space TestProgram for integration and spacecraft-level testing
• April, 2009: Shipped to Japan Aerospace Exploration Agency (JAXA) for launch
• September 10, 2009: HICO launched on JAXA H-II Transfer Vehicle (HTV)
• September 24, 2009: HICO installed on ISS Japanese Module Exposed Facility
Hyperspectral Imager for the CoastalOcean (HICO).... Intent and a bit of history
Office of Research and DevelopmentFull Name of Lab, Center, Office, Division or Staff goes here. <Go to View, Master, Slide Master to change>Office of Research and DevelopmentNational Health and Environmental Effects Research Laboratory/ Atlantic Ecology Division
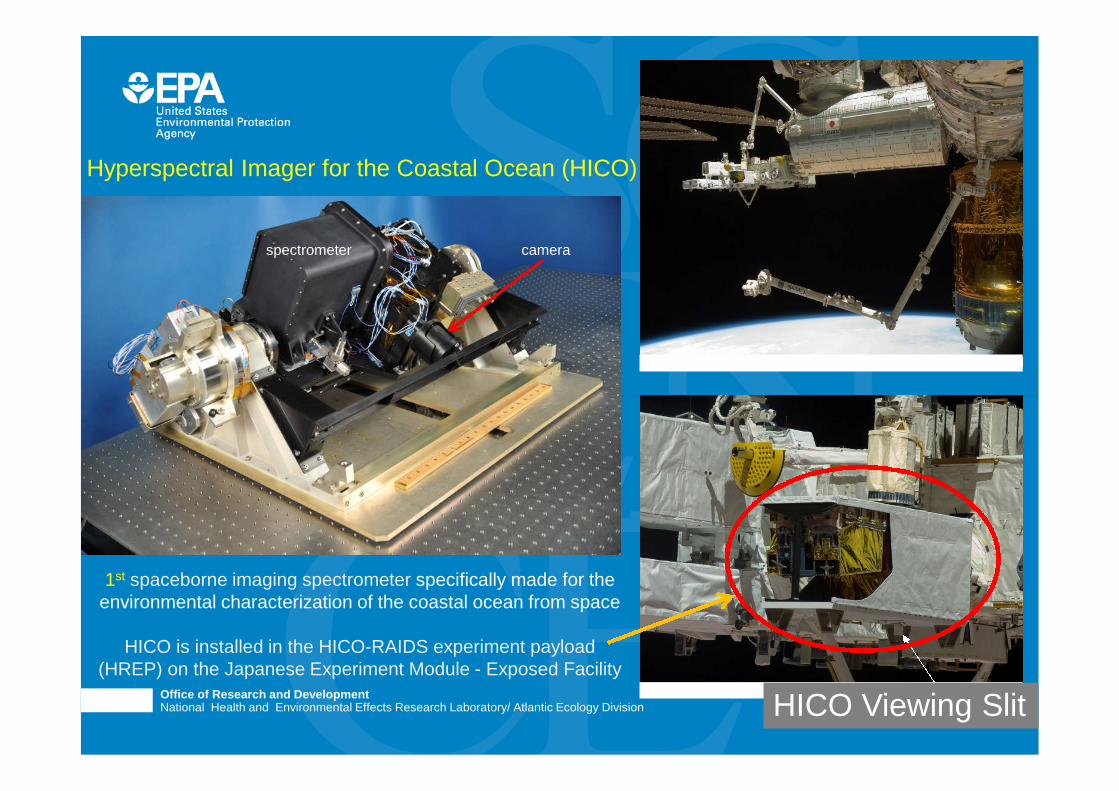
5HICO Viewing Slit
spectrometer
Hyperspectral Imager for the Coastal Ocean (HICO)
1st spaceborne imaging spectrometer specifically made for theenvironmental characterization of the coastal ocean from space
HICO is installed in the HICO-RAIDS experiment payload(HREP) on the Japanese Experiment Module - Exposed Facility
camera
Office of Research and DevelopmentFull Name of Lab, Center, Office, Division or Staff goes here. <Go to View, Master, Slide Master to change>Office of Research and DevelopmentNational Health and Environmental Effects Research Laboratory/ Atlantic Ecology Division
6
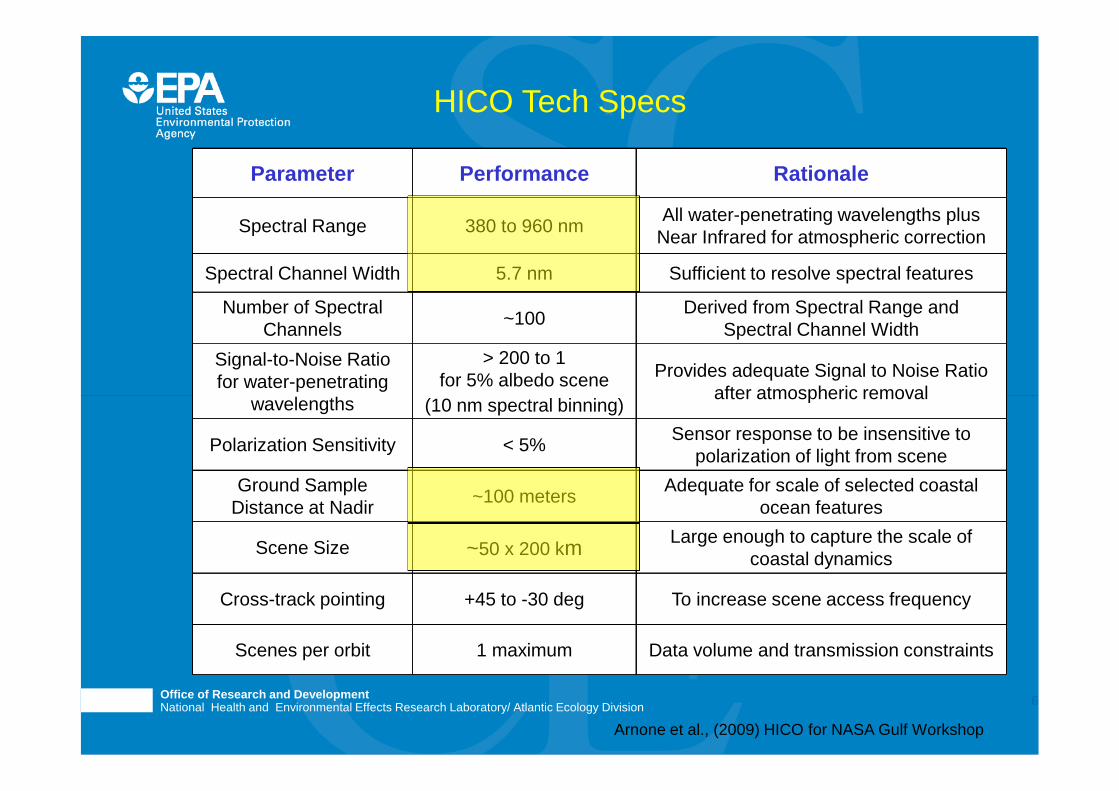
To increase scene access frequency+45 to -30 degCross-track pointing
Data volume and transmission constraints1 maximumScenes per orbit
Large enough to capture the scale ofcoastal dynamics
Adequate for scale of selected coastalocean features
Sensor response to be insensitive topolarization of light from scene
Provides adequate Signal to Noise Ratioafter atmospheric removal
Derived from Spectral Range andSpectral Channel Width
Sufficient to resolve spectral features
All water-penetrating wavelengths plusNear Infrared for atmospheric correction
Rationale
~100Number of Spectral
Channels
~50 x 200 kmScene Size
~100 metersGround Sample
Distance at Nadir
< 5%Polarization Sensitivity
> 200 to 1for 5% albedo scene
(10 nm spectral binning)
Signal-to-Noise Ratiofor water-penetrating
wavelengths
5.7 nmSpectral Channel Width
380 to 960 nmSpectral Range
PerformanceParameter
Arnone et al., (2009) HICO for NASA Gulf Workshop
HICO Tech Specs
Office of Research and DevelopmentFull Name of Lab, Center, Office, Division or Staff goes here. <Go to View, Master, Slide Master to change>Office of Research and DevelopmentNational Health and Environmental Effects Research Laboratory/ Atlantic Ecology Division
7
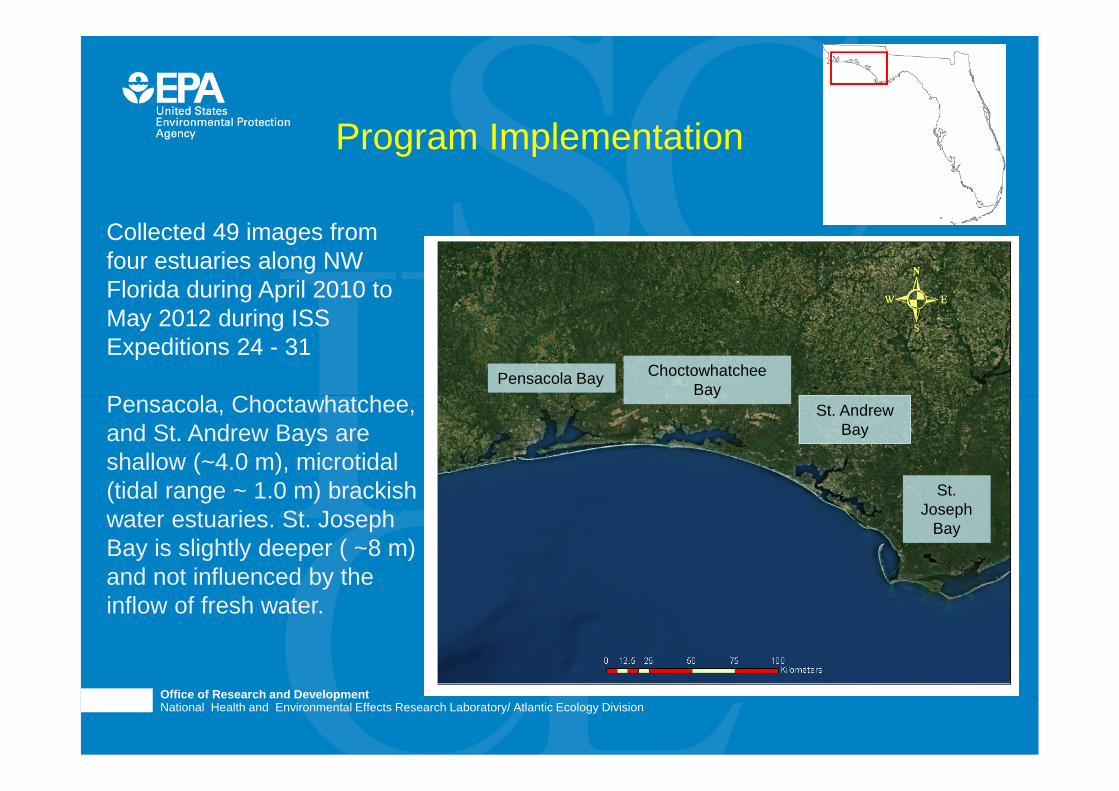
Program Implementation
Collected 49 images fromfour estuaries along NWFlorida during April 2010 toMay 2012 during ISSExpeditions 24 - 31
Pensacola, Choctawhatchee,and St. Andrew Bays areshallow (~4.0 m), microtidal(tidal range ~ 1.0 m) brackishwater estuaries. St. JosephBay is slightly deeper ( ~8 m)and not influenced by theinflow of fresh water.
Pensacola Bay ChoctowhatcheeBay
St. AndrewBay
St.Joseph
Bay

Office of Research and DevelopmentFull Name of Lab, Center, Office, Division or Staff goes here. <Go to View, Master, Slide Master to change>Office of Research and DevelopmentNational Health and Environmental Effects Research Laboratory/ Atlantic Ecology Division
Field Validation Program
Pensacola Bay
Choctawhatchee Bay
St. Joseph Bay
St. Andrew Bay
Samplestations
Green = waterquality moorings(chl a, turbidity,
and CDOM)
Yellow = abovewater radiance,
temp, salinity, andoptical properties
Red = same asyellow + discretewater samples
Office of Research and DevelopmentFull Name of Lab, Center, Office, Division or Staff goes here. <Go to View, Master, Slide Master to change>Office of Research and DevelopmentNational Health and Environmental Effects Research Laboratory/ Atlantic Ecology Division
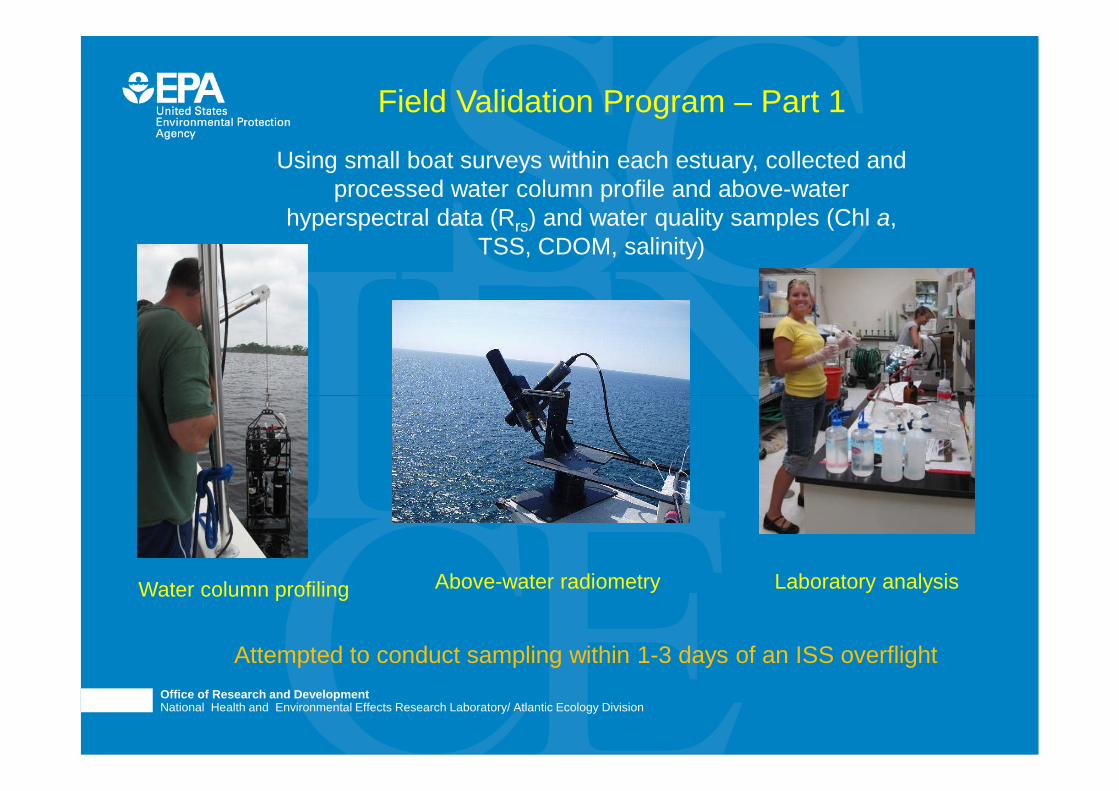
Using small boat surveys within each estuary, collected andprocessed water column profile and above-water
hyperspectral data (Rrs) and water quality samples (Chl a,TSS, CDOM, salinity)
Field Validation Program – Part 1
Attempted to conduct sampling within 1-3 days of an ISS overflight
Laboratory analysisAbove-water radiometryWater column profiling
Office of Research and DevelopmentFull Name of Lab, Center, Office, Division or Staff goes here. <Go to View, Master, Slide Master to change>Office of Research and DevelopmentNational Health and Environmental Effects Research Laboratory/ Atlantic Ecology Division
10
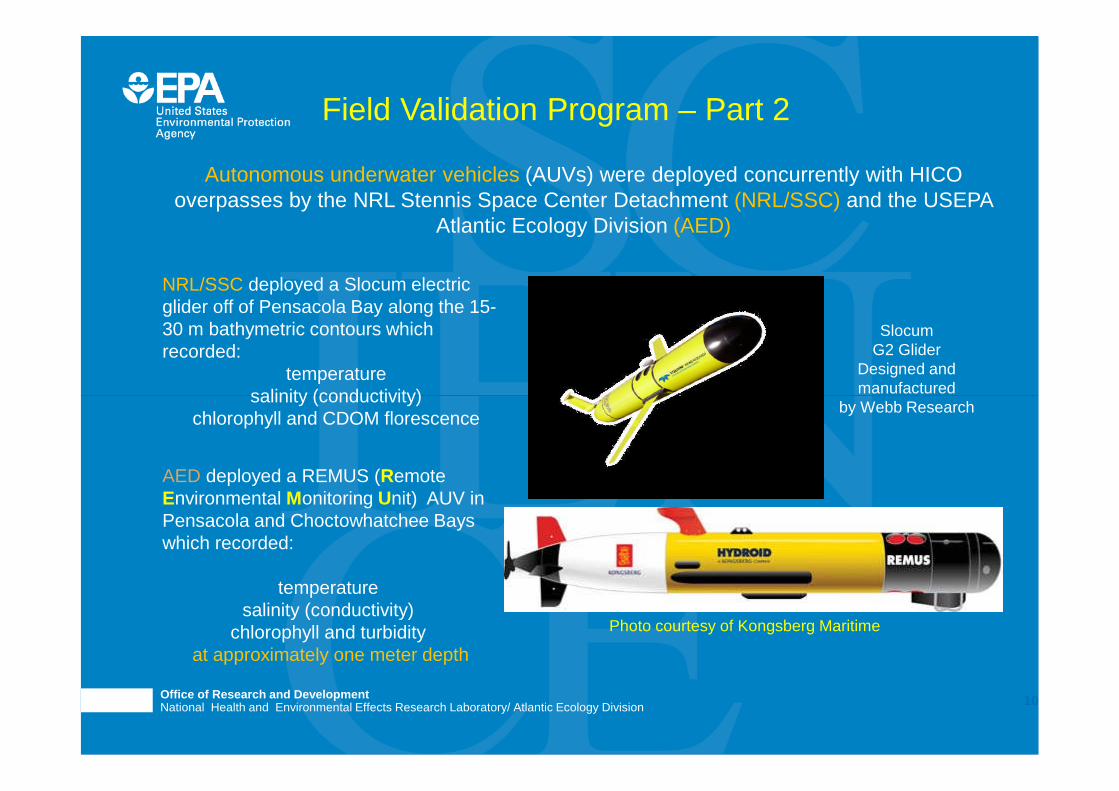
Field Validation Program – Part 2
Autonomous underwater vehicles (AUVs) were deployed concurrently with HICOoverpasses by the NRL Stennis Space Center Detachment (NRL/SSC) and the USEPA
Atlantic Ecology Division (AED)
NRL/SSC deployed a Slocum electricglider off of Pensacola Bay along the 15-30 m bathymetric contours whichrecorded:
temperaturesalinity (conductivity)
chlorophyll and CDOM florescence
SlocumG2 Glider
Designed andmanufactured
by Webb Research
AED deployed a REMUS (RemoteEnvironmental Monitoring Unit) AUV inPensacola and Choctowhatchee Bayswhich recorded:
temperaturesalinity (conductivity)
chlorophyll and turbidityat approximately one meter depth
Photo courtesy of Kongsberg Maritime
Office of Research and DevelopmentFull Name of Lab, Center, Office, Division or Staff goes here. <Go to View, Master, Slide Master to change>Office of Research and DevelopmentNational Health and Environmental Effects Research Laboratory/ Atlantic Ecology Division
11
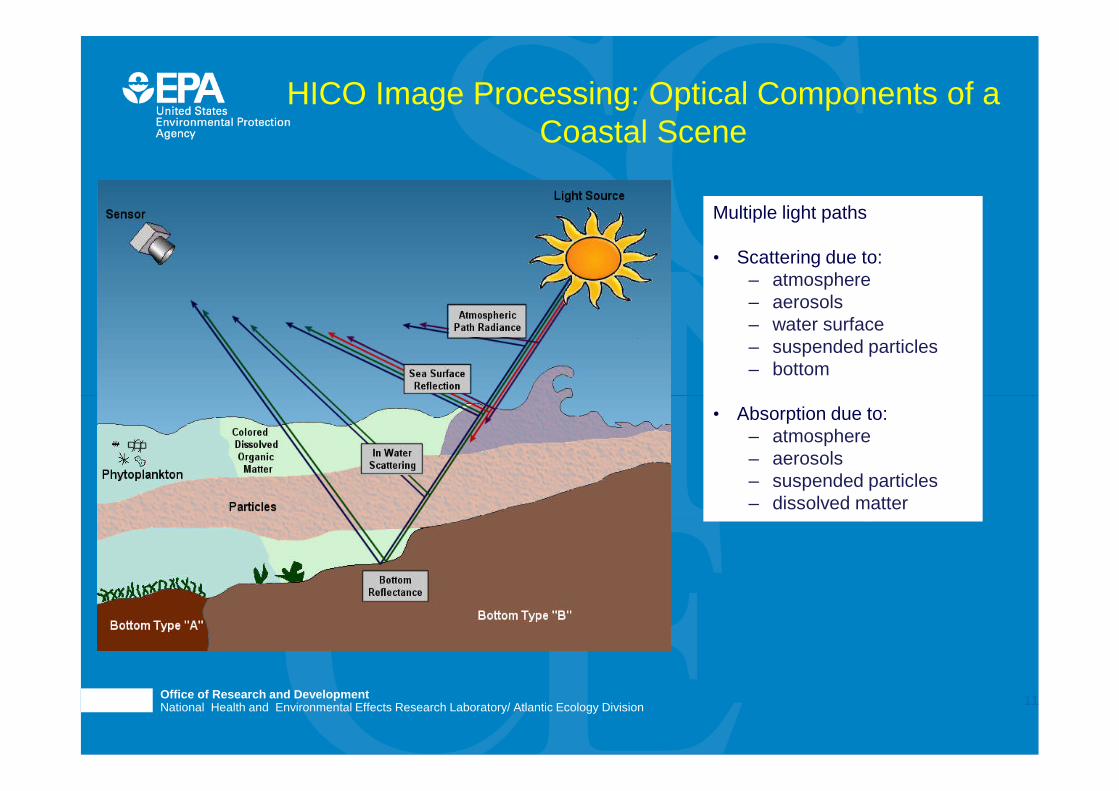
HICO Image Processing: Optical Components of aCoastal Scene
Multiple light paths
• Scattering due to:– atmosphere– aerosols– water surface– suspended particles– bottom
• Absorption due to:– atmosphere– aerosols– suspended particles– dissolved matter
Office of Research and DevelopmentFull Name of Lab, Center, Office, Division or Staff goes here. <Go to View, Master, Slide Master to change>Office of Research and DevelopmentNational Health and Environmental Effects Research Laboratory/ Atlantic Ecology Division
12
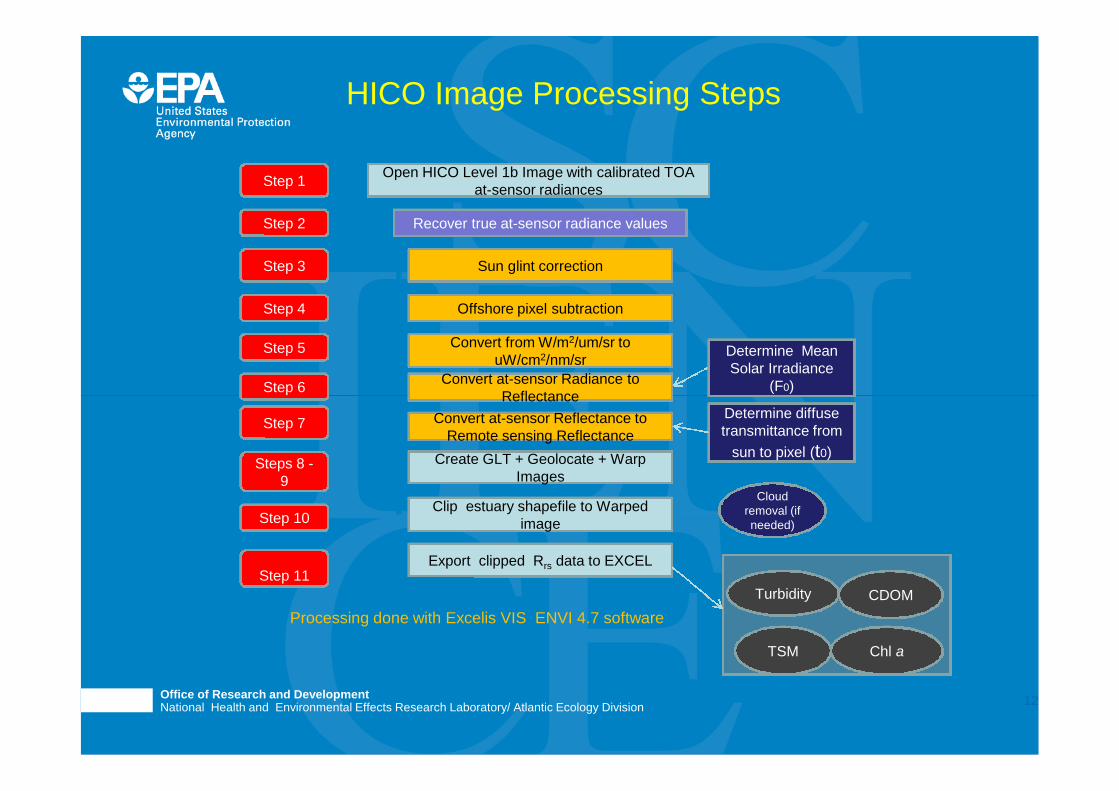
HICO Image Processing Steps
Processing done with Excelis VIS ENVI 4.7 software
Open HICO Level 1b Image with calibrated TOAat-sensor radiances
Recover true at-sensor radiance valuesStep 2
Step 7
Steps 8 -9
Create GLT + Geolocate + WarpImages
Step 10Clip estuary shapefile to Warped
image
Step 11Export clipped Rrs data to EXCEL
CDOMTurbidity
TSM Chl a
Step 3
Step 1
Sun glint correction
Cloudremoval (ifneeded)
Step 5 Convert from W/m2/um/sr touW/cm2/nm/sr
Step 4
Step 6
Offshore pixel subtraction
Convert at-sensor Reflectance toRemote sensing Reflectance
Convert at-sensor Radiance toReflectance
Determine MeanSolar Irradiance
(F0)
Determine diffusetransmittance from
sun to pixel (t0)
Office of Research and DevelopmentFull Name of Lab, Center, Office, Division or Staff goes here. <Go to View, Master, Slide Master to change>Office of Research and DevelopmentNational Health and Environmental Effects Research Laboratory/ Atlantic Ecology Division
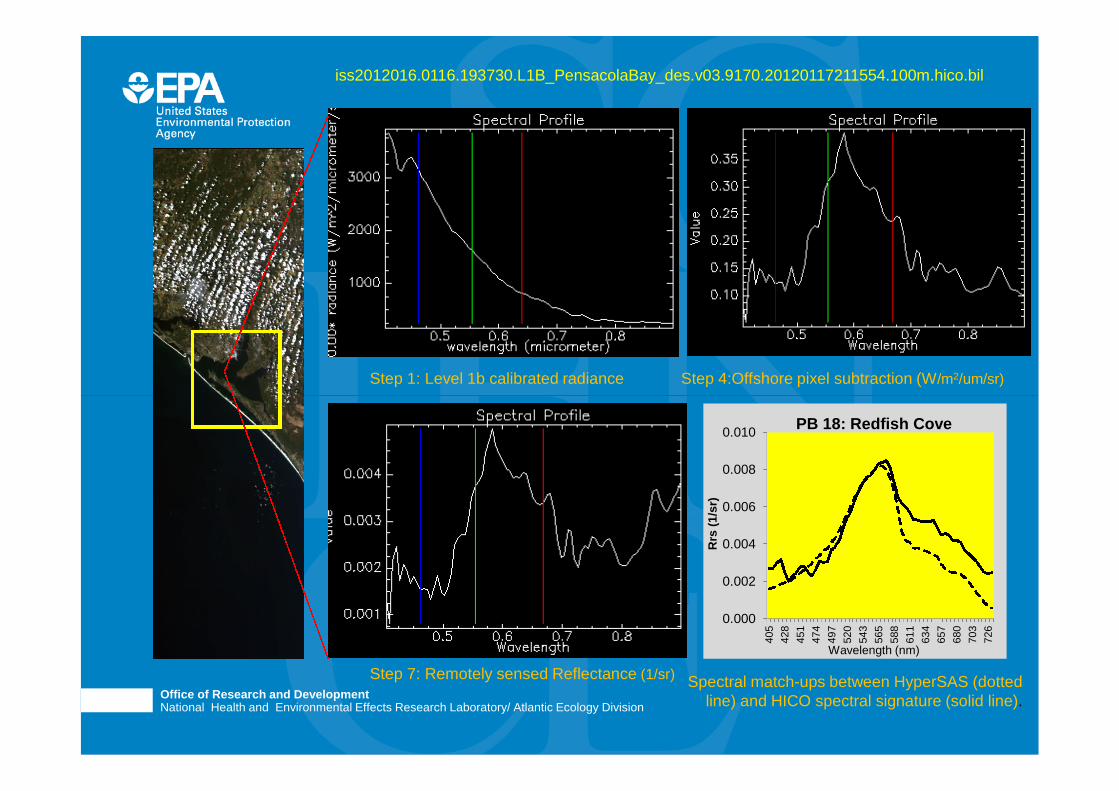
Spectral match-ups between HyperSAS (dottedline) and HICO spectral signature (solid line).
iss2012016.0116.193730.L1B_PensacolaBay_des.v03.9170.20120117211554.100m.hico.bil
Step 1: Level 1b calibrated radiance Step 4:Offshore pixel subtraction (W/m2/um/sr)
Step 7: Remotely sensed Reflectance (1/sr)
0.000
0.002
0.004
0.006
0.008
0.010
405
428
451
474
497
520
543
565
588
611
634
657
680
703
726
Rrs
(1/s
r)
Wavelength (nm)
PB 18: Redfish Cove
Office of Research and DevelopmentFull Name of Lab, Center, Office, Division or Staff goes here. <Go to View, Master, Slide Master to change>Office of Research and DevelopmentNational Health and Environmental Effects Research Laboratory/ Atlantic Ecology Division
14
0
0.001
0.002
0.003
0.004
0.005
0.006
0.007
0.008
0.009
40
543
947
450
854
357
761
164
668
071
4
Rrs
(sr-
1)
Wavelength (nm)
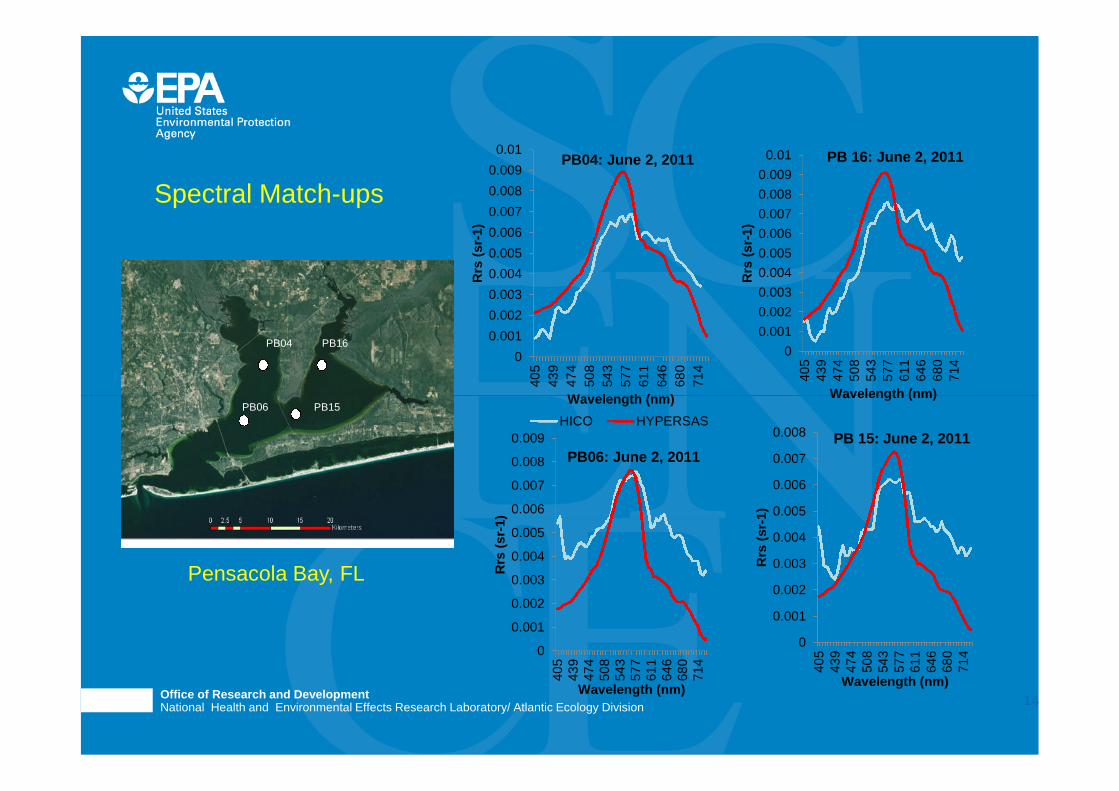
PB06: June 2, 2011
0
0.001
0.002
0.003
0.004
0.005
0.006
0.007
0.008
0.009
0.01
40
5
43
9
47
4
50
8
54
3
57
7
61
1
64
6
68
0
71
4
Rrs
(sr-
1)
Wavelength (nm)
PB 16: June 2, 2011
0
0.001
0.002
0.003
0.004
0.005
0.006
0.007
0.008
40
543
947
450
854
357
761
164
668
071
4
Rrs
(sr-
1)
Wavelength (nm)
PB 15: June 2, 2011
0
0.001
0.002
0.003
0.004
0.005
0.006
0.007
0.008
0.009
0.01
40
5
43
9
47
4
50
8
54
3
57
7
61
1
64
6
68
0
71
4
Rrs
(sr-
1)
Wavelength (nm)
PB04: June 2, 2011
HICO HYPERSAS
PB04
PB06
PB16
PB15
Spectral Match-ups
Pensacola Bay, FL

Office of Research and DevelopmentFull Name of Lab, Center, Office, Division or Staff goes here. <Go to View, Master, Slide Master to change>Office of Research and DevelopmentNational Health and Environmental Effects Research Laboratory/ Atlantic Ecology Division
15
0
2
4
6
8
10
-0.200 -0.100 0.000 0.100 0.200HICO[ (1/Rrs674-1/Rrs703)*Rrs726]
R2 = 0.68
0
2
4
6
8
10
12
0 2 4 6 8 10 12
Measu
red
ch
la
(ug
/L)
HICO predicted chl a (ug/L)
R2 = 0.82RMSE = 1.7 ug/L
Chl a = 19.264 X [a] + 6.614a = [1/Rrs(674) – 1/Rrs(703)]x Rrs(726)
approach of Gitelson et al., 2011
Chl a: indicator of phytoplankton abundance and eutrophication
Office of Research and DevelopmentFull Name of Lab, Center, Office, Division or Staff goes here. <Go to View, Master, Slide Master to change>Office of Research and DevelopmentNational Health and Environmental Effects Research Laboratory/ Atlantic Ecology Division
16
0.0
0.5
1.0
1.5
2.0
2.5
3.0
0.0 1.0 2.0 3.0
CT
DN
TU
HICO NTU
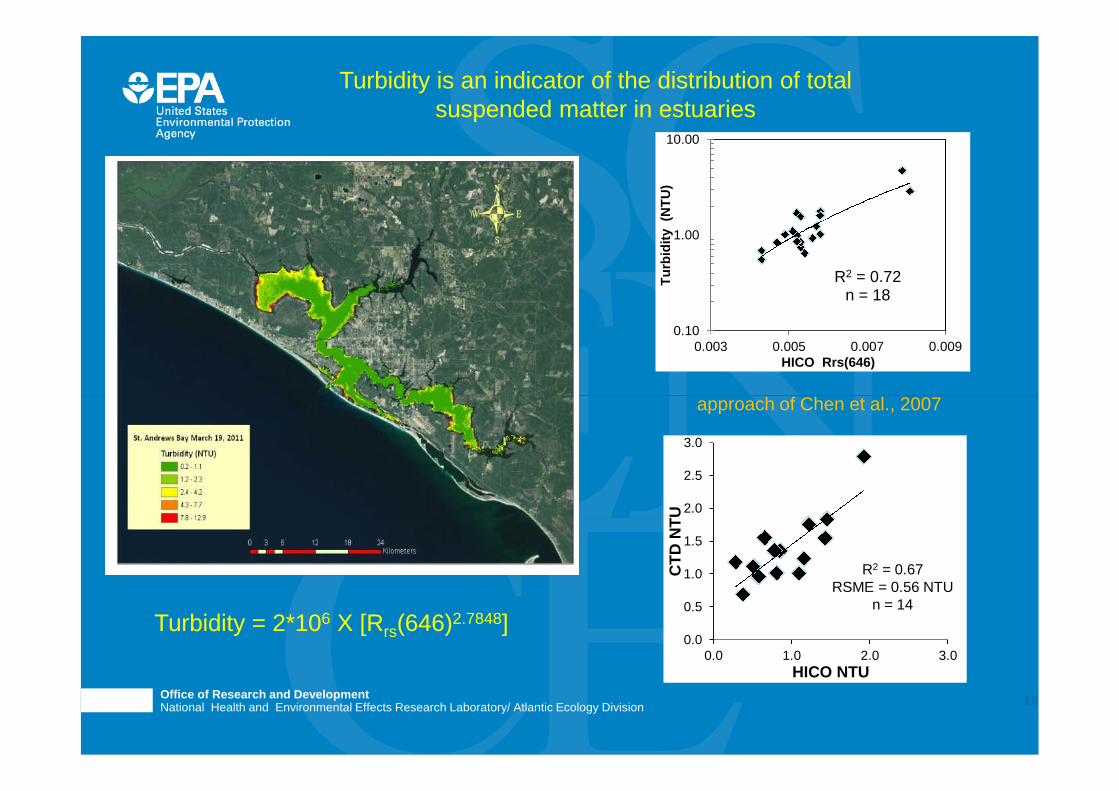
R2 = 0.67RSME = 0.56 NTU
n = 14
Turbidity = 2*106 X [Rrs(646)2.7848]
R2 = 0.72n = 18
0.10
1.00
10.00
0.003 0.005 0.007 0.009
Tu
rbid
ity
(NT
U)
HICO Rrs(646)
approach of Chen et al., 2007
Turbidity is an indicator of the distribution of totalsuspended matter in estuaries
Office of Research and DevelopmentFull Name of Lab, Center, Office, Division or Staff goes here. <Go to View, Master, Slide Master to change>Office of Research and DevelopmentNational Health and Environmental Effects Research Laboratory/ Atlantic Ecology Division
17
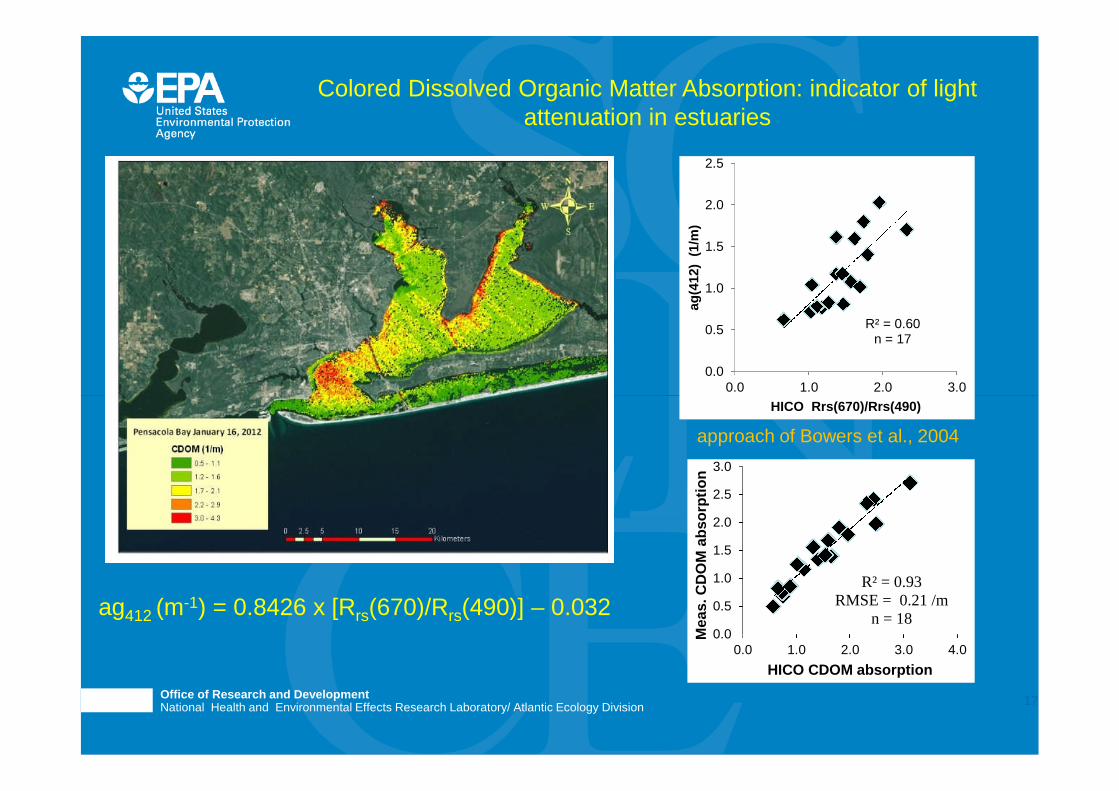
Colored Dissolved Organic Matter Absorption: indicator of lightattenuation in estuaries
R² = 0.93RMSE = 0.21 /m
n = 180.0
0.5
1.0
1.5
2.0
2.5
3.0
0.0 1.0 2.0 3.0 4.0
Meas.C
DO
Mab
so
rpti
on
HICO CDOM absorption
R² = 0.60n = 17
0.0
0.5
1.0
1.5
2.0
2.5
0.0 1.0 2.0 3.0
ag
(412)
(1/m
)
HICO Rrs(670)/Rrs(490)
ag412 (m-1) = 0.8426 x [Rrs(670)/Rrs(490)] – 0.032
approach of Bowers et al., 2004
Office of Research and DevelopmentFull Name of Lab, Center, Office, Division or Staff goes here. <Go to View, Master, Slide Master to change>Office of Research and DevelopmentNational Health and Environmental Effects Research Laboratory/ Atlantic Ecology Division
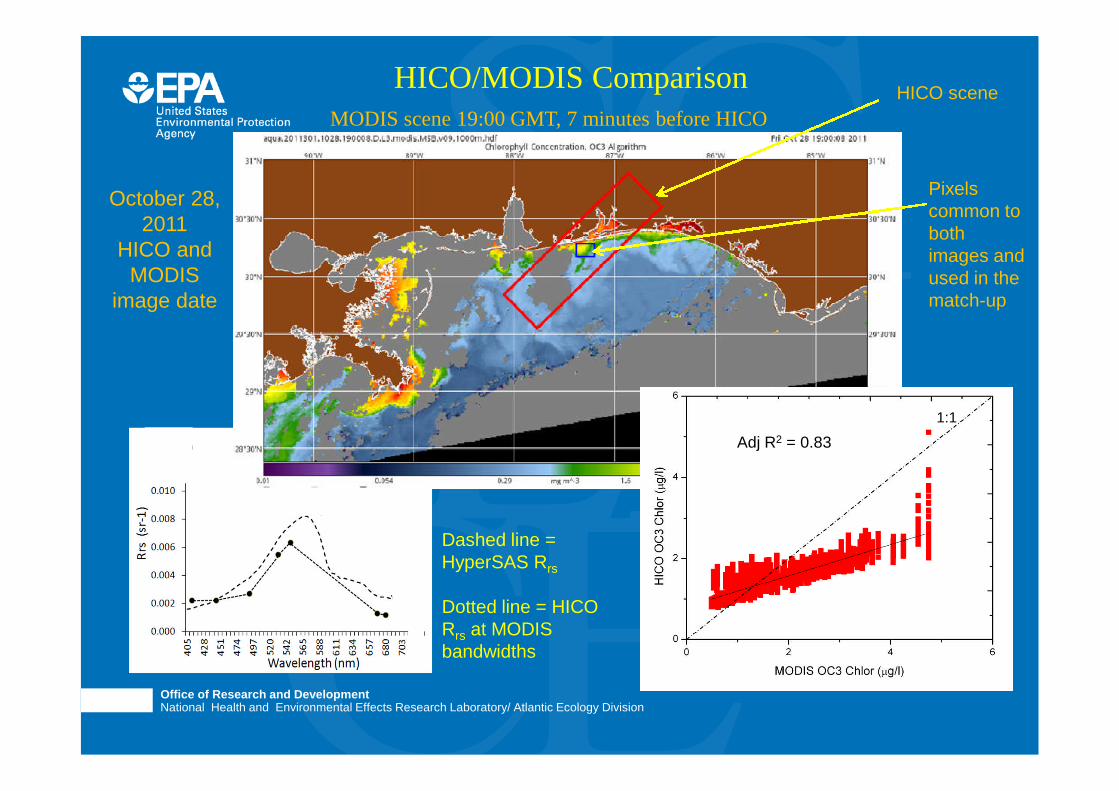
HICO/MODIS ComparisonMODIS scene 19:00 GMT, 7 minutes before HICOoverpass
Adj R2 = 0.83
HICO scene
Pixelscommon tobothimages andused in thematch-up
October 28,2011
HICO andMODIS
image date
Dashed line =HyperSAS Rrs
Dotted line = HICORrs at MODISbandwidths
1:1
Office of Research and DevelopmentFull Name of Lab, Center, Office, Division or Staff goes here. <Go to View, Master, Slide Master to change>Office of Research and DevelopmentNational Health and Environmental Effects Research Laboratory/ Atlantic Ecology Division
19
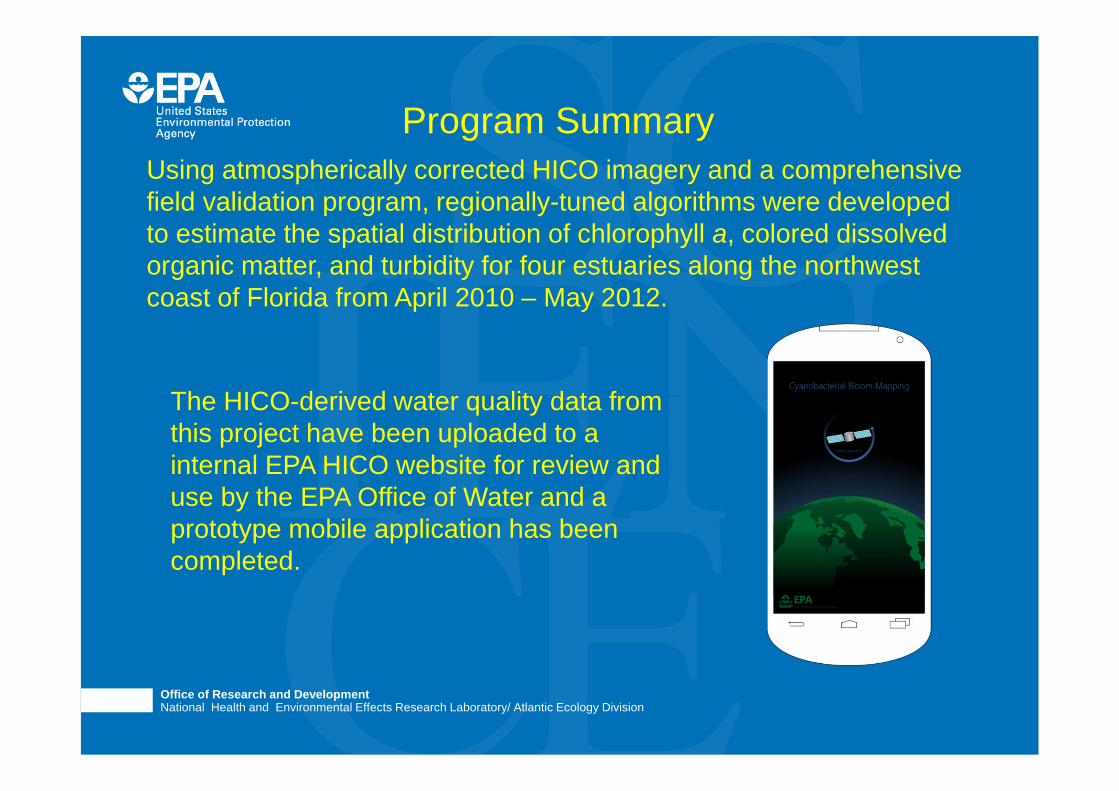
Using atmospherically corrected HICO imagery and a comprehensivefield validation program, regionally-tuned algorithms were developedto estimate the spatial distribution of chlorophyll a, colored dissolvedorganic matter, and turbidity for four estuaries along the northwestcoast of Florida from April 2010 – May 2012.
Program Summary
The HICO-derived water quality data fromthis project have been uploaded to ainternal EPA HICO website for review anduse by the EPA Office of Water and aprototype mobile application has beencompleted.

Office of Research and DevelopmentFull Name of Lab, Center, Office, Division or Staff goes here. <Go to View, Master, Slide Master to change>Office of Research and DevelopmentNational Health and Environmental Effects Research Laboratory/ Atlantic Ecology Division
20
Conclusions
HICO helped us to show that it is possible for a hyperspectral space-basedsensor to produce products that meet the needs of EPA.
While the potential benefits are many, there are several issues that must beresolved before HICO images and data can be incorporated into routinemonitoring programs of EPA
• HICO is currently limited to only one image per orbit.
• ISS overpass times are difficult to precisely predict. Theseuncertainties led to the rescheduling of planned image acquisitions which attimes impacted the effective deployment of crews for field validation activities.
HICO has the potential to be a valuable monitoring tool, if transitioned to aconstellation of sensors.

Office of Research and DevelopmentFull Name of Lab, Center, Office, Division or Staff goes here. <Go to View, Master, Slide Master to change>Office of Research and DevelopmentNational Health and Environmental Effects Research Laboratory/ Atlantic Ecology Division
21
Special Thanks to:
Crews on ISS Expeditions 24 - 31Naval Research Laboratory Remote Sensing Division
Oregon State UniversityNASA ISS Program
American Astronautical Societyand
EPA Office of Research and DevelopmentEPA Pathfinder Innovation Program (Grant 2011)
EPA Safe and Sustainable Waters Research Program


