
ISOLATION, CHARACTERIZATION AND IMMOBILIZATION OF
POLYPHENOL OXIDASES FROM MULBERRY (Morus alba) LEAF TISSUES
A THESIS SUBMITTED TO
THE GRADUATE SCHOOL OF NATURAL AND APPLIED SCIENCES
OF
THE MIDDLE EAST TECHNICAL UNIVERSITY
BY
DİDEM SUTAY
IN PARTIAL FULFILLMENT OF THE REQUIREMENTS FOR THE DEGREE OF
MASTER OF SCIENCE
IN
THE DEPARTMENT OF CHEMICAL ENGINEERING
JULY 2003
Approval of the Graduate School of Natural and Applied Sciences.
___________________ Prof. Dr. Canan Özgen Director
I certify that this thesis satisfies all the requirements as a thesis for the degree of
Master of Science.
___________________ Prof. Dr. Timur Doğu Head of Department
This is to certify that we have read this thesis and that in our opinion it is fully
adequate, in scope and quality, as a thesis for the degree of Master of Science.
__________________ Prof. Dr. Ufuk Bakır Supervisor Examining Committee Members Prof. Dr. Zümrüt B. Ögel ___________________ Prof. Dr. Hüseyin Avni Öktem ___________________ Prof. Dr. Gülay Özcengiz ___________________ Assoc. Prof. Dr. Pınar Çalık ___________________ Prof. Dr. Ufuk Bakır (Supervisor) ___________________
ABSTRACT
ISOLATION, CHARACTERIZATION AND IMMOBILIZATION OF
POLYPHENOL OXIDASES FROM MULBERRY (Morus alba) LEAF TISSUES
Sutay, Didem
M.S., Department of Chemical Engineering
Supervisor: Prof. Dr. Ufuk Bakır
July 2003, 98 pages
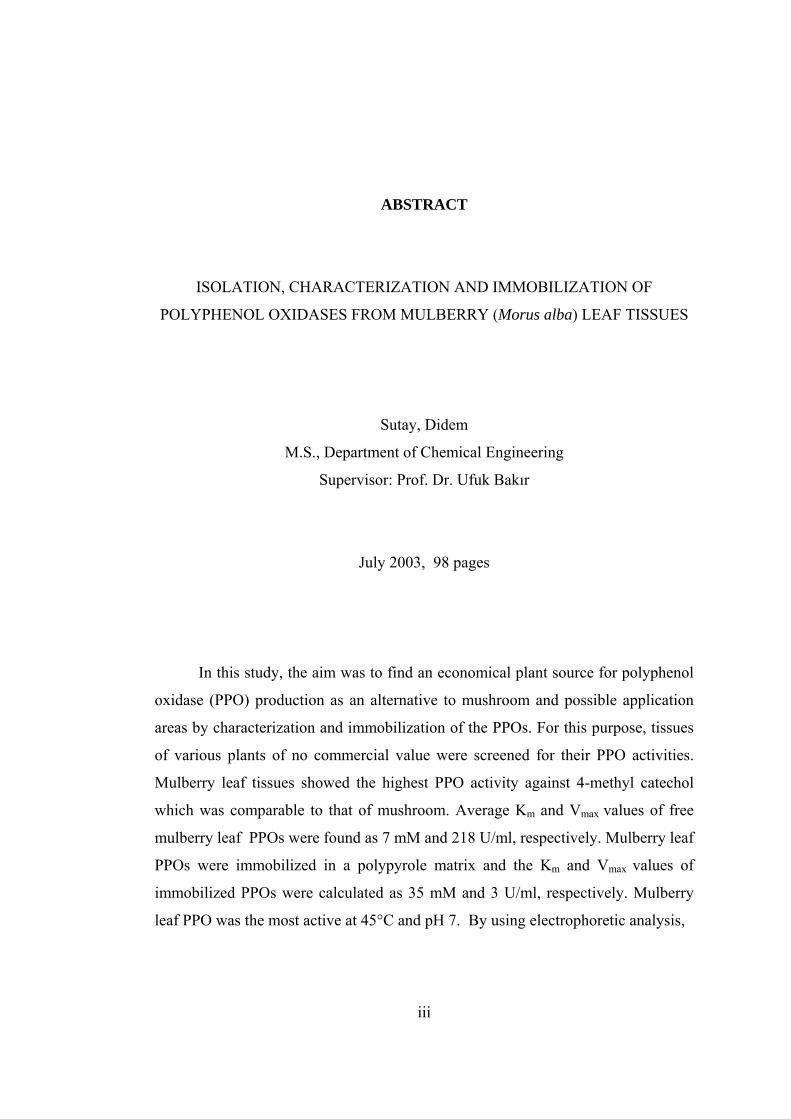
In this study, the aim was to find an economical plant source for polyphenol
oxidase (PPO) production as an alternative to mushroom and possible application
areas by characterization and immobilization of the PPOs. For this purpose, tissues
of various plants of no commercial value were screened for their PPO activities.
Mulberry leaf tissues showed the highest PPO activity against 4-methyl catechol
which was comparable to that of mushroom. Average Km and Vmax values of free
mulberry leaf PPOs were found as 7 mM and 218 U/ml, respectively. Mulberry leaf
PPOs were immobilized in a polypyrole matrix and the Km and Vmax values of
immobilized PPOs were calculated as 35 mM and 3 U/ml, respectively. Mulberry
leaf PPO was the most active at 45°C and pH 7. By using electrophoretic analysis,
iii

laccase and catechol oxidase type activities of PPOs and in addition, peroxidase
activity were detected. Molecular weights of laccase, peroxidase and catechol
oxidase were found to be about 62, 64 and 62-64 kDa, with pI values of 8.0-8.5, 4.5
and 10, sequentially.
Keywords: Enzyme isolation, polyphenol oxidase, laccase, peroxidase, catechol
oxidase, tyrosinase, immobilization, biochemical characterization.
iv
ÖZ
DUT (Morus alba) YAPRAK DOKULARINDAN POLİFENOL OKSİDAZ
İZOLASYONU, KARAKTERİZASYONU VE İMMOBİLİZASYONU
Sutay, Didem
Yüksek Lisans, Kimya Mühendisliği Bölümü
Tez Yöneticisi: Prof. Dr. Ufuk Bakır
Temmuz 2003, 98 sayfa
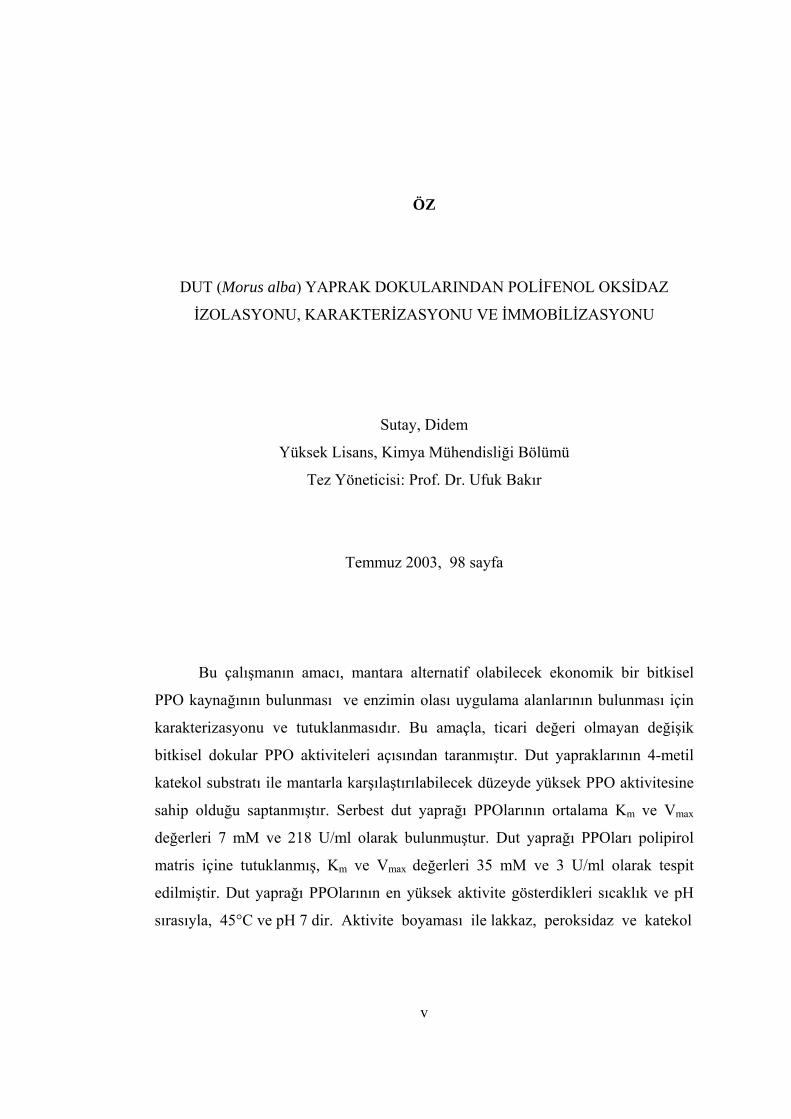
Bu çalışmanın amacı, mantara alternatif olabilecek ekonomik bir bitkisel
PPO kaynağının bulunması ve enzimin olası uygulama alanlarının bulunması için
karakterizasyonu ve tutuklanmasıdır. Bu amaçla, ticari değeri olmayan değişik
bitkisel dokular PPO aktiviteleri açısından taranmıştır. Dut yapraklarının 4-metil
katekol substratı ile mantarla karşılaştırılabilecek düzeyde yüksek PPO aktivitesine
sahip olduğu saptanmıştır. Serbest dut yaprağı PPOlarının ortalama Km ve Vmax
değerleri 7 mM ve 218 U/ml olarak bulunmuştur. Dut yaprağı PPOları polipirol
matris içine tutuklanmış, Km ve Vmax değerleri 35 mM ve 3 U/ml olarak tespit
edilmiştir. Dut yaprağı PPOlarının en yüksek aktivite gösterdikleri sıcaklık ve pH
sırasıyla, 45°C ve pH 7 dir. Aktivite boyaması ile lakkaz, peroksidaz ve katekol
v

oksidaz aktiviteleri tespit edilmiştir. Lakkazın, peroksidazın ve katekol oksidazın
moleküler ağırlıkları sırasıyla yaklaşık 62, 64 ve 62-64 kDa olarak tespit edilmiştir.
İzoelektrik nokta incelemesiyle de lakkaz, peroksidaz ve katekol oksidazın
izoelektrik noktaları (pI) sırasıyla yaklaşık 8.0-8.5, 4.5 ve 10 olarak bulunmuştur.
Anahtar Sözcükler: Enzim izolasyonu, polifenol oksidaz, lakkaz, peroksidaz,
katekol oksidaz, tirosinaz, tutuklama, biyokimyasal karakterizasyon.
vi

To My Parents
vii
ACKNOWLEDGEMENT
I wish to express my sincere appreciation to Prof. Dr. Ufuk Bakır for her
valuable guidance, supervision and understanding throughout the research. She
made this study possible by helping and encouraging me in all stages of my M. Sc.
work.
I would like to thank Prof. Dr. Zümrüt B. Ögel for her help and valuable
critism on electrophoresis experiments and Prof. Dr. Levent Toppare for his support
on enzyme immobilization studies.
I wish to extend my thanks to Assoc. Prof. Dr. Pınar Çalık for her help and
understanding throughout the experimental studies in the laboratory.
My special thanks are due to Erhan Astarcı, Sibel Mete, Banu Eyüboğlu, and
Gökhan Duruksu for their support in electrophoresis experiments and Senem Kıralp
for her help in enzyme immobilization studies. Love and thanks also go to my
laboratory friends for their support and friendship.
Finally, I want to express my deepest gratitude and love to all my family,
especially to my parents Neriman-Erkan Sutay and my sister Duygu Sutay for their
patience, encouragement, support and tolerance all through the study.
viii
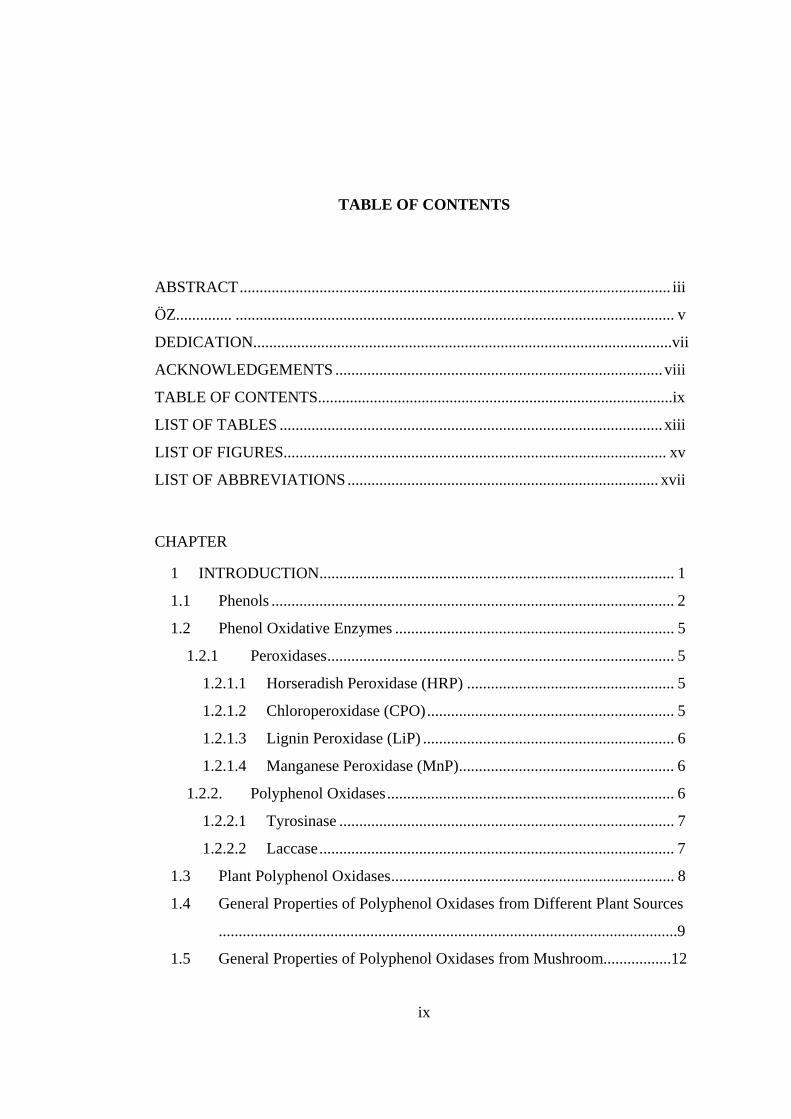
TABLE OF CONTENTS
ABSTRACT............................................................................................................ iii
ÖZ.............. .............................................................................................................. v
DEDICATION.........................................................................................................vii
ACKNOWLEDGEMENTS .................................................................................. viii
TABLE OF CONTENTS.........................................................................................ix
LIST OF TABLES ................................................................................................ xiii
LIST OF FIGURES................................................................................................ xv
LIST OF ABBREVIATIONS.............................................................................. xvii
CHAPTER
1 INTRODUCTION......................................................................................... 1
1.1 Phenols ..................................................................................................... 2
1.2 Phenol Oxidative Enzymes ...................................................................... 5
1.2.1 Peroxidases....................................................................................... 5
1.2.1.1 Horseradish Peroxidase (HRP) .................................................... 5
1.2.1.2 Chloroperoxidase (CPO).............................................................. 5
1.2.1.3 Lignin Peroxidase (LiP) ............................................................... 6
1.2.1.4 Manganese Peroxidase (MnP)...................................................... 6
1.2.2. Polyphenol Oxidases........................................................................ 6
1.2.2.1 Tyrosinase .................................................................................... 7
1.2.2.2 Laccase......................................................................................... 7
1.3 Plant Polyphenol Oxidases....................................................................... 8
1.4 General Properties of Polyphenol Oxidases from Different Plant Sources
...................................................................................................................9
1.5 General Properties of Polyphenol Oxidases from Mushroom.................12
ix
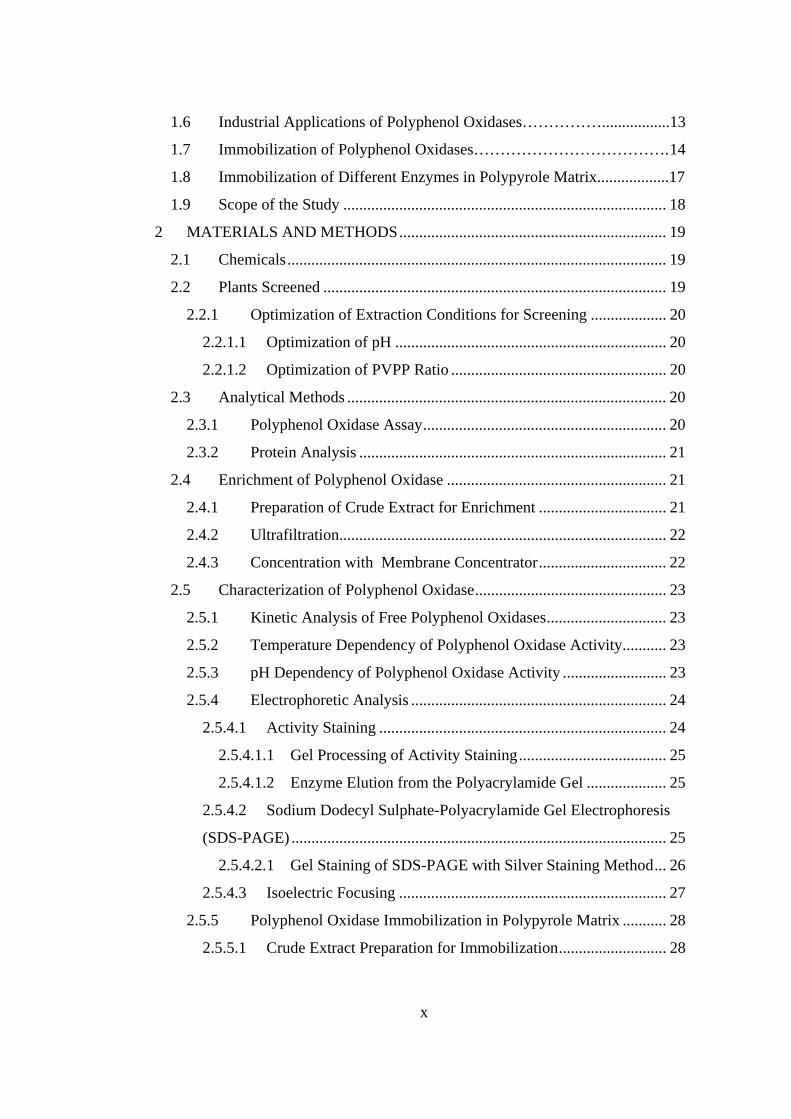
1.6 Industrial Applications of Polyphenol Oxidases…………….................13
1.7 Immobilization of Polyphenol Oxidases……………………………….14
1.8 Immobilization of Different Enzymes in Polypyrole Matrix..................17
1.9 Scope of the Study ................................................................................. 18
2 MATERIALS AND METHODS................................................................... 19
2.1 Chemicals............................................................................................... 19
2.2 Plants Screened ...................................................................................... 19
2.2.1 Optimization of Extraction Conditions for Screening ................... 20
2.2.1.1 Optimization of pH .................................................................... 20
2.2.1.2 Optimization of PVPP Ratio ...................................................... 20
2.3 Analytical Methods ................................................................................ 20
2.3.1 Polyphenol Oxidase Assay............................................................. 20
2.3.2 Protein Analysis ............................................................................. 21
2.4 Enrichment of Polyphenol Oxidase ....................................................... 21
2.4.1 Preparation of Crude Extract for Enrichment ................................ 21
2.4.2 Ultrafiltration.................................................................................. 22
2.4.3 Concentration with Membrane Concentrator................................ 22
2.5 Characterization of Polyphenol Oxidase................................................ 23
2.5.1 Kinetic Analysis of Free Polyphenol Oxidases.............................. 23
2.5.2 Temperature Dependency of Polyphenol Oxidase Activity........... 23
2.5.3 pH Dependency of Polyphenol Oxidase Activity .......................... 23
2.5.4 Electrophoretic Analysis ................................................................ 24
2.5.4.1 Activity Staining ........................................................................ 24
2.5.4.1.1 Gel Processing of Activity Staining..................................... 25
2.5.4.1.2 Enzyme Elution from the Polyacrylamide Gel .................... 25
2.5.4.2 Sodium Dodecyl Sulphate-Polyacrylamide Gel Electrophoresis
(SDS-PAGE) .............................................................................................. 25
2.5.4.2.1 Gel Staining of SDS-PAGE with Silver Staining Method... 26
2.5.4.3 Isoelectric Focusing ................................................................... 27
2.5.5 Polyphenol Oxidase Immobilization in Polypyrole Matrix ........... 28
2.5.5.1 Crude Extract Preparation for Immobilization........................... 28
x

2.5.5.2 Immobilization of Polyphenol Oxidases in Polypyrole Matrix . 28
2.5.5.3 Kinetic Analysis of Immobilized Polyphenol Oxidases ............ 29
2.5.5.4 Stability of Immobilized Polyphenol Oxidases.......................... 29
3 RESULTS AND DISCUSSION .................................................................... 30
3.1 Screening Tissues of Different Plants for Polyphenol Oxidase Activity30
3.1.1 Optimization of Polyphenol Oxidase Screening Conditions ......... 31
3.1.1.1 Optimization of Extraction Conditions ...................................... 31
3.1.2 Screening Results of Plant Tissues for Polyphenol Oxidase Activity 33
3.2 Enrichment of Polyphenol Oxidase ....................................................... 34
3.3 Biochemical Characterization of Partially Purified Mulberry Polyphenol
Oxidases ............................................................................................................. 35
3.3.1 Kinetic Analysis of Free and Immobilized Polyphenol Oxidases . 35
3.3.1.1 Kinetic Analysis of Free Polyphenol Oxidases.......................... 35
3.3.1.2 Kinetic Analysis of Immobilized Polyphenol Oxidases ............ 44
3.3.2 Stability of Immobilized Polyphenol Oxidases.............................. 46
3.3.3 Temperature Dependency of Polyphenol Oxidase Activity........... 48
3.3.4 pH Dependency of Polyphenol Oxidase Activity .......................... 49
3.3.5 Determination of the Type of Polyphenol Oxidases by Activity
Staining on Polyacrylamide Gel..................................................................... 49
3.3.6 Molecular Weight Analysis of Mulberry Leaf Polyphenol
Oxidases..........................................................................................................54
3.3.7 Isoelectric Focusing Analysis of Mulberry Leaf Polyphenol
Oxidases..........................................................................................................57
4 CONCLUSIONS AND RECOMMENDATIONS ........................................ 62
REFERENCES....................................................................................................... 64
APPENDICES........................................................................................................ 74
A. Preparation of Bradford Reagent....................................................................... 74
B. Preparation of Protein Standard for Bradford Method.......................................75
C. BSA Standard Curve for Bradford Method...................................................... 77
D. Reagents and Gel Preparation for Polyphenol Oxidase Activity Staining of Slab
Gel...........................................................................................................................78
xi

E. Modified Activity Staining Method of Rescigno et al. (1997)......................... 83
F. Reagents and Gel Preparation for SDS-PAGE Slab Gel (Laemmli Buffer
System)................................................................................................................... 86
G. Silver Staining Method..................................................................................... 92
H. Isoelectric Focusing.......................................................................................... 94
I. Quick Coomassie Blue Staining Method for Isoelectric Focusing.................... 98
xii
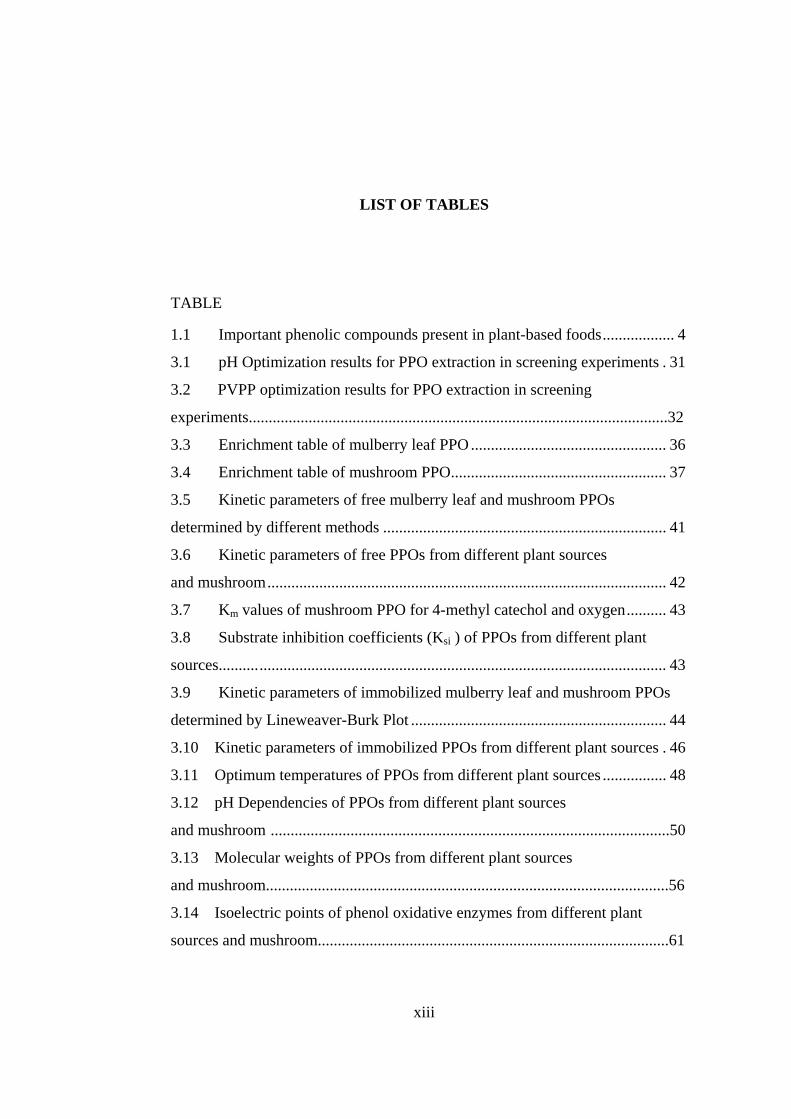
LIST OF TABLES
TABLE
1.1 Important phenolic compounds present in plant-based foods.................. 4
3.1 pH Optimization results for PPO extraction in screening experiments . 31
3.2 PVPP optimization results for PPO extraction in screening
experiments.........................................................................................................32
3.3 Enrichment table of mulberry leaf PPO................................................. 36
3.4 Enrichment table of mushroom PPO...................................................... 37
3.5 Kinetic parameters of free mulberry leaf and mushroom PPOs
determined by different methods ....................................................................... 41
3.6 Kinetic parameters of free PPOs from different plant sources
and mushroom.................................................................................................... 42
3.7 Km values of mushroom PPO for 4-methyl catechol and oxygen.......... 43
3.8 Substrate inhibition coefficients (Ksi ) of PPOs from different plant
sources................................................................................................................ 43
3.9 Kinetic parameters of immobilized mulberry leaf and mushroom PPOs
determined by Lineweaver-Burk Plot ................................................................ 44
3.10 Kinetic parameters of immobilized PPOs from different plant sources . 46
3.11 Optimum temperatures of PPOs from different plant sources ................ 48
3.12 pH Dependencies of PPOs from different plant sources
and mushroom ....................................................................................................50
3.13 Molecular weights of PPOs from different plant sources
and mushroom.....................................................................................................56
3.14 Isoelectric points of phenol oxidative enzymes from different plant
sources and mushroom........................................................................................61
xiii
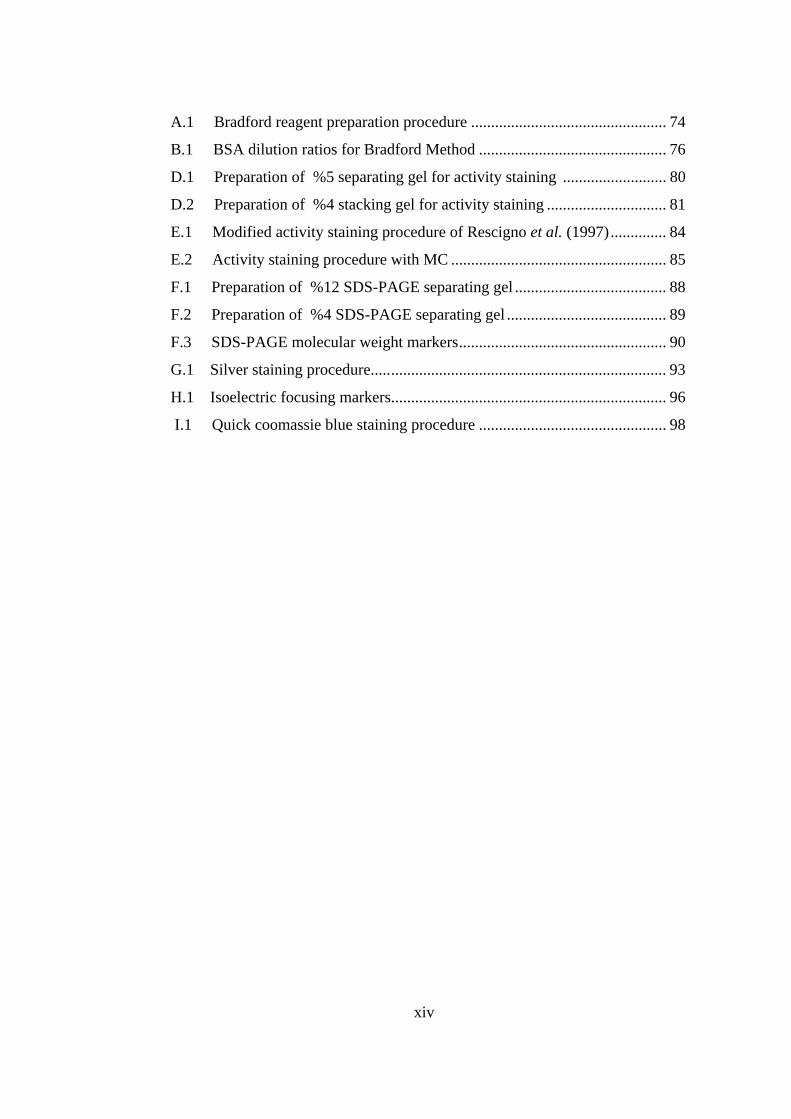
A.1 Bradford reagent preparation procedure ................................................. 74
B.1 BSA dilution ratios for Bradford Method ............................................... 76
D.1 Preparation of %5 separating gel for activity staining .......................... 80
D.2 Preparation of %4 stacking gel for activity staining .............................. 81
E.1 Modified activity staining procedure of Rescigno et al. (1997).............. 84
E.2 Activity staining procedure with MC ...................................................... 85
F.1 Preparation of %12 SDS-PAGE separating gel ...................................... 88
F.2 Preparation of %4 SDS-PAGE separating gel ........................................ 89
F.3 SDS-PAGE molecular weight markers.................................................... 90
G.1 Silver staining procedure.......................................................................... 93
H.1 Isoelectric focusing markers..................................................................... 96
I.1 Quick coomassie blue staining procedure ............................................... 98
xiv
LIST OF FIGURES
FIGURE
1.1 Hydroxylation of monophenols to o-diphenols by PPO activity ............. 1
1.2 Oxidation of o-diphenols to o-quinones by PPO activity ........................ 1
1.3 Simplest structure of phenol......................................................................3
1.4 Structure of 4-methyl catechol..................................................................3
2.1 Electrophoresis equipment ..................................................................... 24
2.2 Isoelectric focusing equipment .............................................................. 27
2.3 Immobilization equipment ..................................................................... 28
3.1 Screening results for PPO activity... ...................................................... 33
3.2 The effect of harvest time on PPO activity of mulberry leaf tissues .... 32
3.3 Lineweaver-Burk Plot for free mulberry leaf PPO ................................. 38
3.4 Lineweaver-Burk Plot for free mushroom PPO...................................... 39
3.5 Fitted Michaelis-Menten Curve of free mulberry leaf PPO ...................40
3.6 Fitted Michaelis-Menten Curve of free mushroom PPO ....................... 40
3.7 Fitted substrate inhibition model of free mushroom PPO...................... 41
3.8 Lineweaver-Burk Plot for immobilized mulberry leaf PPO .................. 45
3.9 Lineweaver-Burk Plot for immobilized mushroom PPO....................... 45
3.10 Storage stability of immobilized mushroom PPO.................................. 47
3.11 Operational stability of immobilized mulberry leaf and mushroom
PPOs....................................................................................................................47
3.12 Temperature dependency of mulberry leaf PPO activity......................... 48
3.13 pH dependency of mulberry leaf PPO activity ........................................ 49
3.14 Activity staining of mulberry leaf sample on slab gel with ADA and
H2O2....................................................................................................................51
xv
3.15 Activity staining of mulberry leaf sample on slab gel with tBC............. 52
3.16 Activity staining of mulberry leaf sample on slab gel with MC............. 53
3.17 Catechol oxidase activity with (a) and without (b) salicylhydroxamic acid
(inhibitor)..................... ...................................................................................... 54
3.18 Silver stained SDS-PAGE profile of PPO .............................................. 55
3.19 Standard curve for SDS-PAGE.... ...........................................................57
3.20 Coomassie blue stained isoelectric focusing markers............................. 58
3.21 Activity staining of mulberry leaf sample with ADA on isoelectric
focusing gel.......... .............................................................................................. 59
3.22 Activity staining of mulberry leaf sample with H2O2 on isoelectric
focusing gel.........................................................................................................59
3.23 Activity staining of mulberry leaf PPO with tBC on isoelectric focusing
gel.... ................................................................................................................... 60
C.1 BSA standard curve for Bradford Method ............................................... 77
xvi
LIST OF ABBREVIATIONS
ADA : 4-amino-N,N-diethylaniline
APS : Ammonium persulfate
BSA : Bovine serum albumin
CaA : Calcium aluminosilicate
CMC : Carboxymethylcellulose
CPE : Carbon paste electrode
CPO : Chloroperoxidase
FMN : Riboflavin-5-phosphate
H2O2 : Hydrogen peroxide
HRP : Horseradish peroxidase
ITO : Indium titanium oxide
L-DOPA : L-3,4-dihydroxyphenylalanine
LiP : Lignin peroxidase
MC : 4-methyl catechol
MM : Menthyl monomer
MnP : Manganese peroxidase
NaA : Sodium aluminosilicate
PCS : Poly(carbamoylsulfonate)
PPO : Polyphenol oxidase
PPy : Polypyrole
PVA-SbQ : Poly(vinyl alcohol) bearing strylpyridinium groups
PVPP : Polyvinyl polypyrolidone
Py : Pyrole
Rf : Relative mobility
SDS : Sodium dodecyl sulphate
SDS-PAGE : Sodium dodecyl sulphate-Polyacrylamide gel electrophoresis
xvii

SGE : Solid graphite electrode
SPCE : Screen printed carbon electrodes
tBC : 4-tert-butyl catechol
TEMED : N,N-tetramethylene-ethylenediamine
TPMMA : Thiopene capped poly(methyl methacrylate)
TX : Triton X
U : Enzyme activity unit
xviii
CHAPTER 1
INTRODUCTION
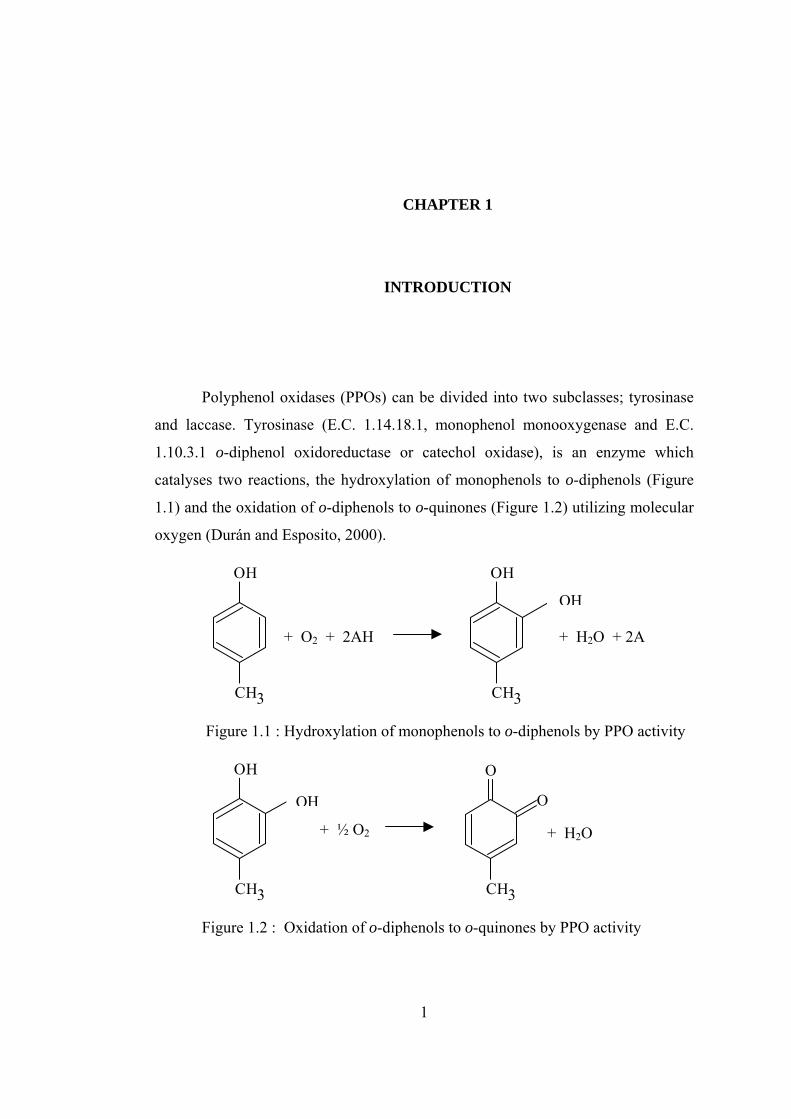
Polyphenol oxidases (PPOs) can be divided into two subclasses; tyrosinase
and laccase. Tyrosinase (E.C. 1.14.18.1, monophenol monooxygenase and E.C.
1.10.3.1 o-diphenol oxidoreductase or catechol oxidase), is an enzyme which
catalyses two reactions, the hydroxylation of monophenols to o-diphenols (Figure
1.1) and the oxidation of o-diphenols to o-quinones (Figure 1.2) utilizing molecular
oxygen (Durán and Esposito, 2000).
CH3
OH
OH
CH3
OH
+ O2 + 2AH + H2O + 2A
Figure 1.1 : Hydroxylation of monophenols to o-diphenols by PPO activity
OH
CH3 CH3
O
O
OH
+ ½ O2 + H2O
Figure 1.2 : Oxidation of o-diphenols to o-quinones by PPO activity
1
Laccase (E.C. 1.10.3.2, p-benzenediol: oxygen oxidoreductase) is also
referred as PPO but it catalyses generally p-phenols. Because the end product,
melanin, has a brown color, these reactions are called as browning reactions.
Although PPOs are widely distributed in nature, almost in all plants, animals and in
many microorganisms, mainly mushroom is used for commercial PPO production.
The main function of PPOs in most cases is pigmentation however, they have a
protective function in plants. Browning reactions make PPOs detrimental enzymes
in food industry since a rapid tissue browning and loss of nutritional quality are
consequences of bruises and cuts of fruits and vegetables. However, PPO activity is
essential for color formation of many plant based food products like tea, coffee,
cocoa, raisins and prunes (Tomás-Barberán and Espin, 2001).
1.1. Phenols
Phenolic compounds are plant secondary metabolites, having no apparent
role in the growth and development of the plant, are biosynthesized through the
shikimic acid pathway, from which they are produced using intermediates of
carbohydrate metabolism (Tomás-Barberán and Espin, 2001).
Phenols are shown with the general formula ArOH, where Ar is phenyl,
substituted phenyl, or one of the other aryl groups, such as naphthyl. Phenols are
generally named as derivatives of the simplest member of the family, phenol. The
methyl phenols are given the special name of cresols. Simplest structures of phenol
and the structure of a simple phenolic, 4-methyl catechol, were shown in Figures
1.3 and 1.4, respectively. However, phenolics can be very large in size, such as
condensed tannins. Different phenolics having relevant roles in food products
include oleuropein, hydroxyl benzoic acid derivatives, cinnamates, isoflavones,
lignans, stilbenes, anthocyanins, flavanones, chalcones and dihydrochalcones,
2
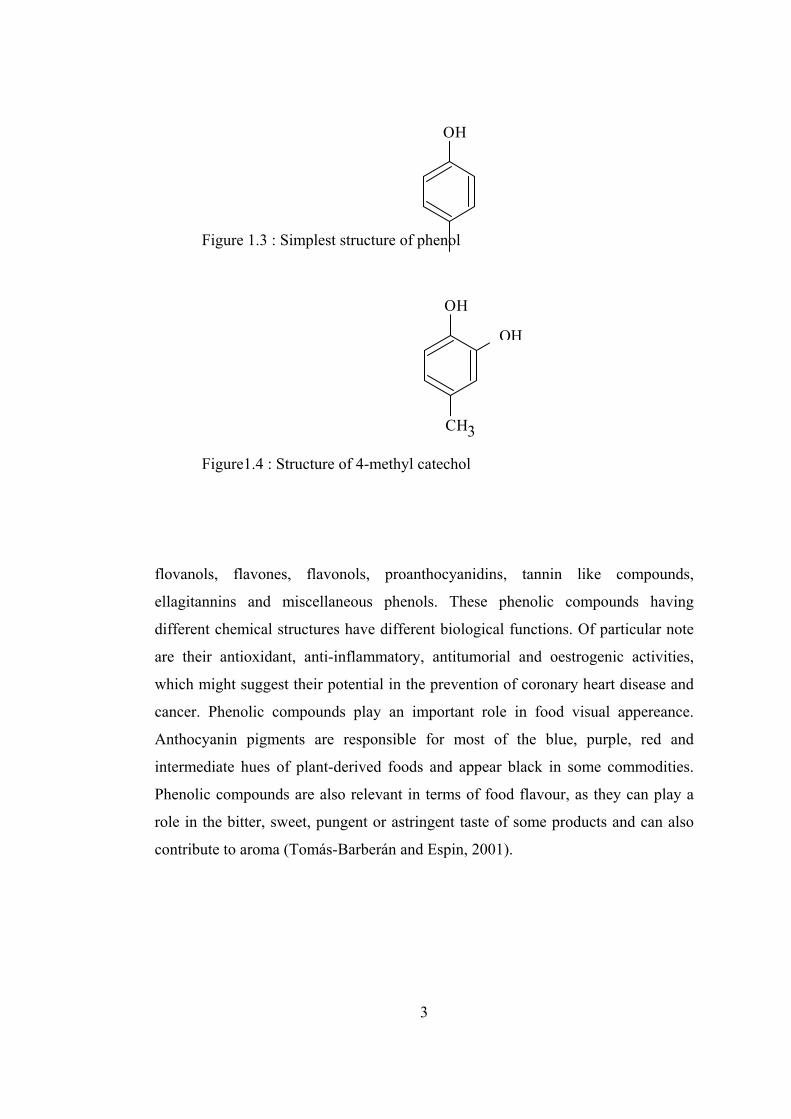
OH
Figure 1.3 : Simplest structure of phenol
OH
CH3
OH
Figure1.4 : Structure of 4-methyl catechol
flovanols, flavones, flavonols, proanthocyanidins, tannin like compounds,
ellagitannins and miscellaneous phenols. These phenolic compounds having
different chemical structures have different biological functions. Of particular note
are their antioxidant, anti-inflammatory, antitumorial and oestrogenic activities,
which might suggest their potential in the prevention of coronary heart disease and
cancer. Phenolic compounds play an important role in food visual appereance.
Anthocyanin pigments are responsible for most of the blue, purple, red and
intermediate hues of plant-derived foods and appear black in some commodities.
Phenolic compounds are also relevant in terms of food flavour, as they can play a
role in the bitter, sweet, pungent or astringent taste of some products and can also
contribute to aroma (Tomás-Barberán and Espin, 2001).
3
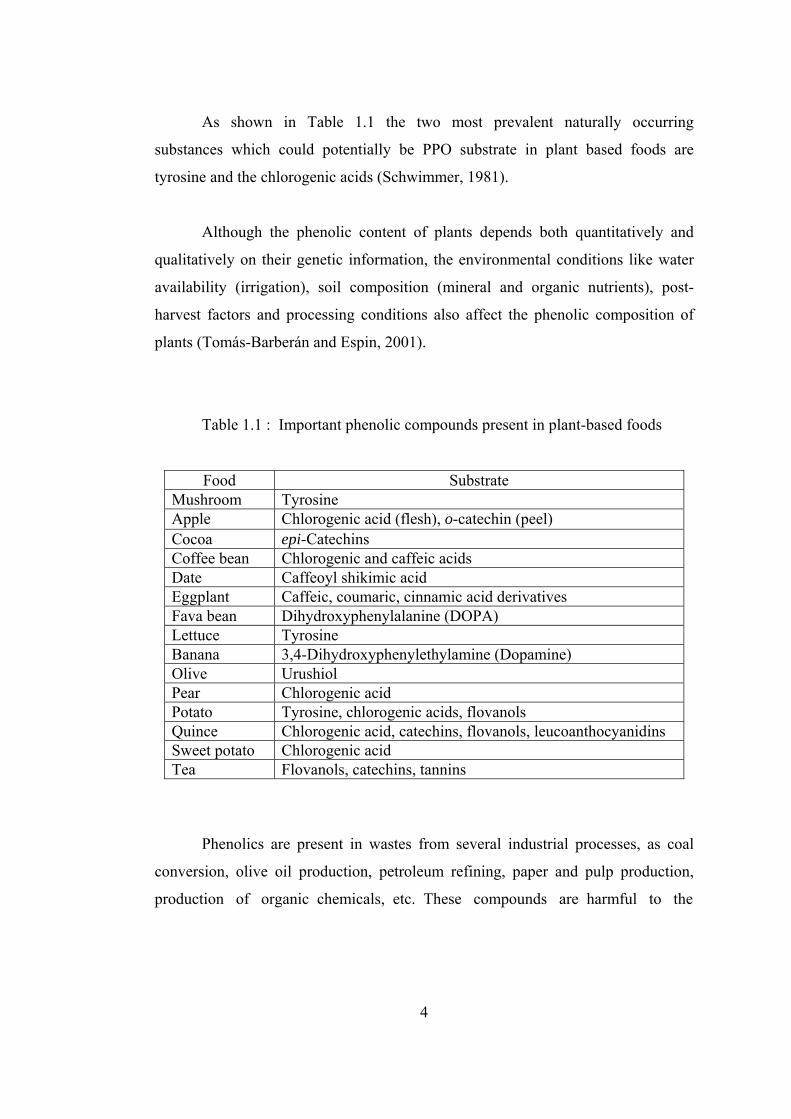
As shown in Table 1.1 the two most prevalent naturally occurring
substan
he environmental conditions like water
vailability (irrigation), soil composition (mineral and organic nutrients), post-
arvest factors and processing conditions also affect the phenolic composition of
plants (
.1 :
trate
ces which could potentially be PPO substrate in plant based foods are
tyrosine and the chlorogenic acids (Schwimmer, 1981).
Although the phenolic content of plants depends both quantitatively and
qualitatively on their genetic information, t
a
h
Tomás-Barberán and Espin, 2001).
Table 1 Important phenolic compounds present in plant-based foods
Food SubsMushroom Tyrosine Apple Chlorogenic acid (flesh), o-catechin (peel) Cocoa epi-Catechins Coffee bean Chlorogenic and caffeic acids Date Caffeoyl shikimic acid Eggplant oumaric, cinnamic acid derivatives Caffeic, cFava bean Dihydroxyphenylalanine (DOPA) Lettuce Tyrosine Banana 3,4-Dihydroxyphenylethylamine (Dopamine) Olive Urushiol Pear Chlorogenic acid Potato Tyrosine, chlorogenic acids, flovanols Quince Chlorogenic acid, catechins, flovanols, leucoanthocyanidins Sweet potato Chlorogenic acid
Flovanols, catechins, tannins
Tea
Phenolics are present in wastes from several industrial processes, as coal
conversion, olive oil production, petroleum refining, paper and pulp production,
production of organic chemicals, etc. These compounds are harmful to the
4
enviro addition, they give an undesirable taste
and odor to drinking water, even in very low concentrations (Russell and Burton,
1999).
1.2. Phenol Oxidative Enzymes
here are different types of phenol oxidative enzymes in nature. Two major
groups
1.2.1. Peroxidases
ns, produced mainly by a number
of micro-organisms and plant sources, which catalyze reactions in the presence of
hydrog
orseradish Peroxidase (HRP)
RP can catalyze the oxidation of phenols, biphenols, anilines, benzidines
and rel P is suitable for wastewater treatment
because it retains its activity over a broad pH and temperature range (Durán and
Esposi
1.2.1.2. Chloroperoxidase (CPO)
(Durán and Esposito, 2000).
nment, animals and humans and in
T
of these enzymes are peroxidases and PPOs.
Peroxidases (E.C. 1.11.1.7) are hemoprotei
en peroxide (Durán and Esposito, 2000).
1.2.1.1. H
H
ated heteroaromatic compounds. HR
to, 2000).
CPO from the fungus Caldoriomyces fumago has been reported to oxidize
several phenolic compounds and in addition, oxidation of ethanol to aldehyde and
oxidation of chloride ions occurred
5

CPO is capable of oxidizing chloride, bromide and iodide ions. Fluoride is
not a substrate for chloroperoxidase but is an inhibitor of the halogenation reaction.
Fluorid
binding
LiP’s are quite well known, especially those coming from the basidiomycete
as Phana-erochaete chrysosporium and few in ascomycetes. LiP from different
sources was shown to mineralize a variety of recalcitrant aromatic compounds and
to oxid phenolic compounds (Durán and
Esposi
MnP catalyzes the oxidation of several monoaromatic phenols and aromatic
yes, but depends on both divalent manganese and certain types of buffers. The
nzyme requirement for high concentrations of Mn (III) makes its feasibility for
wast the free form, MnP acts on phenols and dyes
(Durán and Esposito, 2000).
PPOs are oxidoreductases that catalyze oxidation of phenolic compounds.
hey are subdivided into two subclasses, tyrosinases and laccases, and both groups
act with oxygen and no cofactors are needed (Durán and Esposito, 2000).They
e ions compete for both the hydrogen peroxide and the halogen anion
sites of chloroperoxidase.
1.2.1.3. Lignin Peroxidase (LiP)
ize a number of polycyclic aromatic and
to, 2000).
1.2.1.4. Manganese Peroxidase (MnP)
d
e
ewater treatment applications. In
1.2.2. Polyphenol Oxidases
T
re
6
catalyze the transformation of a large number of phenolic and non-phenolic
aromat
ans of the same organisms, such as in roots and leaves
of higher plants. It is well known that tyrosinase catalyses two different oxygen-
dependent reactions that occur consequently: the o-hydroxylation of monophenols
to yield lase activity) and the subsequent oxidation of o-diphenols
to o-quinones (catecholase activity). Chemical and spectroscopic studies of
tyrosin
lated diphenylmethanes, benzopyrenes, N-
substitu
g to specific spectroscopic and functional
haracteristics (Durán et al, 2002).
ic compounds (Durán et al., 2002).
1.2.2.1. Tyrosinase
Tyrosinase (E.C. 1.14.18.1, monophenol monooxygenase and E.C. 1.10.3.1,
o-diphenol oxidoreductase or catechol oxidase) is widely distributed throughout the
phylogenetic scale from bacteria to mammals and even present different
characteristics in different org
o-diphenols (creso
ase have shown that the active site contains a coupled binuclear copper
complex (Durán et al, 2002).
1.2.2.2. Laccase
Laccase (E.C. 1.10.3.2, p-benzenediol: oxygen oxidoreductase) is a
cuproprotein belonging to a small group of enzymes denominated blue oxidases.
Laccase catalyzes the oxidation of various aromatic compounds; phenolic dyes,
phenols, chlorophenols, lignin-re
ted p-phenylenediamines, organophosphorus and non-phenolic beta-O-
lignin model dimer with the concomitant reduction of oxygen to water. In general,
laccases exhibit four copper atoms, which play an important role in the enzyme
catalytic mechanism. Copper atoms are distributed in different binding sites and are
classified in three types, accordin
c
7
In a typical laccase reaction, a phenolic substrate is subjected to a one-
lectron oxidation giving rise to an aryloxyradical. This active species can be
converted to a quinone in the second stage of oxidation. The quinone as well as the
free radical product undergo non-enzymatic coupling reactions leading to
polyme
e (Murata et al., 1997), mango kernel (Arogba et al., 1998), iceberg
ttuce (Chazarra et al., 1999), apple leaf (Ridgway and Tucker, 1999), litchi fruit
iang et al., 1999), raspberry fruits (González et al., 1999), desert truffle (Pérez-
Gilaber l.,
1996 and 1999), coffee (Mazzafera and Robinson, 2000), Duranta plumieri (Roy et
al., 2002), rubber tree seeds (Wititsuwannakul et al., 2002), medlar fruit (Dincer et
al., 200
e
rization (Durán et al., 2002).
1.3. Plant Polyphenol Oxidases
Since PPOs are widely distributed in plants, there are many studies in the
literature about plant PPOs.
PPOs were isolated from dates (Hasegawa and Maier, 1980), grape
(Wissemann and Lee, 1980 and Sánchez-Ferrer et al., 1988), banana (Galeazzi et
al., 1981), wild potato (Ryan et al., 1982), air potato (Anosike and Ayaebene,
1982), avocado (Kahn, 1983 and Lelyveld et al., 1984 ), apple (Goodenough et al.,
1983), pear (Smith and Montgomerry, 1985), spinach (Sánchez-Ferrer et al.,
1989, Hind et al., 1995 and Sheptovitsky and Brudvig, 1996), strawberry
(Wesche-Ebeling and Montgomery, 1990), mung bean leaf (Shin et al., 1997),
highbush blueberry fruit (Kader et al.,1997), tobacco (Richardson and McDougall,
1997), appl
le
(J
t et al., 2001), apricot fruit (Chevalier et al., 1999), potato (Partington et a
2).
8
1.4. General Properties of Polyphenol Oxidases from Different Plant
Sources
PPOs from different plant sources were investigated in terms of optimum
pH, optimum temperature, molecular weight, isoelectric point and kinetic properties
in literature.
Ridgway and Tucker (1999) partially purified apple PPO by using a method
suitable for commercial application. Concentration of polyvinyl pyrrolidine (PVP)
in enzy
as purified 50-fold by the
use of DEAE-Sephadex and ultrafiltration. Using 4-methyl catechol as substrate
partiall
a indica) kernel.
The enzyme was most active at pH 6.0 and 25°C. Michaelis Menten constant, Km,
was fou
by
four isozymes gave a
polypeptide molecular weight (SDS-PAGE) of 31 ± 1 kDa. The isoelectric point
determ ed by isoelectric focusing on polyacrylamide gel was 5.2.
tively. The purified enzyme had a pH
optimum of 6.0 and a pI of 5.1. Km for L-DOPA was 24 mM.
me extraction was optimized. The yield of PPO extracted from leaf tissue
was found to be greater than that from fruit and apple leaves were observed as a
suitable PPO source for commercial application. PPO w
y purified PPO had a specific activity of 4.9 µkat mg-1 and Km value of 3.6
mM.
Arogba et al. (1998) investigated PPO in mango (Mangifer
nd to be 24.6 mM by using catechol as substrate.
Galeazzi et al. (1981) purified PPO from banana. 38.8-fold purification
acetone precipitation was achieved. The purified enzyme with
in
Shin et al. (1997) isolated and characterized PPO from mung bean leaf. A
mature form of PPO, purified from leaf chloroplasts, contained two proteins with
subunit Mr values of 65 and 59 kDa, respec
9
Chevalier et al. (1999) studied molecular cloning and characterization of
apricot fruit PPO. They calculated PPO molecular weight as 67.1 kDa and the
isoelectric point of 6.84 where the mature protein had a predicted molecular mass of
56.2 kD
The enzyme had a maximum
activity over a wide pH range, 4.5-6.5, and was relatively heat stable.
ard (p-hydroxyphenyl)
propionic acid showed a maximum at pH 5. Kinetic parameters, Km and Vmax were
found t
e protein with a molecular weight of about 75.6 kDa by Sephadex G-100
filtration and a 108-fold purification of PPO was achieved.
ed
fraction
3 ∆OD/min per 20µl, respectively.
a and an isoelectric point of 5.84.
Hasegawa and Maier (1980) purified PPO from dates by ammonium
sulphate precipitation, followed by two successive DEAE-cellulose columns, which
resulted in a 510-fold increase in specific activity.
Chazarra et al. (1999) characterized monophenolase activity of PPO from
iceberg lettuce by using (p-hydroxyphenyl) propionic acid with 3-methyl-2-
benzothiazolinone hydrazone. Monophenolase activity tow
o be 6.3 mM and 11.9 µM/min, respectively.
Jiang et al. (1999) purified PPO and investigated the browning control of
litchi fruit by glutathione and citric acid. PPO was purified from litchi peel yielding
a singl
Kader et al. (1997) partially purified and characterized blueberry fruit PPO.
They achieved 19-fold purification by ultrafiltration, ammonium sulphate
precipitation and hydrophobic chromatography. Native-PAGE of the purifi
revealed the presence of two isoforms. PPO activity showed a maximum at
pH 4.
Kahn (1983) studied avocado PPO. PPO molecular weights were determined
by Sephacryl S-300 gel filtration in 4 fractions with molecular weights of 87.5 kDa-
500 kDa. Their kinetic parameters, Km and Vmax, determined with 4-methyl catechol
were in the range of 1.0-2.2 mM and 0.09-1.3
10
Wititsuwannakul et al. (2002) investigated purification and characterization
PPO fr
trates were 2.08, 8.33 and 9.09 mM, while those for PPO-II
were 2.12, 4.76 and 7.14 mM, sequentially.
2000) purified and characterized PPO from the seeds of
field bean (Dolichos lablab). A combination of ammonium sulphate precipitation,
DEAE
Da laccase activity and resulted in a 10-fold purification and a 6-fold
increase in the recovery of oxidase activity. In contrast, hydrophobic interaction
chroma
om latex of Hevea brasiliensis. Acetone precipitation and CM-Sepharose
chromatography were performed, affording two PPOs having molecular weights of
32 and 34 kDa, respectively. Both PPOs possessed the same pI (9.2), optimum pH 7
and optimum temperature 35-45°C. The Km values of PPO-I for dopamine, L-DOPA
and catechol as subs
Pérez-Gilabert et al. (2001) studied partial purification, characterization and
histochemical localization of fully latent desert truffle (Terfezia claveryi Chatin)
PPO. The enzyme was partially purified by using phase partitioning in Triton X-114
(TX-114) and 2-fold purification was achieved from a crude extract with a 66%
recovery of activity.
Paul and Gowda (
-Sephacel chromatography, phenyl agarose chromatography and Sephadex
G-200 gel filtration were used. The purified enzyme had a molecular weight of 120
± 3 kDa and is a tetramer of 30 ± 1.5 kDa. Native-PAGE of the purified enzyme
revealed the presence of a single isoform with an observed pH optimum of 4.0. 4-
methyl catechol was the best substrate, followed by catechol and L-3,4-
dihydroxyphenylalanine.
Richardson and McDougall (1997) isolated a laccase-type PPO from
lignifying xylem of tobacco. A molecular weight of 100 kDa with non-denaturing
PAGE was observed. Ion-exchange chromatography on DEAE-Sepharose retained
this 100 k
tography was unsuccessful.
11
Wissemann and Lee (1980) purified grape PPO with hydrophobic
chromatography. The largest portion of PPO contained in one peak was clearly
separated from the bulk of the other material. Finally, 252-fold purification was
achieved.
P rotein
patatin from potato tuber by hydrophobic chromatography on octyl-Sepharose. The
purifie f
escigno et al. (1997) performed a single polyacrylamide gel
electro
l oxidase activities
were predicted on the gel and by using a PPO inhibitor, salicylhydroxamic acid, it
was pro
were predicted.
artington and Bolwell (1996) purified PPO free of the storage p
d PPO was ound to be a doublet of Mr 60 kDa and 69 kDa when analyzed by
SDS-PAGE with a Km 4.3 ± 0.3 mM for L-DOPA.
1.5. General Properties of Polyphenol Oxidases from Mushroom
R
phoresis for detection of laccase, peroxidase and catechol oxidase by using
commercial enzymes and crude mushroom extracts. The identification of one
particular activity in the presence of other enzymes was often difficult as enzymes
can oxidize the same substrates. Laccase, peroxidase and catecho
ved that catechol was oxidized by catechol oxidase, not only by laccase.
Zhang and Flurkey (1997) studied the PPOs in Portabella (mushroom). Two
tyrosinase (Rfs 0.23 and 0.27) and three laccase isoforms (Rfs 0.72, 0.76 and 0.81)
after native electrophoresis were observed and at least 10 tyrosinase isoforms after
isoelectric focusing, ranging from pI 4.45 to 5.9
Zhang et al. (1999) characterized tyrosinase from the cap flesh of Portabella
(mushroom). A native molecular weight of 41 kDa for the enzyme was obtained by
size exclusion chromatography, whereas SDS-PAGE indicated that the enzyme
contained a single subunit with a size of 48 kDa. Isolelectric focusing demonstrated
12
that the enzyme preparation, apparently homogeneous by electrophoresis, still
contained three isoforms of pI 5.1, 5.2 and 5.3.
Rescigno et al. (1997) investigated diafiltration in the presence of ascorbate
the purification of mushroom tyrosinase. During the extraction of tyrosinase, the
xidation of mushroom phenolics was avoided, keeping phenolic compounds in
their re mplete removal by
eans of a diafiltration apparatus was achieved. The method described was found
to be a
r
is purpose. A careful review of literature indicates that there have been a few
studies dealing with im
in
o
duced form throughout the extraction step. Their co
m
useful way to obtain an enzymic solution of tyrosinase, devoid phenolics and
melanic compounds.
1.6. Industrial Applications of Polyphenol Oxidases
PPOs have different applications in industrial processes like food and
medicine. These enzymes were also used to remove phenolics from waste waters.
Horticultural products suffer losses of quality and value between harvest and
consumption due to oxidation of the endogenous phenolic compounds resulting in
an undesired enzymatic browning. Determination of PPO activity has, therefore,
been of central importance for determining the quality of food products and their
shelf-life and hence a rapid, reliable and sensitive method estimating the PPO
activity in the horticulture products is desirable. Biosensors are ideally suited fo
th
mobilised tyrosinase enzymes and their use in estimating
corresponding substrates such as phenol, catechol, p-cresol and tert-butylcatechol.
In such applications the enzyme is generally immobilised into a matrix such as
carbon paste, nafion membrane, hydrogel, conducting polymers and natural
material such as chitosan (Dutta et al., 2001). PPOs were also used in food industry
for the improvement of flavor in tee, cocoa and coffee production (Motoda, 1979).
13
The selective recognition and oxidation of phenols by the enzyme
polyphenol oxidase to produce reactive o-quinones can be successfully exploited as
a waste minimization strategy for effluent treatment. However, although polyphenol
oxidase is effective in converting phenol and a number of associated derivatives to
their corresponding o-quinones, these o-quinones and the low molecular weight
polymers formed from them remain in the treated effluent. At low concentrations
the remaining colored products do not achieve high enough degrees of
polymerization to effectively precipitate from solution. Thus, the goal of reducing
the toxicity of the phenol-containing effluent is achieved, but the resultant treated
stream harge purposes. Therefore,
to com lete the wastewater treatment process, it is necessary to remove the
polyph
“immobilized enzyme” has been used to describe an enzyme that
has been chemically or physically attached to a water-insoluble matrix, polymerized
into a w
0).
is highly colored, which is unacceptable for disc
p
enol oxidase-generated polymerization products from the bioreactor
permeate stream (Edwards et al., 1999).
1.7. Immobilization of Polyphenol Oxidases
The term
ater-insoluble gel or entrapped within a water-insoluble gel matrix or water-
insoluble microcapsule. In all these cases, the localization of the enzyme was
achieved by producing water-insoluble, enzyme containing material (Zaborsky,
1973). After immobilization, some changes were observed in the enzymatic
activity, optimum pH and temperature, affinity to substrate and stability of enzymes
(Arica, 200
Several methods; adsorption, ionic binding, covalent binding, cross-linking,
matrix entrapment, membrane confinement or the combination of two or more of
these methods can be used for immobilization of enzymes (Hartmeier, 1988).
14
Among various techniques, the electrochemical polymerization (matrix entrapment)
appears as a simple and attractive avenue for fabricating biosensors (Besombes et
l., 1997).
PO.
d electrodes, i.e., plain bulk modified carbon paste
electrodes (CPEs), surface modified by simple adsorption to solid graphite
electro
odes remained, respectively, whereas the
tyrosinase bulk-modified CPE and adsorbed tyrosinase SGEs had lost virtually
100% o
a
Besombes et al. (1997) immobilized PPO in poly (amphiphilic pyrole)
enzyme electrodes via the incorporation of synthetic laponite-clay-nanoparticles,
where the presence of incorporated laponite particles within the electrogenated
polymer induced a strong improvement of the analytical performances of
amperometric biosensors based on polyphenol oxidase. It was found that the
presence of laponite allows to keep a higher specific activity for immobilized P
Boshoff et al. (1998) applied the combination of cross-linking, adsorption
and membrane confinement methods for PPO. Commercial PPO was immobilized
on the nylon membrane by using gluteraldehyde as cross-linking agent and on the
polyether-sulfone membrane by adsorption. The intermediate product of the PPO
reaction, 4-methyl catechol, was detected when the enzyme was immobilized on the
nylon membranes or was not immobilized, but they detected only the o-quinone
final product when polyethersulphone was used as the immobilization matrix.
The immobilization of tyrosinase on the graphite electrodes was studied by
Nistor et al. (1999). The operational and storage stability of tyrosinase biosensors
for different tyrosinase modifie
des (SGEs), and surface modified by the immobilization in Eastman AQ, a
polyester-sulphonic acid cation exchanger, and Nafion, a perfluorinated-
sulphonated ionomer, on the surface of both CP and SGEs were investigated. As a
result, after about 42 days 80% and 75% of the original response for the Eastman
and Nafion modified tyrosinase electr
f the original response.
15
Covalent binding method was studied by Arica (2000). PPO was covalently
immobilized onto carboxymethylcellulose (CMC) hydrogel beads. As a result, it
was found that immobilization onto CMC hydrogel beads made PPO more stable to
heat a
ers a good and reliable means for the
detection of monophenolase activity in food or horticulture products.
hang et al. (2002) made a disposable tyrosinase-peroxidase bi-enzyme
sensor
lization of PPO was
perform d via entrapment in conducting copolymers during electrochemical
nd storage, implying that the covalent immobilization imparted higher
conformational stability to the enzyme.
Dutta et al. (2001) immobilized tyrosinase by the incorporation of tiron as a
substrate into a polypyrole film deposited on indium titanium oxide (ITO) glass. It
was concluded that the present sensor off
Seetharam and Saville (2002) immobilized PPO on zeolite. The production
of L-3,4-dihydroxyphenylalanine (L-DOPA) from commercial mushroom tyrosinase
immobilized (by using gluteraldehyde) on chemically modified supports, sodium
aluminosilicate (NaA) and calcium aluminosilicate (CaA) (two separate forms of
zeolite) was studied. No loss of activity of the immobilized enzyme during 40-48 h
of repeated batch operations was observed.
C
system for amperometric detection of phenols. The phenol sensor uses
horseradish peroxidase modified screen-printed carbon electrodes (HRP-SPCEs)
coupled with immobilized tyrosinase prepared using poly(carbamoylsulfonate)
(PCS) hydrogels or a poly(vinyl alcohol) bearing strylpyridinium groups (PVA-
SbQ) matrix. As a result, they found that the comparison of the electrode responses
indicated the feasibility of the disposable sensor system for sensitive determination
of phenols.
Kiralp et al. (2003) immobilized PPO in copolymers of thiophene
functionalized menthyl monomer (MM) with pyrrole. Immobi
e
16
polymerization of pyrole. Optimum temperature of free PPO was found as 40°C
where ing MM
with pyrole, optimum temperature was increased to 60°C. After 10 assays,
remain
reparation and characterization of
polypyrole/invertase and polyamide/polypyrole/invertase electrodes under
conditi
pyrole-capped polyazotetrahydrofuran-block-
polystyrene copolymer matrices. Sodium dodecyl sulphate was found to be the best
supporting electrolyte. Results showed that conducting polymers can be used
su ization.
by using only pyrole, optimum temperature remained constant. By us
ing activity of electrodes were 60%. Kinetic parameters, Km and Vmax values
of free PPO, immobilized in PPy and immobilized in MM/Polypyrole PPOs were
determined as 4 mM and 11.2 µmol/min.mg protein, 100 mM and
0.11µmol/min.electrode, 200 mM and 0.10µmol/min.electrode
1.8. Immobilization of Different Enzymes in Polypyrole Matrix
Selampinar et al. (1997) immobilized invertase by electrochemical
polymerization of pyrole. The p
ons compatible with the enzyme were investigated. Results showed that
conducting polymers can be used successfully for the immobilization of invertase.
Erginer et al. (2000) immobilized invertase in functionalized copolymer
electrodes constructed with
ccessfully in invertase immobil
Alkan et al. (2001) immobilize urease in conducting polypyrole (PPy) and
block copolymers of thiopene-capped poly(methyl methacrylate) (TPMMA)
matrices by electropolymerization. As a result, TPMMA/PPy graft films showed
better properties in terms of enzymatic activity, amount of immobilized protein and
kinetic properties than PPy films.
17
1.9. Scope of the Study
The aim of this study was to find an economical plant source for PPO
roduction, characterization and immobilization of the PPOs for the ultimate
urpose of PPO electrode and/or immobilized PPO bioreactor development. For this
urpose, different plant tissues of no commercial value like horse chestnut fruits
nd leaves of many fruit trees were screened for PPO activities. Since mulberry
aves were found to have the highest PPO activity, PPO was partially purified from
is source by ultrafiltration and characterized in terms of kinetic parameters,
mperature and pH dependencies, PPO types (activity staining), molecular weights
nd isoelectric points. The enzyme was next immobilized in polypyrole matrix,
haracterized in terms of stabilities and kinetic parameters.
p
p
p
a
le
th
te
a
c
18
CHAPTER 2
MATERIALS AND METHODS
2.1. Chemicals
Acrylamide and bisacrylamide were purchased from Appli Chem Ltd.
Isoelectric focusing marker was obtained from SERVA Ltd. Other electrophoresis
and isoelectric focusing chemicals were purchased from BIO-RAD Lab. All other
chemicals were analytical grade and obtained from SIGMA Ltd. or MERCK Ltd.
companies.
2.2. Plants Screened
Horse chesnut fruit shells and leaves, mushroom, leaves of mulberry, pear,
sourcherry, apricot, cherry, apple, grape, quince and green shells of hazelnut were
screened for PPO activity. Mushroom was purchased from local market. Other plant
materials were collected from trees and collection dates were recorded. They were
stored at -20°C.
19
2.2.1. Optimization of Extraction Conditions for Screening
2.2.1.1. Optimization of pH
To determine the optimum pH, 10 g wet plant material was homogenized in
200 ml sodium phosphate buffer at pHs 6-8 at 4°C in a blender (ARCELIK Rollo
K-1350) for 4 x 15 sec. Extracts were centrifuged at 10,000xg for 10 minutes
(SIGMA) and filtered. The supernatants were used as the crude extracts at different
pHs. By comparing the enzyme activities in these extracts, optimum extraction pH
was determined.
2.2.1.2. Optimization of PVPP Ratio
Extractions were performed at the optimum pH (pH 7) by using polyvinyl
polypyrolidone (PVPP) at different concentrations in a range of 5-75 mg/ml to
precipitate phenols which can react with oxygen in the presence of PPOs.
2.3. Analytical Methods
2.3.1. Polyphenol Oxidase Assay
PPO activity was assayed by using 4-methyl catechol as substrate at the
observed optimum conditions. Crude extract was diluted 5 times by using sodium
phosphate buffer, pH 7. Reaction mixture contained 80 mg/ml substrate (1ml) and 5
times-diluted extract (1 ml). Absorbance data were collected with a time interval of
5 seconds for 30 seconds at room temperature at 410 nm in a spectrophotometer
(Heλios) (Jiang et al., 1999). Initial reaction rates were calculated from initial linear
part of the absorbance vs. time graphs. In PPO assay experiments, extractions were
20
repeated 2 times and 2 samples were taken from each extract. Results were
calculated by averaging these 4 data and error bars were inserted by calculating the
deviation from the average value.
One unit of PPO activity (U) was defined as 0.01 change in absorbance at
410 nm under given reaction conditions per minute.
2.3.2. Protein Analysis
Protein concentration was determined by using Bradford Method (Bradford,
1976). Bovine serum albumin (BSA) was used as the standard protein. Composition
of reagents, procedure and standard curve are given in Appendices A, B and C,
sequentially.
2.4. Enrichment of Polyphenol Oxidase
Ultrafiltration and membrane concentration methods were used for
enrichment of PPO.
2.4.1. Preparation of Crude Extract for Partial Purification
30 g plant material was homogenized in 200 ml pH 7 sodium phosphate
buffer at 4°C in a blender (ARCELIK Rollo K-1350) for 15 sec x 4. In order to
avoid the reaction of PPOs with phenols present in the extract, polyvinyl
polypyrolidone (PVPP) was added at a concentration of 12.5 mg/ml. Extract was
centrifuged at 10000xg for 10 minutes (SIGMA) and filtered. The supernatant was
used as the crude extract.
21
2.4.2. Ultrafiltration
Ultrafiltration was carried out in two steps in a 50 ml (Amicon) stirred cell at
room temperature. First, 70 ml crude extract was ultrafiltrated by using 0.22 µm
pored cellulose membrane to 50 ml to remove the coarse particles. Then, extract
was concentrated and enriched by using a 30 kDa cut-off cellulose membrane until
20 ml extract remains in the ultrafiltration cell. Pressure applied was 1.5 bar in each
step.
After each step, specific activities, yields and enrichment folds were
calculated with using following equations:
Total activity of concentrated enzyme (U) Specific Activity = Total protein (mg) Total activity of concentrated enzyme (U) Yield (%) = x 100 Total activity of crude enzyme (U) Specific activity of concentrated enzyme (U/mg) Enrichment Fold = Specific activity of crude enzyme (U/mg)
2.4.3. Concentration with Membrane Concentrator
5 ml of ultrafiltrated crude extract was further concentrated to 0.8 ml by
using a membrane concentrator (Vivapore) with a molecular weight cut-off of 7.5
kDa.
22
2.5. Characterization of Polyphenol Oxidase
2.5.1. Kinetic Analysis of Free Polyphenol Oxidases
To perform the kinetic analysis of mulberry leaf and mushroom PPOs,
activities at different concentrations of 4-methyl catechol (substrate) ranging from 0
to 75 mM were measured. By plotting PPO activity vs. time, Michaelis- Menten
type curve was obtained. Km and Vmax values were calculated from Lineweaver-
Burk Plot, non-linear regression analysis (Sigma Plot) and substrate inhibition
model (EZ-FIT, Perrella, 1988).
2.5.2. Temperature Dependency of Polyphenol Oxidase Activity
To determine the temperature dependency of PPOs, activities at different
temperatures ranging from 4 to 60°C were measured by using 5 times-diluted crude
extract and 80 mg/ml 4-methyl catechol in the reaction mixture.
2.5.3. pH Dependency of Polyphenol Oxidase Activity
To determine the pH dependency of PPOs, activities at different pHs ranging
from 4 to 9 were measured by using 5 times-diluted crude extract and 80 mg/ml 4-
methyl catechol in the reaction mixture. For pH 4 and 5 citrate phosphate buffer, for
pH 6 citrate phosphate and sodium phosphate buffer, for pH 7 sodium phosphate
buffer, for pH 8 tris buffer, for pH 9 glycine-sodiumhydroxide buffer was used. All
buffers were at a concentration of 100 mM.
23
2.5.4. Electrophoretic Analysis
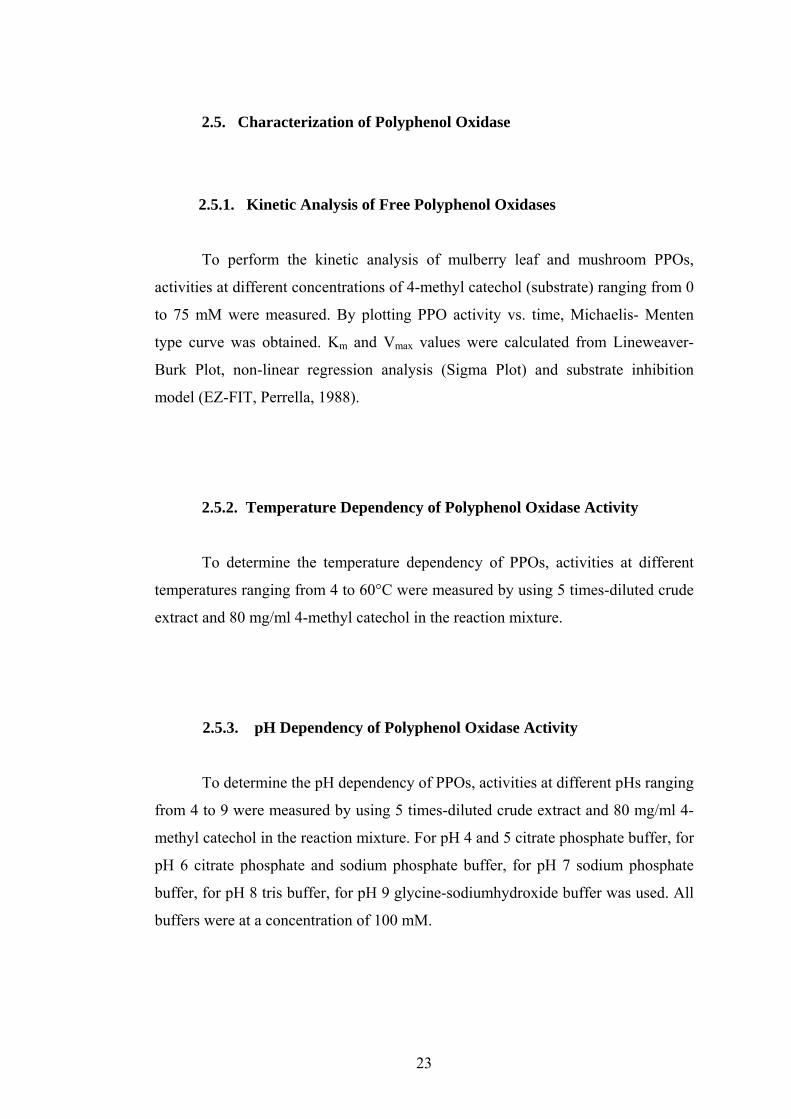
Electrophoretic analysis involved activity staining and sodium dodecyl
sulphate polyacrylamide gel electrophoresis (SDS-PAGE) studies. Experimental
setup, Bio-Rad Electrophoresis Equipment, was shown in Figure 2.1.
Figure 2.1 : Electrophoresis equipment
2.5.4.1. Activity Staining
Concentrated mulberry leaf extract by ultrafiltration was run in
polyacrylamide gel to separate proteins. For that purpose, electrophoresis was
carried out by using 4% polyacrylamide stacking gel and 5% polyacrylamide
separating gels containing no anionic detergent, SDS (Appendix D). 0.5 ml protein
sample was mixed with 1.0 ml sample buffer (Appendix D). Sample was loaded on
the gel in one well without denaturation. Separation was performed at a constant
current of 40 mA both in stacking and separating gels.
24
2.5.4.1.1. Gel Processing of Activity Staining
After electrophoretic run, two small portions of the gel was cut and stained
for different phenol oxidase activities depending on the modified procedure of
Rescigno et al. (1997). The procedure consisted of 4 steps including staining with
4-amino-N,N-diethylaniline (ADA) for laccase activity, with hydrogen peroxide
(H2O2) for peroxidase activity and with two substrates, 4-tert-butyl catechol (tBC)
and 4-methyl catechol, (MC) for catechol oxidase (PPO) activity with and without
salicylhydroxamic acid, a catechol oxidase inhibitor.
Preparation of reagents and procedure was given in Appendix E. After
taking a photograph of the gel, it was used for isolation of PPOs for molecular
weight determination (SDS-PAGE).
2.5.4.1.2. Enzyme Elution from Polyacrylamide Gel
After staining a small portion of the gel, thin parts corresponding to active
bands were cut from the remaining gel. Active bands were cut into pieces and
incubated in 0.75 ml pH 7 sodium phosphate buffer at 4°C in an eppendorf tube
overnight. Then, they were centrifuged and supernatant was taken as the enriched
sample.
2.5.4.2. Sodium Dodecyl Sulfate – Polyacrylamide Gel Electrophoresis
(SDS-PAGE)
Polyacrylamide gel electrophoresis in the presence of anionic detergent
(SDS) was carried out to check the purity of the isolated enzymes and to predict
their molecular weights. Electrophoresis was performed with 4% stacking gel and
12% separating gel. Samples were mixed with sample buffer by a volume ratio of
25

1:2 and were kept in boiling water for 5 minutes for denaturation. 20 µl of samples
and 5µl of molecular weight markers (Appendix F) were loaded on the gel.
Electrophoresis was performed at a constant current of 40 mA in stacking
and 50 mA in separating gels.
2.5.4.2.1. Gel Staining of SDS-PAGE with Silver Staining Method
Gels were stained with silver staining method after electrophoretic run was
completed using the procedure of Blum et al. (1987). Silver staining method was
performed in 6 steps including fixing, washing with 50% ethanol, pretreatment,
impregnation, developing and stopping. Preparation of reagents and the procedure
of silver staining method were given in Appendix G.
After staining, the gel was photographed. The molecular weights of enzymes
were determined by measuring the migration distance and by comparing them with
molecular weight markers.
The relative mobility (Rf) of each protein was determined by dividing its
migration distance from the top of gel to the center of the protein band by the
migration distance of the tracking dye from the top of the gel.
The equation of relative mobility (Rf) was given as:
Distance migrated by protein Rf = Distance migrated by tracking dye
26
2.5.4.3. Isoelectric Focusing
To determine the isoelectric points of PPOs present in mulberry leaves,
isoelectric focusing was carried out. For that purpose, concentrated crude extract,
prepared for activity staining was used. Preparation of reagents and the procedure
of isoelectric focusing were given in Appendix H.
Four µl of crude sample and pI markers were loaded on the gel. Gel was run
15 minutes at 100V, 15 minutes at 200 V and 30 minutes at 300 V. After
completing focusing, the part containing the marker was stained with quick
coomassie blue staining method (Appendix I) and sample containing part of the gel
was subjected to activity staining (Appendix E). Then they were matched to
determine the isoelectric points.
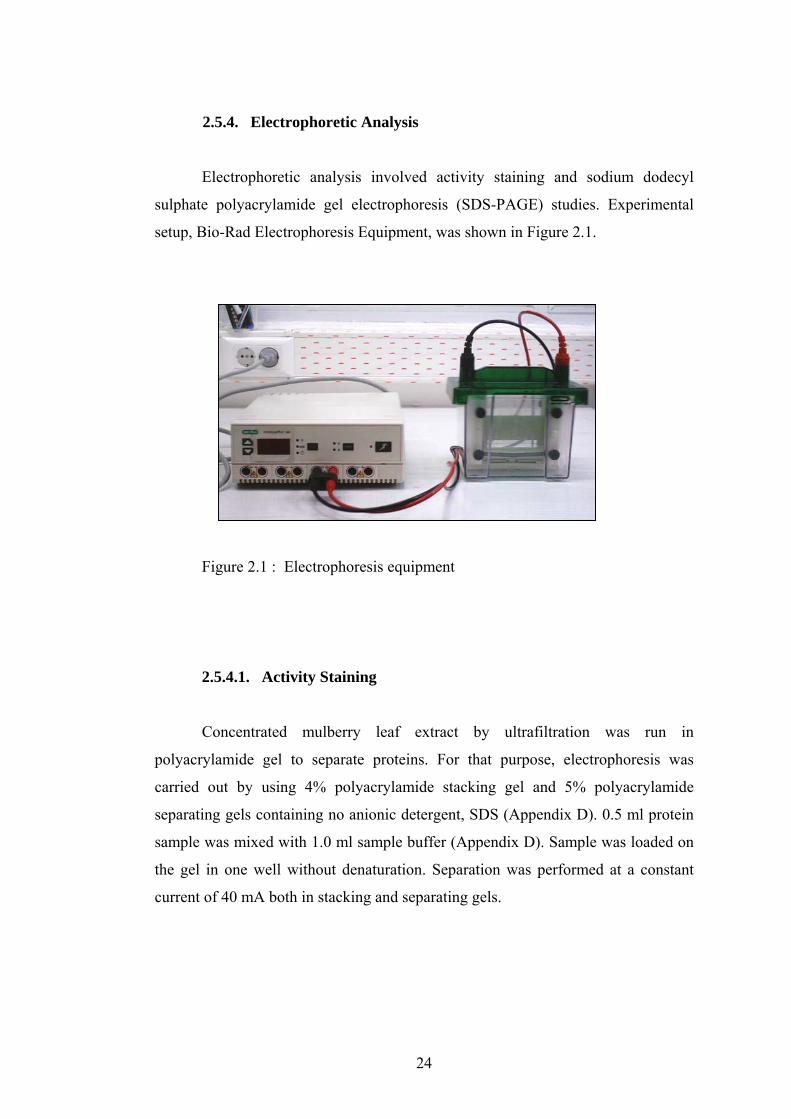
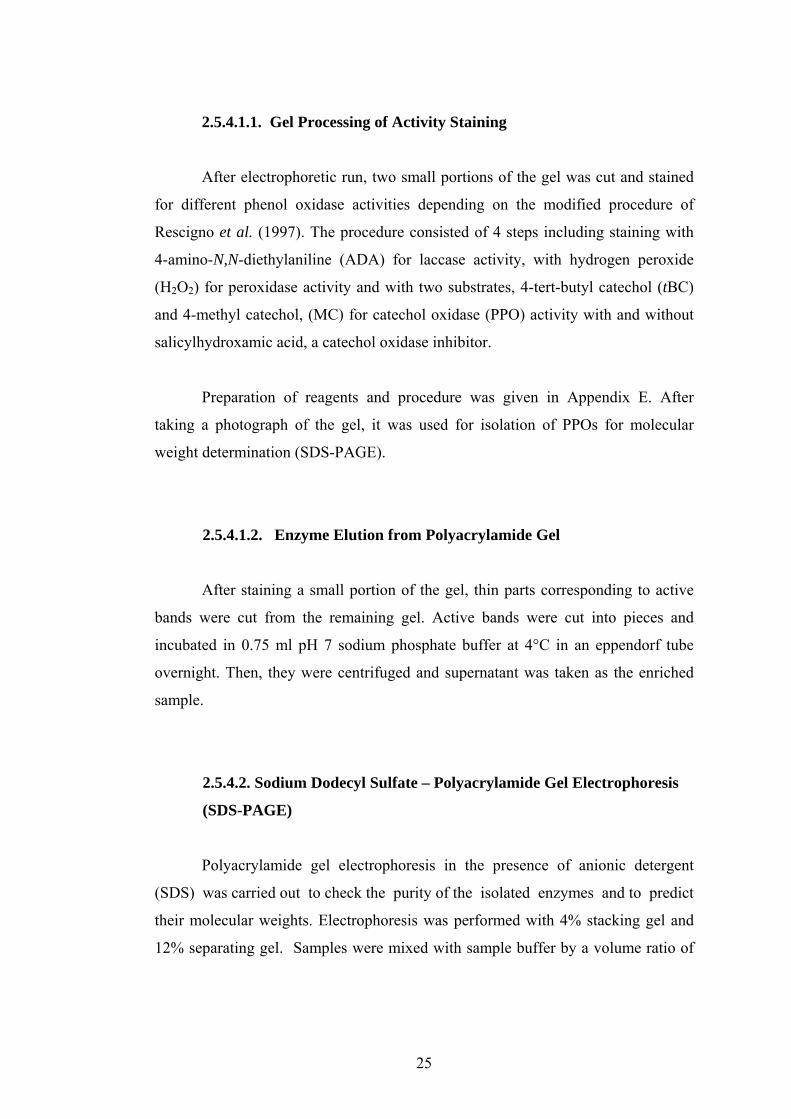
Experimental setup for isoelectric focusing, Bio-Rad Isoelectric Focusing
Equipment, was shown in Figure 2.2.
Figure 2.2 : Isoelectric focusing equipment
27
2.5.5. Polyphenol Oxidase Immobilization in Polypyrole Matrix
PPOs isolated from mulberry leaves were immobilized in polypyrole matrix.
Mushroom PPOs were also immobilized and used as a reference.
2.5.5.1. Crude Extract Preparation for Immobilization
In order to obtain a more concentrated extract, 50 g plant material was used
in extraction. The extraction procedure was the same as in Sec. 2.4.1.
2.5.5.2. Immobilization of Polyphenol Oxidases in Polypyrole Matrix
Immobilization of PPOs was achieved by electrochemical polymerization of
pyrole on Pt electrodes. For that purpose, immobilization was performed in a typical
3 electrode cell containing Pt working and counter electrodes and Ag reference
electrode by constant potential electrolysis (at +1.0 V) at room temperature.
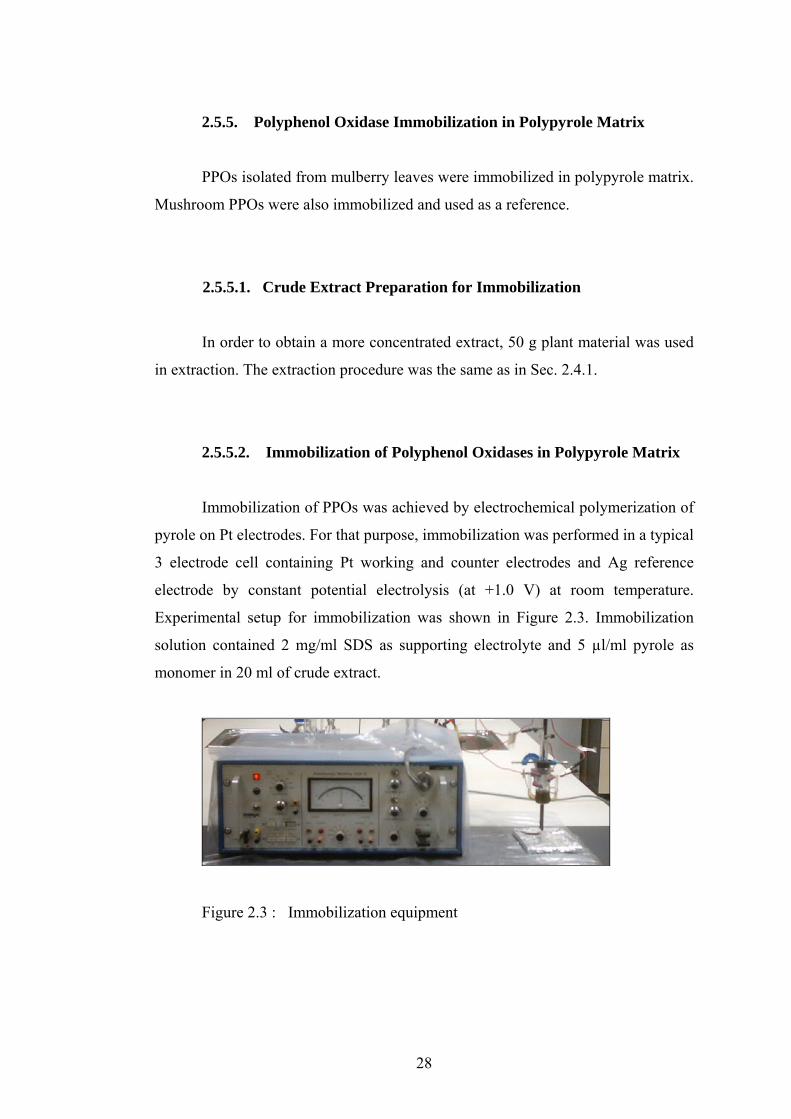
Experimental setup for immobilization was shown in Figure 2.3. Immobilization
solution contained 2 mg/ml SDS as supporting electrolyte and 5 µl/ml pyrole as
monomer in 20 ml of crude extract.
Figure 2.3 : Immobilization equipment
28
The pH chosen for an enzyme assay system must be near the optimum value.
Since enzymes are very sensitive molecules, a change in pH or temperature might
cause denaturation. During immobilization, protons were released into electrolysis
media during electropolymerization of pyrole which causes a decrease in pH of the
medium (Erginer et al., 2000). In order to prevent this, immobilization solution
were prepared with pH 7 sodium phosphate buffer.
After 30 minutes immobilization, enzyme entrapped electrode was removed
and washed with distilled water and sodium phosphate buffer, pH 7, to remove the
supporting electrolyte and unbound enzymes from the electrode surface. Electrodes
were stored in 10 ml of sodium phosphate buffer at pH 7 until use.
2.5.5.3. Kinetic Analysis of Immobilized Polyphenol Oxidases
To perform the kinetic analysis of the electrodes, activities at different
concentrations of 4-methyl catechol ranging from 0 to 300 mM were measured.
Electrodes were inserted into the reaction mixture in a test tube containing 5 ml of
4-methyl catechol at different concentrations. Spectrophotometric data at 410 nm
were recorded with a time interval of 2.5 minutes for 10 minutes. After observing
the Michaelis-Menten kinetics, Km and Vmax values were calculated by using
Lineweaver-Burk plot.
2.5.5.4. Stability of Immobilized Polyphenol Oxidases
Storage stability of immobilized mushroom PPO and operational stabilities
of immobilized mulberry leaf and mushroom PPOs were determined by using 5 ml
of 100 mM 4-methyl catechol. Absorbance data were collected at 410 nm with a
time interval of 2.5 minutes for 10 minutes.
29
CHAPTER 3
RESULTS AND DISCUSSION
3.1. Screening Tissues of Different Plants for Polyphenol Oxidase
Activity
Phenolics, the substrates of PPOs, are found in all plant cells in varying
quantities and forms. Phenolic concentration in some food products like wine
affects the product quality excessively. Therefore a practical and rapid measurement
of phenolic concentration during the process is very important and a simple PPO
electrode can be developed and used for this purpose. On the other hand, waste
streams of many chemical and food production plants, like olive oil and paper and
pulp industries contain high concentrations of phenolics. Since phenolics are
detrimental to the environment, they should be removed before waste disposal.
Water-soluble phenolics can be removed from the waste stream by using an
immobilized PPO membrane bioreactor which converts the phenolics into bulky
water-insoluble molecules.
Although PPOs are widely distributed in nature, almost all plants, animals
and in many microorganisms, mushroom is used for commercial production of these
enzymes. Therefore, the aim of this study was to find an economical plant source
for PPO production as an alternative to mushroom and to characterize the enzyme.
30
3.1.1. Optimization of Polyphenol Oxidase Screening Conditions
In this study, different plant tissues of no commercial value like fruits of
horse chestnut and leaves of many fruit trees, were screened in terms of PPO
activities. In the studies, mushroom was used as a reference which is a commercial
PPO source. Since horse chestnut and fruit trees are widely distributed in Turkey,
they could be a good and cheap source for PPO production. Therefore, screening
conditions were optimized by using horse chestnut tissues, which was our primary
target PPO source, and mushroom. Sour cherry, apple, pear and mulberry leaf
tissues were also used for pH optimization.
3.1.1.1. Optimization of PPO Extraction Conditions
The first step was the optimization of extraction pH. For this purpose, fruit
shell of horse chestnut, mushroom and leaves of sour cherry, pear and cherry were
used. Since the results of this experiment would be used in screening of other plant
tissues, no extreme pHs were tested. Experiments were carried out around neutral
pHs, 6-8, with sodium phosphate buffer. Results were given in Table 3.1
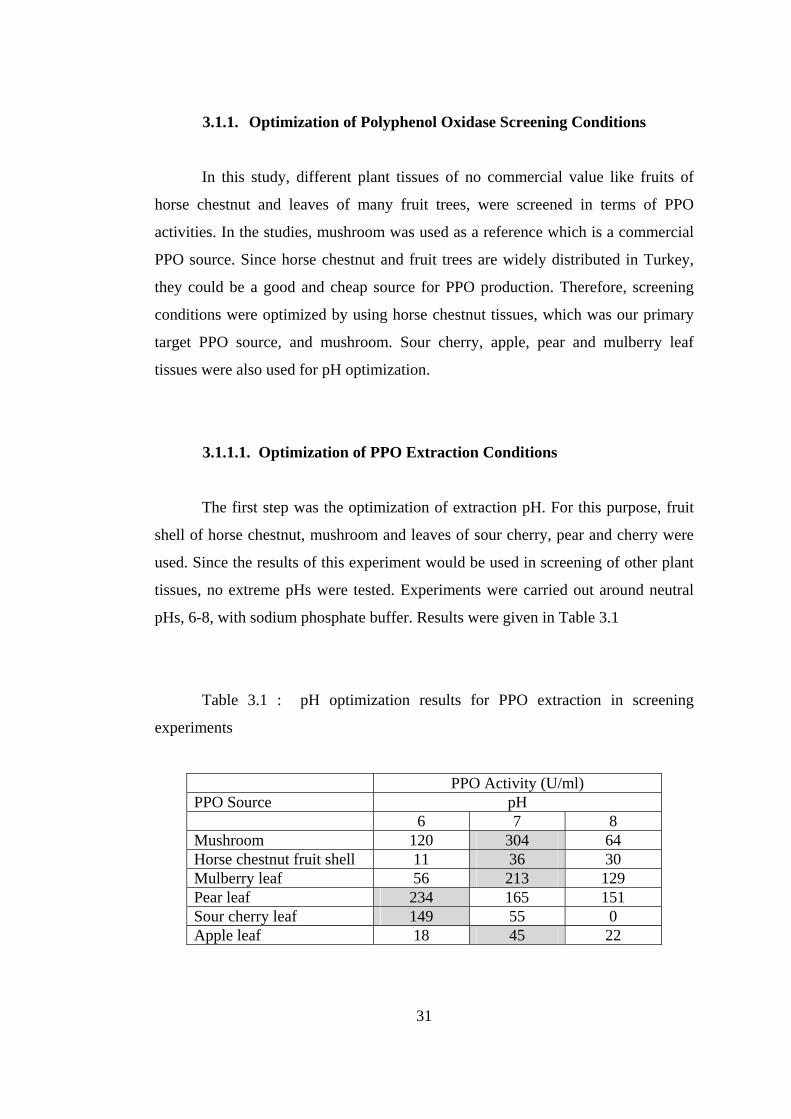
Table 3.1 : pH optimization results for PPO extraction in screening
experiments
PPO Activity (U/ml) PPO Source pH 6 7 8 Mushroom 120 304 64 Horse chestnut fruit shell 11 36 30 Mulberry leaf 56 213 129 Pear leaf 234 165 151 Sour cherry leaf 149 55 0 Apple leaf 18 45 22
31
Maximum PPO activities were observed at pH 7 except sour cherry and pear
leaf tissues. So, further screening experiments were carried out with using sodium
phosphate buffer at pH 7. Since sour cherry and pear leaf tissues showed high PPO
activities at pH 6 in the tested pH range, pH 6-8, they can be investigated for their
PPO activities at more acidic pHs for possible use in wine industry.
Second step was the optimization of PVPP ratio in extraction. PVPP has
been used during plant enzyme extractions due to its ability to hydrogen bond to
phenolics and prevent phenol-PPO interaction (Smith and Montgomery, 1985). For
this purpose, chestnut fruit shells were used as PPO source and PVPP was added at
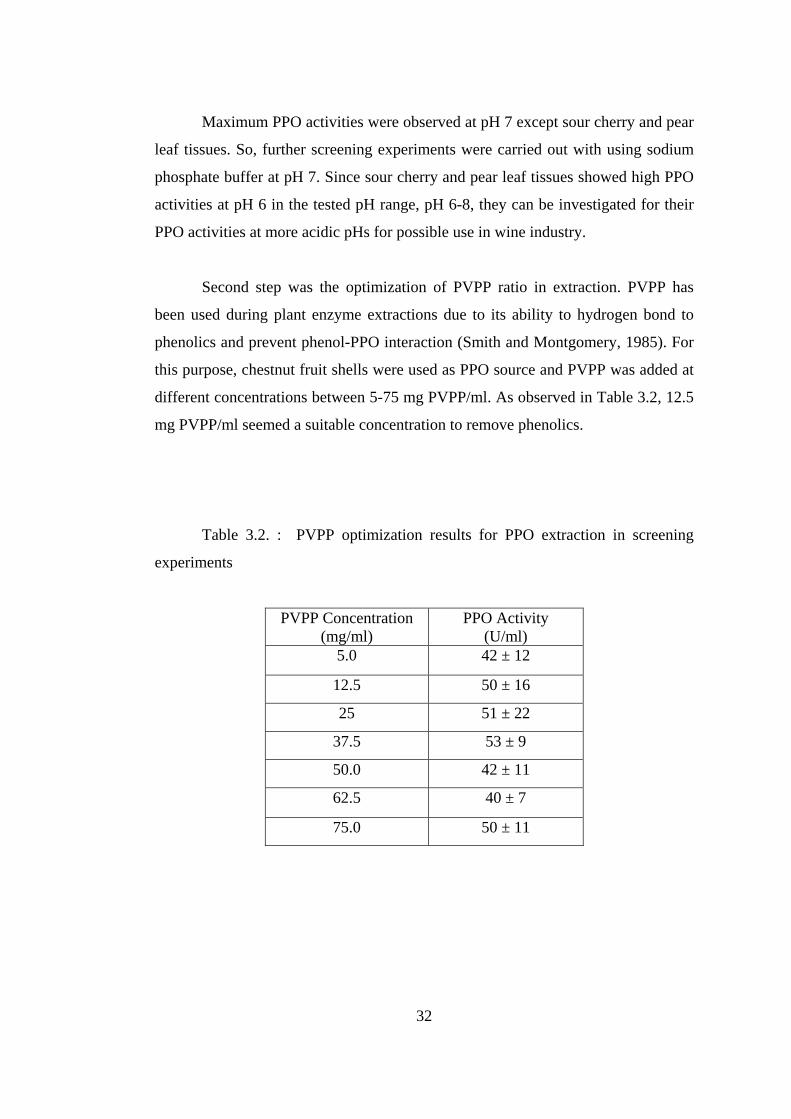
different concentrations between 5-75 mg PVPP/ml. As observed in Table 3.2, 12.5
mg PVPP/ml seemed a suitable concentration to remove phenolics.
Table 3.2. : PVPP optimization results for PPO extraction in screening
experiments
PVPP Concentration (mg/ml)
PPO Activity (U/ml)
5.0 42 ± 12
12.5 50 ± 16
25 51 ± 22
37.5 53 ± 9
50.0 42 ± 11
62.5 40 ± 7
75.0 50 ± 11
32
3.1.2. Screening Results of Plant Tissues for Polyphenol Oxidase
Activity
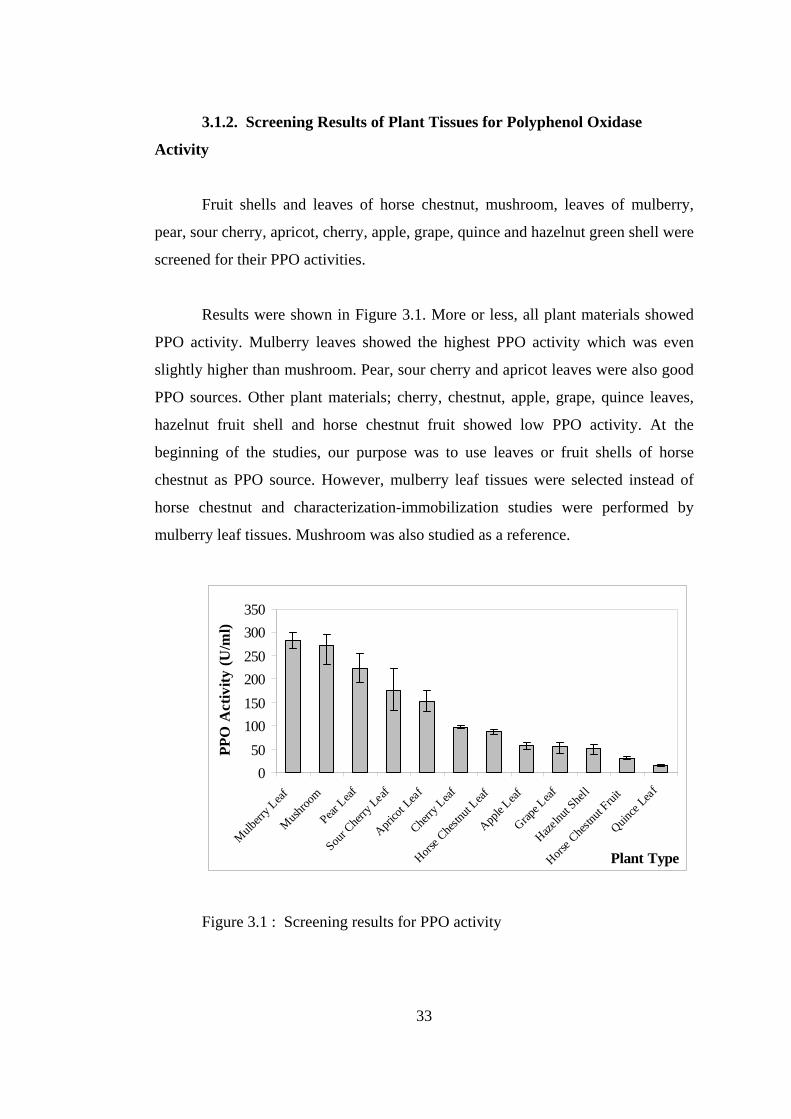
Fruit shells and leaves of horse chestnut, mushroom, leaves of mulberry,
pear, sour cherry, apricot, cherry, apple, grape, quince and hazelnut green shell were
screened for their PPO activities.
Results were shown in Figure 3.1. More or less, all plant materials showed
PPO activity. Mulberry leaves showed the highest PPO activity which was even
slightly higher than mushroom. Pear, sour cherry and apricot leaves were also good
PPO sources. Other plant materials; cherry, chestnut, apple, grape, quince leaves,
hazelnut fruit shell and horse chestnut fruit showed low PPO activity. At the
beginning of the studies, our purpose was to use leaves or fruit shells of horse
chestnut as PPO source. However, mulberry leaf tissues were selected instead of
horse chestnut and characterization-immobilization studies were performed by
mulberry leaf tissues. Mushroom was also studied as a reference.
050
100150200250300350
Mulberr
y Leaf
Mushroo
m
Pear Leaf
Sour C
herry
Leaf
Apricot
Leaf
Cherry
Leaf
Horse C
hestnu
t Leaf
Apple L
eaf
Grape L
eaf
Hazelnu
t Shel
l
Horse C
hestnu
t Frui
t
Quince
Leaf
Plant Type
PPO
Act
ivity
(U/m
l)
Figure 3.1 : Screening results for PPO activity
33
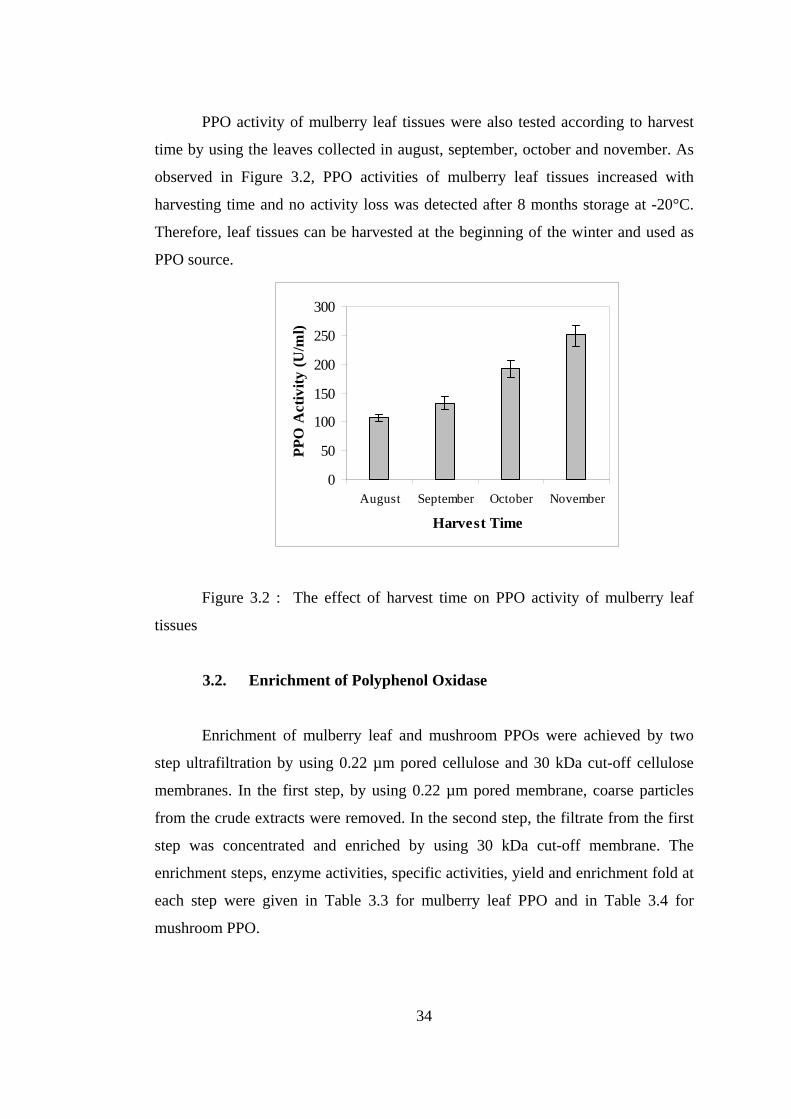
PPO activity of mulberry leaf tissues were also tested according to harvest
time by using the leaves collected in august, september, october and november. As
observed in Figure 3.2, PPO activities of mulberry leaf tissues increased with
harvesting time and no activity loss was detected after 8 months storage at -20°C.
Therefore, leaf tissues can be harvested at the beginning of the winter and used as
PPO source.
0
50
100
150
200
250
300
August September October November
Harvest Time
PPO
Act
ivity
(U/m
l)
Figure 3.2 : The effect of harvest time on PPO activity of mulberry leaf
tissues
3.2. Enrichment of Polyphenol Oxidase
Enrichment of mulberry leaf and mushroom PPOs were achieved by two
step ultrafiltration by using 0.22 µm pored cellulose and 30 kDa cut-off cellulose
membranes. In the first step, by using 0.22 µm pored membrane, coarse particles
from the crude extracts were removed. In the second step, the filtrate from the first
step was concentrated and enriched by using 30 kDa cut-off membrane. The
enrichment steps, enzyme activities, specific activities, yield and enrichment fold at
each step were given in Table 3.3 for mulberry leaf PPO and in Table 3.4 for
mushroom PPO.
34
By two step ultrafiltration, 2.2 fold enrichment was achieved for mulberry
leaf PPO and 1.7 fold enrichment was observed for mushroom PPO.
3.3. Biochemical Characterization of Enriched Mulberry Leaf
Polyphenol Oxidases
Mulberry leaf PPOs were characterized in terms of kinetic parameters, pH
and temperature dependencies of activity, PPO types by activity staining, molecular
weight and isoelectric points. As a reference, mushroom PPO was also
characterized in terms of kinetic parameters.
3.3.1. Kinetic Analysis of Free and Immobilized Polyphenol Oxidases
3.3.1.1. Kinetic Analysis of Free Polyphenol Oxidases
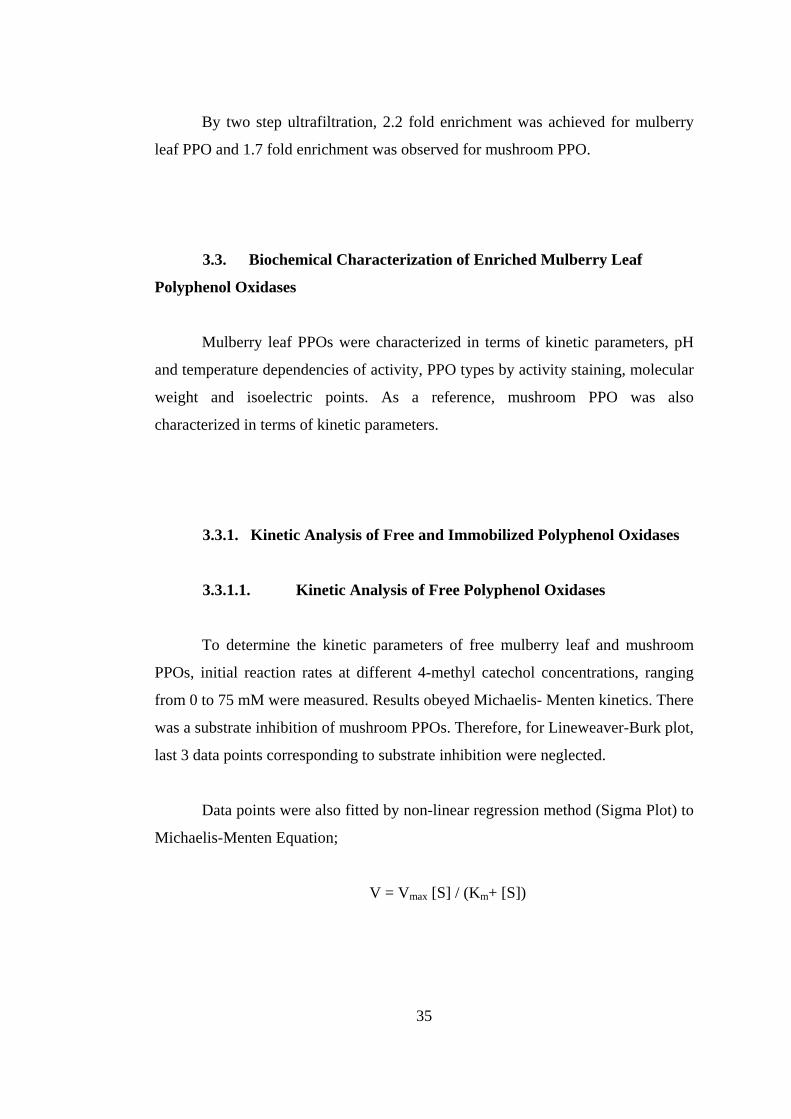
To determine the kinetic parameters of free mulberry leaf and mushroom
PPOs, initial reaction rates at different 4-methyl catechol concentrations, ranging
from 0 to 75 mM were measured. Results obeyed Michaelis- Menten kinetics. There
was a substrate inhibition of mushroom PPOs. Therefore, for Lineweaver-Burk plot,
last 3 data points corresponding to substrate inhibition were neglected.
Data points were also fitted by non-linear regression method (Sigma Plot) to
Michaelis-Menten Equation;
V = Vmax [S] / (Km+ [S])
35
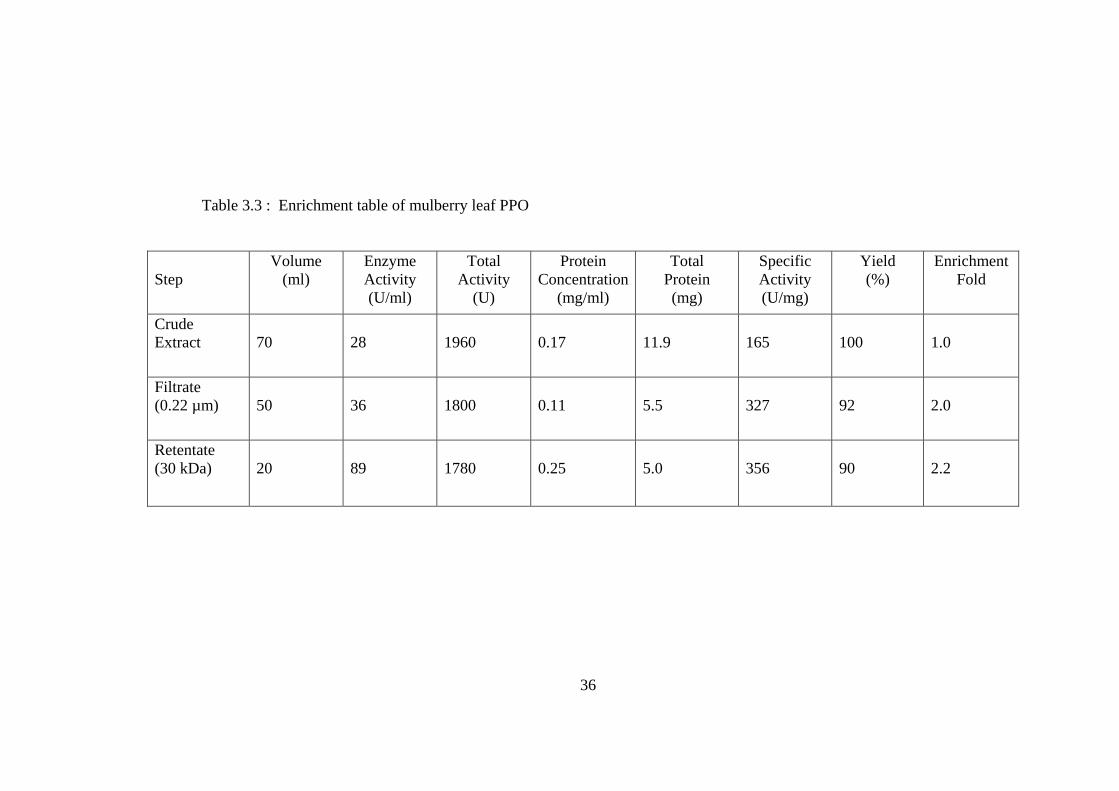
Table 3.3 : Enrichment table of mulberry leaf PPO
Step
Volume (ml)
Enzyme Activity (U/ml)
Total Activity
(U)
Protein Concentration
(mg/ml)
Total Protein (mg)
Specific Activity (U/mg)
Yield (%)
Enrichment Fold
Crude Extract
70
28
1960
0.17
11.9
165
100
1.0
Filtrate (0.22 µm)
50
36
1800
0.11
5.5
327
92
2.0
Retentate (30 kDa)
20
89
1780
0.25
5.0
356
90
2.2
36

Table 3.4 : Enrichment table of mushroom PPO
Step
Volume (ml)
Enzyme Activity (U/ml)
Total Activity
(U)
Protein Concentration
(mg/ml)
Total Protein (mg)
Specific Activity (U/mg)
Yield (%)
Enrichment Fold
Crude Extract
70
29
2030
0.029
2.0
1015
100
1.0
Filtrate (0.22 µm)
50
28
1400
0.018
1.0
1400
69
1.5
Retentate (30 kDa)
20
42
840
0.026
0.5
1680
41
1.7
37
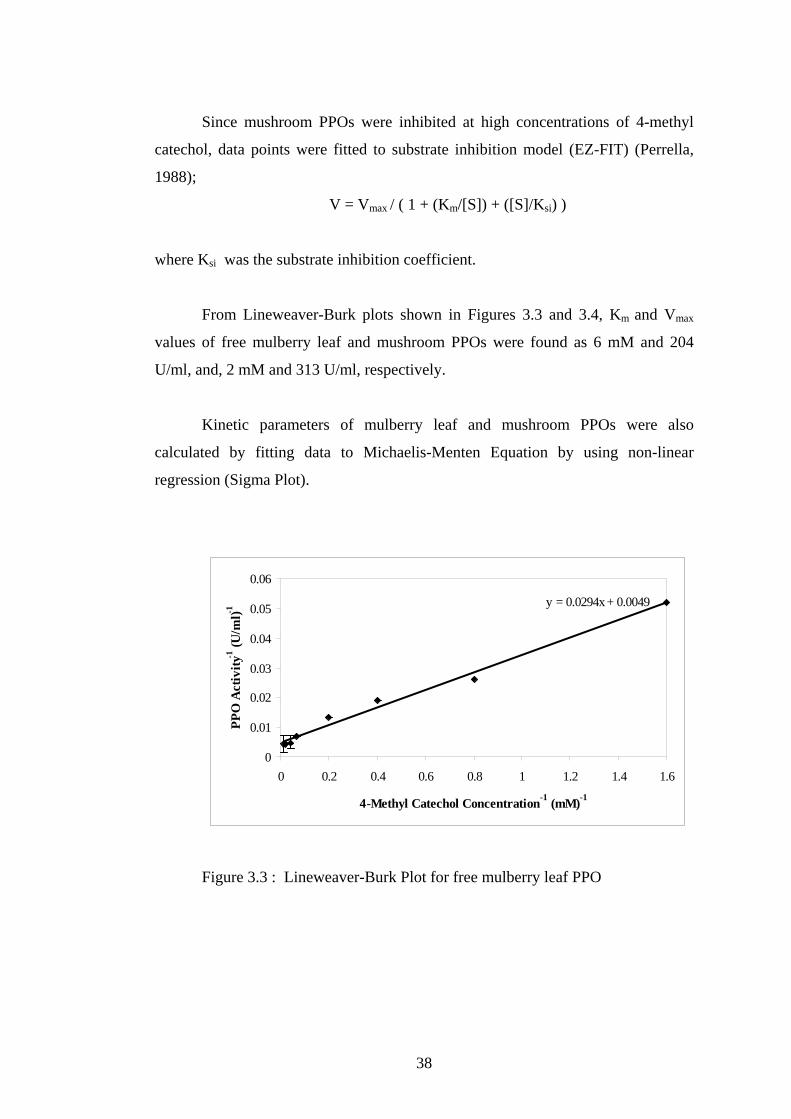
Since mushroom PPOs were inhibited at high concentrations of 4-methyl
catechol, data points were fitted to substrate inhibition model (EZ-FIT) (Perrella,
1988);
V = Vmax / ( 1 + (Km/[S]) + ([S]/Ksi) )
where Ksi was the substrate inhibition coefficient.
From Lineweaver-Burk plots shown in Figures 3.3 and 3.4, Km and Vmax
values of free mulberry leaf and mushroom PPOs were found as 6 mM and 204
U/ml, and, 2 mM and 313 U/ml, respectively.
Kinetic parameters of mulberry leaf and mushroom PPOs were also
calculated by fitting data to Michaelis-Menten Equation by using non-linear
regression (Sigma Plot).
y = 0.0294x + 0.0049
0
0.01
0.02
0.03
0.04
0.05
0.06
0 0.2 0.4 0.6 0.8 1 1.2 1.4 1.6
4-Methyl Catechol Concentration-1 (mM)-1
PPO
Act
ivity
-1 (U
/ml)-1
Figure 3.3 : Lineweaver-Burk Plot for free mulberry leaf PPO
38
y = 0.0066x + 0.0032
0
0.002
0.004
0.006
0.008
0.01
0.012
0.014
0.016
0 0.2 0.4 0.6 0.8 1 1.2 1.4 1.6
4-Methyl Catechol Concentration-1 (mM)-1
PPO
Act
ivity
-1 (U
/ml)-1
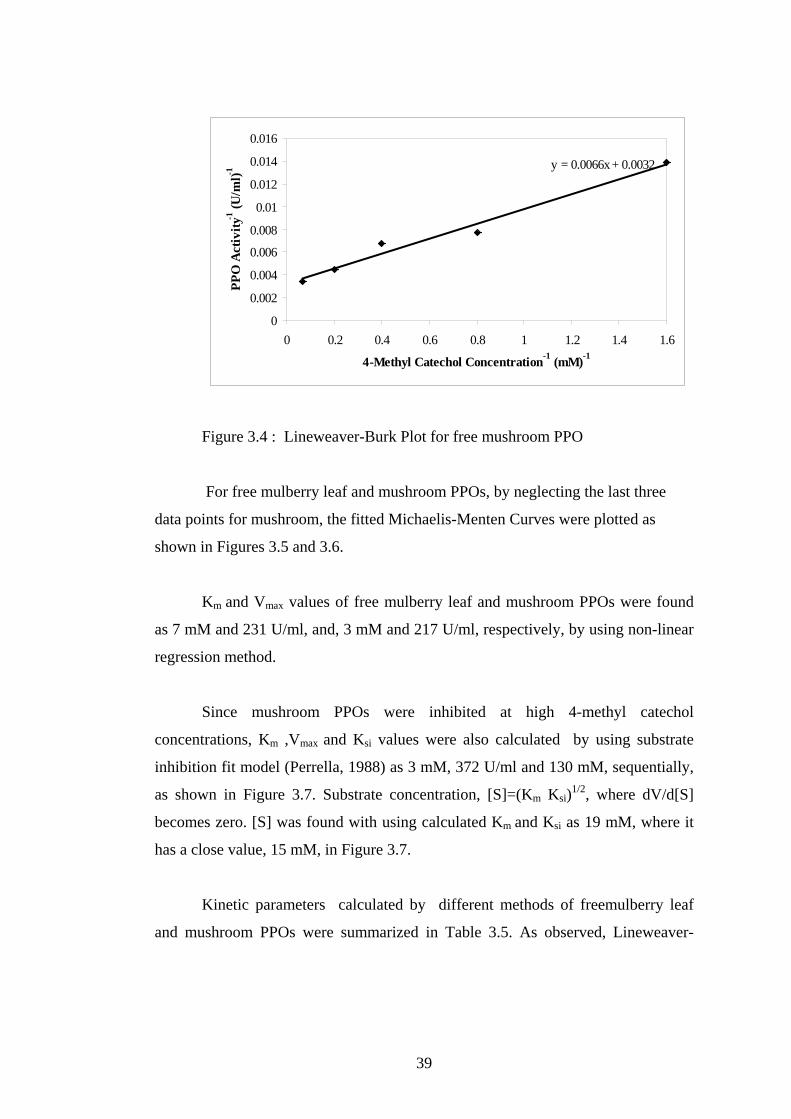
Figure 3.4 : Lineweaver-Burk Plot for free mushroom PPO
For free mulberry leaf and mushroom PPOs, by neglecting the last three
data points for mushroom, the fitted Michaelis-Menten Curves were plotted as
shown in Figures 3.5 and 3.6.
Km and Vmax values of free mulberry leaf and mushroom PPOs were found
as 7 mM and 231 U/ml, and, 3 mM and 217 U/ml, respectively, by using non-linear
regression method.
Since mushroom PPOs were inhibited at high 4-methyl catechol
concentrations, Km ,Vmax and Ksi values were also calculated by using substrate
inhibition fit model (Perrella, 1988) as 3 mM, 372 U/ml and 130 mM, sequentially,
as shown in Figure 3.7. Substrate concentration, [S]=(Km Ksi)1/2, where dV/d[S]
becomes zero. [S] was found with using calculated Km and Ksi as 19 mM, where it
has a close value, 15 mM, in Figure 3.7.
Kinetic parameters calculated by different methods of freemulberry leaf
and mushroom PPOs were summarized in Table 3.5. As observed, Lineweaver-
39
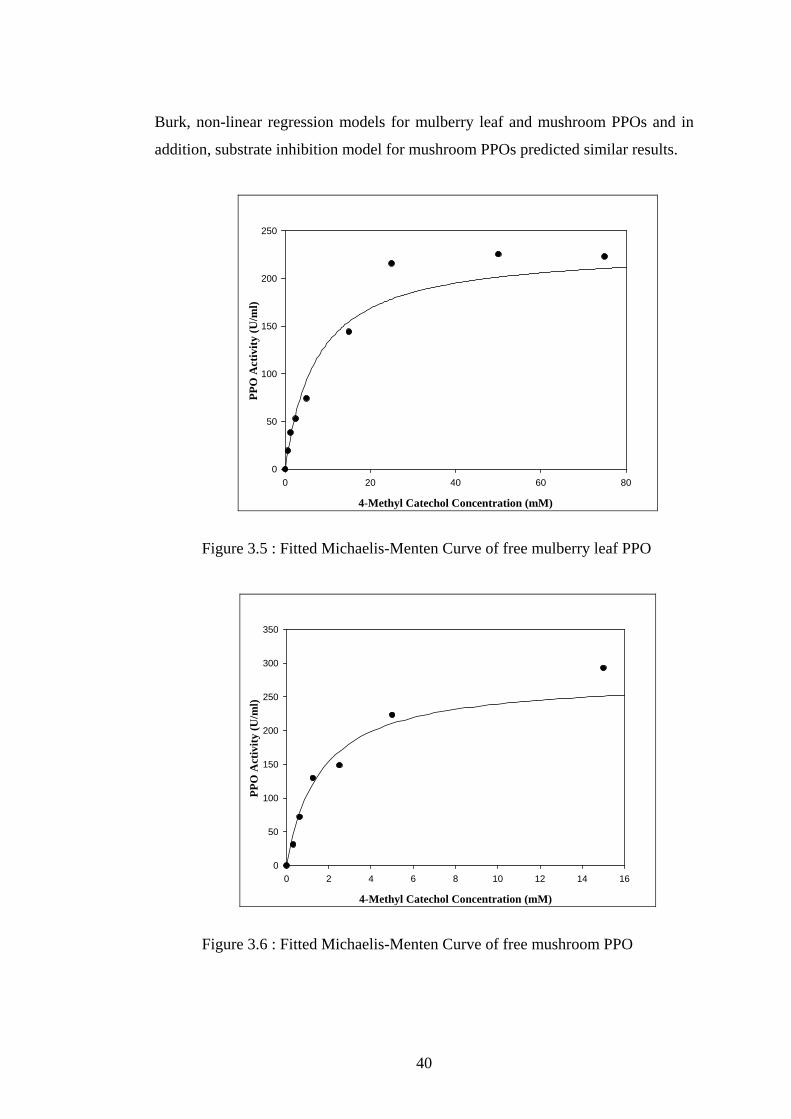
Burk, non-linear regression models for mulberry leaf and mushroom PPOs and in
addition, substrate inhibition model for mushroom PPOs predicted similar results.
4-Methyl Catechol Concentration (mM)
0 20 40 60 80
PPO
Act
ivity
(U/m
l)
0
50
100
150
200
250
Figure 3.5 : Fitted Michaelis-Menten Curve of free mulberry leaf PPO
4-Methyl Catechol Concentration (mM)
0 2 4 6 8 10 12 14 16
PPO
Act
ivity
(U/m
l)
0
50
100
150
200
250
300
350
Figure 3.6 : Fitted Michaelis-Menten Curve of free mushroom PPO
40
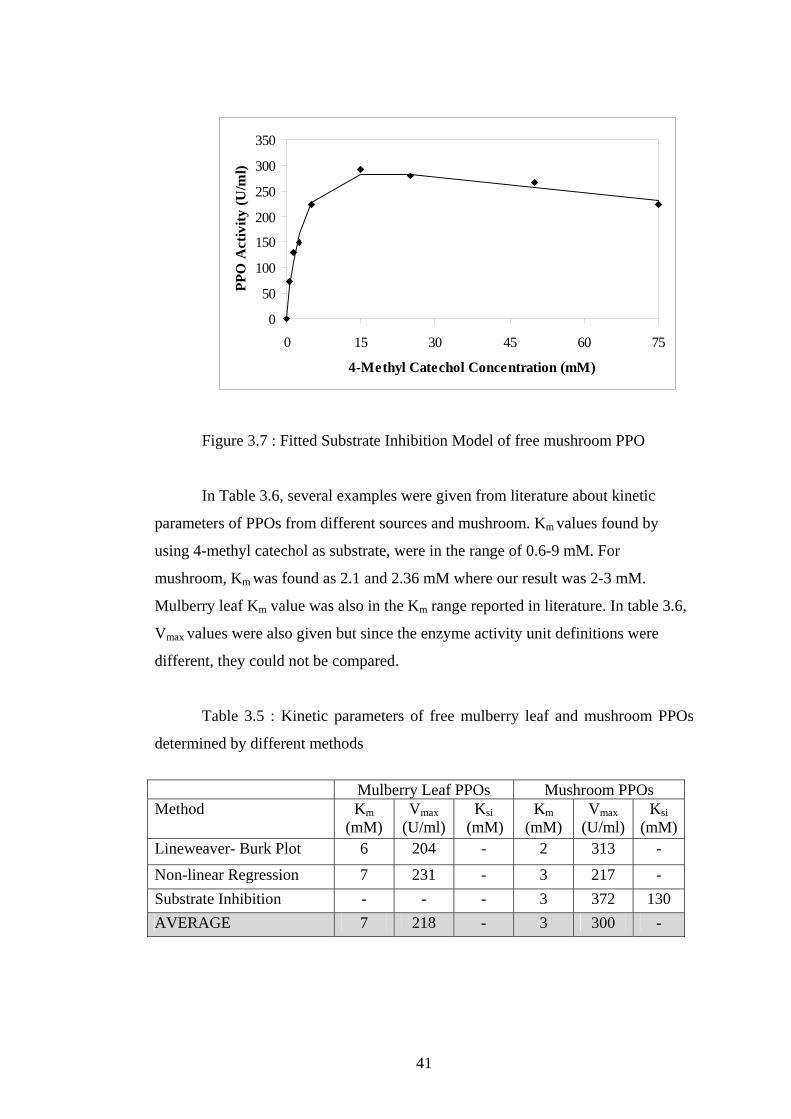
0
50
100
150
200
250
300
350
0 15 30 45 60 7
4-Methyl Catechol Concentration (mM)
PPO
Act
ivity
(U/m
l)
5
Figure 3.7 : Fitted Substrate Inhibition Model of free mushroom PPO
In Table 3.6, several examples were given from literature about kinetic
parameters of PPOs from different sources and mushroom. Km values found by
using 4-methyl catechol as substrate, were in the range of 0.6-9 mM. For
mushroom, Km was found as 2.1 and 2.36 mM where our result was 2-3 mM.
Mulberry leaf Km value was also in the Km range reported in literature. In table 3.6,
Vmax values were also given but since the enzyme activity unit definitions were
different, they could not be compared.
Table 3.5 : Kinetic parameters of free mulberry leaf and mushroom PPOs
determined by different methods
Mulberry Leaf PPOs Mushroom PPOs Method Km
(mM) Vmax
(U/ml)Ksi
(mM) Km
(mM) Vmax
(U/ml) Ksi
(mM)Lineweaver- Burk Plot 6 204 - 2 313 -
Non-linear Regression 7 231 - 3 217 - Substrate Inhibition - - - 3 372 130 AVERAGE 7 218 - 3 300 -
41
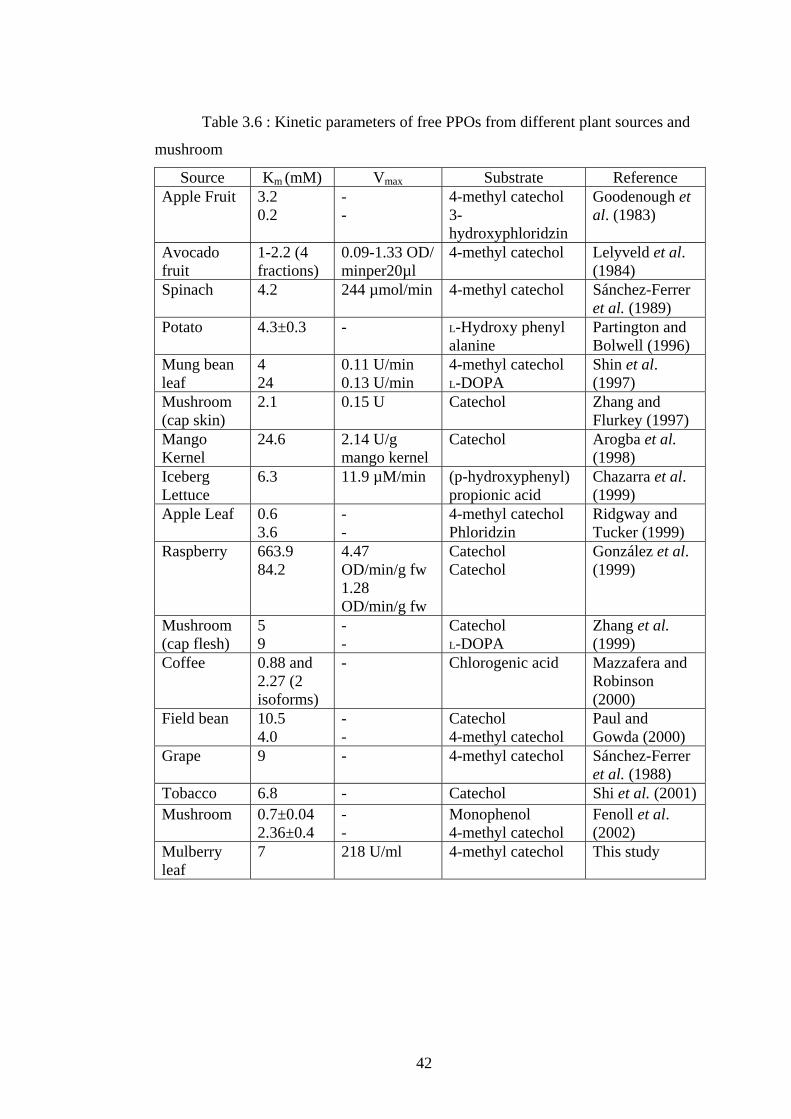
Table 3.6 : Kinetic parameters of free PPOs from different plant sources and
mushroom
Source Km (mM) Vmax Substrate Reference
Apple Fruit 3.2 0.2
- -
4-methyl catechol 3-hydroxyphloridzin
Goodenough et al. (1983)
Avocado fruit
1-2.2 (4 fractions)
0.09-1.33 OD/ minper20µl
4-methyl catechol Lelyveld et al. (1984)
Spinach 4.2 244 µmol/min 4-methyl catechol Sánchez-Ferrer et al. (1989)
Potato 4.3±0.3 - L-Hydroxy phenyl alanine
Partington and Bolwell (1996)
Mung bean leaf
4 24
0.11 U/min 0.13 U/min
4-methyl catechol L-DOPA
Shin et al. (1997)
Mushroom (cap skin)
2.1
0.15 U Catechol Zhang and Flurkey (1997)
Mango Kernel
24.6 2.14 U/g mango kernel
Catechol Arogba et al. (1998)
Iceberg Lettuce
6.3 11.9 µM/min (p-hydroxyphenyl) propionic acid
Chazarra et al. (1999)
Apple Leaf 0.6 3.6
- -
4-methyl catechol Phloridzin
Ridgway and Tucker (1999)
Raspberry 663.9 84.2
4.47 OD/min/g fw 1.28 OD/min/g fw
Catechol Catechol
González et al. (1999)
Mushroom (cap flesh)
5 9
- -
Catechol L-DOPA
Zhang et al. (1999)
Coffee 0.88 and 2.27 (2 isoforms)
- Chlorogenic acid Mazzafera and Robinson (2000)
Field bean 10.5 4.0
- -
Catechol 4-methyl catechol
Paul and Gowda (2000)
Grape 9 - 4-methyl catechol Sánchez-Ferrer et al. (1988)
Tobacco 6.8 - Catechol Shi et al. (2001) Mushroom 0.7±0.04
2.36±0.4 - -
Monophenol 4-methyl catechol
Fenoll et al. (2002)
Mulberry leaf
7 218 U/ml 4-methyl catechol This study
42
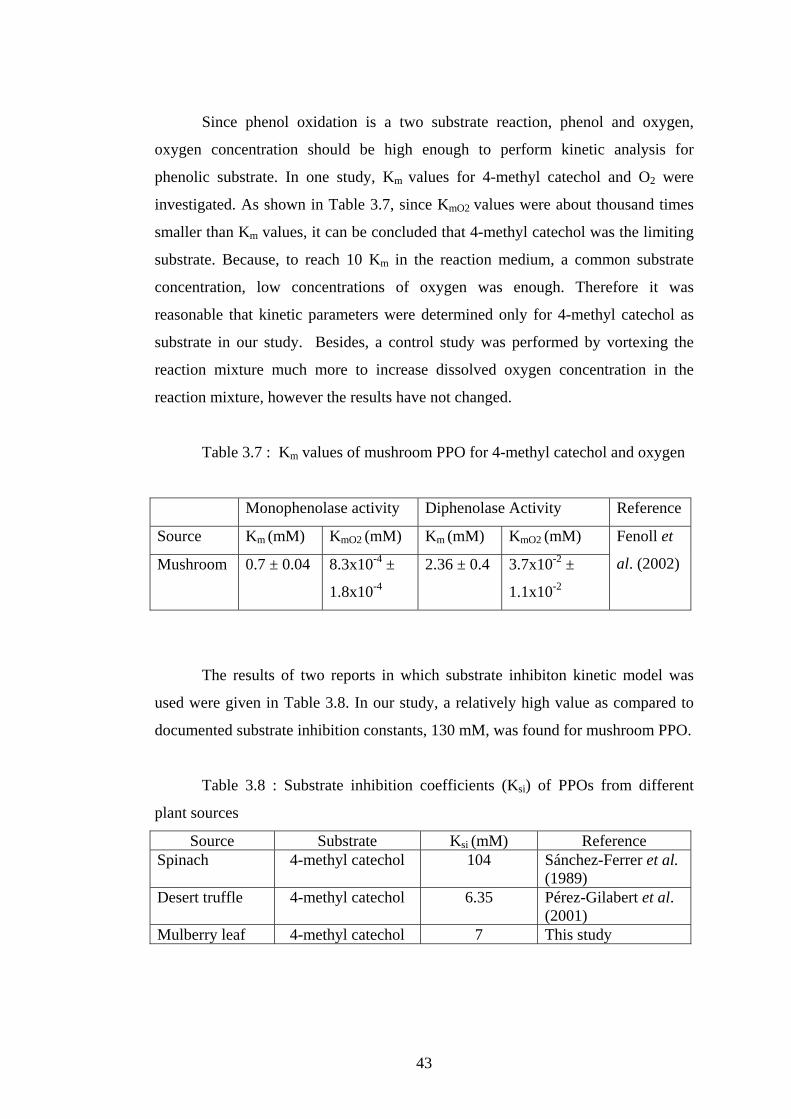
Since phenol oxidation is a two substrate reaction, phenol and oxygen,
oxygen concentration should be high enough to perform kinetic analysis for
phenolic substrate. In one study, Km values for 4-methyl catechol and O2 were
investigated. As shown in Table 3.7, since KmO2 values were about thousand times
smaller than Km values, it can be concluded that 4-methyl catechol was the limiting
substrate. Because, to reach 10 Km in the reaction medium, a common substrate
concentration, low concentrations of oxygen was enough. Therefore it was
reasonable that kinetic parameters were determined only for 4-methyl catechol as
substrate in our study. Besides, a control study was performed by vortexing the
reaction mixture much more to increase dissolved oxygen concentration in the
reaction mixture, however the results have not changed.
Table 3.7 : Km values of mushroom PPO for 4-methyl catechol and oxygen
Monophenolase activity Diphenolase Activity Reference
Source Km (mM) KmO2 (mM) Km (mM) KmO2 (mM)
Mushroom 0.7 ± 0.04 8.3x10⁻⁴ ±
1.8x10⁻⁴
2.36 ± 0.4 3.7x10⁻² ±
1.1x10⁻²
Fenoll et
al. (2002)
The results of two reports in which substrate inhibiton kinetic model was
used were given in Table 3.8. In our study, a relatively high value as compared to
documented substrate inhibition constants, 130 mM, was found for mushroom PPO.
Table 3.8 : Substrate inhibition coefficients (Ksi) of PPOs from different
plant sources
Source Substrate Ksi (mM) Reference Spinach 4-methyl catechol 104 Sánchez-Ferrer et al.
(1989) Desert truffle 4-methyl catechol 6.35 Pérez-Gilabert et al.
(2001) Mulberry leaf 4-methyl catechol 7 This study
43
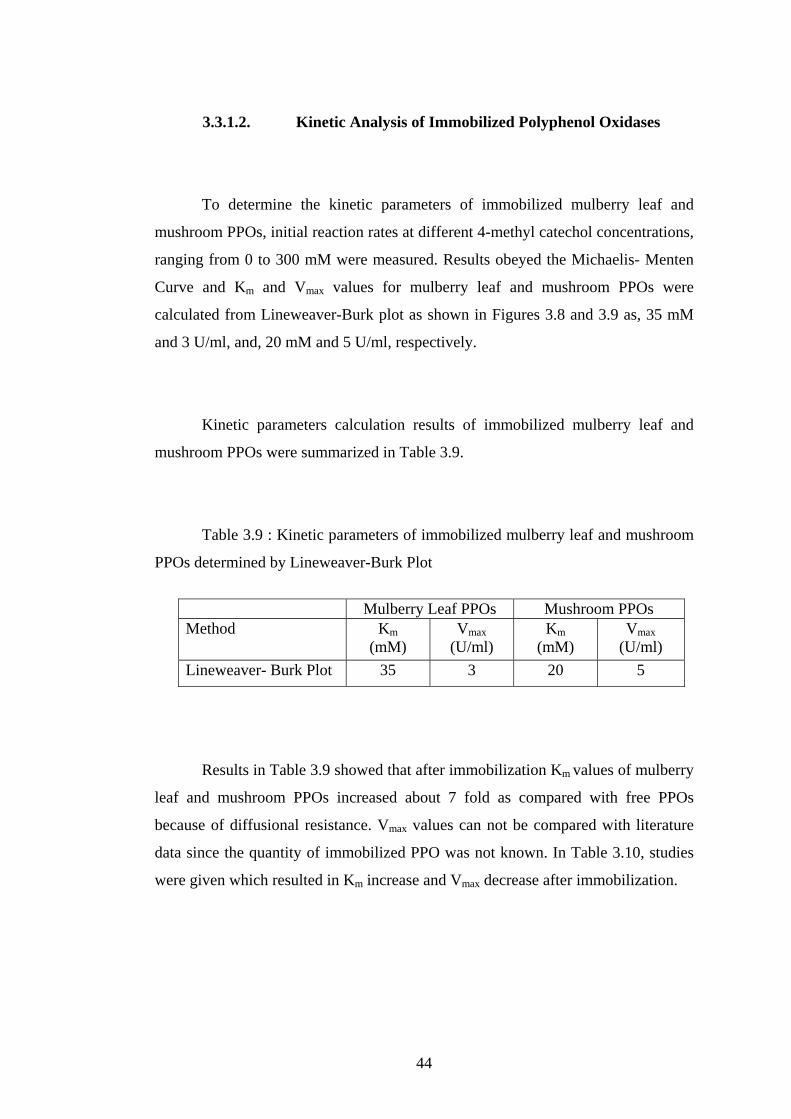
3.3.1.2. Kinetic Analysis of Immobilized Polyphenol Oxidases
To determine the kinetic parameters of immobilized mulberry leaf and
mushroom PPOs, initial reaction rates at different 4-methyl catechol concentrations,
ranging from 0 to 300 mM were measured. Results obeyed the Michaelis- Menten
Curve and Km and Vmax values for mulberry leaf and mushroom PPOs were
calculated from Lineweaver-Burk plot as shown in Figures 3.8 and 3.9 as, 35 mM
and 3 U/ml, and, 20 mM and 5 U/ml, respectively.
Kinetic parameters calculation results of immobilized mulberry leaf and
mushroom PPOs were summarized in Table 3.9.
Table 3.9 : Kinetic parameters of immobilized mulberry leaf and mushroom
PPOs determined by Lineweaver-Burk Plot
Mulberry Leaf PPOs Mushroom PPOs Method Km
(mM) Vmax
(U/ml) Km
(mM) Vmax
(U/ml) Lineweaver- Burk Plot 35 3 20 5
Results in Table 3.9 showed that after immobilization Km values of mulberry
leaf and mushroom PPOs increased about 7 fold as compared with free PPOs
because of diffusional resistance. Vmax values can not be compared with literature
data since the quantity of immobilized PPO was not known. In Table 3.10, studies
were given which resulted in Km increase and Vmax decrease after immobilization.
44
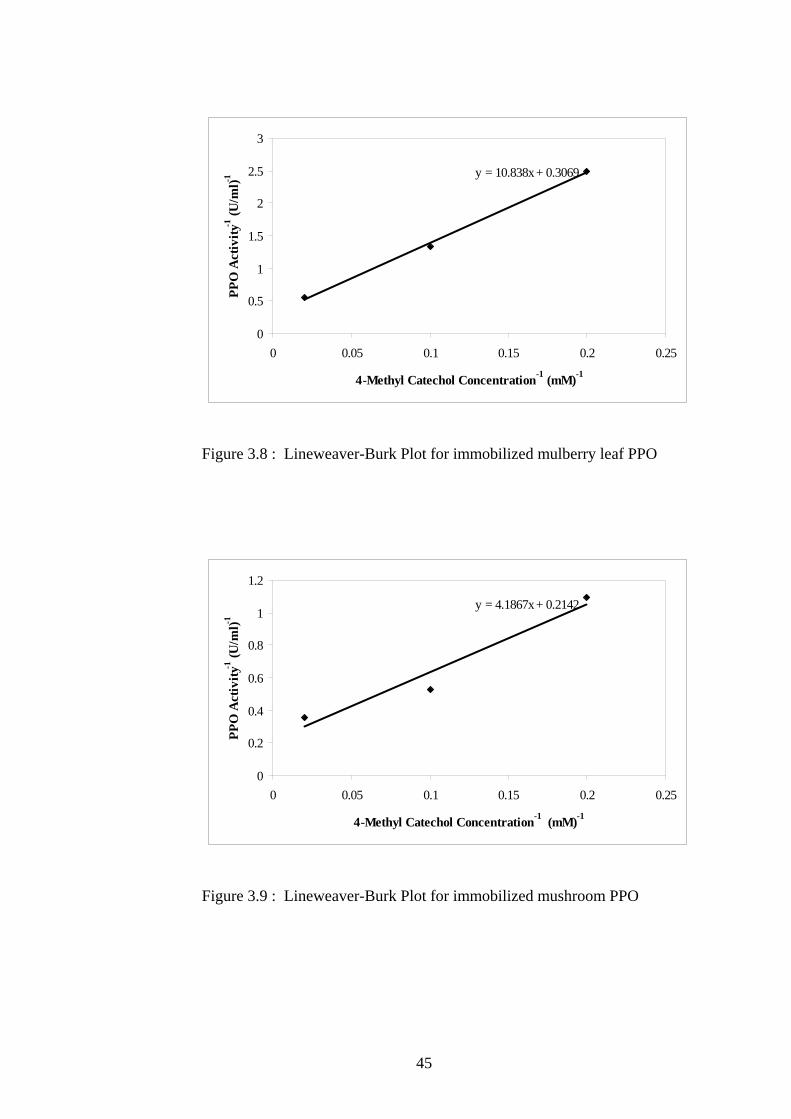
y = 10.838x + 0.3069
0
0.5
1
1.5
2
2.5
3
0 0.05 0.1 0.15 0.2 0.25
4-Methyl Catechol Concentration-1 (mM)-1
PPO
Act
ivity
-1 (U
/ml)-1
Figure 3.8 : Lineweaver-Burk Plot for immobilized mulberry leaf PPO
y = 4.1867x + 0.2142
0
0.2
0.4
0.6
0.8
1
1.2
0 0.05 0.1 0.15 0.2 0.25
4-Methyl Catechol Concentration-1 (mM)-1
PPO
Act
ivity
-1 (U
/ml)-1
Figure 3.9 : Lineweaver-Burk Plot for immobilized mushroom PPO
45
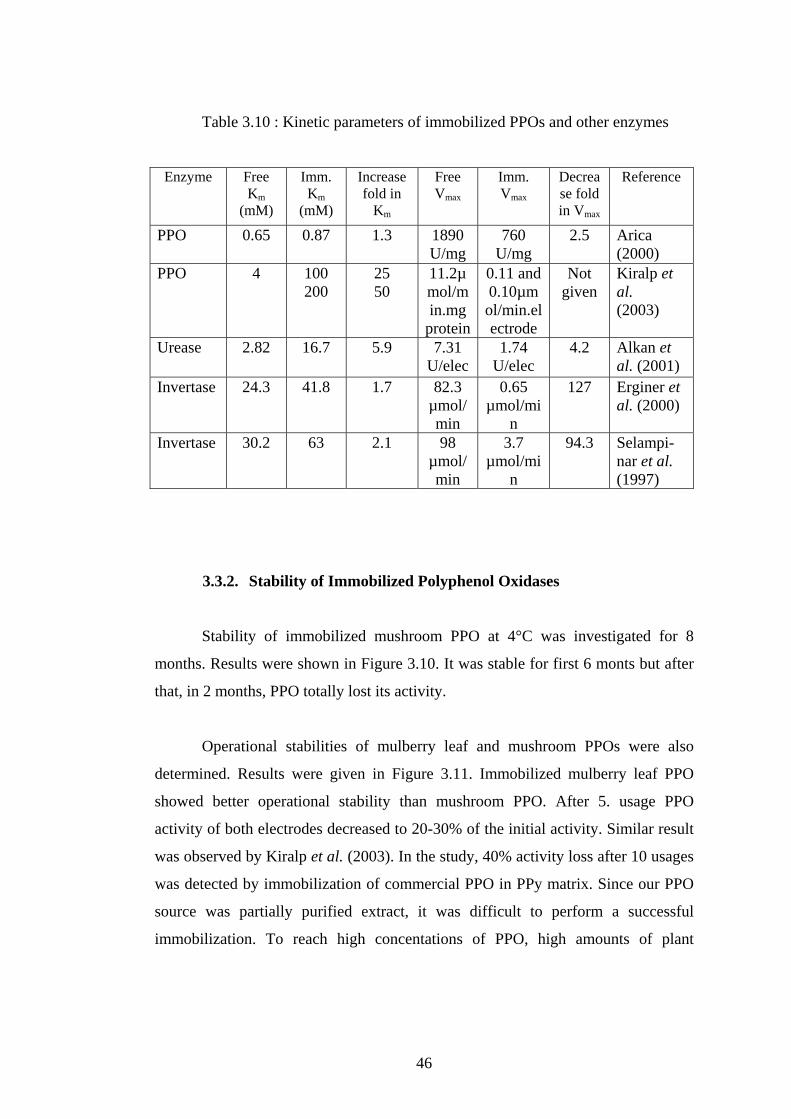
Table 3.10 : Kinetic parameters of immobilized PPOs and other enzymes
Enzyme Free Km
(mM)
Imm. Km
(mM)
Increase fold in
Km
Free Vmax
Imm.Vmax
Decrease fold in Vmax
Reference
PPO 0.65 0.87 1.3 1890 U/mg
760 U/mg
2.5 Arica (2000)
PPO 4 100 200
25 50
11.2µmol/min.mg
protein
0.11 and 0.10µmol/min.electrode
Not given
Kiralp et al. (2003)
Urease 2.82 16.7 5.9 7.31 U/elec
1.74 U/elec
4.2 Alkan et al. (2001)
Invertase 24.3 41.8 1.7 82.3 µmol/min
0.65 µmol/mi
n
127 Erginer et al. (2000)
Invertase 30.2 63 2.1 98 µmol/min
3.7 µmol/mi
n
94.3 Selampi-nar et al. (1997)
3.3.2. Stability of Immobilized Polyphenol Oxidases
Stability of immobilized mushroom PPO at 4°C was investigated for 8
months. Results were shown in Figure 3.10. It was stable for first 6 monts but after
that, in 2 months, PPO totally lost its activity.
Operational stabilities of mulberry leaf and mushroom PPOs were also
determined. Results were given in Figure 3.11. Immobilized mulberry leaf PPO
showed better operational stability than mushroom PPO. After 5. usage PPO
activity of both electrodes decreased to 20-30% of the initial activity. Similar result
was observed by Kiralp et al. (2003). In the study, 40% activity loss after 10 usages
was detected by immobilization of commercial PPO in PPy matrix. Since our PPO
source was partially purified extract, it was difficult to perform a successful
immobilization. To reach high concentations of PPO, high amounts of plant
46
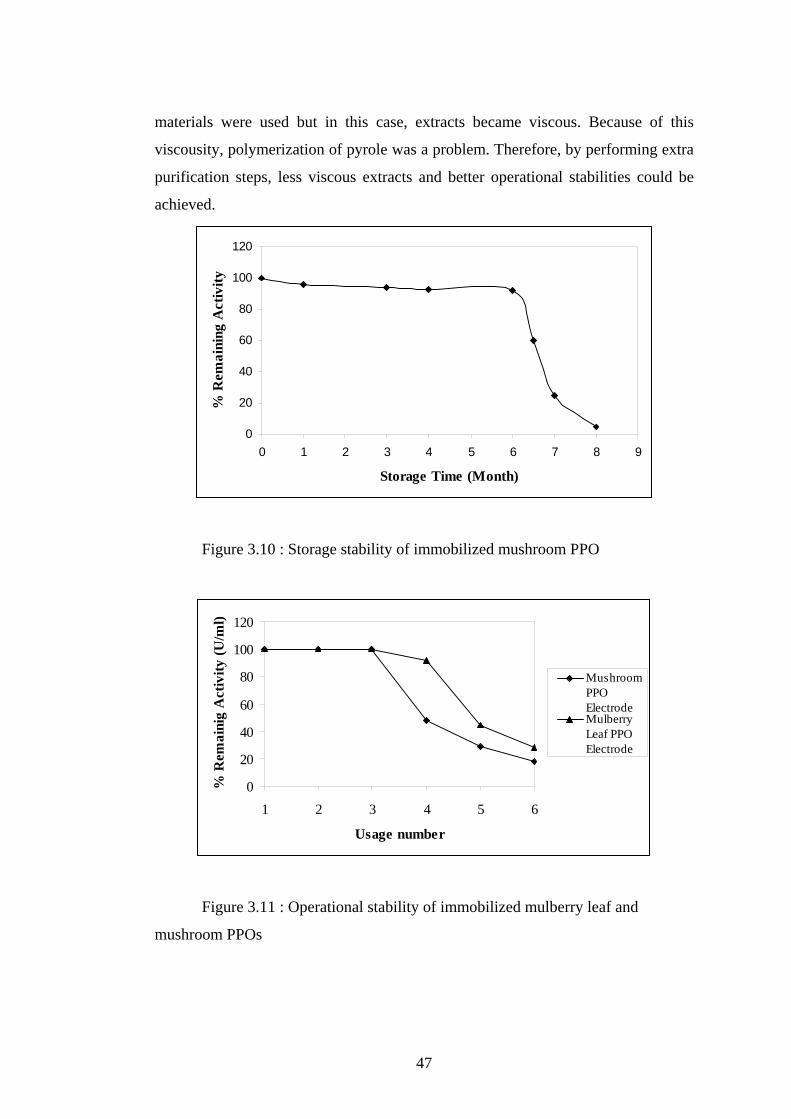
materials were used but in this case, extracts became viscous. Because of this
viscousity, polymerization of pyrole was a problem. Therefore, by performing extra
purification steps, less viscous extracts and better operational stabilities could be
achieved.
0
20
40
60
80
100
120
0 1 2 3 4 5 6 7 8 9
Storage Time (Month)
% R
emai
ning
Act
ivity
Figure 3.10 : Storage stability of immobilized mushroom PPO
0
20
40
60
80
100
120
1 2 3 4 5 6
Usage number
% R
emai
nig
Act
ivity
(U/m
l)
MushroomPPOElectrodeMulberryLeaf PPOElectrode
Figure 3.11 : Operational stability of immobilized mulberry leaf and
mushroom PPOs
47
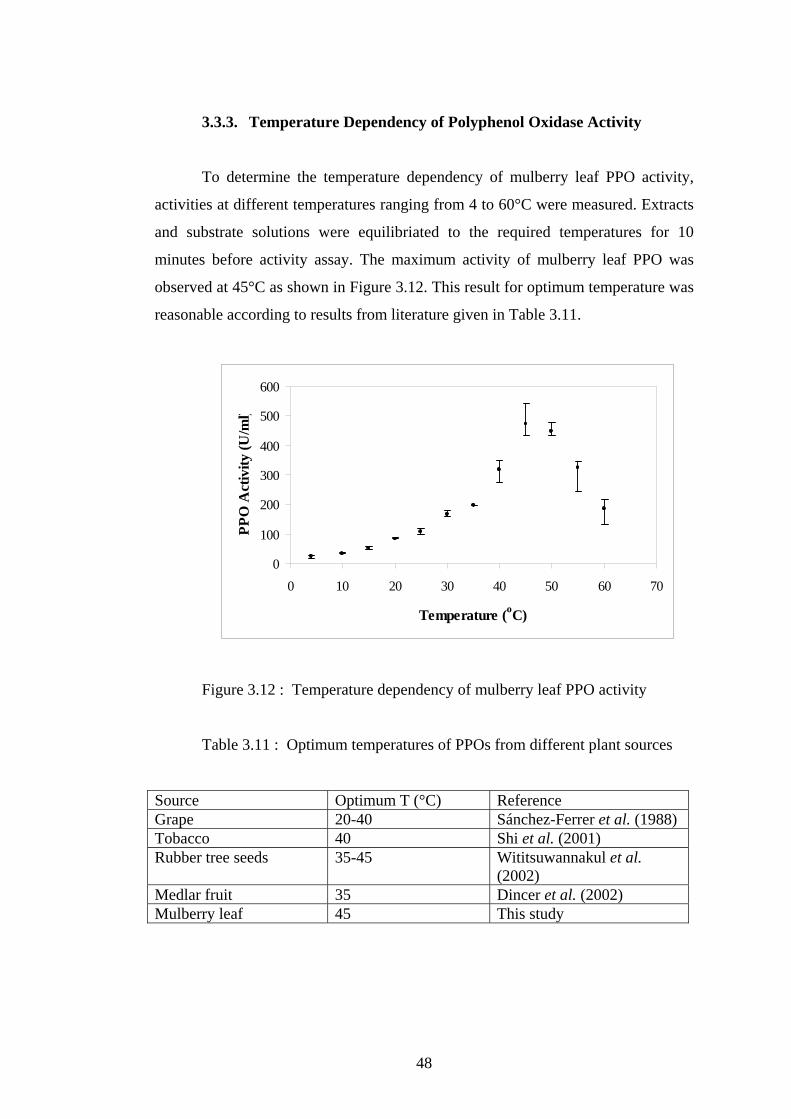
3.3.3. Temperature Dependency of Polyphenol Oxidase Activity
To determine the temperature dependency of mulberry leaf PPO activity,
activities at different temperatures ranging from 4 to 60°C were measured. Extracts
and substrate solutions were equilibriated to the required temperatures for 10
minutes before activity assay. The maximum activity of mulberry leaf PPO was
observed at 45°C as shown in Figure 3.12. This result for optimum temperature was
reasonable according to results from literature given in Table 3.11.
0
100
200
300
400
500
600
0 10 20 30 40 50 60 70
Temperature (oC)
PPO
Act
ivity
(U/m
l)
Figure 3.12 : Temperature dependency of mulberry leaf PPO activity
Table 3.11 : Optimum temperatures of PPOs from different plant sources
Source Optimum T (°C) Reference Grape 20-40 Sánchez-Ferrer et al. (1988) Tobacco 40 Shi et al. (2001) Rubber tree seeds 35-45 Wititsuwannakul et al.
(2002) Medlar fruit 35 Dincer et al. (2002) Mulberry leaf 45 This study
48
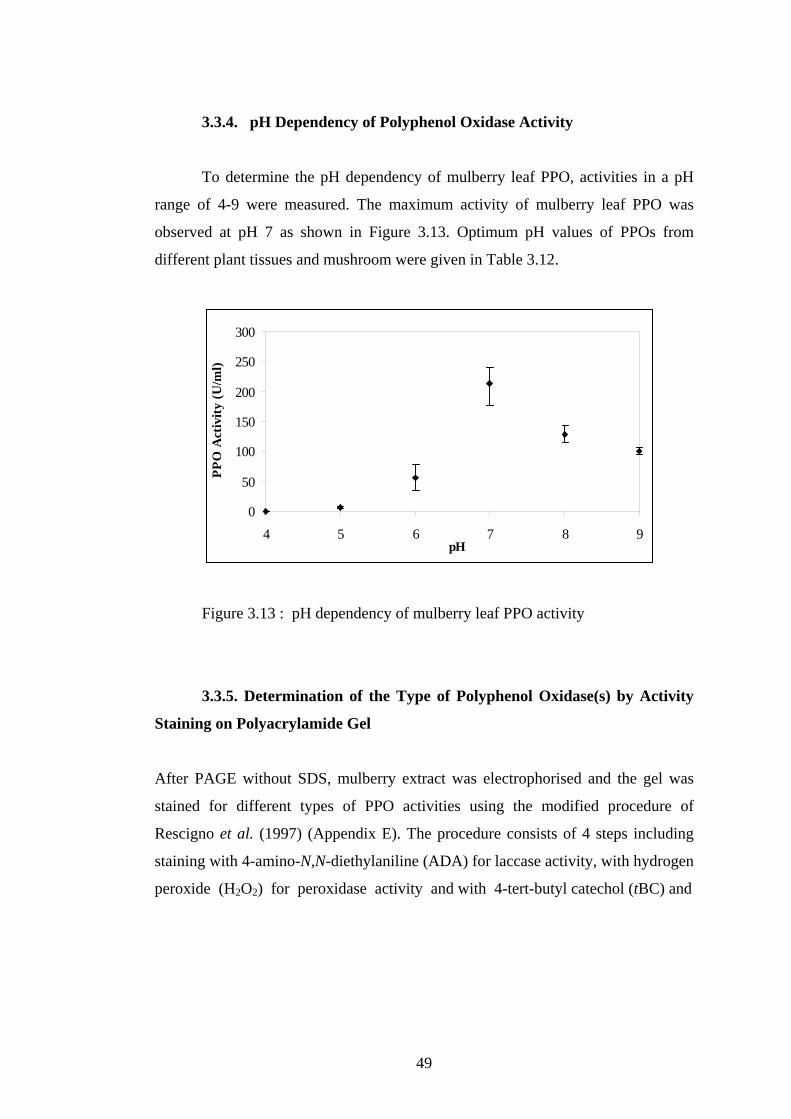
3.3.4. pH Dependency of Polyphenol Oxidase Activity
To determine the pH dependency of mulberry leaf PPO, activities in a pH
range of 4-9 were measured. The maximum activity of mulberry leaf PPO was
observed at pH 7 as shown in Figure 3.13. Optimum pH values of PPOs from
different plant tissues and mushroom were given in Table 3.12.
0
50
100
150
200
250
300
4 5 6 7 8 9pH
PPO
Act
ivity
(U/m
l)
Figure 3.13 : pH dependency of mulberry leaf PPO activity
3.3.5. Determination of the Type of Polyphenol Oxidase(s) by Activity
Staining on Polyacrylamide Gel
After PAGE without SDS, mulberry extract was electrophorised and the gel was
stained for different types of PPO activities using the modified procedure of
Rescigno et al. (1997) (Appendix E). The procedure consists of 4 steps including
staining with 4-amino-N,N-diethylaniline (ADA) for laccase activity, with hydrogen
peroxide (H2O2) for peroxidase activity and with 4-tert-butyl catechol (tBC) and
49
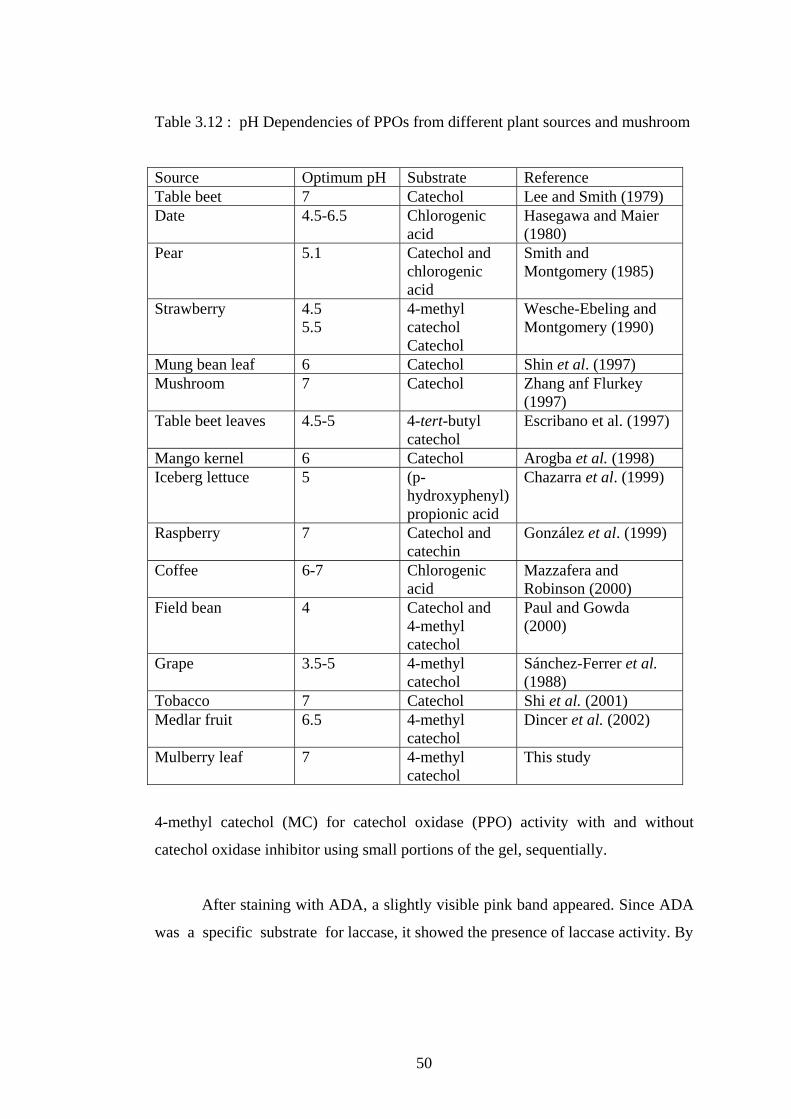
Table 3.12 : pH Dependencies of PPOs from different plant sources and mushroom
Source Optimum pH Substrate Reference Table beet 7 Catechol Lee and Smith (1979) Date 4.5-6.5 Chlorogenic
acid Hasegawa and Maier (1980)
Pear 5.1 Catechol and chlorogenic acid
Smith and Montgomery (1985)
Strawberry 4.5 5.5
4-methyl catechol Catechol
Wesche-Ebeling and Montgomery (1990)
Mung bean leaf 6 Catechol Shin et al. (1997) Mushroom 7 Catechol Zhang anf Flurkey
(1997) Table beet leaves 4.5-5 4-tert-butyl
catechol Escribano et al. (1997)
Mango kernel 6 Catechol Arogba et al. (1998) Iceberg lettuce 5 (p-
hydroxyphenyl) propionic acid
Chazarra et al. (1999)
Raspberry 7 Catechol and catechin
González et al. (1999)
Coffee 6-7 Chlorogenic acid
Mazzafera and Robinson (2000)
Field bean 4 Catechol and 4-methyl catechol
Paul and Gowda (2000)
Grape 3.5-5 4-methyl catechol
Sánchez-Ferrer et al. (1988)
Tobacco 7 Catechol Shi et al. (2001) Medlar fruit 6.5 4-methyl
catechol Dincer et al. (2002)
Mulberry leaf 7 4-methyl catechol
This study
4-methyl catechol (MC) for catechol oxidase (PPO) activity with and without
catechol oxidase inhibitor using small portions of the gel, sequentially.
After staining with ADA, a slightly visible pink band appeared. Since ADA
was a specific substrate for laccase, it showed the presence of laccase activity. By
50
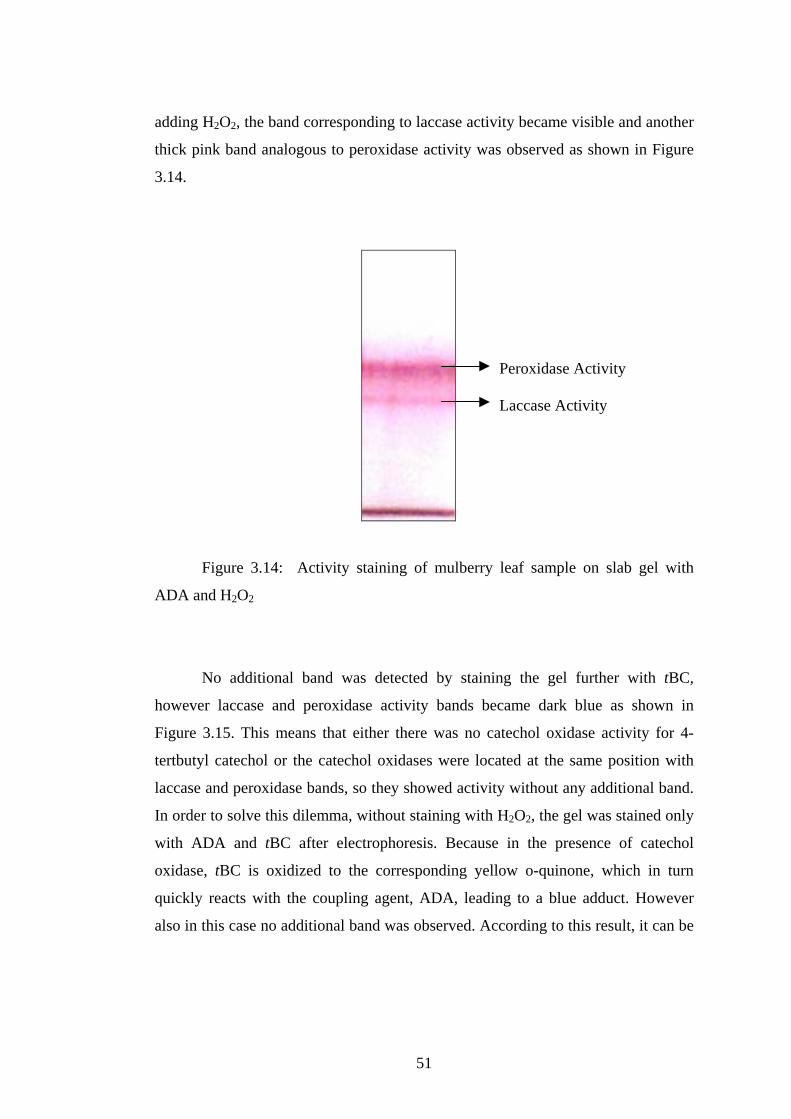
adding H2O2, the band corresponding to laccase activity became visible and another
thick pink band analogous to peroxidase activity was observed as shown in Figure
3.14.
Peroxidase Activity
Laccase Activity
Figure 3.14: Activity staining of mulberry leaf sample on slab gel with
ADA and H2O2
No additional band was detected by staining the gel further with tBC,
however laccase and peroxidase activity bands became dark blue as shown in
Figure 3.15. This means that either there was no catechol oxidase activity for 4-
tertbutyl catechol or the catechol oxidases were located at the same position with
laccase and peroxidase bands, so they showed activity without any additional band.
In order to solve this dilemma, without staining with H2O2, the gel was stained only
with ADA and tBC after electrophoresis. Because in the presence of catechol
oxidase, tBC is oxidized to the corresponding yellow o-quinone, which in turn
quickly reacts with the coupling agent, ADA, leading to a blue adduct. However
also in this case no additional band was observed. According to this result, it can be
51
concluded that mulberry leaf extract did not contain any catechol oxidase which
was specific to tBC or its concentration was low in the extract. Another reason
could be the high isoelectric point of catechol oxidase (specific for tBC) which
causes migration of these enzymes in the gel in the opposite direction, so, they can
not be separated from the crude extract by the electrophoretic method used.
Dark blue bands
Figure 3.15 : Activity staining of mulberry leaf sample on slab gel with tBC
Since, in PPO assay experiments, 4-methyl catechol (MC) was used as
substrate, it was predicted that mulberry leaf extract contains catechol oxidase. To
see this activity on the gel, gel was stained with MC and two orange-brown bands
were observed corresponding to PPO activity (catechol oxidase activity specific for
MC) where laccase and peroxidase activities were also detected as shown in Figure
3.16.
To be sure that MC was oxidized by catechol oxidase, not by laccase,
another gel was soaked in salicylhydroxamic acid which is a catechol oxidase
inhibitor. After inhibiton of catechol oxidase, gel was stained with MC and very
52
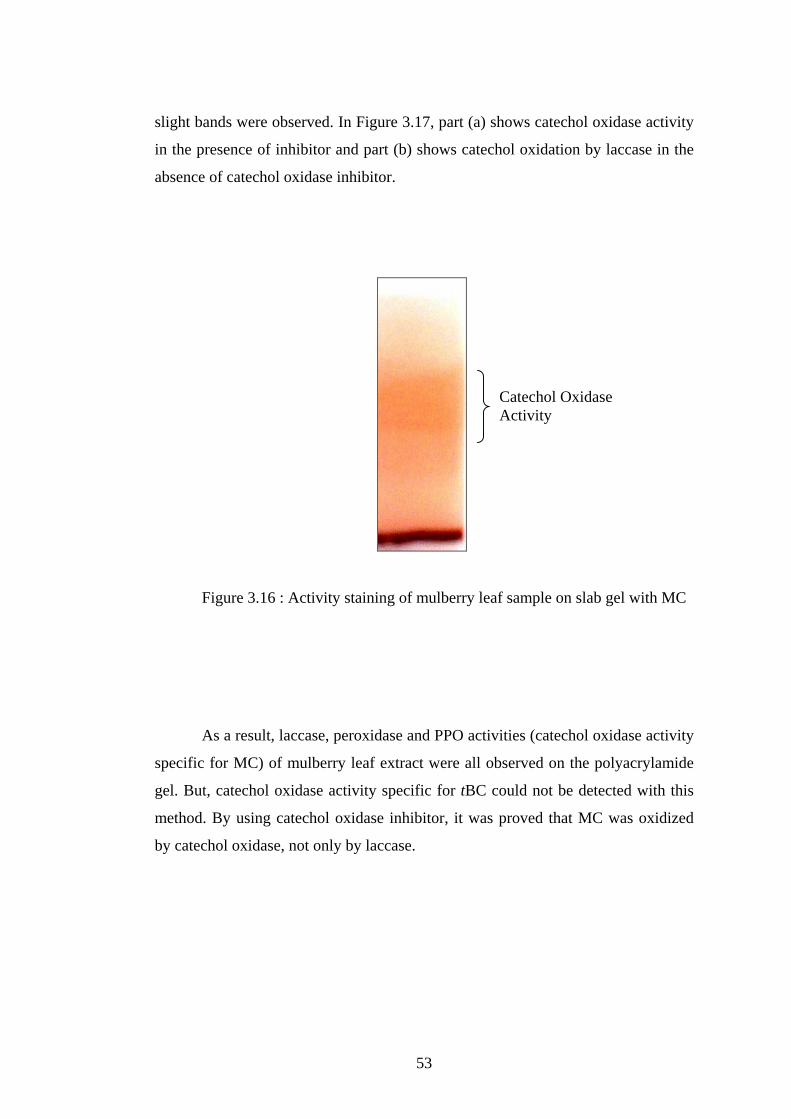
slight bands were observed. In Figure 3.17, part (a) shows catechol oxidase activity
in the presence of inhibitor and part (b) shows catechol oxidation by laccase in the
absence of catechol oxidase inhibitor.
Catechol Oxidase Activity
Figure 3.16 : Activity staining of mulberry leaf sample on slab gel with MC
As a result, laccase, peroxidase and PPO activities (catechol oxidase activity
specific for MC) of mulberry leaf extract were all observed on the polyacrylamide
gel. But, catechol oxidase activity specific for tBC could not be detected with this
method. By using catechol oxidase inhibitor, it was proved that MC was oxidized
by catechol oxidase, not only by laccase.
53
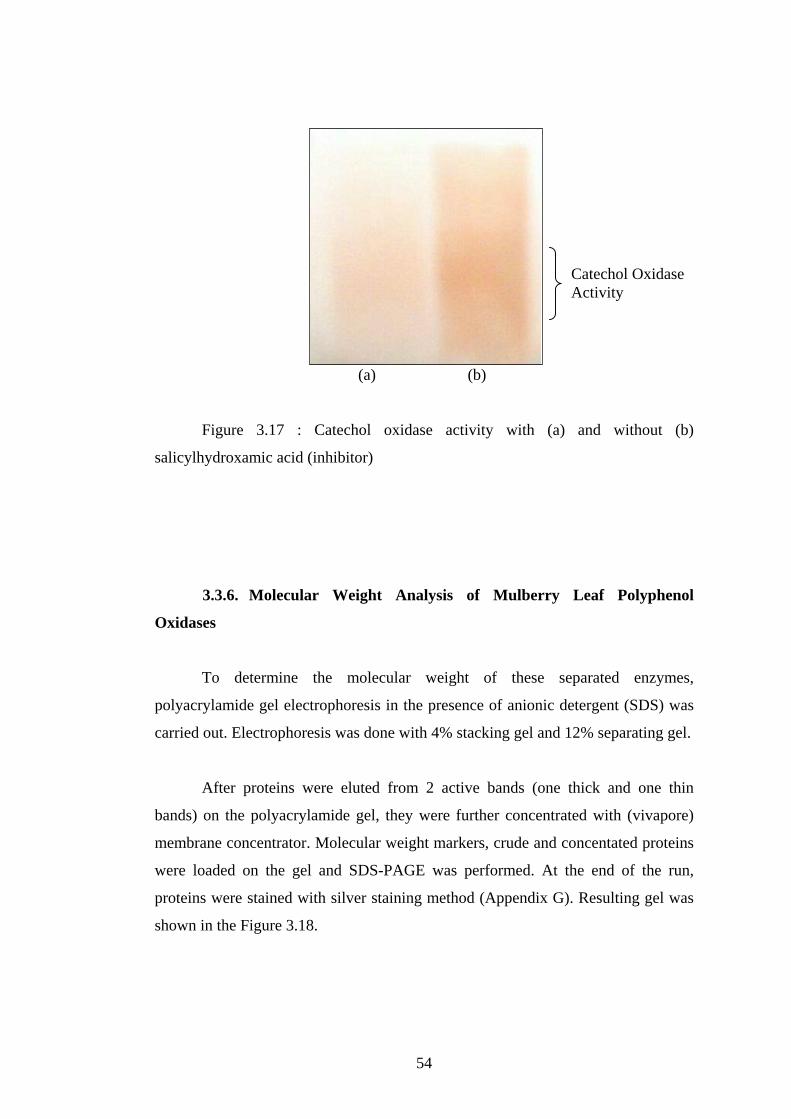
(a) (b)
Catechol Oxidase Activity
Figure 3.17 : Catechol oxidase activity with (a) and without (b)
salicylhydroxamic acid (inhibitor)
3.3.6. Molecular Weight Analysis of Mulberry Leaf Polyphenol
Oxidases
To determine the molecular weight of these separated enzymes,
polyacrylamide gel electrophoresis in the presence of anionic detergent (SDS) was
carried out. Electrophoresis was done with 4% stacking gel and 12% separating gel.
After proteins were eluted from 2 active bands (one thick and one thin
bands) on the polyacrylamide gel, they were further concentrated with (vivapore)
membrane concentrator. Molecular weight markers, crude and concentated proteins
were loaded on the gel and SDS-PAGE was performed. At the end of the run,
proteins were stained with silver staining method (Appendix G). Resulting gel was
shown in the Figure 3.18.
54
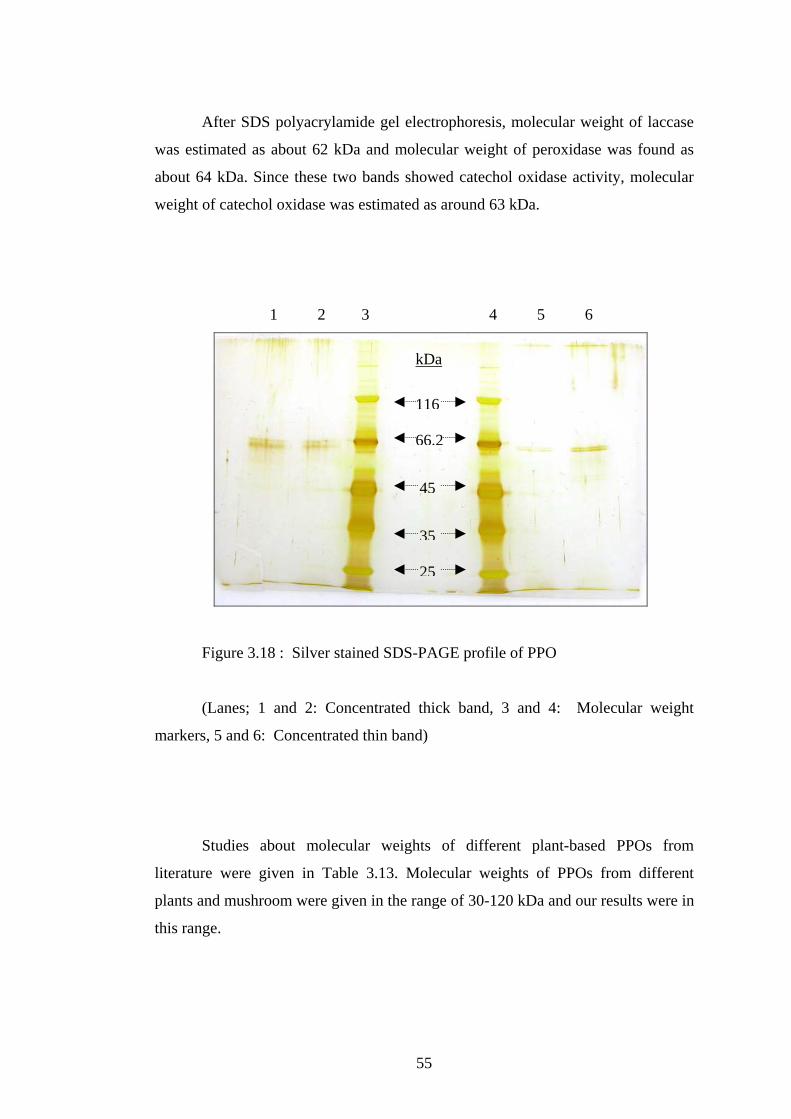
After SDS polyacrylamide gel electrophoresis, molecular weight of laccase
was estimated as about 62 kDa and molecular weight of peroxidase was found as
about 64 kDa. Since these two bands showed catechol oxidase activity, molecular
weight of catechol oxidase was estimated as around 63 kDa.
1 2 3 4 5 6
kDa
116
66.2
45
35
25
Figure 3.18 : Silver stained SDS-PAGE profile of PPO
(Lanes; 1 and 2: Concentrated thick band, 3 and 4: Molecular weight
markers, 5 and 6: Concentrated thin band)
Studies about molecular weights of different plant-based PPOs from
literature were given in Table 3.13. Molecular weights of PPOs from different
plants and mushroom were given in the range of 30-120 kDa and our results were in
this range.
55
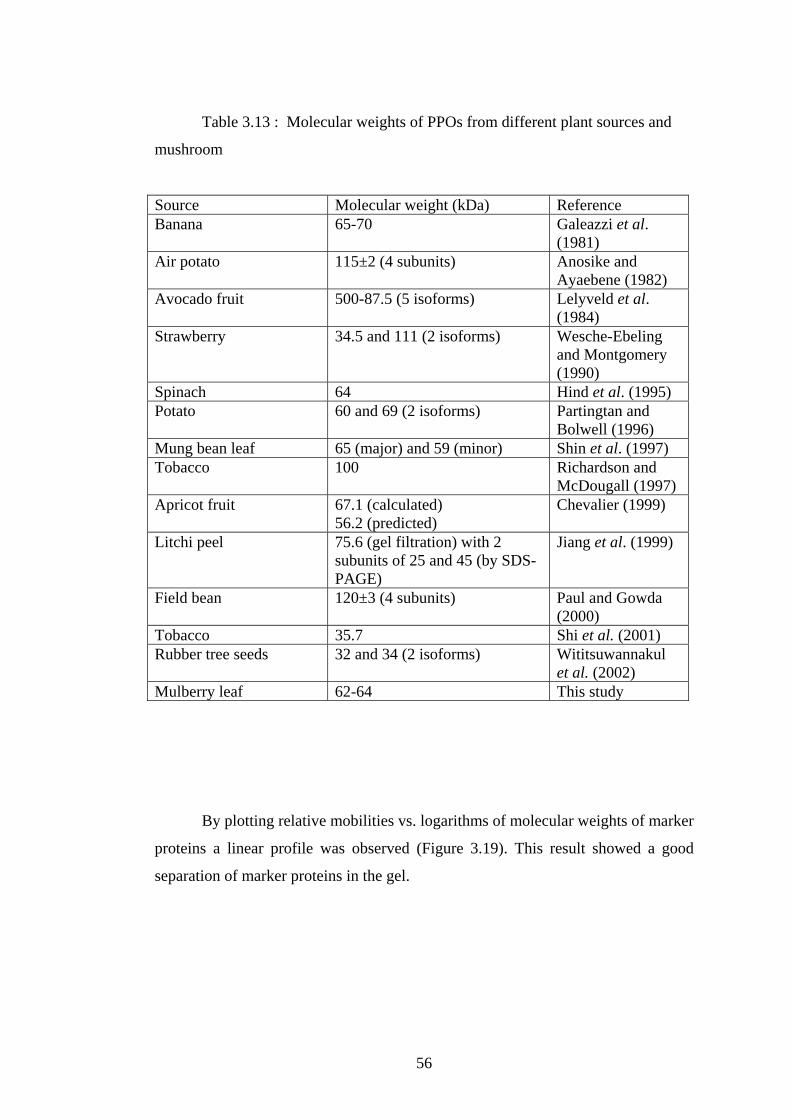
Table 3.13 : Molecular weights of PPOs from different plant sources and
mushroom
Source Molecular weight (kDa) Reference Banana 65-70 Galeazzi et al.
(1981) Air potato 115±2 (4 subunits) Anosike and
Ayaebene (1982) Avocado fruit 500-87.5 (5 isoforms) Lelyveld et al.
(1984) Strawberry 34.5 and 111 (2 isoforms) Wesche-Ebeling
and Montgomery (1990)
Spinach 64 Hind et al. (1995) Potato 60 and 69 (2 isoforms) Partingtan and
Bolwell (1996) Mung bean leaf 65 (major) and 59 (minor) Shin et al. (1997) Tobacco 100 Richardson and
McDougall (1997) Apricot fruit 67.1 (calculated)
56.2 (predicted) Chevalier (1999)
Litchi peel 75.6 (gel filtration) with 2 subunits of 25 and 45 (by SDS-PAGE)
Jiang et al. (1999)
Field bean 120±3 (4 subunits) Paul and Gowda (2000)
Tobacco 35.7 Shi et al. (2001) Rubber tree seeds 32 and 34 (2 isoforms) Wititsuwannakul
et al. (2002) Mulberry leaf 62-64 This study
By plotting relative mobilities vs. logarithms of molecular weights of marker
proteins a linear profile was observed (Figure 3.19). This result showed a good
separation of marker proteins in the gel.
56
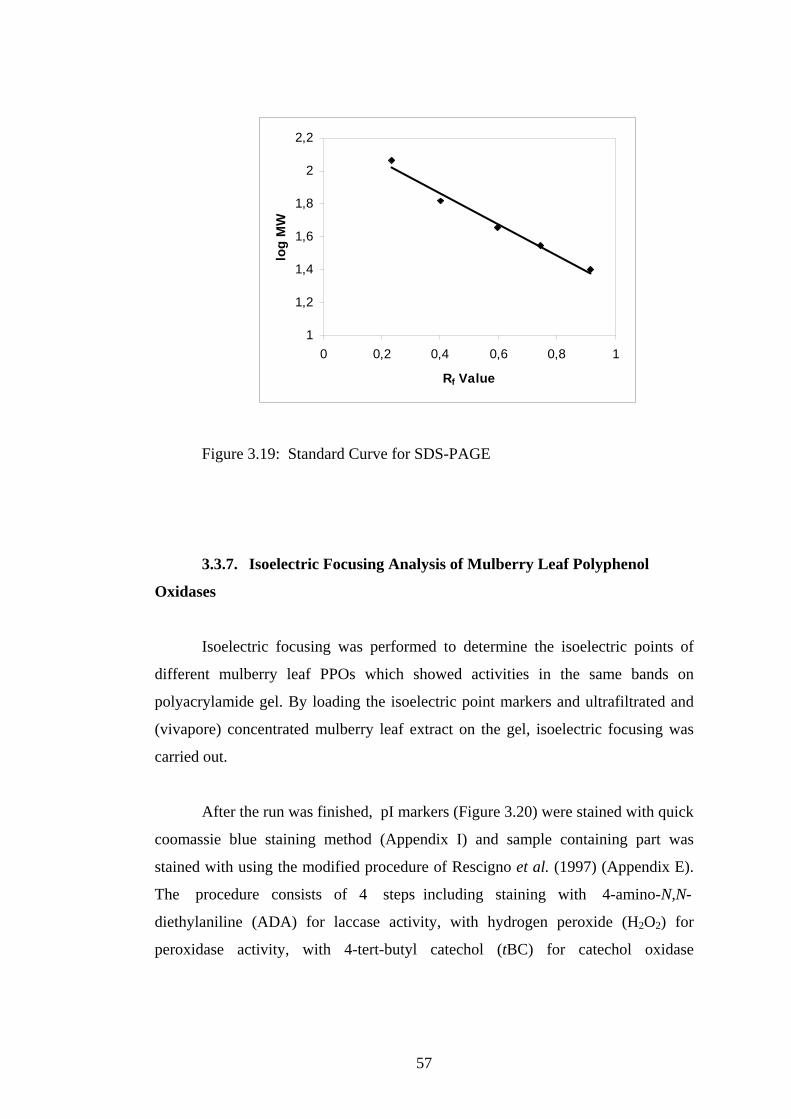
1
1,2
1,4
1,6
1,8
2
2,2
0 0,2 0,4 0,6 0,8 1
Rf Value
log
MW
Figure 3.19: Standard Curve for SDS-PAGE
3.3.7. Isoelectric Focusing Analysis of Mulberry Leaf Polyphenol
Oxidases
Isoelectric focusing was performed to determine the isoelectric points of
different mulberry leaf PPOs which showed activities in the same bands on
polyacrylamide gel. By loading the isoelectric point markers and ultrafiltrated and
(vivapore) concentrated mulberry leaf extract on the gel, isoelectric focusing was
carried out.
After the run was finished, pI markers (Figure 3.20) were stained with quick
coomassie blue staining method (Appendix I) and sample containing part was
stained with using the modified procedure of Rescigno et al. (1997) (Appendix E).
The procedure consists of 4 steps including staining with 4-amino-N,N-
diethylaniline (ADA) for laccase activity, with hydrogen peroxide (H2O2) for
peroxidase activity, with 4-tert-butyl catechol (tBC) for catechol oxidase
57
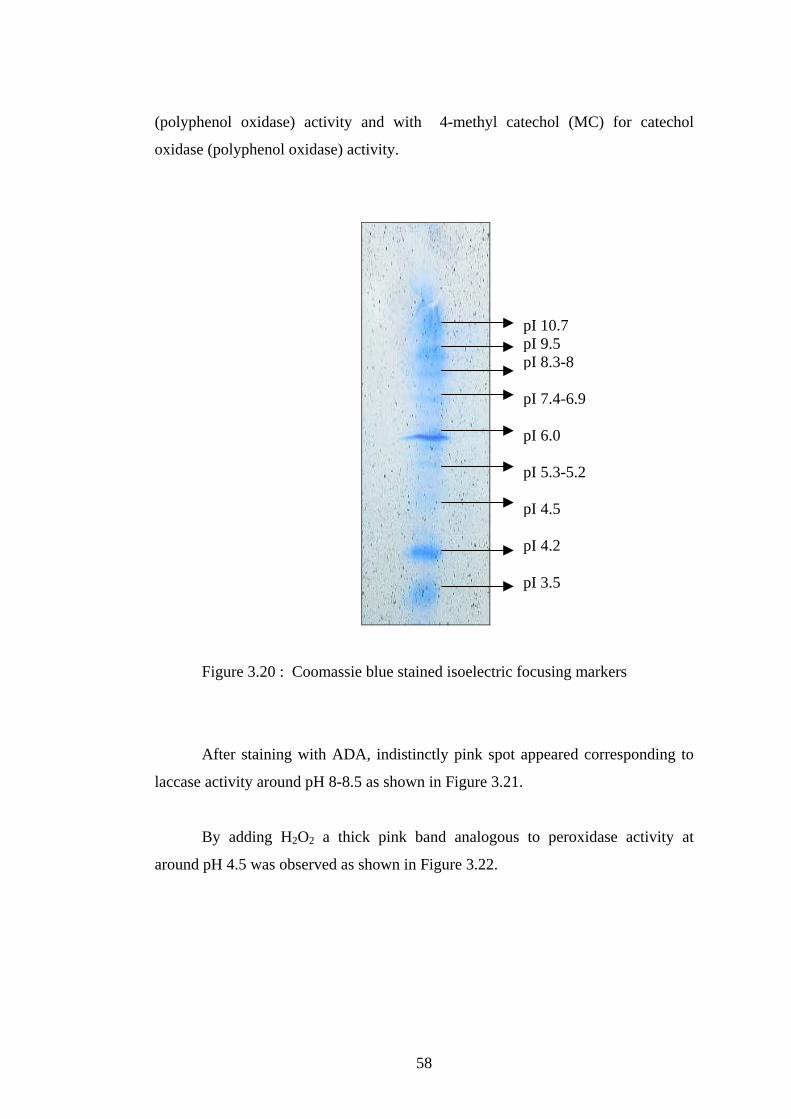
(polyphenol oxidase) activity and with 4-methyl catechol (MC) for catechol
oxidase (polyphenol oxidase) activity.
pI 10.7 pI 9.5 pI 8.3-8 pI 7.4-6.9 pI 6.0 pI 5.3-5.2 pI 4.5 pI 4.2 pI 3.5
Figure 3.20 : Coomassie blue stained isoelectric focusing markers
After staining with ADA, indistinctly pink spot appeared corresponding to
laccase activity around pH 8-8.5 as shown in Figure 3.21.
By adding H2O2 a thick pink band analogous to peroxidase activity at
around pH 4.5 was observed as shown in Figure 3.22.
58
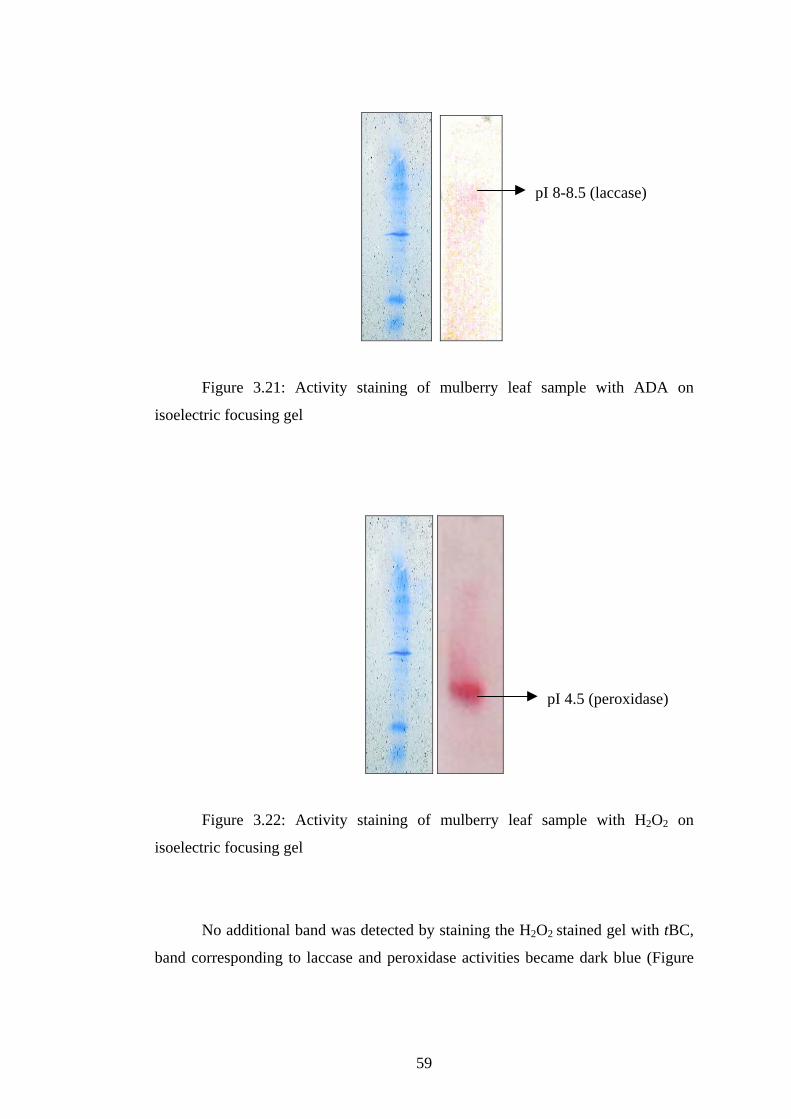
pI 8-8.5 (laccase)
Figure 3.21: Activity staining of mulberry leaf sample with ADA on
isoelectric focusing gel
pI 4.5 (peroxidase)
Figure 3.22: Activity staining of mulberry leaf sample with H2O2 on
isoelectric focusing gel
No additional band was detected by staining the H2O2 stained gel with tBC,
band corresponding to laccase and peroxidase activities became dark blue (Figure
59
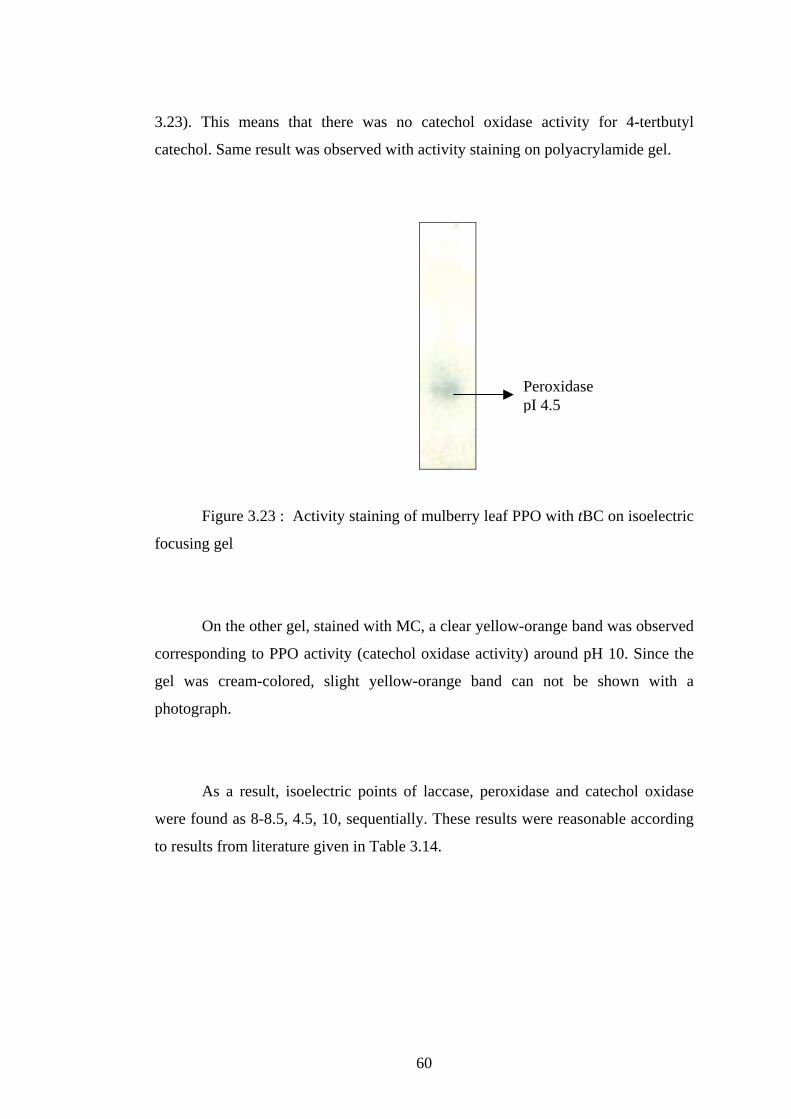
3.23). This means that there was no catechol oxidase activity for 4-tertbutyl
catechol. Same result was observed with activity staining on polyacrylamide gel.
Peroxidase pI 4.5
Figure 3.23 : Activity staining of mulberry leaf PPO with tBC on isoelectric
focusing gel
On the other gel, stained with MC, a clear yellow-orange band was observed
corresponding to PPO activity (catechol oxidase activity) around pH 10. Since the
gel was cream-colored, slight yellow-orange band can not be shown with a
photograph.
As a result, isoelectric points of laccase, peroxidase and catechol oxidase
were found as 8-8.5, 4.5, 10, sequentially. These results were reasonable according
to results from literature given in Table 3.14.
60
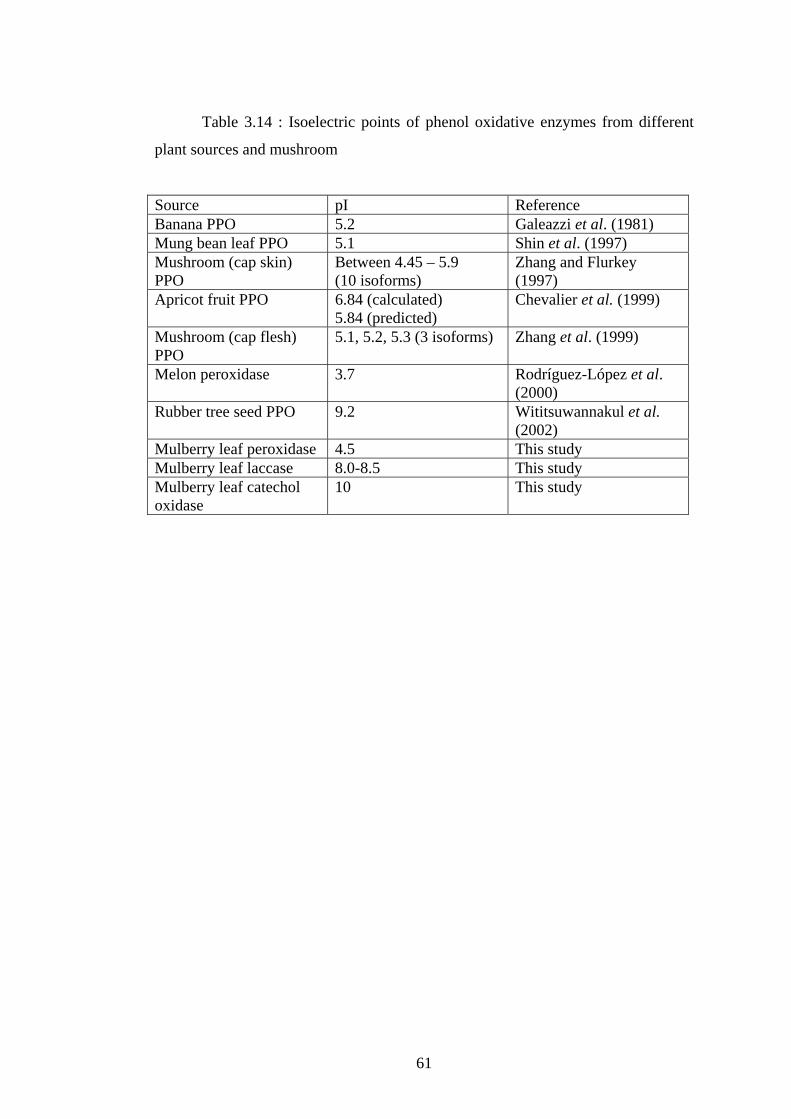
Table 3.14 : Isoelectric points of phenol oxidative enzymes from different
plant sources and mushroom
Source pI Reference Banana PPO 5.2 Galeazzi et al. (1981) Mung bean leaf PPO 5.1 Shin et al. (1997) Mushroom (cap skin) PPO
Between 4.45 – 5.9 (10 isoforms)
Zhang and Flurkey (1997)
Apricot fruit PPO 6.84 (calculated) 5.84 (predicted)
Chevalier et al. (1999)
Mushroom (cap flesh) PPO
5.1, 5.2, 5.3 (3 isoforms) Zhang et al. (1999)
Melon peroxidase 3.7 Rodríguez-López et al. (2000)
Rubber tree seed PPO 9.2 Wititsuwannakul et al. (2002)
Mulberry leaf peroxidase 4.5 This study Mulberry leaf laccase 8.0-8.5 This study Mulberry leaf catechol oxidase
10 This study
61
CHAPTER 4
CONCLUSIONS AND RECOMMENDATIONS
The aim of this study was to find an economical plant source for PPO
production, characterization and immobilization of the PPOs for the ultimate
purpose of PPO electrode and/or immobilized PPO bioreactor development. For this
purpose, different plant tissues of no commercial value like horse chestnut fruits
and leaves of many fruit trees, were screened for PPO activities. Since mulberry
leaf tissues showed the highest PPO activity against 4-methyl catechol, PPOs from
mulberry leaf tissues were immobilized and characterized. Pear, sour cherry and
apricot leaves were also good PPO sources. Other plant materials; cherry, chestnut,
apple, grape, quince leaves, hazelnut fruit shell and horse chestnut fruit showed
lower PPO activities.
Mulberry leaf tissue PPOs were found to be suitable for phenolic
determination and/or removal from neutral systems without dilution because
optimum pH was found as 7. Especially for phenolic determination in wine, having
an acidic pH, mulberry leaf PPOs could be used after diluting the sample in order to
increase pH values. For waste waters at high pHs, like paper and pulp industry
waste water, mulberry leaf PPOs seemed to be suitable for phenolics removal. Since
sour cherry and pear leaf tissue PPOs showed acidic optimum pH, they can be more
suitable for acidic systems, like wine.
61
Laccase, peroxidase and catechol oxidase activities were detected in
mulberry leaf tissues with a very close molecular weight of 63 kDa and isoelectric
points of 8.0-8.5, 4.5 and 10, sequentially. Since three different types of phenol
oxidative enzymes were found in mulberry leaf tissues, it could be advantageous to
use them together in phenolic concentration determination within an electrode and
phenolic removal from waste waters because of the existence of a wide substrate
range. It could be also possible to separate these three types of enzymes and used
them for specific purposes.
Average Km and Vmax values of free mulberry leaf and mushroom PPOs
were found as 7 mM, 218 U/ml and 3 mM, 300 U/ml, respectively. No substrate
inhibition was observed for mulberry leaf PPOs in the tested substrate concentration
range, where mushroom PPOs showed substrate inhibition with a Ksi value of 130
mM. Therefore at high substrate concentrations it can be advantageous to use
mulberry leaf PPOs.
After immobilization of PPOs in polypyrole matrix, average Km and Vmax
values of mulberry leaf and mushroom PPOs were found as 35 mM, 3 U/ml and 20
mM, 5 U/ml, respectively. Results showed that Km values increased after
immobilization because of the diffusional resistance where as Vmax values can not
be compared since the quantity of immobilized enzyme was not known. To
overcome diffusional resistance, instead of matrix entrapment, PPOs can be
immobilized on a surface. Since our PPO source was dilute and partially purified, it
was difficult to perform a successful immobilization. By purification and
concentration of the enzyme immobilization can be improved.
62
REFERENCES
Alkan, S., Toppare, L., Bakir, U., Yağci, Y., 2001, “Immobilization of
urease in conducting thiopene-capped poly(methyl methacrylate)/pyrole matrices”,
Synthetic Metals, Vol. 123, pp. 95-99.
Anosike, E.O., Ayaebene, A.O., 1982, “Properties of polyphenol oxidase
from tubers of the yam dioscorea bulbifera”, Phytochemistry, Vol. 21, No. 8, pp.
1889-1893.
Arica, M.Y., 2000, “Immobilization of polyphenol oxidase on
carboxymathylcellulose hydrogel beads: preparation and characterization”, Polymer
International, Vol. 49, pp. 775-781.
Arogba, S.S., Ajiboye, O.L., Ugboko, L.A., Essienette, S.Y., Afolabi, P.O.,
1998, “Properties of polyphenol oxidase in mango (mangifera indica) kernel”,
Journal of the Science of Food and Agriculture, Vol. 77, pp. 459-462.
Besombes, J.L., Cosnier, S., Labbé, P., 1997, “Improvement of
poly(amphiphilic pyrole) enzyme electrodes via the incorporation of synthetic
laponite-clay-nanoparicles”, Talanta, Vol. 44, pp. 2209-2215.
Blum, H., Beier, H., Gross, H.J., 1987, “Improved silver staining of plant
proteins, RNA and DNA in polyacrylamide gels”, Electrophoresis, Vol. 8, pp. 93-
99.
64
Boshhoff, A., Edwards, W., Leukes, W.D., Rose, P.D., Burton, S.G., 1998,
“Immobilization of polyphenol oxidase on nylon and polyethersulphone
membranes: Effect on product formation”, Desalination, Vol. 115, pp. 307-312.
Bradford, M., 1976, “A Rapid and Sensitive Method for the Quantitation of
Microgram Quantities of Protein Utilizing the Principle of Protein-Dye Binding”,
Analytical Biochemistry, Vol. 72, pp. 248-254.
Bugg, T. D. H., Winfield, C. J., 1998, “Enzymatic Cleavage of Aromatic
Rings: Mechanistic Aspects of the Catechol Dioxygenases and Later Enzymes of
Bacterial Oxidative Cleavage Pathways”, Natural Product Reports, Vol. 15, pp.
513-530.
Chang, S.C., Rawson, K., McNeil, C.J., 2002, “Disposable tyrosinase-
peroxidase bi-enzyme sensor for amperometric detection of phenols”, Biosensors
and Bioelectronics, Vol. 17, pp. 1015-1023.
Chazarra, S., Garciá-Carmona, F., Cabanes, J., 1999, “Characterization of
monophenolase activity of polyphenol oxidase from iceberg lettuce”, Journal of
Agricultural and Food Chemistry, Vol. 47, pp. 1422-1426.
Chevalier, T., de Rigal, D., Mbéguié-A-Mbéguié, D., Gauillard, F., Richard-
Forget, F., Fils-Lycaon, B.R., 1999, “Molecular cloning and characterization of
apricot fruit polyphenol oxidase”, Plant Physiology, Vol. 119, pp. 1261-1269.
Dincer, B., Colak, A., Aydın, N., Kadioglu, A., Güner, S., 2002,
“Characterization of polyphenol oxidase from medlar fruits (Mespilus germanica
L., Rosaceae)”, Food Chemistry, Vol. 77, No. 1, pp. 1-7.
65
Durán, N., Esposito, E., 2000, “Potential applications of oxidative enzymes
and phenoloxidase-like compounds in wastewater and soil treatment: a review”,
Applied Catalysis B: Environmental, Vol. 28, pp. 83-99.
Durán, N., Rosa, M.A., Annibale, A.D., Gianfreda, L., 2002, “Application of
laccases and tyrosinases (phenol oxidases) immobilized on different supports: a
review”, Enzyme and Microbial Technology, Vol. 31, pp. 907-931.
Dutta, S., Padhye, S., Narayanaswamy, R., Persaud, K.C., 2001, “An optical
biosensor employing tiron-immobilized polypyrole films for estimating
monophenolase activity in apple juice”, Biosensors and Bioelectronics, Vol. 16, pp.
287-294.
Edwards, W., Leukes, W.D., Rose, P.D., Burton, S.G., 1999,
“Immobilization of polyphenol oxidase on chitosan-coated polypsulphone capillary
membranes for improved phenolic effluent bioremendation”, Enzyme and Microbial
Technology, Vol. 25, pp. 769-773.
Erginer, R., Toppare, L., Alkan, S., Bakir, U., 2000, “Immobilization of
invertase in functionalized copolymer matrices”, Reactive & Functional Polymers,
Vol. 45, pp. 227-233.
Escribano, J., Cabanes, J., García-Carmona, F., 1997, “Characterization of
latent polyphenol oxidase in table beet: Effect of sodium dodecyl sulphate”, Journal
of the Science of Food and Agriculture, Vol. 73, pp. 34-38.
Fenoll, L.G., Rodríguez-López, J.N., García-Molina, F., García-Cánovas, F.,
Tudela, J., 2002, “Michaelis constants of mushroom tyrosinase with respect to
oxygen in the presence of monophenols and diphenols”, The International Journal
of Biochemistry & Cell Biology, Vol. 34, pp. 332-336.
66
Galeazzi, M.A.M., Sgarbieri, V.C., Conctantinides, S.M., 1981, “Isolation,
purification and physicochemical characterization of polyphenol oxidases (PPO)
from a dwarf variety of banana (Musa cavendishii, L.)”, Journal of Food Science,
Vol. 46, pp. 150-155.
González, E.M., de Ancos, B., Cano, M.P., 1999, “Partial characterization
of polyphenol oxidase activity in raspberry fruits”, Journal of Agricultural and
Food Chemistry, Vol. 47, pp. 4068-4072.
Goodenough, P.W., Kessell, S., Lea, A.G.H., Loeffler, T., 1983, “Mono-
and diphenolase activity from fruit of malus pumila”, Phytochemistry, Vol. 22, No.
2, pp. 359-363.
Hartmeier, W., 1988, “Immobilized Biocatalysis: An Introduction”,
Springer-Verlag, New York.
Hasegawa, S., Maier, V.P., 1980, “Polyphenol oxidases of dates”, Journal of
Agricultural and Food Chemistry, Vol. 28, pp. 891-893.
Hind, G., Marshak, D.R.., Coughlan, 1995, “Spinach thylakoid polyphenol
oxidase: Cloning, characterization and relation to a putative protein kinase”,
Biochemistry, Vol. 34, pp. 8157-8164.
Ingebrigsten, J., Flurkey, W.H., 1988, “Affinity and hydrophobic
chromatography of mushroom tyrosinase”, Phytochemistry, Vol. 27, No. 6, pp.
1593-1599.
Jiang, Y., Fu, J., Zauberman, G., Fuchs, Y., 1999, “Purification of
polyphenol oxidase and the browning control of litchi fruit by glutathione and citric
acid”, Journal of the Science of Food and Agriculture, Vol. 79, pp. 950-954.
67
Kader, F., Rovel, B., Girardin, M., Metche, M., 1997, “Mechanism of
browning in fresh highbush blueberry fruit (Vaccinium corymbosum L). Partial
purification and characterisation of blueberry polyphenol oxidase”, Journal of the
Science of Food and Agriculture, Vol. 73, pp. 513-516.
Kahn, V., 1983, “Multiple effects of hydrogen peroxide on the activity of
avocado polyphenol oxidase”, Phytochemistry, Vol. 22, No. 10, pp. 2155-2159.
Kiralp, S., Toppare, L., Yagci, Y., 2003, “Immobilization of polyphenol
oxidase in conducting copolymers and determination of phenolic compounds in
wines with enzyme electrodes”, International Journal of Biological
Macromolecules, Paper in Press.
Lee, C.Y., Smith, N.L., 1979, “Blanching effect on polyphenol oxidase
activity in table beets”, Journal of Food Science, Vol. 44, No. 1, pp. 82-86.
Lelyveld, L.J.V., Gerrish, C., Dixon, R.A., 1984, “Enzyme activities and
polyphenols related to mesocarp discolouration of avocado fruit”, Phytochemistry,
Vol. 23, No. 8, pp. 1531-1534.
Mazzafera, P., Robinson, S.P., 2000, “Characterization of polyphenol
oxidase in coffee”, Phytochemistry, Vol.55, pp. 285-296.
Motoda, S., 1979, “Formation of aldehydes from amino acids by polyphenol
oxidase”, Journal of Fermantation Technology, Vol. 57, pp. 79-85.
Murata, M., Tsurutani, M., Hagiwara, S., Homma, S., 1997, “Subcellular
location of polyphenol oxidase in apples”, Bioscience, Biotechnology and
Biochemistry, Vol. 61, No. 9, pp. 1495-1499.
68
Nistor, C., Emnéus, J., Gorton, L., Ciucu, A., 1999, “Improved stability and
altered selectivity of tyrosinase based graphite electrodes for detection of phenolic
compounds”, Analytica Chemica Acta, Vol. 387, pp. 309-326.
Partington, J.C., Bolwell, G.P., 1996, “Purification of polyphenol oxidase
free of the storage protein patatin from potato tuber”, Phytochemistry, Vol. 42, No.
6, pp. 1499-1502.
Partington, J.C., Smith, C., Bolwell, G.P., 1999, “Changes in the location of
polyphenol oxidase in potato (Solanum tuberosum L.) tuber during cell death in
response to impact injury: comoarison with wound tissue”, Planta, Vol. 207, pp.
449-460.
Paul, B., Gowda, L.R., 2000, “Purification and characterization of a
polyphenol oxidase from the seeds of field bean (Dolichos lablab)”, Journal of
Agricultural and Food Chemistry, Vol. 48, pp. 3839-3846.
Pérez-Gilabert, M., Morte, A., Honrubia, M., Garcia-Carmona, F., 2001,
“Partial purification, caharcterization and histochemical localization of fully latent
desert truffle (Terfezia claveryi chatin) polyphenol oxidase”, Journal of
Agricultural and Food Chemistry, Vol. 49, pp. 1922-1927.
Perrella, F.W., 1988, “EZ-FIT: A curve fitting program for the analysis of
enzyme kinetic data”.
Rescigno, A., Sollai, F., Rinaldi, A.C., Soddu, G., Sanjust, E., 1997,
“Polyphenol oxidase activity staining in polyacrylamide electrophoresis gels”,
Journal of Biochemical and Biophysical methods, Vol. 34, pp. 155-159.
69
Rescigno, A., Sollai, F., Sanjust, E., Rinaldi, A.C., Curreli, N., Rinaldi, A.,
1997, “Diafiltration in the presence of ascorbate in the purification of mushroom
tyrosinase”, Phytochemistry, Vol. 46, No. 1, pp. 21-22.
Richardson, A., McDougall, G.J., 1997, “A laccase-type polyphenol oxidase
from lignifying xylem of tobacco”, Phytochemistry, Vol. 44, No. 2, pp. 229-235.
Ridgway, T.J., Tucker, G.A., 1999, “Procedure for the partial purification of
apple leaf polyphenol oxidase suitable for commercial application”, Enzyme and
Microbial Technology, Vol. 24, pp. 225-231.
Rodríguez-López, J.N., Espín, J.C., Amor, F., Tudela, J., Martínez, V.,
Cerdá, A., García-Cánovas, F., 2000, “Purification and kinetic characterization of
an anionic peroxidase from melon (Cucumis melo L.) cultivated under different
salinity conditions”, Journal of Agricultural and Food Chemistry, Vol. 48, pp.
1537-1541.
Roy, I., Sharma, S., Gupta, M.N., 2002, “Separation of an isoenzyme of
polyphenol oxidase from Duranta plumieri by expanded bed chromatography”,
Protein Expression and Purification, Vol. 24, pp. 181-187.
Russell, I.M., Burton, S.G., 1999, “Development and demonstration of an
immobilised-polyphenol oxidase bioprobe for the detection of phenolic pollutants in
water”, Analytica Chimica Acta, Vol. 389, pp. 161-170.
Ryan, J.D., Gregory, P., Tingey, W.M., 1982, “Phenolic oxidase activities in
grandular trichomes of solanum berthaulty”, Phytochemistry, Vol. 21, No. 8, pp.
1885-1887.
70
Sánchez-Ferrer, A., Bru, R., Cabanes, J., Garcia-Carmona, F., 1988,
“Characterization of catecholase and cresolase activities of monastrell grape
polyphenol oxidase”, Phytochemistry, Vol. 27, No. 2, pp. 319-321.
Sánchez-Ferrer, A., Villalba, J., García-Carmona, F., 1989, “Triton x-114as
a tool for purifiying spinach polyphenol oxidase”, Phytochemistry, Vol. 28, No. 5,
pp. 1321-1325.
Schwimmer, S., 1981, “Source Book of Food Enzymology”, AVI Publishing
Co., Westport, Connecticut.
Seetharam, G., Saville, B.A., 2002, “L-DOPA production from tyrosinase
immobilized on zeolite”, Enzyme and Microbial Technology, Vol. 31, pp. 747-753.
Selampinar, F., Akbulut, U., Özden, M.Y., Toppare, L., 1997,
“Immobilization of invertase in conducting polymer matrices”, Biomaterials, Vol.
18, pp. 1163-1168.
Sheptovitsky, Y.G., Brudvig, G.W., 1996, “Isolation and characterization of
spinach photosystem II membrane-associated catalase and polyphenol oxidase”,
Biochemistry, Vol. 35, pp. 16255-16263.
Shi, C., Dai, Y., Xia, B., Xu, X., Xie, Y., Liu, Q., 2001, “The purification
and spectral properties of polyphenol oxidase I from Nicotiana tabacum”, Plant
Molecular Biology Reporter, Vol. 19, pp. 381a-381h.
Shin, R., Froderman, T., Flurkey, W.H., 1997, “Isolation and
characterization of a mung bean leaf polyphenol oxidase”, Phytochemistry, Vol. 45,
No. 1, pp. 15-21.
71
Smith, D.M., Montgomery, M.W., 1985, “Improved methods for the
extraction of polyphenol oxidase from d'Anjou pears”, Phytochemistry, Vol. 24, pp.
901-904.
Tomás-Barberán, A.F., Espin, J.C., 2001, “Phenolic compounds and related
enzymes as determinants of quality in fruits and vegetables”, Journal of the Science
of Food and Agriculture, Vol. 81, pp.853-876.
Wesche-Ebeling, P., Montgomery, M.W., 1990, “Strawberry polyphenol
oxidase: Extraction and partial characterization”, Journal of Food Science, Vol. 55,
No. 5, pp. 1320-1325.
Wesche-Ebeling, P., Montgomery, M.W., 1990, “Strawberry polyphenol
oxidase: Purification and characterization”, Journal of Food Science, Vol. 55, No.
5, pp. 1315-1319.
Wissemann, K.W., Lee, C.Y., 1980, “Purification of grape polyphenol
oxidase with hydrophobic chromatography”, Journal of Chromatography, Vol. 192,
pp. 232-235.
Wititsuwannakul, D., Chareonthiphakorn, N., Pace, M., Wititsuwannakul,
M., 2002, “Polyphenol oxidases from latex of Hevea brasiliensis: Purification and
characterization”, Phytochemistry, Vol. 61, pp. 115-121.
Zaborsky, O., 1973, “Immobilized Enzymes”, CRC Press, Cleveland.
Zhang, X., Flurkey, W.H., 1997, “Phenoloxidases in portabella
mushrooms”, Journal of Food Science, Vol. 62, No. 1, pp. 97-100.
72

Zhang, X., Leeuwen, J., Wichers, H.J., Flurkey, W.H., 1999,
“Characterization of tyrosinase from the cap flesh of portabella mushrooms”,
Journal of Agricultural and Food Chemistry, Vol. 47, pp. 374-378.
73
APPENDIX A
PREPARATION OF BRADFORD REAGENT
Chemicals used to prepare concentrated stock reagent solution (5x stock)
were given in Table A.1.
Table A.1 : Bradford reagent preparation procedure
Chemicals Amount used 85% Ortho-phosphoric acid 500 ml 95% Ethanol 250 ml Brillant Blue G-250 dye 500 mg
These chemicals were mixed and diluted to 1 L with distilled water to
prepare 5x concentrated stock reagent solution.
The stock solution was stored at 4°C. To prepare diluted (1x) reagent
solution 1 volume concentrate was mixed with 4 volumes of distilled water. This
solution was well mixed and filtered.
Bradford reagent should wait at least 24 hours at room temperature before
use.
74
APPENDIX B
PREPARATION OF PROTEIN STANDARD FOR BRADFORD
METHOD
The Bradford assay is very fast and uses about the same amount of protein
as the Lowry assay. It is fairly accurate and samples that are out of range can be
retested within minutes. The Bradford is recommended for general use, especially
for determining protein content of cell fractions and assesing protein concentrations
for gel electrophoresis.
The assay was based on the observation that the absorbance maximum for an
acidic solution of Coomassie Brilliant Blue G-250 shifts from 465 nm to 595 nm
when binding to protein occurs. Both hydrophobic and ionic interactions stabilize
the anionic form of the dye, causing a visible color change. The assay was useful
since the extinction coefficient of a dye-albumin complex solution is constant over a
10-fold concentration range.
Bovine serum albumin (BSA) was used as protein standard. To prepare 1
mg/ml stock BSA solution, 25 mg BSA was dissolved in 25 ml of pH 7 sodium
phosphate buffer. This stock solution was diluted at different ratios given in Table
B.1.
75
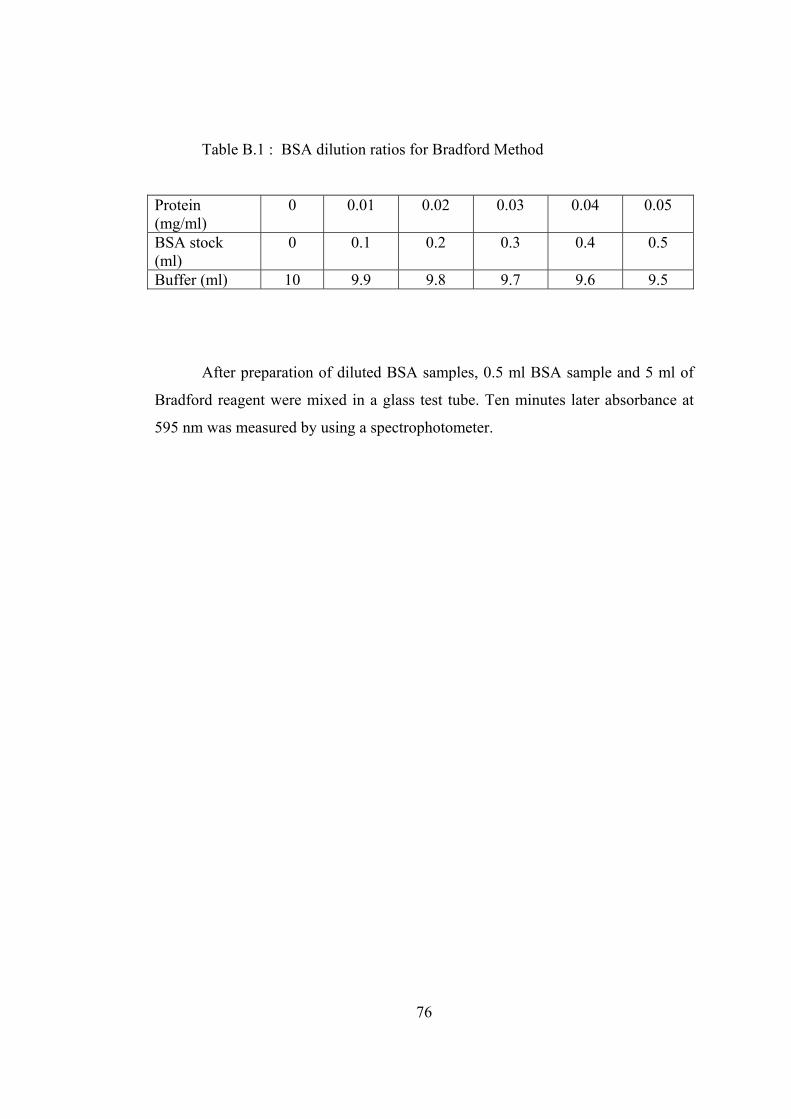
Table B.1 : BSA dilution ratios for Bradford Method
Protein (mg/ml)
0 0.01 0.02 0.03 0.04 0.05
BSA stock (ml)
0 0.1 0.2 0.3 0.4 0.5
Buffer (ml) 10 9.9 9.8 9.7 9.6 9.5
After preparation of diluted BSA samples, 0.5 ml BSA sample and 5 ml of
Bradford reagent were mixed in a glass test tube. Ten minutes later absorbance at
595 nm was measured by using a spectrophotometer.
76
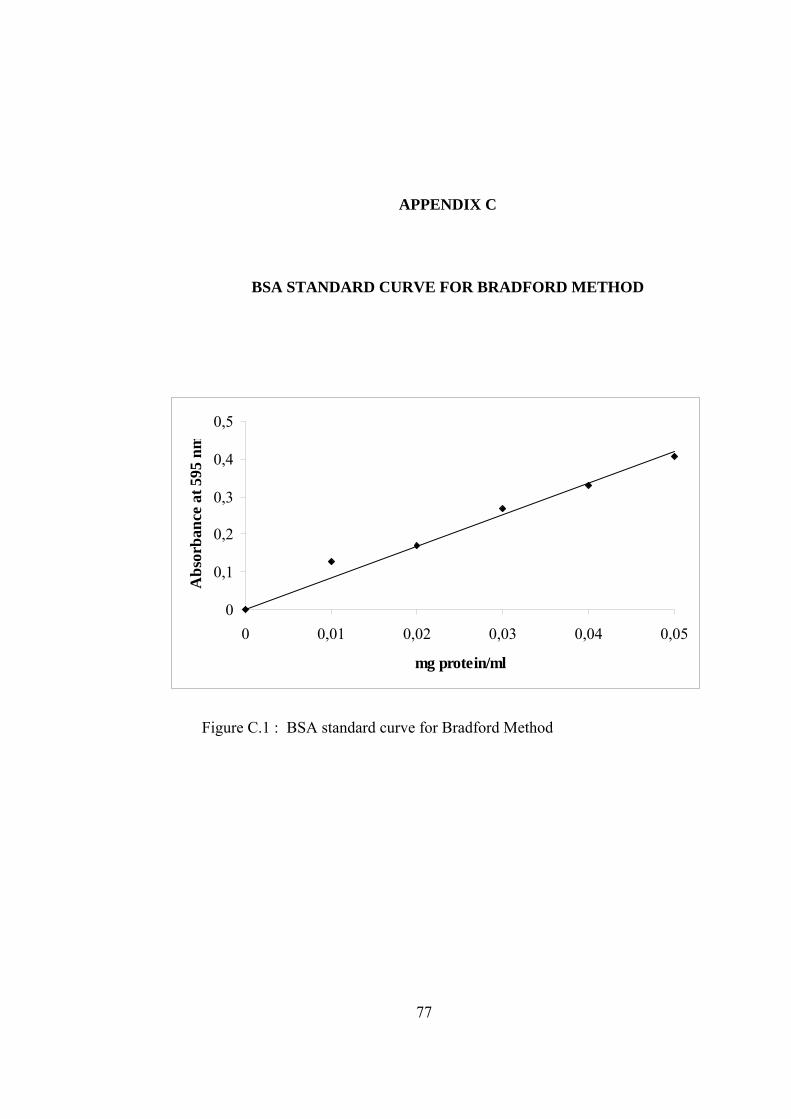
APPENDIX C
BSA STANDARD CURVE FOR BRADFORD METHOD
0
0,1
0,2
0,3
0,4
0,5
0 0,01 0,02 0,03 0,04 0,05
mg protein/ml
Abs
orba
nce
at 5
95 n
m
Figure C.1 : BSA standard curve for Bradford Method
77
APPENDIX D
REAGENTS AND GEL PREPARATION FOR POLYPHENOL
OXIDASE ACTIVITY STAINING OF SLAB GEL
Stock Solutions
A. Acrylamide/bis (30% T, 2.67% C)
87.6 g acrylamide (29.2g/100 ml)
2.4 g N’N’-bis-methylene-acrylamide (0.8g/100 ml)
Make to 300 ml with distilled water. Filter and store at 4°C in the dark
(30 days maximum). Since acrylamide is a neuro toxin, precautions should be taken
by wearing gloves and mask during preparation of this solution.
B. 1.5 M Tris-HCl, pH 8.8
27.23 g Tris base
~80 ml distilled water
Adjust to pH 6.8 with 1N HCl. Make to 100 ml with distilled water and
store at 4°C.
C. 0.5 M Tris-HCl, pH 6.8
6 g Tris base
~60 ml distilled water
Adjust to pH 6.8 with 1N HCl. Make to 100 ml with distilled water and
store at 4°C.
78
D. Sample Buffer (SDS reducing buffer) (store at room temperature)
Distilled water 6.0 ml
0.5 M Tris-HCl, pH 6.8 1.0 ml
Glycerol 0.8 ml
0.05% (w/v) bromophenol blue 0.2 ml
8.0 ml
E. 5X Electrode (Running) Buffer, pH 8.3 (enough for 10 runs)
Tris base 9.0 g
Glycine 43.2 g
SDS 3.0 g
Bring to 600 ml with distilled water. Store at 4°C. Warm to 37°C before
use if precipitation occurs. Dilute 60 ml 5X stock with 240 ml distilled water for
one electrophoretic run.
F. 10% Ammonium Persulfate (APS)
Dissolve 100 mg APS in 1 ml of distilled water in an eppendorf by
vortexing. This solution should be prepared fresh daily.
G. TEMED (N,N-tetramethylene-ethylenediamine)
Use TEMED neat from the bottle.
Procedure
A. Preliminary Preparation
Clean the glasses and spacers with ethanol. Assemble the gel sandwich on a
clean surface. Lay the longer rectangular glass plate down first, the place two
79
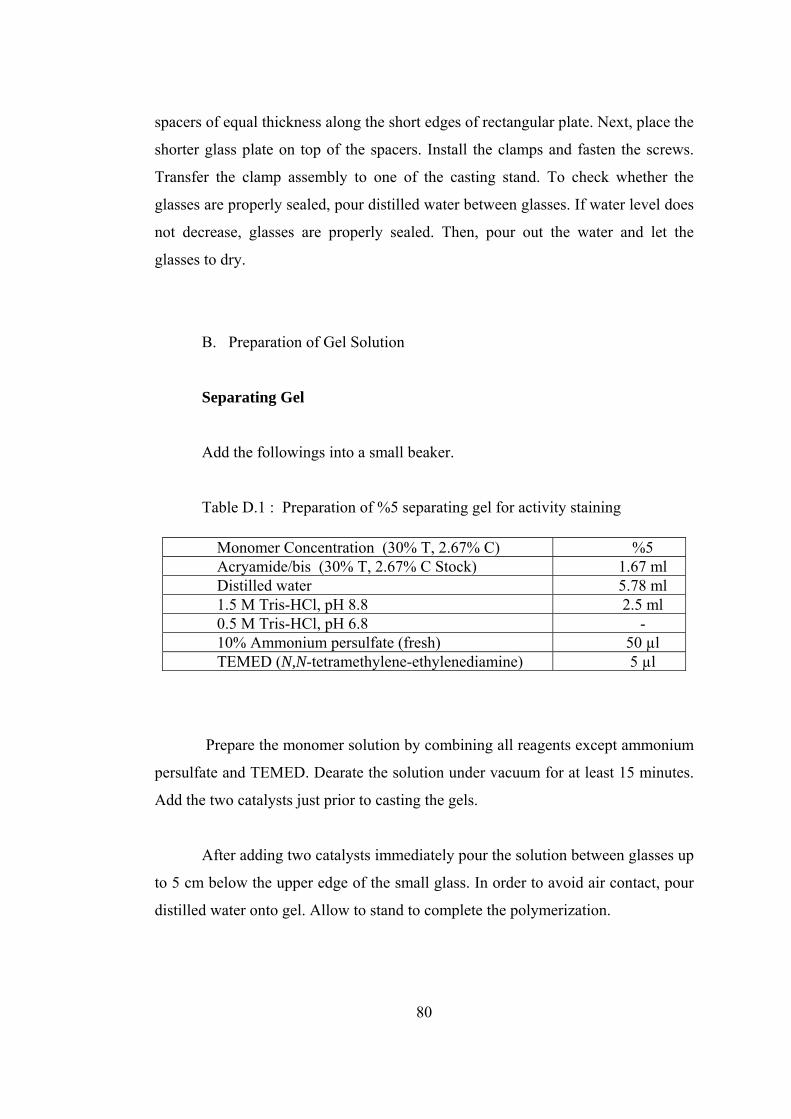
spacers of equal thickness along the short edges of rectangular plate. Next, place the
shorter glass plate on top of the spacers. Install the clamps and fasten the screws.
Transfer the clamp assembly to one of the casting stand. To check whether the
glasses are properly sealed, pour distilled water between glasses. If water level does
not decrease, glasses are properly sealed. Then, pour out the water and let the
glasses to dry.
B. Preparation of Gel Solution
Separating Gel
Add the followings into a small beaker.
Table D.1 : Preparation of %5 separating gel for activity staining
Monomer Concentration (30% T, 2.67% C) %5 Acryamide/bis (30% T, 2.67% C Stock) 1.67 ml Distilled water 5.78 ml 1.5 M Tris-HCl, pH 8.8 2.5 ml 0.5 M Tris-HCl, pH 6.8 - 10% Ammonium persulfate (fresh) 50 µl TEMED (N,N-tetramethylene-ethylenediamine) 5 µl
Prepare the monomer solution by combining all reagents except ammonium
persulfate and TEMED. Dearate the solution under vacuum for at least 15 minutes.
Add the two catalysts just prior to casting the gels.
After adding two catalysts immediately pour the solution between glasses up
to 5 cm below the upper edge of the small glass. In order to avoid air contact, pour
distilled water onto gel. Allow to stand to complete the polymerization.
80
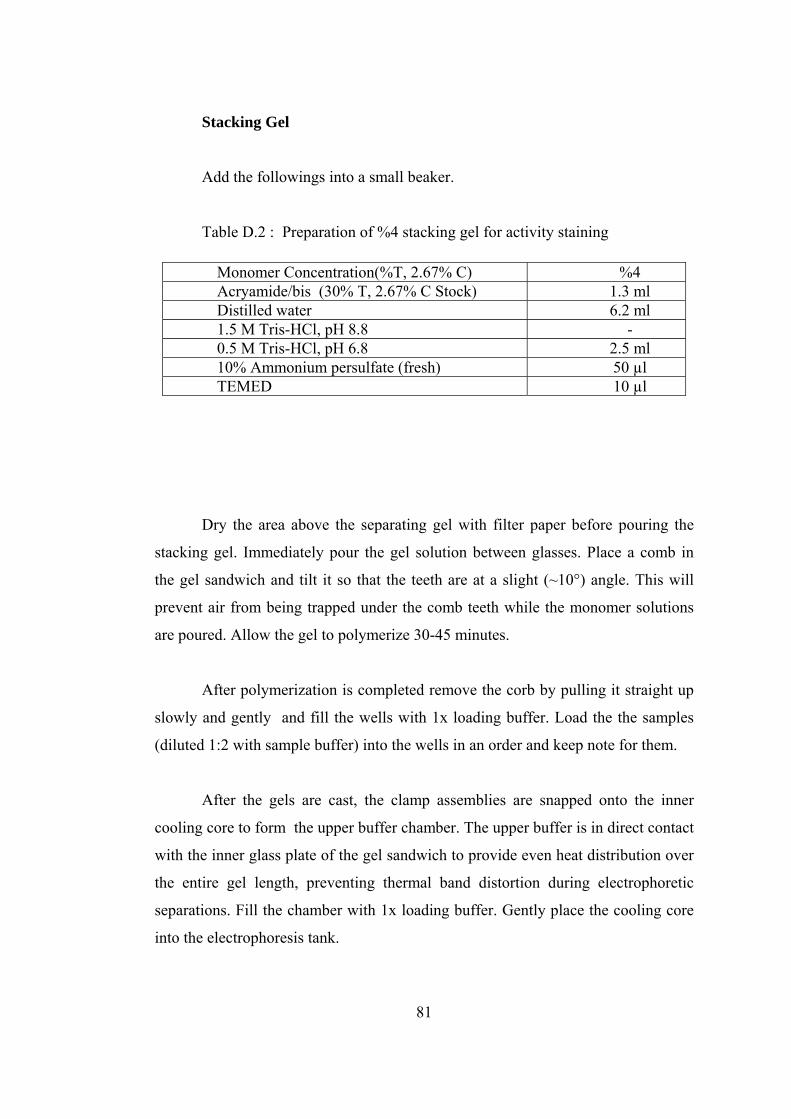
Stacking Gel
Add the followings into a small beaker.
Table D.2 : Preparation of %4 stacking gel for activity staining
Monomer Concentration(%T, 2.67% C) %4 Acryamide/bis (30% T, 2.67% C Stock) 1.3 ml Distilled water 6.2 ml 1.5 M Tris-HCl, pH 8.8 - 0.5 M Tris-HCl, pH 6.8 2.5 ml 10% Ammonium persulfate (fresh) 50 µl TEMED 10 µl
Dry the area above the separating gel with filter paper before pouring the
stacking gel. Immediately pour the gel solution between glasses. Place a comb in
the gel sandwich and tilt it so that the teeth are at a slight (~10°) angle. This will
prevent air from being trapped under the comb teeth while the monomer solutions
are poured. Allow the gel to polymerize 30-45 minutes.
After polymerization is completed remove the corb by pulling it straight up
slowly and gently and fill the wells with 1x loading buffer. Load the the samples
(diluted 1:2 with sample buffer) into the wells in an order and keep note for them.
After the gels are cast, the clamp assemblies are snapped onto the inner
cooling core to form the upper buffer chamber. The upper buffer is in direct contact
with the inner glass plate of the gel sandwich to provide even heat distribution over
the entire gel length, preventing thermal band distortion during electrophoretic
separations. Fill the chamber with 1x loading buffer. Gently place the cooling core
into the electrophoresis tank.
81

Place the lid on top of the buffer chamber to fully enclose the cell. Attach
the electrical leads to a suitable power supply with the proper polarity. The
recommended power condition for optimal resolution with minimal thermal band
distortion is 200 volts, constant voltage setting. The usual run time is approximately
45 minutes. This electrophoresis cell is for rapid separation and is not recommended
for runs over 60 minutes long. When run finishes, extrude gels very carefully. Carry
out the modified activity staining method of Rescigno et al. (1997).
82
APPENDIX E
MODIFIED ACTIVITY STAINING METHOD OF
RESCIGNO et al. (1997)
Reagents
A. 4-amino-N,N-diethylaniline (ADA) Solution
0.655 g 4-amino-N,N-diethylaniline was dissolved in 100 ml of distilled
water. 98 µl HCl was also added. This solution should always be prepared freshly.
B. Hydrogen peroxide (H2O2) Solution
100 µl hydrogen peroxide was mixed with 100 ml of distilled water.
C. 4-tert-butyl catechol Solution (tBC) Solution
0.34 g 4-tert-butyl catechol was dissolved by stirring in 100 ml of distilled
water. 57 µl acetic acid was also added.
D. 4-methyl catechol (MC) Solution
1.24 g 4-methyl catechol was dissolved in 100 ml of distilled water.
E. Sodium phosphate Buffer, pH 7
Stock Solutions
a: 0.2 M solution of monobasic sodium phosphate (27.8 g in 1000 ml of
distilled water)
83
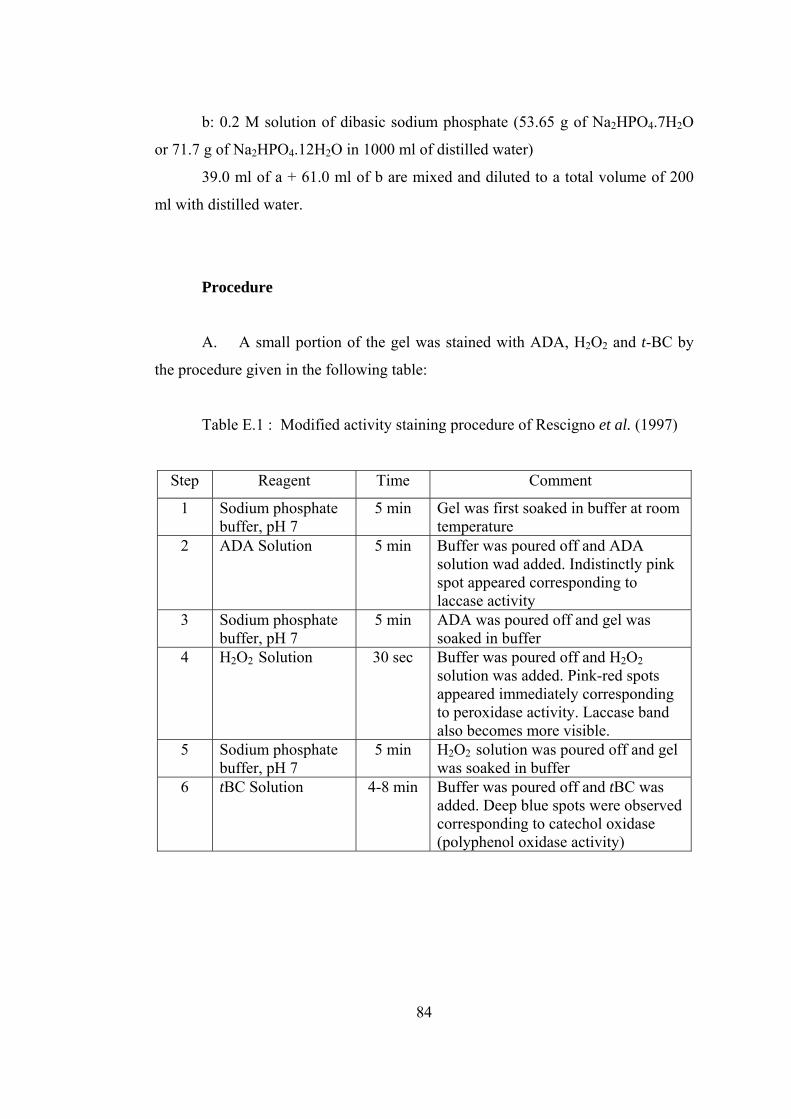
b: 0.2 M solution of dibasic sodium phosphate (53.65 g of Na2HPO4.7H2O
or 71.7 g of Na2HPO4.12H2O in 1000 ml of distilled water)
39.0 ml of a + 61.0 ml of b are mixed and diluted to a total volume of 200
ml with distilled water.
Procedure
A. A small portion of the gel was stained with ADA, H2O2 and t-BC by
the procedure given in the following table:
Table E.1 : Modified activity staining procedure of Rescigno et al. (1997)
Step Reagent Time Comment
1 Sodium phosphate buffer, pH 7
5 min Gel was first soaked in buffer at room temperature
2 ADA Solution 5 min Buffer was poured off and ADA solution wad added. Indistinctly pink spot appeared corresponding to laccase activity
3 Sodium phosphate buffer, pH 7
5 min ADA was poured off and gel was soaked in buffer
4 H2O2 Solution 30 sec Buffer was poured off and H2O2
solution was added. Pink-red spots appeared immediately corresponding to peroxidase activity. Laccase band also becomes more visible.
5 Sodium phosphate buffer, pH 7
5 min H2O2 solution was poured off and gel was soaked in buffer
6 tBC Solution 4-8 min Buffer was poured off and tBC was added. Deep blue spots were observed corresponding to catechol oxidase (polyphenol oxidase activity)
84
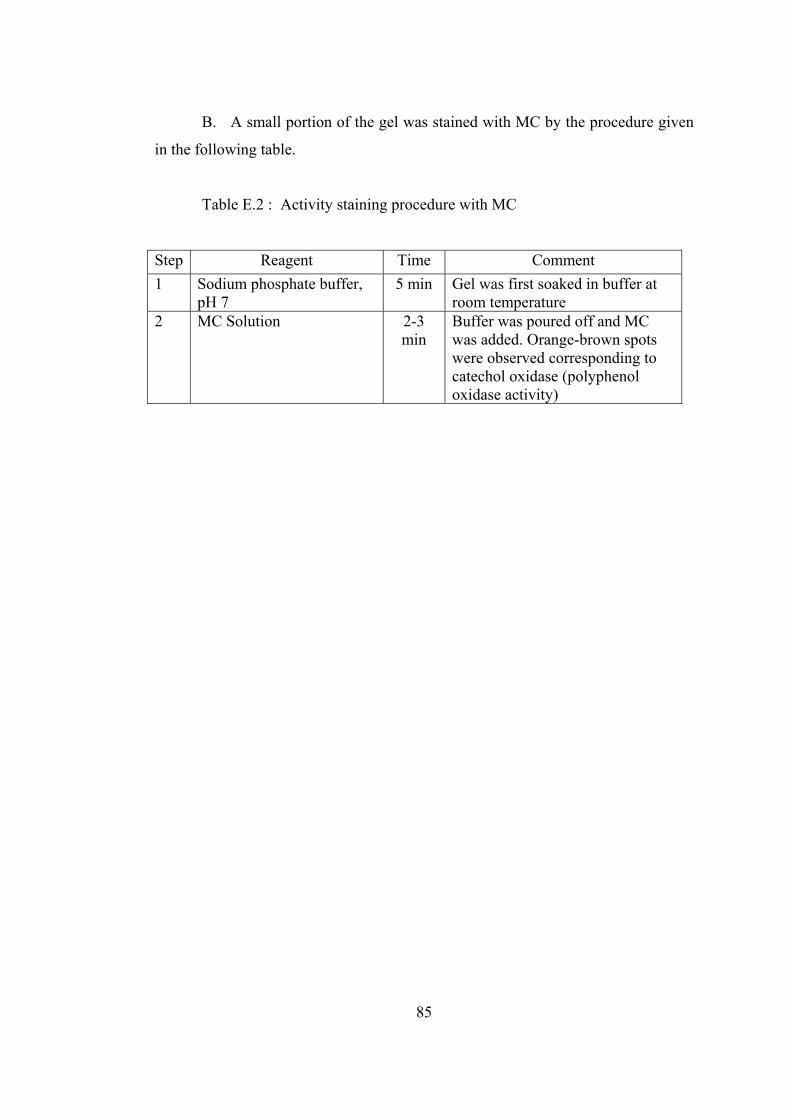
B. A small portion of the gel was stained with MC by the procedure given
in the following table.
Table E.2 : Activity staining procedure with MC
Step Reagent Time Comment 1 Sodium phosphate buffer,
pH 7 5 min Gel was first soaked in buffer at
room temperature 2 MC Solution 2-3
min Buffer was poured off and MC was added. Orange-brown spots were observed corresponding to catechol oxidase (polyphenol oxidase activity)
85
APPENDIX F
REAGENTS AND GEL PREPARATION FOR SDS-PAGE SLAB GEL
(LAEMMLI BUFFER SYSTEM)*
Stock Solutions
A. Acrylamide/bis (30% T, 2.67% C)
87.6 g acrylamide (29.2g/100 ml)
2.4 g N’N’-bis-methylene-acrylamide (0.8g/100 ml)
Make to 300 ml with distilled water. Filter and store at 4°C in the dark
(30 days maximum). Since acrylamide is a neuro toxin, precautions should be taken
by wearing gloves and mask during preparation of this solution.
B. 1.5 M Tris-HCl, pH 8.8
27.23 g Tris base
~80 ml distilled water
Adjust to pH 6.8 with 1N HCl. Make to 100 ml with distilled water and
store at 4°C.
C. 0.5 M Tris-HCl, pH 6.8
6 g Tris base
~60 ml distilled water
Adjust to pH 6.8 with 1N HCl. Make to 100 ml with distilled water and
store at 4°C.
86
D. 10% SDS
Dissolve 10 g SDS in distilled water with gentle stirring and bring to
100 ml with distilled water.
E. Sample Buffer (SDS reducing buffer) (store at room temperature)
Distilled water 4.0 ml
0.5 M Tris-HCl, pH 6.8 1.0 ml
Glycerol 0.8 ml
10% (w/v) SDS 1.6 ml
2-b-mercaptoethanol 0.4 ml
0.05% (w/v) bromophenol blue 0.2 ml
8.0 ml
Dilute the sample at least 1:4 with sample buffer and heat 95°C for 4
minutes.
F. 5X Electrode (Running) Buffer, pH 8.3 (enough for 10 runs)
Tris base 9.0 g
Glycine 43.2 g
SDS 3.0 g
Bring to 600 ml with distilled water. Store at 4°C. Warm to 37°C before
use if precipitation occurs. Dilute 60 ml 5X stock with 240 ml distilled water for
one electrophoretic run.
G. 10% Ammonium Persulfate (APS)
Dissolve 100 mg APS in 1 ml of distilled water in an eppendorf by
vortexing. This solution should be prepared fresh daily.
H. TEMED (N,N-tetramethylene-ethylenediamine)
Use TEMED neat from the bottle.
87
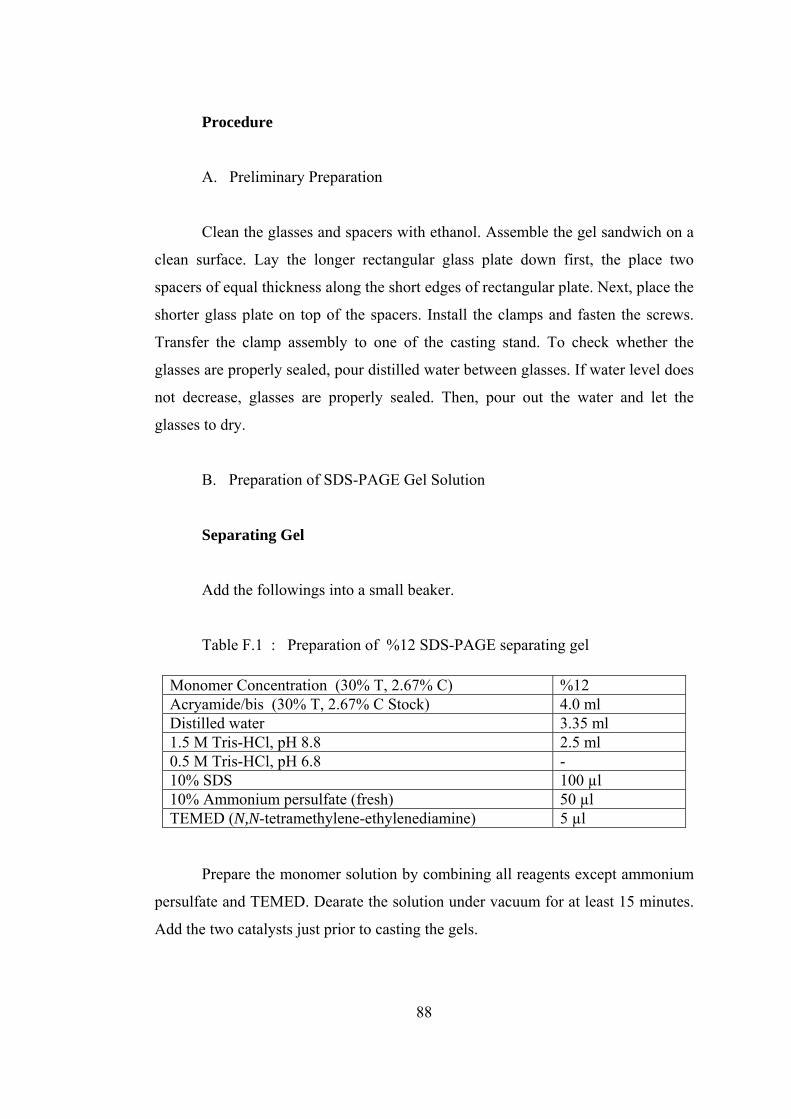
Procedure
A. Preliminary Preparation
Clean the glasses and spacers with ethanol. Assemble the gel sandwich on a
clean surface. Lay the longer rectangular glass plate down first, the place two
spacers of equal thickness along the short edges of rectangular plate. Next, place the
shorter glass plate on top of the spacers. Install the clamps and fasten the screws.
Transfer the clamp assembly to one of the casting stand. To check whether the
glasses are properly sealed, pour distilled water between glasses. If water level does
not decrease, glasses are properly sealed. Then, pour out the water and let the
glasses to dry.
B. Preparation of SDS-PAGE Gel Solution
Separating Gel
Add the followings into a small beaker.
Table F.1 : Preparation of %12 SDS-PAGE separating gel
Monomer Concentration (30% T, 2.67% C) %12 Acryamide/bis (30% T, 2.67% C Stock) 4.0 ml Distilled water 3.35 ml 1.5 M Tris-HCl, pH 8.8 2.5 ml 0.5 M Tris-HCl, pH 6.8 - 10% SDS 100 µl 10% Ammonium persulfate (fresh) 50 µl TEMED (N,N-tetramethylene-ethylenediamine) 5 µl
Prepare the monomer solution by combining all reagents except ammonium
persulfate and TEMED. Dearate the solution under vacuum for at least 15 minutes.
Add the two catalysts just prior to casting the gels.
88
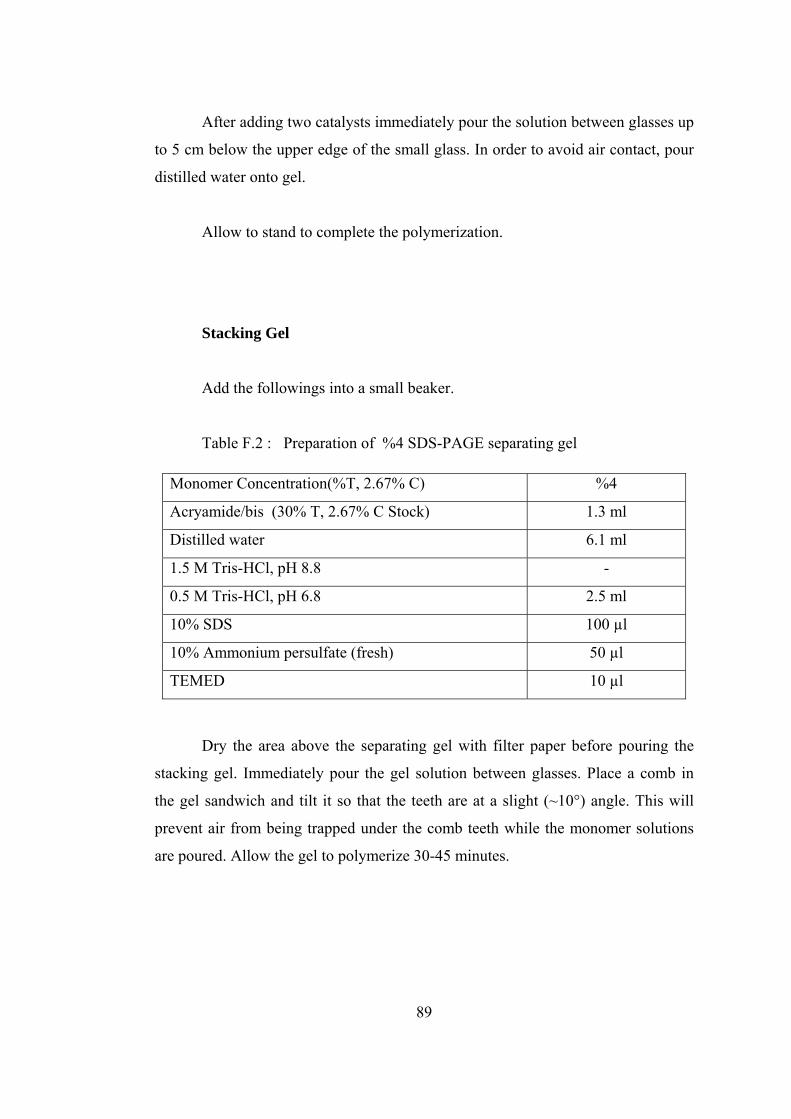
After adding two catalysts immediately pour the solution between glasses up
to 5 cm below the upper edge of the small glass. In order to avoid air contact, pour
distilled water onto gel.
Allow to stand to complete the polymerization.
Stacking Gel
Add the followings into a small beaker.
Table F.2 : Preparation of %4 SDS-PAGE separating gel
Monomer Concentration(%T, 2.67% C) %4
Acryamide/bis (30% T, 2.67% C Stock) 1.3 ml
Distilled water 6.1 ml
1.5 M Tris-HCl, pH 8.8 -
0.5 M Tris-HCl, pH 6.8 2.5 ml
10% SDS 100 µl
10% Ammonium persulfate (fresh) 50 µl
TEMED 10 µl
Dry the area above the separating gel with filter paper before pouring the
stacking gel. Immediately pour the gel solution between glasses. Place a comb in
the gel sandwich and tilt it so that the teeth are at a slight (~10°) angle. This will
prevent air from being trapped under the comb teeth while the monomer solutions
are poured. Allow the gel to polymerize 30-45 minutes.
89
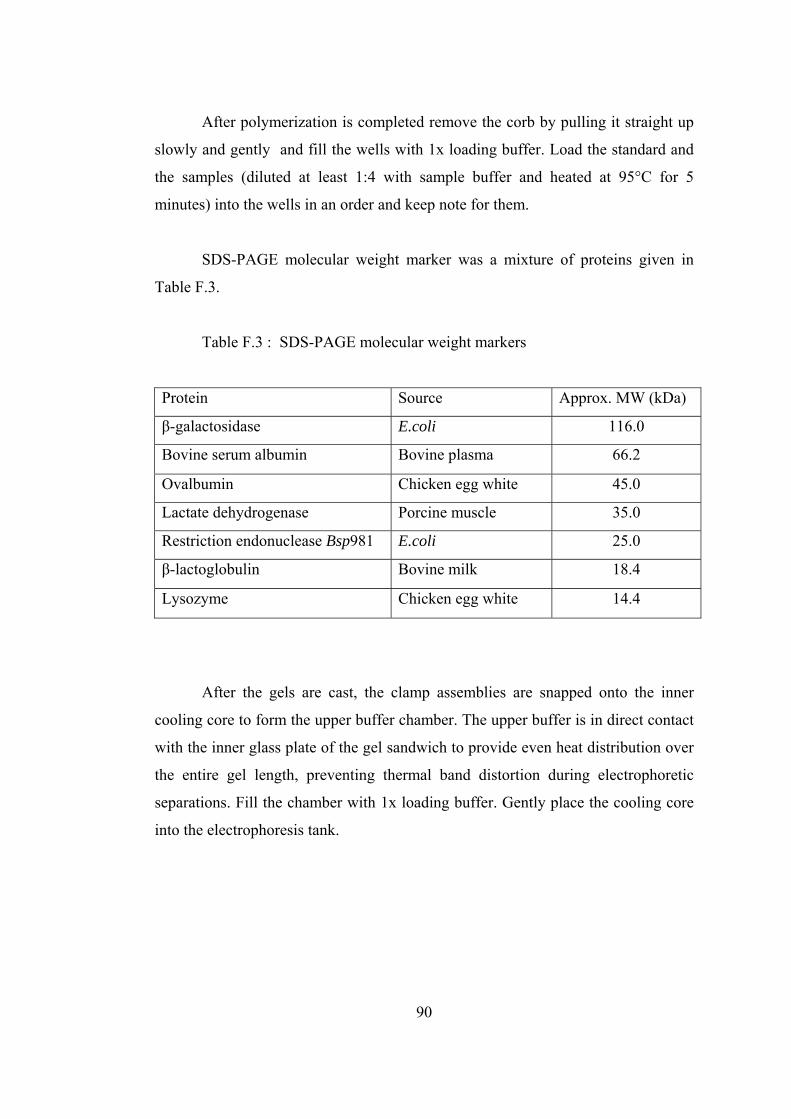
After polymerization is completed remove the corb by pulling it straight up
slowly and gently and fill the wells with 1x loading buffer. Load the standard and
the samples (diluted at least 1:4 with sample buffer and heated at 95°C for 5
minutes) into the wells in an order and keep note for them.
SDS-PAGE molecular weight marker was a mixture of proteins given in
Table F.3.
Table F.3 : SDS-PAGE molecular weight markers
Protein Source Approx. MW (kDa)
β-galactosidase E.coli 116.0
Bovine serum albumin Bovine plasma 66.2
Ovalbumin Chicken egg white 45.0
Lactate dehydrogenase Porcine muscle 35.0
Restriction endonuclease Bsp981 E.coli 25.0
β-lactoglobulin Bovine milk 18.4
Lysozyme Chicken egg white 14.4
After the gels are cast, the clamp assemblies are snapped onto the inner
cooling core to form the upper buffer chamber. The upper buffer is in direct contact
with the inner glass plate of the gel sandwich to provide even heat distribution over
the entire gel length, preventing thermal band distortion during electrophoretic
separations. Fill the chamber with 1x loading buffer. Gently place the cooling core
into the electrophoresis tank.
90
Place the lid on top of the buffer chamber to fully enclose the cell. Attach
the electrical leads to a suitable power supply with the proper polarity. The
recommended power condition for optimal resolution with minimal thermal band
distortion is 200 volts, constant voltage setting. The usual run time is approximately
45 minutes. This electrophoresis cell is for rapid separation and is not recommended
for runs over 60 minutes long.
When run finishes, extrude gels very carefully. Immerse gels in fixing
solution containing 50% methanol, 12% acetic acid (300 ml in total) and 150µl 37%
formaldehyde for at least 1 hr (overnight incubation is all right) in a shaker.
The gels were then silver stained using the procedure of Blum et al. (1987).
91
APPENDIX G
SILVER STAINING METHOD
Reagents
A. Fixer
Mix 150 ml methanol + 36 ml acetic acid + 150 µl 37% formaldehyde and
complete to 300 ml with distilled water. This solution can be used several times.
B. 50% Ethanol
Mix 600 ml pure ethanol + 600 ml distilled water. This solution should
always be prepared freshly.
C. Pretreatment Solution
Dissolve 0.08 g sodium thiosulphate (Na2S2O3.5H2O) in 400 ml distilled
water by mixing with a glass rod. Take 8 ml and set aside for further use in
developing solution preparation.
D. Silver Nitrate Solution
Dissolve 0.8 g silver nitrate in 400 ml distilled water and add 300 µl 37%
formaldehyde.
92
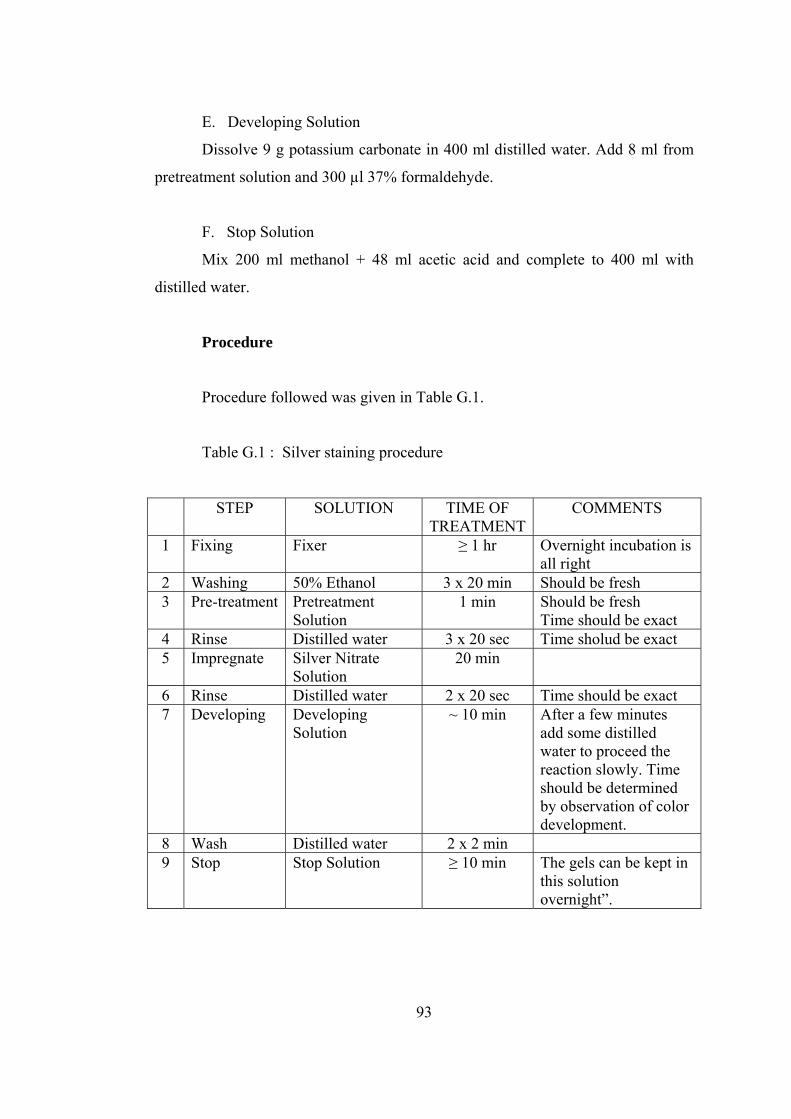
E. Developing Solution
Dissolve 9 g potassium carbonate in 400 ml distilled water. Add 8 ml from
pretreatment solution and 300 µl 37% formaldehyde.
F. Stop Solution
Mix 200 ml methanol + 48 ml acetic acid and complete to 400 ml with
distilled water.
Procedure
Procedure followed was given in Table G.1.
Table G.1 : Silver staining procedure
STEP SOLUTION TIME OF TREATMENT
COMMENTS
1 Fixing Fixer ≥ 1 hr Overnight incubation is all right
2 Washing 50% Ethanol 3 x 20 min Should be fresh 3 Pre-treatment Pretreatment
Solution 1 min Should be fresh
Time should be exact 4 Rinse Distilled water 3 x 20 sec Time sholud be exact 5 Impregnate Silver Nitrate
Solution 20 min
6 Rinse Distilled water 2 x 20 sec Time should be exact 7 Developing Developing
Solution ~ 10 min After a few minutes
add some distilled water to proceed the reaction slowly. Time should be determined by observation of color development.
8 Wash Distilled water 2 x 2 min 9 Stop Stop Solution ≥ 10 min The gels can be kept in
this solution overnight”.
93
APPENDIX H
ISOELECTRIC FOCUSING
Stock Solutions
A. Monomer Concentrate ( 25% T, 3%C)
24.25% (w/v) acrylamide
0.75% (w/v) bis (N,N-bis-methylene-acrylamide)
Dissolve 24.25 g acrylamide and 0.75 g bis in water, bring to a final
volume of 100 ml and filter through a 0.45 µm filter. Store protected from light at
4°C. This solution may be stored up to 1 month.
B. 0.1% (w/v) Riboflavin-5-phosphate (FMN)
20 mg riboflavin-5-phosphate
20 ml distilled water
This solution may be stored up to 1 month at 4°C protected from light.
C. 10% (w/v) Ammonium persulfate (APS)
150 mg APS
1 ml distilled water
Prepare fresh daily. Make sure that the APS is completely dissolved
before using.
94
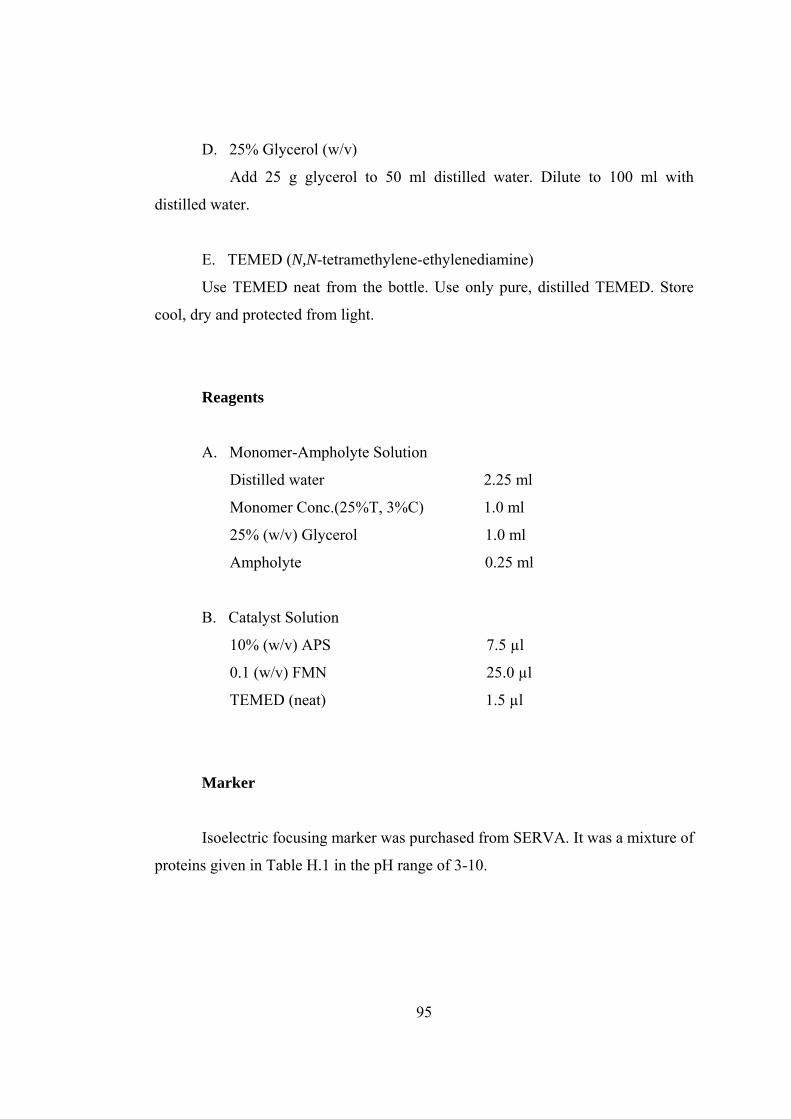
D. 25% Glycerol (w/v)
Add 25 g glycerol to 50 ml distilled water. Dilute to 100 ml with
distilled water.
E. TEMED (N,N-tetramethylene-ethylenediamine)
Use TEMED neat from the bottle. Use only pure, distilled TEMED. Store
cool, dry and protected from light.
Reagents
A. Monomer-Ampholyte Solution
Distilled water 2.25 ml
Monomer Conc.(25%T, 3%C) 1.0 ml
25% (w/v) Glycerol 1.0 ml
Ampholyte 0.25 ml
B. Catalyst Solution
10% (w/v) APS 7.5 µl
0.1 (w/v) FMN 25.0 µl
TEMED (neat) 1.5 µl
Marker
Isoelectric focusing marker was purchased from SERVA. It was a mixture of
proteins given in Table H.1 in the pH range of 3-10.
95
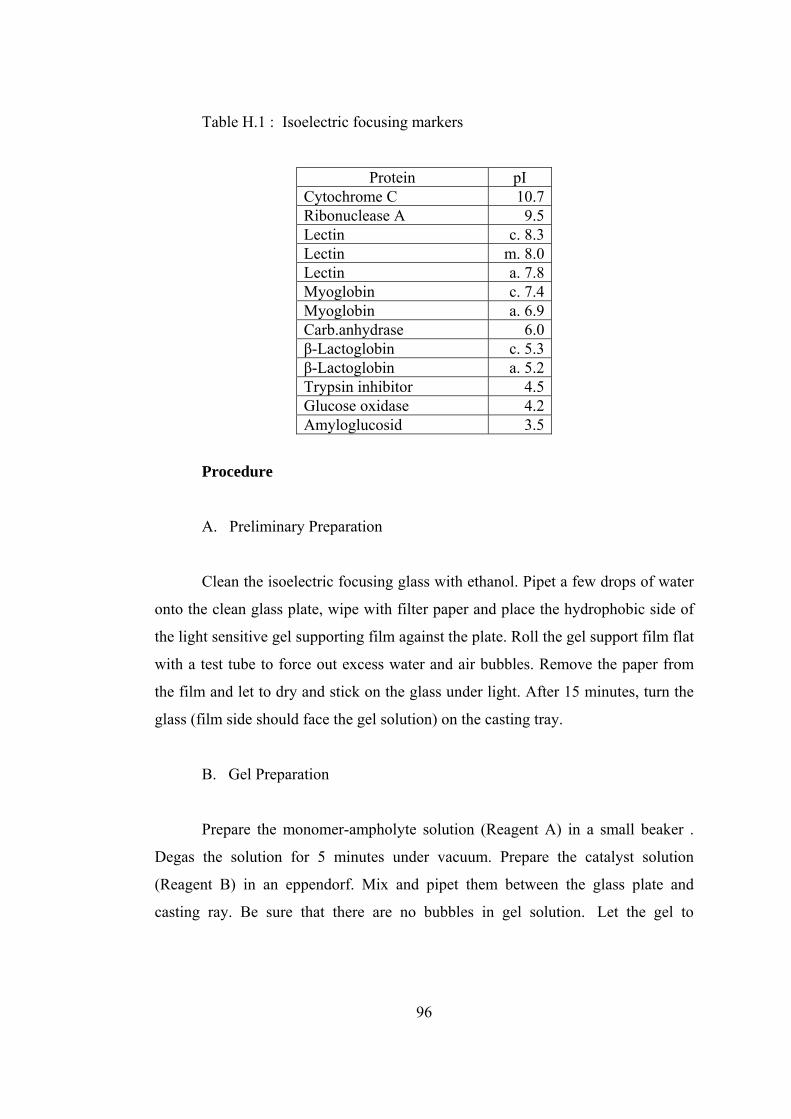
Table H.1 : Isoelectric focusing markers
Protein pI Cytochrome C 10.7Ribonuclease A 9.5Lectin c. 8.3Lectin m. 8.0Lectin a. 7.8Myoglobin c. 7.4Myoglobin a. 6.9Carb.anhydrase 6.0β-Lactoglobin c. 5.3β-Lactoglobin a. 5.2Trypsin inhibitor 4.5Glucose oxidase 4.2Amyloglucosid 3.5
Procedure
A. Preliminary Preparation
Clean the isoelectric focusing glass with ethanol. Pipet a few drops of water
onto the clean glass plate, wipe with filter paper and place the hydrophobic side of
the light sensitive gel supporting film against the plate. Roll the gel support film flat
with a test tube to force out excess water and air bubbles. Remove the paper from
the film and let to dry and stick on the glass under light. After 15 minutes, turn the
glass (film side should face the gel solution) on the casting tray.
B. Gel Preparation
Prepare the monomer-ampholyte solution (Reagent A) in a small beaker .
Degas the solution for 5 minutes under vacuum. Prepare the catalyst solution
(Reagent B) in an eppendorf. Mix and pipet them between the glass plate and
casting ray. Be sure that there are no bubbles in gel solution. Let the gel to
96

polymerize under flourescent light for 2 hours. After polymerization remove the gel
from the plate and turn upwards. Let the gel further polymerize for 30 minutes
under flourescent light. Put the sample template on the gel and load samples. Let the
samples diffuse into the gel approximately 15 minutes. Remove the sample template
and run the gel at 100 V for 15 minutes, at 200 V for 15 minute and at 300 V for 30
minutes to 1 hour.
97
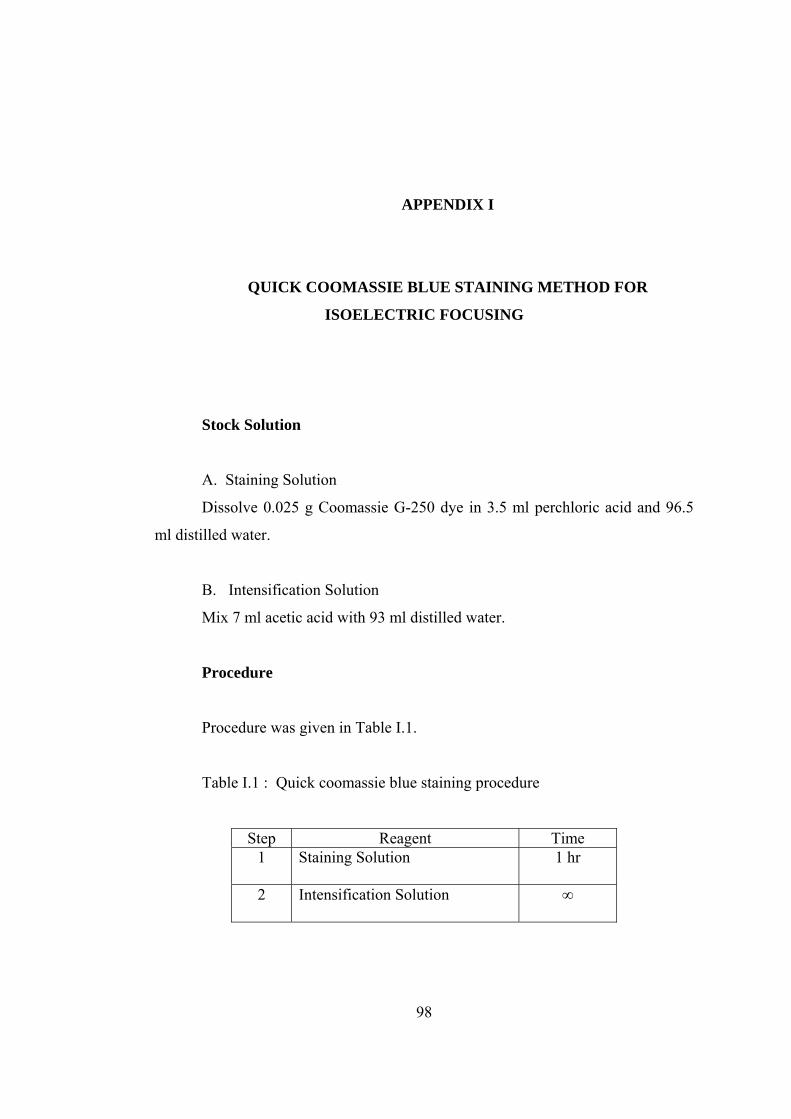
APPENDIX I
QUICK COOMASSIE BLUE STAINING METHOD FOR
ISOELECTRIC FOCUSING
Stock Solution
A. Staining Solution
Dissolve 0.025 g Coomassie G-250 dye in 3.5 ml perchloric acid and 96.5
ml distilled water.
B. Intensification Solution
Mix 7 ml acetic acid with 93 ml distilled water.
Procedure
Procedure was given in Table I.1.
Table I.1 : Quick coomassie blue staining procedure
Step Reagent Time 1 Staining Solution
1 hr
2 Intensification Solution
∞
98


