
Is Record-Breaking Increase in Taiwan Typhoon Rainfall Related to Global Warming?
C.P. Chang1, Y.T. Yang1, H.C. Kuo1, C.H. Sui1, YH. Lei3, XH. Lin4, and FM. Ren5
1 Department of Atmospheric Sciences, National Taiwan University2 Institute of Remote Sensing Applications, Chinese Academy of Sciences3 Fujian Meteorological Bureau, China Meteorological Administration4 National Climate Center, China Meteorological Administration

台灣媒體

Rank YearTyphoon
NameTotal
(h)Rainfall(mm)
1 2009 Morakot 45 8996
2 2001 Nari 75 8108
3 2008 Sinlaku 48 8105
4 2005 Haitang 32 5589
5 1996 Herb 16 4836
6 1989 Sarah 38 4655
7 1960 Shirley 24 4637
8 2007 Krosa 23 3936
9 2004 Mindulle 41 3856
10 2008 Jangmi 25 3800
11 2008 Kalmaegi 23 3763
12 2005 Talim 17 3526
Table 1: The twelve typhoons in 1960-2011 with total rainfall over Taiwan exceeding 3500 mm during the three phases. The eight since 2004 are highlighted.
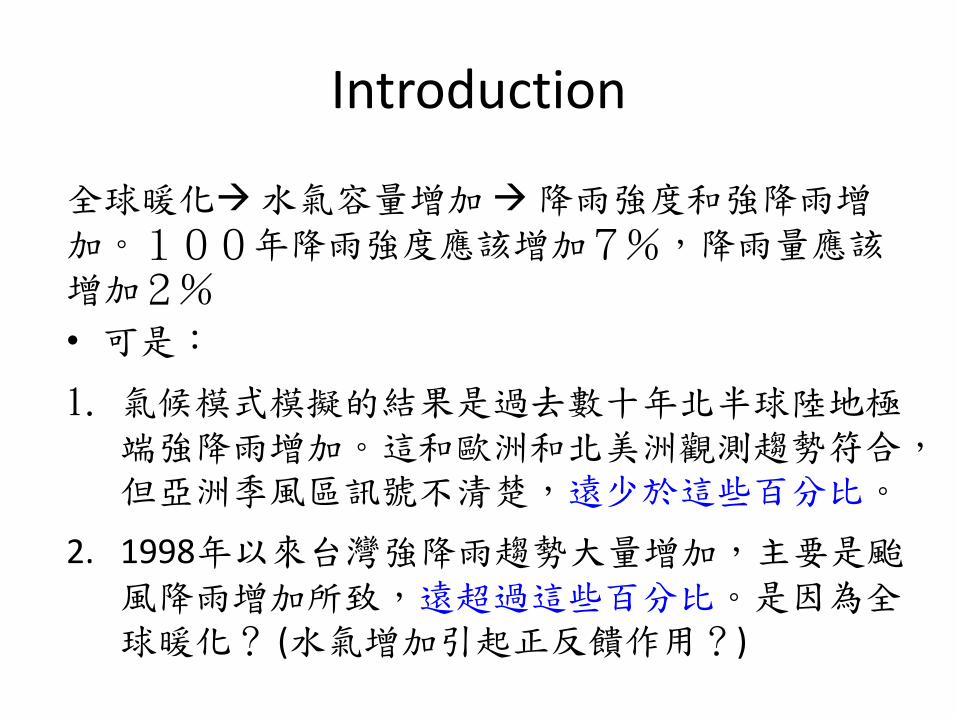
Introduction
全球暖化水氣容量增加降雨強度和強降雨增加。100年降雨強度應該增加7%,降雨量應該增加2%
• 可是:
1. 氣候模式模擬的結果是過去數十年北半球陸地極端強降雨增加。這和歐洲和北美洲觀測趨勢符合,但亞洲季風區訊號不清楚,遠少於這些百分比。
2. 1998年以來台灣強降雨趨勢大量增加,主要是颱風降雨增加所致,遠超過這些百分比。是因為全球暖化? (水氣增加引起正反饋作用?)

Outline
1. TC and China Summer Monsoon Extreme Rainfall (90th percentile) since 1958(Chang, Lei, Sui, Lin and Ren, GRL, 2012 )
2. TC Rain Intensity in Taiwan since 1961(Chang, Kuo and Yang, J Climate, 2013)

Rainfall in East Asia Summer Monsoon
• Extreme rainfall contributed by both monsoon and Tropical Cyclones (TCs)
• TCs influenced by tropical western North Pacific conditions (upstream of East Asian landmass)
• Extreme rainfall influenced by external factors not part of local thermodynamic conditions

Percentage of TC rainfall in Total Rainfall
Percentage of TC rainfall in Extreme Rainfall
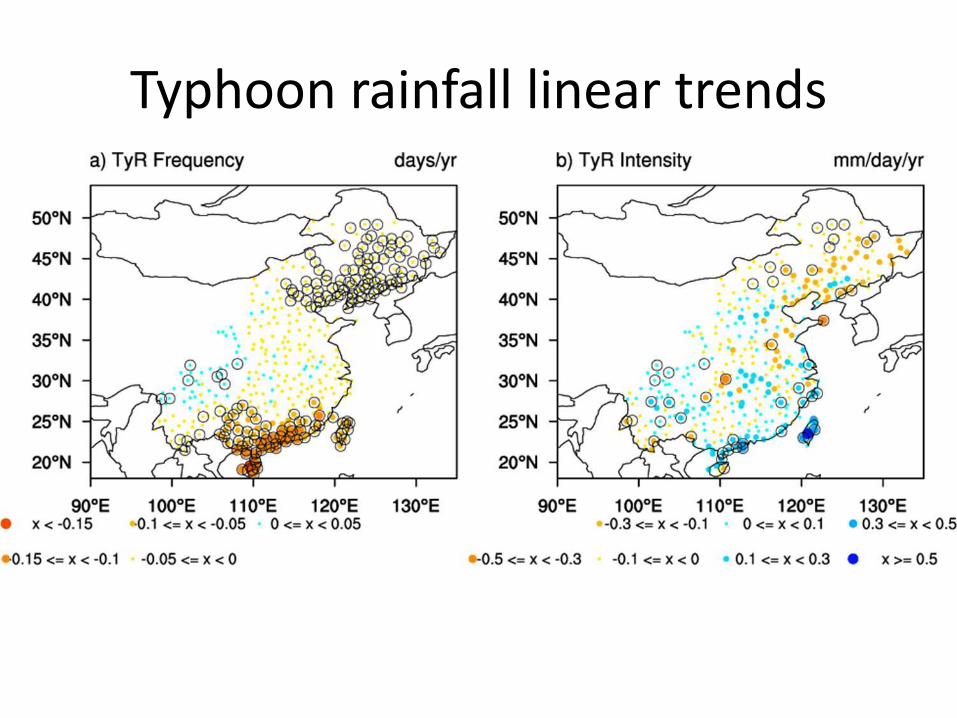
Typhoon rainfall linear trends
Intensity AmountFrequency

Southern China
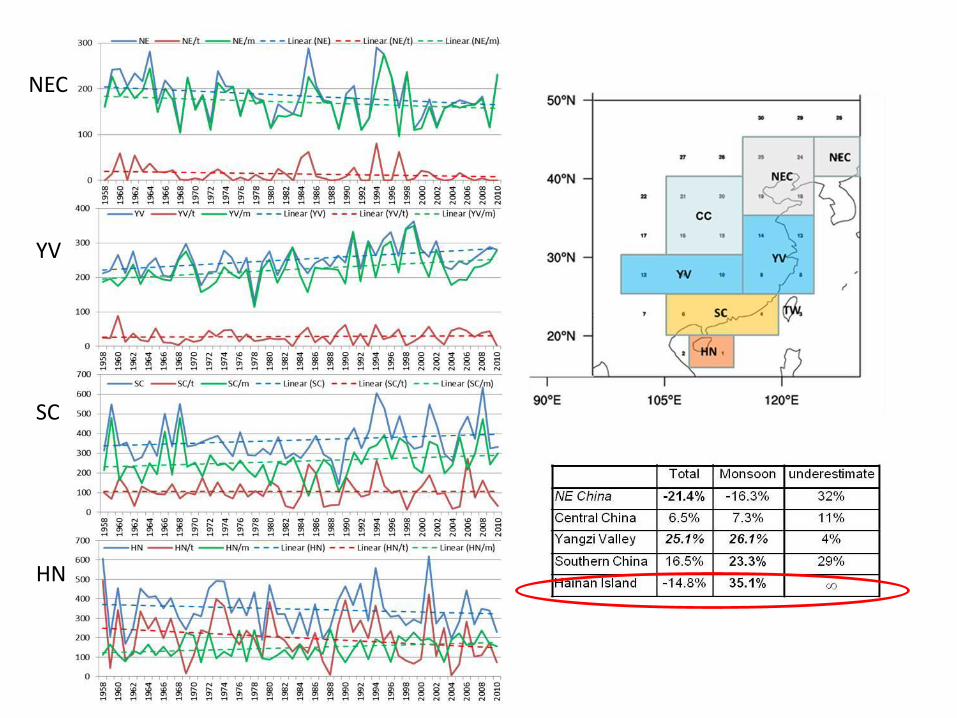
NEC
YV
SC
HN

Hainan 90th percentile
Total -14.8%
Monsoon +35.1%
Underestimate
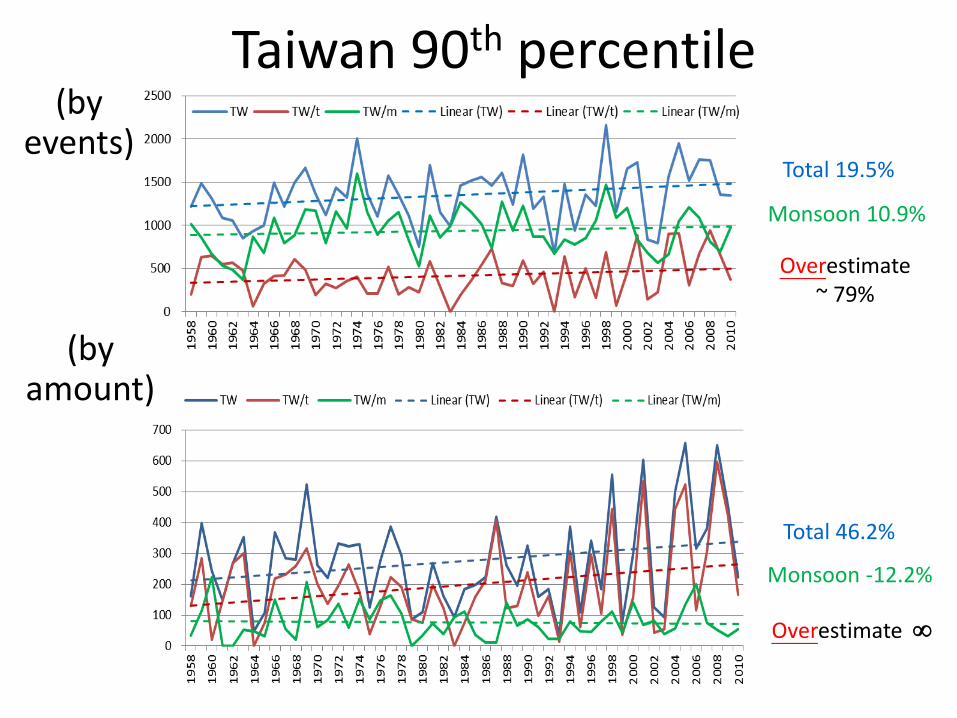
Taiwan 90th percentile
Total 19.5%
Monsoon 10.9%
Overestimate ~ 79%
Total 46.2%
Monsoon -12.2%
Overestimate
(by amount)
(by events)
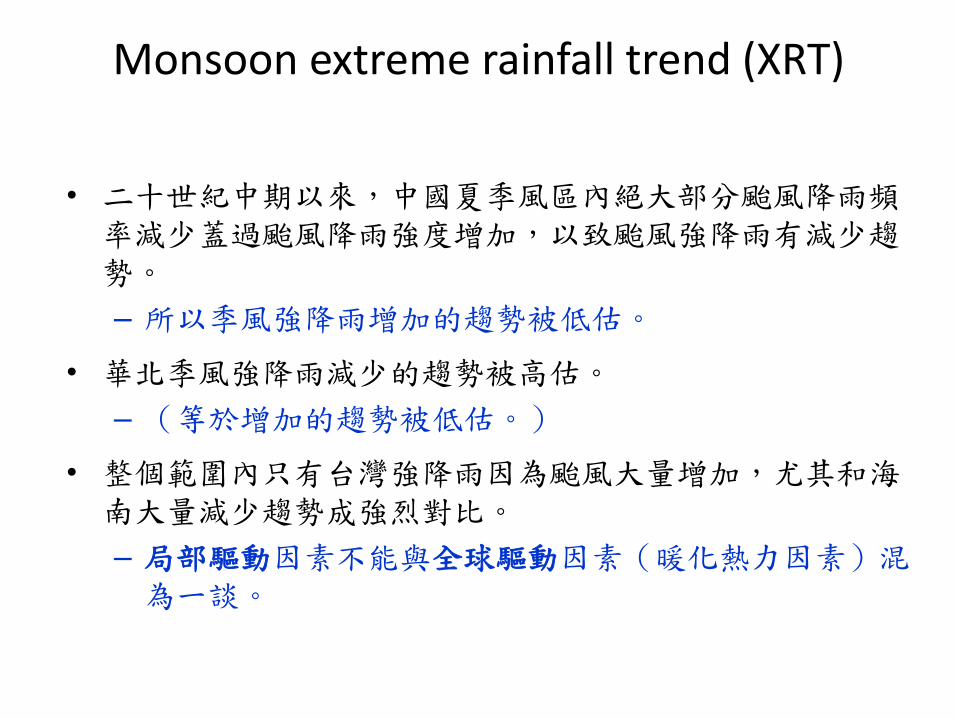
Monsoon extreme rainfall trend (XRT)
• 二十世紀中期以來,中國夏季風區內絕大部分颱風降雨頻率減少蓋過颱風降雨強度增加,以致颱風強降雨有減少趨勢。
– 所以季風強降雨增加的趨勢被低估。
• 華北季風強降雨減少的趨勢被高估。
– (等於增加的趨勢被低估。)
• 整個範圍內只有台灣強降雨因為颱風大量增加,尤其和海南大量減少趨勢成強烈對比。
– 局部驅動因素不能與全球驅動因素(暖化熱力因素)混為一談。

Taiwan Typhoon Rain Intensity
• 21 hourly stations 1960-2011
• 84 landfalling typhoons (all seasons)
• Re-analyzed TC tracks by CWB & NTU,
• 三類主要路徑:北(N)、中(C)、南(S),
• 3 Track Phases:PRe-landfall(登路前), OverLand(登路後), EXit (出海後)
• Rainfall affected by Interaction with TerrainInteraction with Monsoon

Figure 1. a) Taiwan topography and rainfall stations. b) The northern (N) type tracks. c) The central (C) type tracks. d) The
southern type (S) tracks. e) Examples of 925 hPa streamlines for the three track types: N: Typhoon Kalmaegi (2006), C:
Typhoon Morakot (2009), and S: Typhoon Morakot (2003).
Maximum Terrain Interaction
Minimum Terrain Interaction

16
Pre-Landfall
Over-Land
EXit
Typhoon Track Phases

PRe-Landfall
2008
2004
2009
2005
2007


PhaseTrack Type
PR OL EX
N 1960 2132 1458
C 1305 1558 1467
S 1033 812 572
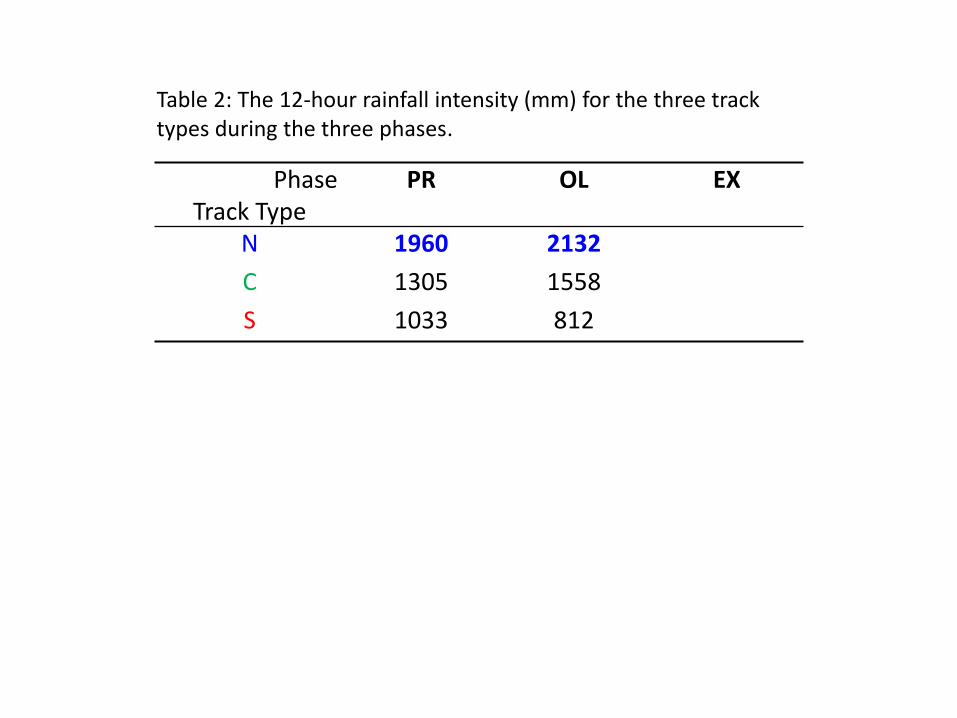
Table 2: The 12-hour rainfall intensity (mm) for the three track types during the three phases.


Over-Land


PhaseTrack Type
PR OL EX
N 1960 2132 1458
C 1305 1558 1467
S 1033 812 572
Table 2: The 12-hour rainfall intensity (mm) for the three track types during the three phases.
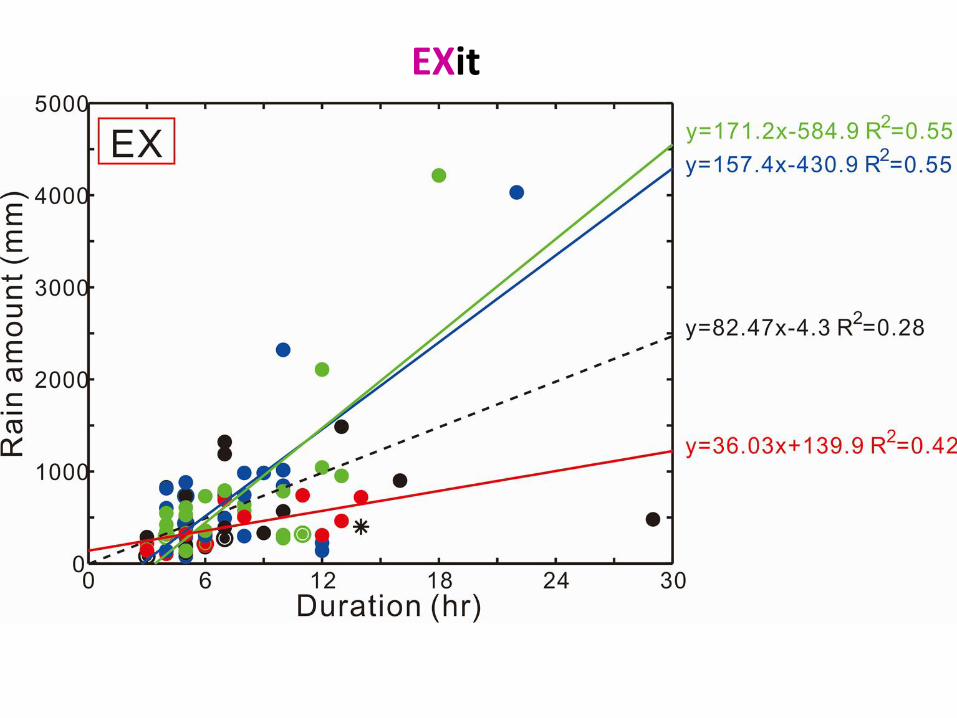
EXit


Figure 1. a) Taiwan topography and rainfall stations. b) The northern (N) type tracks. c) The central (C) type tracks. d) The
southern type (S) tracks. e) Examples of 925 hPa streamlines for the three track types: N: Typhoon Kalmaegi (2006), C:
Typhoon Morakot (2009), and S: Typhoon Morakot (2003).
Maximum Terrain Interaction
Minimum Terrain Interaction
Maximum SW monsoon Interaction

PhaseTrack Type
PR OL EX
N 1960 2132 1458
C 1305 1558 1467
S 1033 812 572
Table 2: The 12-hour rainfall intensity (mm) for the three track types during the three phases.
1. Terrain effect dominates
2. After exit, SW monsoon interaction important

Fig. 5 Figure 5. Time series of average
duration of typhoons from 1960 to
2011 for a) north (N, blue), b)
central (C, green), and c) south
(S, red) track type typhoons. The
thin vertical line inside each
panel denotes year 2004. A dot
with one circle indicates two
typhoons and a dot with two
circles indicate three typhoons.

Frequency 1960-2003 2004-2011
N 21(44.6%) 5(31.3%)
C 15(31.9%) 8(50.0%)
S 11(23.4%) 3(18.8%)
Duration (hour) 1960-2003 2004-2011
N 15.9 24.0
C 23.9 23.3
S 21.7 20.0
Table 3: The absolute and relative frequency and duration of the N, C, and S typhoons before and after 2004.
(Chu, P.-S. et al., 2012, GRL: Slowing trend of NCEP/NCAR and ERA-40 steering flows from 1959 – 2009.)
-1/3
+1/2
+2/3
Total frequency +N duration +

Speed criteria : 61 continuous track typhoons mean translation speed (6.2 m/s)± 1 std. (2.9 m/s)
• 77 % of slow moving storms making landfall on northern Taiwan (10/13).
• 60 % of fast cases making landfall on southern Taiwan (6/10).
Asymmetric distribution of typhoon
translation speed overland
Slowest group at northFastest group at southSlow
Fast
(Hsu, Kuo and Fovell 2013, JAS)

Composite Rainfall

1958至2009年北太平洋西部海域全年颱風累計生成數(氣候平均26.57個)
16
18
20
22
24
26
28
30
32
34
36
38
1958 1963 1968 1973 1978 1983 1988 1993 1998 2003 2008
年
份
個
數
1958至2009年全年侵台颱風個數(氣候平均3.13)
2001
0
1
2
3
4
5
6
7
8
1958 1963 1968 1973 1978 1983 1988 1993 1998 2003 2008
年
份
個
數
西北太平洋減少3422
侵台颱風增加25
侵台颱風增加,總數其實減少。
西北太平洋路徑:空間年代際變化。
(李清藤、賈新興,交通部中央氣象局)

侵台颱風增加只是近期時間年代際變化。

Figure 6. a) Time series of rainfall intensity from 1960 to 2011 for the pre-landing (PR, blue), overland (OL, black) and exit (EX, red) phases for
weak and medium intensity (Category 1-3) typhoons. Grey vertical columns indicate years with no typhoons of the three leading track types. The
table inside the panel lists the averaged yearly rainfall intensities of the three phases during the first half (1960-1985, left column) and second
half (1986-2011, right column) of the 52 year period. The two sub-periods are indicated by double end arrows above the panel. b) Same as a)
except strong types (Category 4-5) are included. The rainfall intensity of each strong typhoon is indicated by the respective colored dots.
Fig 6a
112.5 110.1 -2.1%
128.7 129.0 0.2%
78.2 92.9 18.8%
Fig. 6b
112.2 112.1 -0.1%
128.8 130.4 1.2%
75.9 92.0 21.2%

Huge increase of TC rain signifies global warming/climate change effects?
• Pre-landfall and Over-land, the increase is due to longer duration and slight (mesoscale) change of tracks.
– Result of strong control by terrain effect
– Not thermodynamic effect of global warming
• After center exits Taiwan, increase due to stronger monsoon-TC interaction.
– Link to global climate change possible:
(but not TC intensity)
Global Warming? or Natural Variability?

Change due to global surface warming
• Water vapor in the lower troposphere increases by ~7% per °C (by Clausius–Clapeyron equation)
• Precipitation rate increases by ~2% per °C (limited by change of raidative cooling)
weakening of boundary layer/troposphere mass exchange of ~5% per °C
weakening of tropical circulation ~5% per °C
(Held and Solden 2006, Vecchi et al. 2006)

Global Warming or Natural Variability?
Strengthening of NH summer monsoon and tropical circulations consistent with slower steering flow of Taiwan TCs and enhanced monsoon interaction after TC leaves Taiwan.
GW predicts weakening of tropical circulations.
(Wang, B. et al. 2013, PNAS)

NH tropical circulation vs. multidecadal indexes
(Wang et al. 2013)
But HTC AMO better than GW

Conclusions
• 地形是控制台灣颱風降雨量最重要的因素。
• 登陸前和登陸後,增加的趨勢是因為颱風經過時間變長和少許(中尺度)的路徑變化。
• 地形效用使得這些變化造成了氣候變遷的假象。而又因為控制了降雨強度,地形效用也會掩蓋氣候變遷的結果。
• 出海後,颱風降雨增加的趨勢導源於颱風-季風交互作用增強的趨勢。
– 這個趨勢並非因為颱風強度正反饋 (颱風強度五十年來趨勢是減弱而非增強。)
– 熱帶季風增強和人類影響導致全球暖化的理論衝突。
– 熱帶季風增強和Mega ENSO及AMO自然年代際變化成正相關。(Wang et al. 2013)
也和駛引氣流減慢,登陸前後颱風經過時間變長一致。

Thank You!


