
Fatal Powered Two‐Wheeler (PTW) crashes in Germany – an in‐depth study of the events, injuries and injury sources
Abstract The powered two‐wheeler (PTW) riders is a group where fatalities are not decreasing at the same
rate as for other road‐users. It is also a group that is likely to increase in the future due to traffic congestion. To
develop countermeasures to protect PTW drivers, it is necessary to understand the accident event in detail, the
injuries and their sources.
The German database GIDAS was queried for PTW crashes where the driver was injured (cases with
passengers were excluded). During the time period 1999–2014, cases involving 3,361 PTW drivers were
collected, sustaining 10,917 injuries. Eighty (80) drivers sustained fatal injuries in 79 crashes. The fatal cases
were selected for detailed study regarding injuries and their sources.
Each case was studied in detail to conclude the detailed accident event and the most likely source of fatal
injury. It was found that PTW losing control and PTW not being noticed by another vehicle were the most
common accident scenarios leading to a fatal PTW crash. The most common injury sources were passenger cars,
especially the lower parts of the cars, followed by surrounding objects, mainly guard‐rails and trees.
A battery of countermeasures was proposed to improve the protection of PTW drivers from fatal accidents.
Countermeasures that are worth promoting or investigating further are innovative helmet or jacket designs,
improved PTW visibility, guard‐rail redesign, anti‐lock brakes and stability control, car‐/truck‐mounted warning
and auto‐brake systems, improved car frontal energy absorption and under‐run protection for heavy vehicles.
Keywords powered two‐wheelers (PTW), fatal, scenario, injury source, injury.
I. INTRODUCTION
Worldwide half of the 1.24 million traffic fatalities yearly are vulnerable road‐users. The largest group of
these are powered two‐wheeler (PTW) riders: every year 285,000 PTW riders are killed in traffic accidents,
which makes up 23% of all traffic deaths [1]. In Europe this group makes up 15% of fatalities in road traffic, and
although there has been a reduction in PTW fatalities in Europe, it has been a slower decline than for overall
traffic fatalities [2].
Two major accident studies have been performed for PTW accidents. The MAIDS report was presented in
2008, in which an extensive range of 921 PTW accidents in five countries in Europe were studied [3]. A large
majority of the injured PTW riders were male, and the head was the most commonly injured body part, while
for fatal accidents spine and chest were also commonly injured. A frequent accident partner and injury source
were passenger cars, but for fatal accidents a larger share were single accidents. In the car crashes, the most
common part impacted was the side of the car, and a majority of the car accidents occurred at intersections. In
an earlier study from the 1980s, Hurt et al. performed an extensive study on US motorcycle accidents [4]. This
study also showed the frequent scenario of motorcycle‐to‐car crashes at intersections, where the car violated
the motorcycle’s right‐of‐way. Further, the Hurt et al. study pointed out the problem of conspicuity, i.e. the
problem that other road‐users failed to detect the powered two‐wheeler.
Different countermeasures are available. Helmets are effective countermeasures to reduce head injury [4‐6].
Anti‐lock brakes have now been introduced broadly on powered two‐wheelers and have proven to be effective
in reducing accidents and injuries [7,8]. Other countermeasures introduced recently, although not yet proven in
efficiency, include motorcycle airbags [9], inflatable jackets [10] and stability control [11]. Rizzi et al [12] studied
the potential of different countermeasures using Swedish fatal PTW crashes from a retrospective database
R. Fredriksson, Ph.D., is Senior Specialist at Autoliv Research in Sweden (+46‐(0)322‐626376, [email protected]). B. Sui, M.Sc., is Accident
Analysis Engineer at Autoliv China Technical Center.
Rikard Fredriksson, Bo Sui
IRC-15-12 IRCOBI Conference 2015
- 22 -

covering all fatal road traffic accidents in Sweden. This study concluded that anti‐lock brakes on the PTW and
safe intersections on rural roads to be most promising countermeasures.
The aim of this study was to study the most extensive on‐scene, in‐depth fatal accident data available with
regard to injuries, accident scenarios and injury sources and consequently to provide input to possible
countermeasures to mitigate those injuries.
II. METHODS
Database and inclusion criteria
The German In‐Depth Accident Study (GIDAS) database was used to extract crash data for this study. GIDAS
accident investigation teams operate in Dresden and Hannover and their surroundings. The sample area
contains both rural and urban traffic and is chosen to represent, as closely as possible, a “mini Germany”. Work
shifts are equally distributed between night and day, with investigators attending accident sites using “blue‐
light” vehicles, along with police and ambulance personnel, when personal injuries are suspected. To investigate
both vehicular and human factors in maximum detail, the GIDAS teams consist of both technical and medical
personnel. At least one confirmed personal injury is required for inclusion in the database.
The GIDAS database was queried for accidents with injured riders of PTWs. The parameter ZWART (type of
two‐wheeled vehicle) was used to define powered two‐wheelers, where the following were included in the
study: motorized bicycle, pedal moped, moped, moped with less than 50 cc, motorcycle with less than 125 cc,
motorcycle, scooter up to 80 cc, scooter over 80 cc. Not included from the ZWART category were bicycle,
motorcycle with sidecar, trike, quad, motorized scooter trikes, other and unknown. Cases with passengers were
excluded, due to the complexity of understanding injury patterns. Only cases with complete reconstructions
were included.
This query resulted in 3,360 injured PTW riders, with at least one AIS1+ injury (AIS 2005). Of these, 79
accidents were fatal, with 80 fatally injured riders (in one case, two PTWs crashed with each other and both
riders were killed). In summary, the following inclusion criteria were applied:
cases collected 1999–2014;
powered (motorized) two‐wheeler;
driver‐only cases (cases with passenger excluded);
all PTW driver ages;
fatally injured, within 30 days.
Injury sources
In this study, sources of the fatal injury of the PTW driver were analyzed. Injury sources were grouped into
“Surrounding”, “Car”, “Heavy vehicle” or “Other PTW”. Objects from the road, infrastructure and off‐road
objects were then defined as “Surrounding”. “Surrounding” was then further divided into the sub‐groups
“Guard‐rail”, “Other fixed objects”, “Road surface”, “Off‐road”. “Off‐road” objects were defined as any object
that was not part of the road or built‐up infrastructure, so these then included trees, stones or ditches. Rails
along the road designed to keep a vehicle from leaving the road were defined “guard‐rail”. “Other fixed objects”
included street poles, lamp‐posts, buildings or parked cars. When a passenger car or van was concluded as the
injury source, this was defined as “Car”. When the injury source on the car was concluded to be located below
the waist line of the car, this was defined as a low impact. High impacts were then to the glass parts, or the A‐,
B‐ and C‐pillars. In the “Heavy vehicle” category, vehicles such as trucks, buses or tractors were included. When
it was concluded that the PTW driver was fatally injured from being driven over of the car of heavy vehicle, this
was defined as “run over”.
III. RESULTS
As mentioned in the Methods section, cases with passengers were not included in the study. The average
rider was a male (99%) and 37 years old. In all cases in the study the rider wore a helmet. Sixty‐three (79%) of
IRC-15-12 IRCOBI Conference 2015
- 23 -

the drivers rode a motorcycle (>125 cc), 6% a light motorcycle (<125 cc) and 10% a moped (<50 cc). The mean
travelling speed was 83 km/h before the event started, and reached an average speed of 69 km/h at the time of
impact. Crashes occurred at impact speeds from 5 km/h up to 145 km/h, and 60% of the accidents happened in
a rural setting (TABLE 1). Head injury was the most common cause of death (48%), followed by thorax injury
(23%) and spine injury (10%), while 4% died from cumulative causes (Fig. 1).
TABLE 1
CRASH DETAILS (N=80)
Mean Min. Max.
Age (years) 37 16 85
Travelling speed
(km/h)
83 25 184
Impact speed (km/h) 69 5 145
Registration year 1996 1980 2009
Male 99%
Helmet 100%
Urban/rural 40%/60%
Fig. 1. Localization of fatal injury (N=80).
Scenario analysis – pre‐crash event
Next, each case was studied closely to conclude the detailed scenario leading to the crash. The most common
event was found to be the PTW losing control, leading to a crash, followed by an oncoming vehicle turning or
overtaking in front of the PTW. In addition, the two events of either a PTW overtaking leading to a crash or a
vehicle in the same direction turning in front of the PTW were also common (see Fig. 2).
48%
10%
23%
8%
0%
1%
4%
1%
6%
0% 10% 20% 30% 40% 50% 60%
Head
Spine
Thorax
Abdomen
Pelvis
Extremities
Cumulative Causes
Not Due To Injuries
Unknown
IRC-15-12 IRCOBI Conference 2015
- 24 -

Fig. 2. Accident scenario distribution (N=80).
The most common events were studied in further detail in order to gain more understanding about the
details of the events and the source of injury. When the “PTW loses control” occurred (n=25), the driver most
commonly impacted an object (n=18) (see Fig. 3). The object was, in most cases, a guard‐rail or a tree. In some
of the cases the PTW driver impacted or was ridden over by an oncoming vehicle (n=7). For details, see also
complete overview in Fig. A 1 in Appendix.
The second most common event was crash to an oncoming vehicle when it was turning or overtaking in front
of the straight‐driving PTW (n=19). In the large majority of these events, the PTW driver impacted the front or
side of the oncoming vehicle (n=14). In four cases the PTW driver was ridden over by the vehicle, and in one
case it could not be concluded if it was only a vehicle impact or if run over was involved (see Fig. 4).
Fig. 3. Detailed scenario distribution of scenario “PTW
loses control” (n=25).
Fig. 4. Detailed scenario distribution of scenario
“Oncoming vehicle turns or overtakes” (n=19).
31%
11%
24%
1%
8%
11%
5%
4%
3%
3%
0% 5% 10% 15% 20% 25% 30% 35%
PTW loses control_
PTW overtakes_
Oncoming vehicle turns or overtakes_
PTW turns left in front of oncoming vehicle_
Vehicle from side drives out in front of straight‐driving PTW_
Vehicle in same direction (in other lane), turns in front ofPTW
Vehicle in same direction hits PTW from behind
PTW impacts vehicle ahead and then 2nd impact
VRU or animal impact, then 2nd impact
PTW to PTW
0 5 10 15 20
PTW loses control, impact toobject
PTW loses control and impact tooncoming vehicle, impact
PTW loses control and impactingoncoming vehicle, run over
PTW loses control and impactingoncoming vehicle, run over
unknown
PTW loses control (n=25)
0 5 10 15
Oncoming vehicle turns left infront of PTW, impact
Oncoming vehicle turns left infront of PTW, run over
Oncoming vehicle turns left infront of PTW, run over
unknown
Oncoming vehice overtakes andimpacts PTW
Oncoming vehicle turns or overtakes (n=19)
IRC-15-12 IRCOBI Conference 2015
- 25 -

The third most common event (n=9) leading to a fatal crash was the PTW overtaking another vehicle. It was
then most common that the PTW driver impacted the front or side of an oncoming vehicle (n=3), or was run
over by the oncoming vehicle (n=2). In two cases the PTW driver lost control when overtaking and slid into an
object. (See Fig. 5)
Equally common was the event when a vehicle ahead and driving in the same direction as the PTW, but in
another lane, turned in front of the straight‐driving PTW (see Fig. 6). This most often led to an impact to the
front or side of the vehicle (n=6), but in two cases it also led to a second impact to an object for the PTW driver.
Fig. 5. Detailed scenario distribution of scenario
“PTW overtakes” (n=9).
Fig. 6. Detailed scenario distribution of scenario
“Vehicle in same direction turns in front of PTW” (n=9).
Injury sources: in‐crash analysis
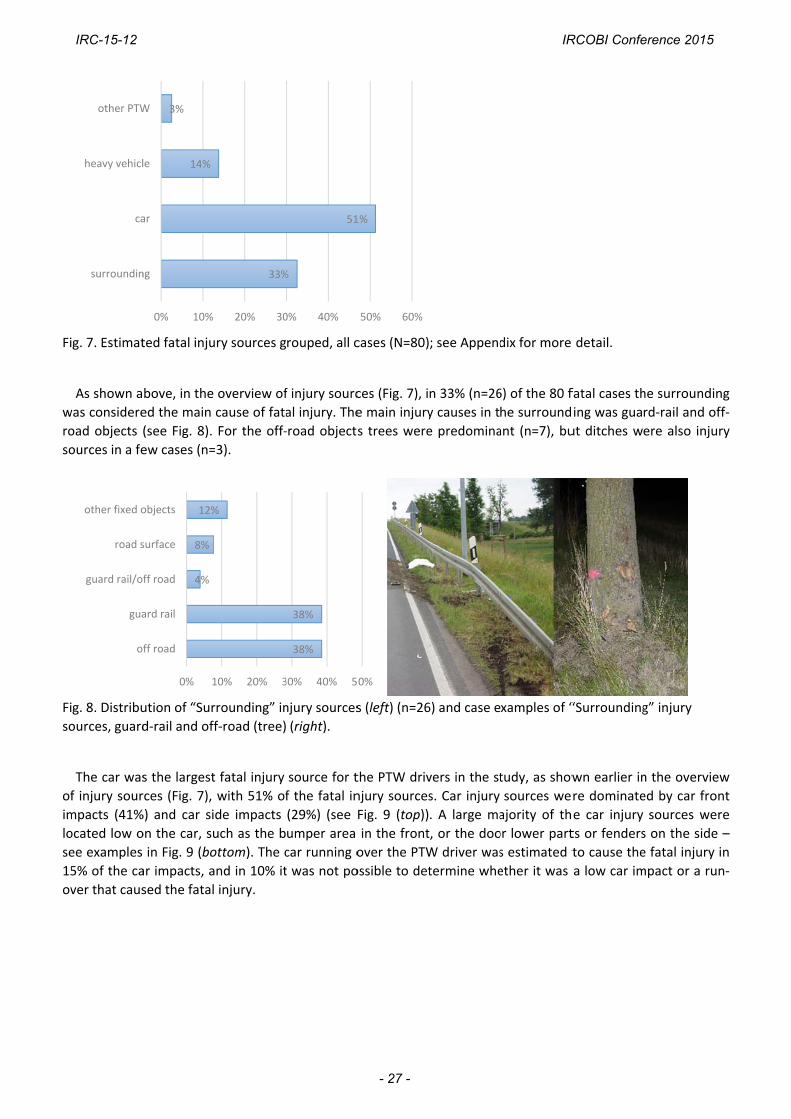
Further, in each case the most likely source of fatal injury was concluded. (See Fig. 7 and Fig. A 2) Car was
estimated as the primary fatal injury source in 51% of the cases. In 33% of the cases the surrounding was
estimated to cause the fatal injury. In 14% of the cases a heavy vehicle impact was estimated as fatal injury
source. Run over by car or heavy vehicle was estimated as the cause in 11 of the 80 cases (14%).
0 2 4
PTW overtakes, falls and impactsobject
PTW overtakes, and impactsoncoming vehicle
PTW overtakes, and impactsoncoming vehicle, run‐over
PTW overtakes, loses control andis run over by vehicle in same lane
Vehicle in same direction turns leftwhen PTW is overtaking vehicle
PTW overtakes (n=9)
0 2 4 6 8
Vehicle in same direction (in otherlane), turns in front of PTW,
impact vehicle
Vehicle in same direction (in otherlane), turns in front of PTW,impact vehicle and then riding
over
Vehicle in same direction (in otherlane), turns in front of PTW,impact vehicle and then object
Vehicle in same direction turns in front of PTW(n=9)
IRC-15-12 IRCOBI Conference 2015
- 26 -
Fi
w
ro
so
Fi
so
of
im
lo
se
15
ov
g. 7. Estimat
As shown a
was considere
oad objects
ources in a fe
g. 8. Distribu
ources, guard
The car was
f injury sour
mpacts (41%
ocated low o
ee examples
5% of the ca
ver that caus
surroundin
ca
heavy vehicl
other PTW
o
gua
guard rail/o
road s
other fixed o
ted fatal inju
bove, in the
ed the main
(see Fig. 8).
ew cases (n=
ution of “Sur
d‐rail and off
s the largest
rces (Fig. 7),
%) and car si
on the car, su
in Fig. 9 (bo
ar impacts, a
sed the fatal
14%
3%
0% 10%
ng
ar
le
W
4%
8%
12%
0% 1
ff road
ard rail
ff road
surface
objects
ury sources g
overview of
cause of fata
For the off‐
=3).
rrounding” in
f‐road (tree)
t fatal injury
with 51% of
de impacts
uch as the b
ottom). The c
nd in 10% it
injury.
33%
20% 30
%
10% 20% 3
rouped, all c
f injury sourc
al injury. The
‐road objects
njury sources
(right).
source for t
f the fatal in
(29%) (see
umper area
car running o
t was not po
%
51
0% 40%
38%
38%
30% 40% 5
cases (N=80)
ces (Fig. 7), i
e main injury
s trees were
s (left) (n=26
the PTW driv
njury sources
Fig. 9 (top))
in the front
over the PTW
ossible to det
1%
50% 60%
0%
; see Append
n 33% (n=26
y causes in t
e predomina
6) and case e
vers in the st
s. Car injury
. A large ma
t, or the doo
W driver was
termine whe
dix for more
6) of the 80 f
he surround
ant (n=7), bu
xamples of “
tudy, as show
sources we
ajority of th
or lower part
s estimated t
ether it was
detail.
fatal cases th
ing was gua
ut ditches w
“Surrounding
wn earlier in
re dominate
e car injury
ts or fenders
to cause the
a low car im
he surroundi
rd‐rail and o
ere also inju
g” injury
n the overvie
ed by car fro
sources we
s on the side
e fatal injury
mpact or a ru
ng
off‐
ury
ew
ont
ere
e –
in
un‐
IRC-15-12 IRCOBI Conference 2015
- 27 -

Fi
“c
th
w
Fi
In
Th
in
Th
H
11
Fo
is
g. 9. Distribu
car front”, “c
Heavy vehic
he study, as
were estimate
g. 10. Distrib
njuries in det
he distributio
njury of the P
horax was m
owever, cau
1 cases.
or vehicle inj
a different
ca
car
c
ca
car sid
car side no
ca
car low
heavy v
heavy veh
heavy vehiclov
ution of “Car
car side high”
cles were es
shown earlie
ed to be caus
bution of “He
tail
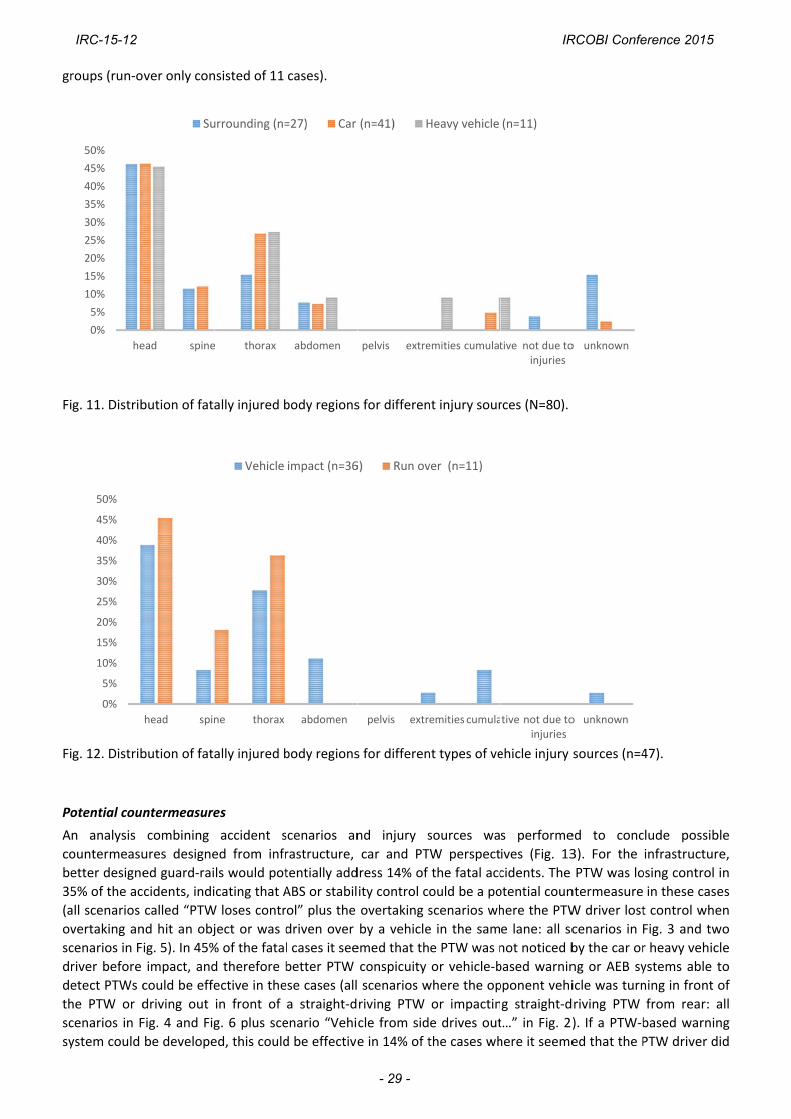
on of fatally
PTW driver.
more commo
ution should
jury sources
injury distrib
0%
ar front low
windshield
ar side low
ar side high
e low/high
more info
car rear
ar run over
w/run over
ehicle impact
hicle run over
le impact/runver
r” injury sour
”(bottom, fro
stimated as t
er in the ove
sed by run‐o
eavy vehicle”
injured bod
For both veh
nly fatally inj
be taken sin
, when divid
bution (Fig. 1
2%
15%
2%
10%
2%
5%
15%
10%
10%
0 2
rces (top) (n=
om left to rig
the main cau
erview of inj
over for heav
” injury sour
y regions wa
hicles and su
jured for veh
nce some su
ding vehicle i
12). This ma
20%
4 6
=41), and cas
ght).
use of fatal
jury sources
vy vehicles (F
rces (n=11).
as compared
urrounding a
hicles, comp
b‐groups ha
impact and r
y again be d
39%
30% 40
6
se examples
injury in 14%
(Fig. 7). A la
Fig. 10).
d between d
as injury sour
ared to the s
ve low num
run‐over it is
due to the lo
0% 50%
of Car injury
% of the fata
arger share,
ifferent coun
rces, the hea
surrounding
ber of cases
s difficult to
ow number o
y sources “ca
ally injured P
compared t
nterparts ca
ad was the m
as injury so
s, e.g. heavy
draw a conc
of cases in o
ar side low”,
PTW drivers
to car impac
using the fat
most commo
urces (Fig. 1
vehicle is on
clusion if the
one of the su
in
ts,
tal
on.
1).
nly
ere
ub‐
IRC-15-12 IRCOBI Conference 2015
- 28 -
gr
Fi
Fi
Po
A
co
be
35
(a
ov
sc
dr
de
th
sc
sy
roups (run‐o
g. 11. Distrib
g. 12. Distrib
otential coun
n analysis
ountermeasu
etter designe
5% of the ac
all scenarios
vertaking an
cenarios in F
river before
etect PTWs c
he PTW or d
cenarios in F
ystem could
0%
5%
10%
15%
20%
25%
30%
35%
40%
45%
50%
he
0%
5%
10%
15%
20%
25%
30%
35%
40%
45%
50%
ver only con
bution of fata
bution of fata
ntermeasure
combining
ures designe
ed guard‐rai
cidents, indi
called “PTW
nd hit an obj
ig. 5). In 45%
impact, and
could be effe
driving out
Fig. 4 and Fig
be develope
ead spine
Su
head spin
nsisted of 11
ally injured b
ally injured b
es
accident s
ed from infr
ls would pot
cating that A
W loses contr
ject or was d
% of the fatal
d therefore b
ective in the
in front of
g. 6 plus sce
ed, this could
e thorax
urrounding (n=
ne thorax
Vehicle
cases).
body regions
body regions
scenarios an
rastructure,
tentially add
ABS or stabil
ol” plus the
driven over
l cases it see
better PTW
ese cases (all
a straight‐d
enario “Vehi
d be effective
abdomen
=27) Car
abdomen
impact (n=36
s for differen
s for differen
nd injury s
car and PT
dress 14% of
ity control c
overtaking s
by a vehicle
emed that th
conspicuity
scenarios w
riving PTW
cle from sid
e in 14% of t
pelvis extre
(n=41) H
pelvis extr
6) Run ov
nt injury sour
nt types of ve
sources wa
TW perspect
the fatal acc
ould be a po
scenarios wh
e in the sam
e PTW was n
or vehicle‐b
where the op
or impactin
e drives out
the cases wh
emities cumulat
Heavy vehicle
emities cumula
ver (n=11)
rces (N=80).
ehicle injury
s performe
ives (Fig. 13
cidents. The
otential coun
here the PTW
e lane: all sc
not noticed b
based warnin
pponent vehi
g straight‐d
t…” in Fig. 2)
here it seeme
tive not due toinjuries
(n=11)
tive not due toinjuries
sources (n=4
ed to conc
3). For the
PTW was lo
ntermeasure
W driver lost
cenarios in F
by the car or
ng or AEB sy
icle was turn
driving PTW
). If a PTW‐b
ed that the P
o unknown
o unknown
47).
clude possib
infrastructur
osing control
in these cas
t control wh
Fig. 3 and tw
r heavy vehic
ystems able
ning in front
from rear:
based warni
PTW driver d
ble
re,
in
ses
en
wo
cle
to
of
all
ng
did
IRC-15-12 IRCOBI Conference 2015
- 29 -

not notice the other vehicle, which it later impacted (all scenarios where the PTW turns or overtakes in front of
another vehicle). If the cars could be designed with better energy absorption all around the car body, this could
address up to 39% of the fatal cases in this study (all accidents where a car was the injury source and run‐over
was not involved: see Fig. 9). Finally, if cars or heavy vehicles could be designed with protection to prevent
running over the PTW driver, this would address 14% of the fatal accidents.
Since some of these fatal cases are potentially addressed by more than one countermeasure, it is not
possible to simply add them up. Therefore, this was checked case‐by‐case. It was found that in each case the
accident was addressed by at least one countermeasure, so when combining all countermeasures 100% of the
accidents were addressed.
Fig. 13. Distribution of fatal accidents potentially addressed by various countermeasures (N=80).
IV. DISCUSSION
Head was the most common body region for fatal injury, followed by thorax, so it is important to closely
assess the helmet design. It is worth studying whether it is possible to make significant improvements in the
helmets. Possibly, it is also worth looking into innovative designs of PTW jackets for better protection. Inflatable
jackets exist on the market, but it is important to have a reliable sensor to ensure it activates only when needed
[10].
From infrastructure point of view, the guard‐rail was a common injury source and if they could be redesigned,
this could potentially be an effective countermeasure to reduce PTW driver injury. Off‐road objects, such as
trees, were also common injury sources, so removal of trees close to roads is also important. Rizzi et al also
pointed out improvements of barriers and road‐side as effective countermeasures [12]. But for both of these
injury sources, anti‐lock brakes (ABS) and stability control could be effective countermeasures to avoid the
impact occurring. ABS is now common on new motorcycles and has proven to be effective [7,8] and stability
control has also been introduced [11]. Rizzi et al also estimated ABS to be an efficient countermeasure [12].
Looking from passive protection point of view and using the injury sources as input, the cars were the main
injury source. It they could be redesigned with energy‐absorbing outer structure, this could potentially address
39% of the fatal accidents. Since the large majority of those impacts were to low locations on the car, below the
waist line, it would be those areas of the car that would need to be addressed, especially the car front (bumper
area), but also the lower side of the car (fender and door). For car frontal impacts these areas are already under
redesign for pedestrian impact protection, so those countermeasures may be effective also for PTW drivers in
car crashes. For the PTW‐to‐car side impacts, it may be difficult to improve the car energy absorption due to
conflicting requirements on fuel consumption and structure stiffness needed for car side impact crashes. But
introduction of ABS and stability control on PTWs may lead to more impacts with the PTW in upright position,
instead of sliding or even separating from the PTW, and in this case PTW airbags could potentially be important
14%
35%
45%
10%
23%
13%
14%
39%
14%
41%
33%
100%
0% 10% 20% 30% 40% 50% 60% 70% 80% 90% 100%
Guard rails redesigned
PTW ABS or Stability control
PTW conspicuity
Vehicle‐mounted warning/AEB frontal
Vehicle‐mounted warning/AEB lateral
Vehicle‐mounted warning/AEB rear
PTW‐mounted warning system
Car energy absorption
Vehicle run over protection
Improved helmet
Improved jacket
All combined
IRC-15-12 IRCOBI Conference 2015
- 30 -

countermeasures. Such airbags have been introduced on the market, although on a limited scale [9]. If a run‐
over protection could be designed, this would also address a considerable amount of the fatal cases, both for
cars and heavy vehicles. This may be difficult for passenger cars, due to ramp‐climbing requirements, but the
heavy vehicles may have room for improvement here.
The most common reasons for the fatal accidents from pre‐crash (or active safety point of view) in the study
were the PTW losing control or that the PTW was not noticed by another vehicle. Together, these two reasons
accounted for 80% of the accidents. The MAIDS report showed almost identical figures on losing control, and
they also reported that visibility limitations or obstructions were frequent [3]. Losing control could potentially
be addressed by ABS (anti‐lock brake systems) or stability control. Conspicuity could be improved by the PTW
drivers wearing clothing with better visibility or by changing the design of the lighting on the PTW. Proposals
have been made to equip PTWs with two headlights beside each other, to give a unique PTW signature.
Regarding vehicle‐mounted sensors to detect PTWs and potentially warn or automatically activate the vehicle
brakes, it should be noted that these systems would need to cover both frontal, lateral and rear directions. Of
these cases (n=36), half of them (n=18) occur when the vehicle is driving out in front of a PTW coming from the
side, so a lateral sensor or a frontal sensor with a 180 degree field of view would be necessary (see Fig. A 1 in
Appendix for details). About 25% of these cases (n=8) occur when the vehicle turns or overtakes in front of an
oncoming PTW, which could potentially be covered by a forward‐looking sensor and the remaining sensor
would need a rearward‐looking sensor, since these occur typically when the vehicle is changing lane in front of a
PTW coming from behind.
V. CONCLUSIONS
In this study an overview was conducted of all fatal PTW driver accidents in the GIDAS database, a database
that aims to be representative of Germany. We studied each case in detail, using accident descriptions and
pictures, to conclude the injury pattern, pre‐crash motion of the PTW and possible surrounding vehicles, as well
as the injury sources.
It was found, not surprisingly, that head followed by thorax were the main body regions for fatal injury.
Further, PTW losing control and that the PTW was not noticed by another vehicle were the most common
accident scenarios leading to a fatal PTW crash. The most common injury sources were passenger cars,
especially the lower parts of the cars, followed by surrounding objects, mainly guard‐rails and trees.
A battery of countermeasures was proposed to improve the protection of PTW drivers from fatal accidents.
Countermeasures that are worth promoting and investigating further are innovative helmet or jacket designs,
improved PTW visibility, guard‐rail redesign, anti‐lock brakes and stability control, vehicle‐mounted warning and
auto‐brake systems, improved car frontal energy absorption and under‐run protection for heavy vehicles.
VI. REFERENCES
[1] World Health Organization. Global status report on road safety 2013: supporting a decade of action. 2013, World Health
Organization: Geneva, Switzerland. [2] ERSO. "CARE database -Traffic safety basic facts 2012 - Motorcycles & Mopeds" Internet
http://ec.europa.eu/transport/road_safety/pdf/statistics/dacota/bfs2012-dacota-ntua-motomoped.pdf. 2015-03-23]. [3] MAIDS. In-depth investigations of accidents involving powered two wheelers. 2008, ACEM: Brussels, Belgium. [4] Hurt Jr., H.H., Ouellet, J.V., and Thom, D.R. Motorcycle accident cause factors and identification of countermeasures,
Volume 1: Technical report, N.H.T.S.A. US Department of Transportation, Editor. 1981, Traffic Safety Center, University of Southern California: Los Angeles, USA.
[5] Mallory, A., Duffy, S., and Rhule, H. Head Injuries to Helmeted and Unhelmeted Motorcyclists in US Trauma Data. Proceedings of IRCOBI (International Research Council On the Biomechanics of Impact) Conference - short communication, 2013. Göteborg, Sweden
[6] USDoT. Traffic Safety Facts, 2008. Data – Motorcycles. 2008, Department of Transportation: Washington DC, USA. [7] Teoh, E.R. Effectiveness of Antilock Braking Systems in Reducing Fatal Motorcycle Crashes. 2010, Insurance Institute
for Highway Safety: USA. [8] Rizzi, M., Strandroth, J., and Tingvall, C. The effectiveness of Antilock Brake Systems (ABS) on Motorcycles in
Reducing real-life Crashes and Injuries. Traffic Inj Prev, 2009. 10: p. 479-487 [9] Kuroe, T., Namiki, H., and Iijima, S. Exploratory study of an airbag concept for a large touring motorcycle: further
IRC-15-12 IRCOBI Conference 2015
- 31 -

research second report. Proceedings of 19th International Technical Conference on the Enhanced Safety of Vehicles (ESV), 2005. Washington DC, USA
[10] BikeBone. "Hit-Air Motorcycle Airbag Vests and Jackets" Internet http://www.bikebone.com/page/BBSC/CTGY/AT. 2015-03-28].
[11] Sgambati, F. and Lich, T. The safety benefits of motorcycle stability control. Proceedings of SAE Government & Industry meeting, 2015. Washington DC, USA
[12] Rizzi, M., Strandroth, J., Johansson, R., and Lie, A. The potential of different countermeasures in reducing motorcycle fatal crashes: what in-depth studies tell us in 22nd International Technical Conference on the Enhanced Safety of Vehicles (ESV). 2011: Washington DC, USA.
VII. APPENDIX
Fig. A 1. Distribution of detailed accident scenarios for all cases (N=80).
18
3
3
1
2
3
2
1
1
12
4
1
2
1
6
6
1
2
1
3
1
2
0
1
1
1
1
0 5 10 15 20
PTW loses control, impact to object
PTW loses control and impact to oncoming vehicle, impact
PTW loses control and impacting oncoming vehicle, riding over
PTW loses control and impacting oncoming vehicle, riding over unknown
PTW overtakes, falls and impacts object
PTW overtakes, and impacts oncoming vehicle
PTW overtakes, and impacts oncoming vehicle, run‐over
PTW overtakes, loses control and is driven over by vehicle in same lane
Vehicle in same direction turns left when PTW is overtaking vehicle
Oncoming vehicle turns left in front of PTW, impact
Oncoming vehicle turns left in front of PTW, riding over
Oncoming vehicle turns left in front of PTW, riding over unknown
Oncoming vehice overtakes and impacts PTW
PTW turns left in front of oncoming vehicle, impact
Veh. from side drives out in front of straight‐driving PTW, impact
Veh. in same direction, turns in front of PTW, impact vehicle
Veh. in same direction, turns in front of PTW, impact vehicle and then run over
Veh. in same direction, turns in front of PTW, impact vehicle and then object
Veh. in same direction hits PTW from behind
PTW turns left in front of overtaking vehicle in same direction
PTW impacts vehicle ahead and then impacts vehicle in oncoming lane, impact
PTW impacts vehicle ahead and impacts oncoming vehicle, riding over
PTW impacts vehicle ahead and slides into object
PTW impacts crossing VRU and slides into object
Animal impact and slides into object
Case PTW overtakes and crashes into omcoming (other) PTW, fire
Oncoming (other) PTW overtakes and crashes into case PTW, fire
IRC-15-12 IRCOBI Conference 2015
- 32 -

Fig. A 2. Estimated fatal injury sources in detail, all cases (N=80).
10
10
1
2
3
16
1
6
1
4
1
2
6
4
5
5
1
2
0 2 4 6 8 10 12 14 16 18
off road
guard rail
guard rail/off road
road surface
other fixed objects
car front
car windshield
car side low
car side high
car side low/high
car side no more info
car rear
car run over
car low/run over
heavy vehicle impact
heavy vehicle run over
heavy vehicle impact/run over
PTW front
IRC-15-12 IRCOBI Conference 2015
- 33 -


![IRC-20-82 IRCOBI conference 2020 · 2020. 7. 25. · IRC-20-82 IRCOBI conference 2020 709. pressures [21]. It is unclear whether the introduction of the instrumentation causelocal](https://cdn.vdocuments.site/doc/165x107/6117914610f9c764771658b0/irc-20-82-ircobi-conference-2020-7-25-irc-20-82-ircobi-conference-2020-709.jpg)


