Investor and Analyst Day 2010MTU Aero EnginesNovember 9, 2010
November 9, 2010 Investor and Analyst Day 2010 2
Agenda – MTU Investor and Analyst Day 2010
Break14:30 – 15:30
Michael Schreyögg
SVP Defense ProgramsMilitary business – Update / Q&A14:00 – 14:15
Dr. Jörg Henne
SVP Engineering andTechnology
Re-engining the A320 – Engineering perspective
/ Q&A13:30 – 13:45
Egon Behle, CEOOverview and key messages / Q&A12:30 – 12:45
Inka Koljonen
Director Investor RelationsWelcome12:20 – 12:30
Re-engining the A320 – Market perspective / Q&A
Event
Dr. Anton Binder
SVP Commercial Programs13:00 – 13:15
SpeakerTime

November 9, 2010 Investor and Analyst Day 2010 3
Agenda – MTU Investor and Analyst Day 2010
Reiner Winkler, CFOSummary and wrap-up / Q&A17:15 – 17:45
Dinner at L&I Restaurant & Bar19:30
Leo Koppers
SVP Marketing & SalesCommercial MRO market landscape / Q&A15:30 – 16:00
Klaus Müller
SVP Corporate DevelopmentMTU growth strategy / Q&A16:15 – 16:30
Inka Koljonen
Director Investor Relations
Dr. Maximilian Brandl
SVP Finance and Accounting
Quarterly financial disclosure / Q&A16:45 – 17:00
Event SpeakerTime

Overview and Key MessagesEgon Behle, CEO

November 9, 2010 Investor and Analyst Day 2010 5
Market Environment
• Market trends in commercial aerospace remain
strongly supportive
• Latest air traffic numbers indicate a yoy increase
of 10.5% for passenger and 14.8% for cargo –
capacity growth and park rates are improving
further (Sept 10)
• For 2010 IATA expects a 7.7% growth for
passenger traffic and a 19.8% growth for cargo
(acc. to third upgrade in Sept.)
• New aircraft orders remain high, driving upswing
in deliveries
Business Highlights
• We are well on our way to achieve 2010 targets
• High single-digit growth in revenues expected for 2011
-30%
-20%
-10%
0%
10%
20%
30%
40%
Jan 08 Jul 08 Jan 09 Jul 09 Jan 10 Jul 10
0
40
80
120
160
200
240
280
Growth rate (year-on-year)
Monthly traffic (bn. RPKs)
Global International Passenger Traffic
November 9, 2010 Investor and Analyst Day 2010 6
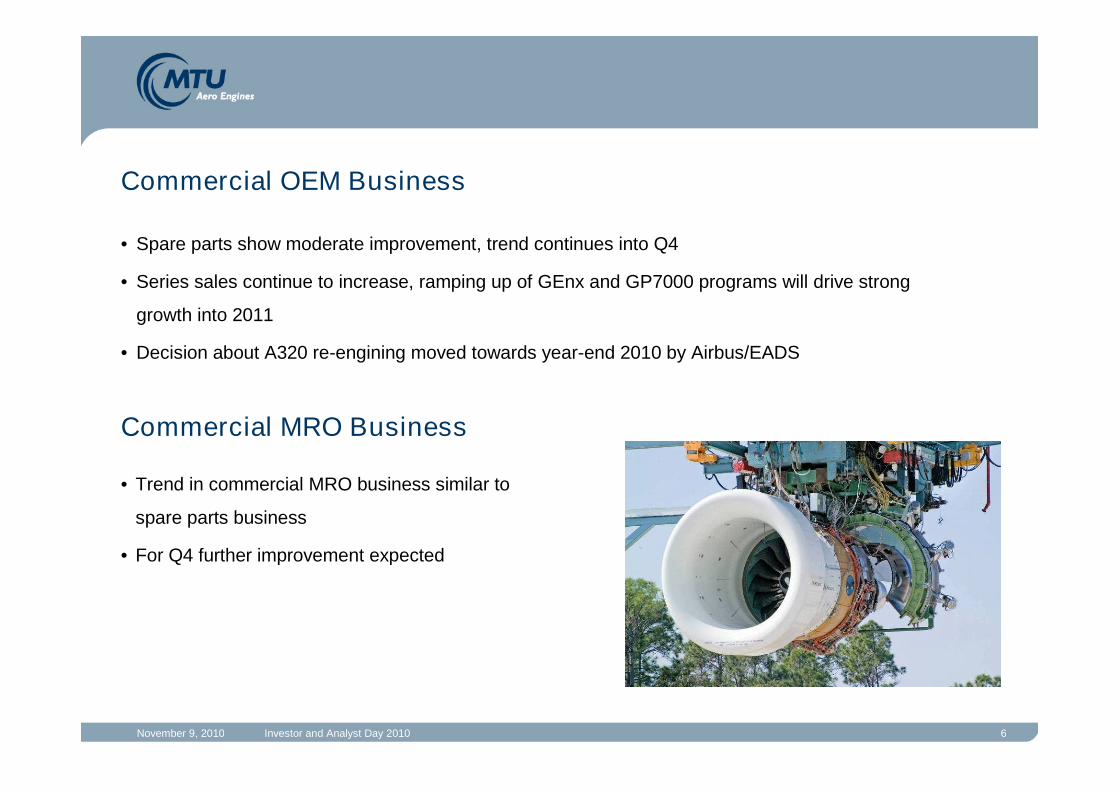
Commercial OEM Business
• Trend in commercial MRO business similar to
spare parts business
• For Q4 further improvement expected
• Spare parts show moderate improvement, trend continues into Q4
• Series sales continue to increase, ramping up of GEnx and GP7000 programs will drive strong
growth into 2011
• Decision about A320 re-engining moved towards year-end 2010 by Airbus/EADS
Commercial MRO Business

November 9, 2010 Investor and Analyst Day 2010 7
Military Business
• High volatility in US$ exchange rate confirms neutral currency view, no
change in hedging strategy
• Based on an avg. US$ assumption of 1.35 US$/€ for 2011, no effect from
currency
Cost savings
• Challenge 2010 program on track to meet target savings of 30 m€ in 2010
• Potential defense budget cuts mainly a risk for maintenance in old engine
programs
• Ramping up of the A400M and U.S. programs will provide future growth
US$ / Hedging

November 9, 2010 Investor and Analyst Day 2010 8
Trends looking into 2011
MTU group: high single digit growth expected
• Commercial new engine sales: 15-20% growth expected based on current delivery schedules
• Commercial spares: limited visibility, but supportive market environment, 5-10% growth expected
• Commercial MRO: trends similar to spares, 5-10% growth expected
• Military business: revenue decline in the range of 10% expected
• “Challenge 2010” cost savings ~20 m€ - as expected
• Additional costs for ramping-up of new programs
- in worst case eating up above mentioned cost savings
• R&D largely stable (without A320 NEO)

November 9, 2010 Investor and Analyst Day 2010 9
Q&A

Re-engining the A320 – Market PerspectiveDr. Anton BinderSVP Commercial Programs

November 9, 2010 Investor and Analyst Day 2010 11
Widebody Narrowbody RJ, TPs & Business Jet
Expected Deliveries and Sales 2010-2029: CAGR ~3%
54%29%15%Engine Deliveries
18%36%46%Sales $
230+ seats 90-230 seats 20-90 seats
Sale
s1
Source: MTU/ASM September 2010 1) Sales expressed in constant 2010$
$340bn
$270bn
$130bn
The Commercial Aero Engine Market is Expected to Generate $740bnof New Engine Sales over the Next 20 Years
100-120PAX$54bn

November 9, 2010 Investor and Analyst Day 2010 12
2024 20262018 2020 202220162014
E-JET Replacement
737EX
MS-21
737RS
C919
A320EXA30X
CSeries
MRJ
Launched
re-engining new aircraft
New Airframer Activities Push Airbus and Boeing

November 9, 2010 Investor and Analyst Day 2010 13
Narrow Body Market Characteristics (Today)
• Little segmentation (A320, B737, B757)(NB: Wide-body has B767, A330, B787, A340, A350, B777, B747, A380 Products)
• Lower end covered by shrinked aircraft (economical challenge)
• Higher PAX single aisle A/C have there limits in turn around time
• Design range: US transcontinental
• CSeries is not a shrinked aircraft
• CSeries has still significant range capability (US transcontinental possible)
• Small wide-body studies underway (turn times advantage)

November 9, 2010 Investor and Analyst Day 2010 14
CS100 CS300
Op
era
tin
gC
ost
Seats14090
Embraer/Bombardier
5-abreast CSeries has a Cost Advantage Between 90 and 140 Seats

November 9, 2010 Investor and Analyst Day 2010 15
-18
-16
-14
-12
-10
-8
-6
-4
-2
0
2
• 90 aircraft on order plus 90 options
• significant campaign activity ongoing
• engine testing underway
Delta Cash Operating Cost per Seat in %
The CSeries/Pure Power 1000G is Changing the Economics
CSeries C300
Today‘s Product 1 Today‘s Product 2

November 9, 2010 Investor and Analyst Day 2010 16
Likely Market Scenarios
• Short term no re-engining
• Airbus, Boeing likely to lose marketshare in the 100 to 125 PAX market(CSeries, price pressure)
• Airbus, Boeing bet on slow marketintroduction of new entrants
• What does the new aircraft look like(what technology)?
Re-engining near term New aircraft long term
• Airbus or Boeing decide on re-engining- Airbus more likely to go
• What is the competitor (AI, Boeing)doing?
• Competitive products in 100 to 125 PAXclass and against new entrants
• Manage the transition and overlapbetween the products

November 9, 2010 Investor and Analyst Day 2010 17
MTU’s Product Offerings: V2500
• superior product in many ways- fuel burn- reliability- maintainability
• 150 operators
• 4,200 engines delivered (installed ~ 3,800)
• 1,860 engines ordered
• delivery: 370 to 460 p.a.
MTU is 100% committed to this program.

November 9, 2010 Investor and Analyst Day 2010 18
MTU’s Product Offerings: Pure Power 1000 (GTF)
• 15% fuel burn advantage
• 50% perceived noise reduction
• 20% maintenance cost reduction
• proven technology
• 3 applications to date
MTU is 100% committed to this newengine concept.

November 9, 2010 Investor and Analyst Day 2010 19
Market Perspective Summary
• The market segment is huge and very important
• Significant activity is going on between 70 and 2xx PAX
• C Series economics are obvious
• 2 scenarios are likely for future NGSA market (Airbus, Boeing)
• MTU has superb product offerings for future market demands

November 9, 2010 Investor and Analyst Day 2010 20
Q&A

Re-Engining of the A320 – Engineering PerspectiveMost Advanced Engine Technology at Lowest RiskDr. Jörg HenneSVP Engineering and Technology

November 9, 2010 Investor and Analyst Day 2010 22
• 15% improvement in fuel burn overtoday´s products at EIS 2015
• Noise -20 dB better than ICAO Stage 4 T
• Maintenance cost significantly better thantoday´s products
• Thrust range 27 to 33K lbs
• Meets all installation constraints (CG, weight,max. fan diameter)
Irkut MC-21Irkut MC-21
COMAC C919COMAC C919
A/C EIS
Dec 2015
A/C EIS
Dec 2015
PO
TE
NT
IAL
PR
OG
RA
MS
One Common Engine - A320EX & MC-21
Common Core – 737 NG
2008 2009 20112010 2012 2013 2014 2015
Boeing 737 NG
A320EXA320EX
FETT Jun 2014
Enginecertification
Preliminarydesign start
Jan 2011
Nov 2012
The A320NEO Significantly Reduces Operating Cost by Using theNewest Available Green Engine GTF Technology

November 9, 2010 Investor and Analyst Day 2010 23
• highest propulsive efficiency• highest component efficiencies
• at lowest weight• at lowest maintenance cost• at lowest noise• at lowest emissions … meeting all production cost targets
The Fan Drive Gear System enables a larger fan size
allowing the low pressure compressor and turbine to run
at optimal rotating speeds resulting in lowest weight
The Geared Turbofan Engine ConceptAchieving Lowest Fuel Burn and Lowest Noise for Best Cash Operating Cost
fewer stages
big
ger
fan
siz
e
lowest weight gas generator &high-speed low-pressure turbine

November 9, 2010 Investor and Analyst Day 2010 24
Over 42,000 turboprop / turboshaft engines produced
Over 400 million operating hours
29,338 PT6A series engine in serviceover 235 million operating hours
8,169 PT6T turboshaft engines in serviceover 33 million operating hours
4,845 PW100 series engines in serviceover 70 million operating hours
Pratt & Whitney’s Reduction Gearbox ExperienceA Very Reliable Proven Design

November 9, 2010 Investor and Analyst Day 2010 25
The Fan Drive Gear System Technology MaturationR
isk
Low
High
1987
PWC ATFI Demo 11K SHPStar System 276 Hours
Flight Weight Design 32K SHPPlanetary & Star Systems4 Builds - 1000 Hours Testing
ADP Demo Engine 40K SHPPlanetary SystemGround, Wind Tunnel and Rig Testing - 600 Hours
PropFan Demo Engine 13K SHPCounter Rotating SystemGround and MD80 Tested
Demo rig 28K SHPStar System>500 Hours
2007 2008
’87 – ‘89
’92 – ‘93
’94 – ‘98
’01-’02
1992 1994 2001
• 20+ years of technology demonstration in rig and engine tests
• More than 1500 hrs total, mostly full scale, in design space up to 40k SHP
• Comprehensive rig test program to support the GTF Demonstrator
November 9, 2010 Investor and Analyst Day 2010 26
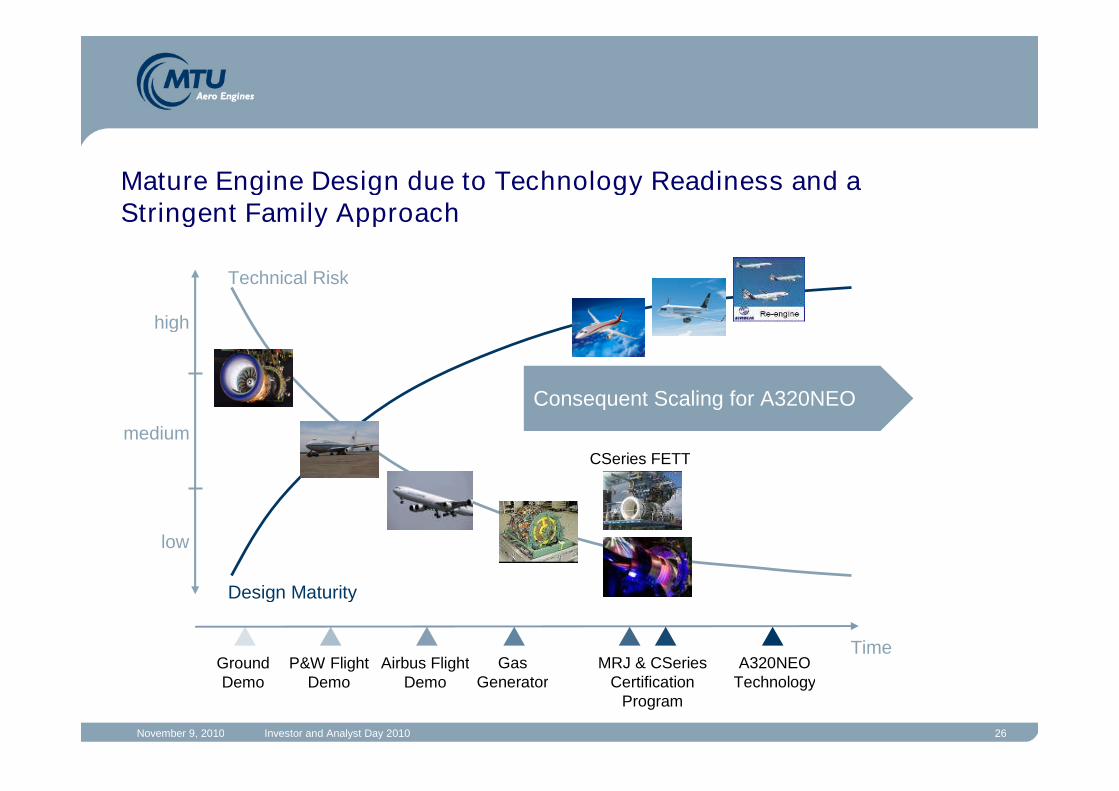
Technical Risk
Design Maturity
Time
low
high
medium
GroundDemo
P&W FlightDemo
Airbus FlightDemo
MRJ & CSeriesCertification
Program
GasGenerator
A320NEOTechnology
CSeries FETT
Consequent Scaling for A320NEO
Mature Engine Design due to Technology Readiness and aStringent Family Approach

November 9, 2010 Investor and Analyst Day 2010 27
Key Enabler – High-Pressure Compressor
HPC technology and low-cost design evolution
• efficiency well above 90%
• 10% weight reduction … maintaining operability
MTU Shares Component Responsibility with Pratt & Whitney

November 9, 2010 Investor and Analyst Day 2010 28
MTU Technology Program CLAIRE (CLean AIR Engine)
70
80
90
* Counter-rotatingintegrated shroudedpropfan
** Intercooled recuperatedAero Engine
Fu
elB
urn
&C
O2
[%]
2005 2010 2015 2020 from 2025 2030 from 2035
100Base CLAIRE 1 CLAIRE 2 CLAIRE 3
up to30%
V2500 CRISP* IRA**
up to15%
up to20%
ACARE
TARGET
ATF GTF 2013 GTF 2025 GTF 2035
GTF
MTU is well positioned to deliver technologies for further fuel burn & CO2 reductioncompliant with the ACARE targets based on the Geared Turbofan concept
November 9, 2010 Investor and Analyst Day 2010 29
… thank youfor your attention

November 9, 2010 Investor and Analyst Day 2010 30
Q&A

Military Business - UpdateMichael Schreyögg,SVP Defense Programs

November 9, 2010 Investor and Analyst Day 2010 32
The MTU Defense Product Range is Based on Over Fifty Years ofExperience
Trusted partnerin U.S. defenseprograms
High-tech,state of the artproducts
Decades ofexperience
MilitaryMilitaryProgramsProgramsMTUMTU
MTR390MTR390 EJ200EJ200
RB199RB199 TP400TP400 F110F110 F414F414
GE38GE38
TyneTyne TT--6464 J79J79 LarzacLarzac RR250RR250
F117F117

November 9, 2010 Investor and Analyst Day 2010 33
Programs in Service(RB199, RR250, T64, Tyne, J79)
New OEM Programs(TP400, MTR390, EJ200)
0
50.000
100.000
150.000
200.000
250.000
300.000
350.000
400.000
450.000
1990 1995 2000 2005 2010 2015 2020
Philosophy in the past• Continuous adaptation of capacity to reflect reduced flight hours and MRO• Cost management through optimized repair• Initial adaptation of new support concepts (PPP)
Engin
eF
lightH
ours
[EF
H]
History Engine Flight Hours German Airforce

November 9, 2010 Investor and Analyst Day 2010 34
German Defense Budget in bn €
Defence Budget
Aerospace
Aerospace-related budget remains at a high level of 3-3.4 bn€ – Focus: efficiency !
2014
27.5
5.0
2.0
2.4
1.0
2013
29.6
4.5
2.0
2.2
1.0
2012
30.9
4.0
2.0
2.0
1.0
2011
31.5
4.0
2.0
2.0
1.0
2010
31.4
4.0
2.0
2.0
1.2
2009
31.5
4.0
2.0
2.0
1.2
Invest
Maintenance
Aerospace
Defence Budget
Invest
Maintenance
Defense Budget
Invest

November 9, 2010 Investor and Analyst Day 2010 35
Restructuring of the German Armed Forces:
8,3 bn€ have to be saved by 2014
• Reduction of our maintenance volume until Eurofighter Typhoon and A400M pick up
• Confirmation of expected Eurofighter Typhoon and A400M production volumes through 2020
• Unique chance to extend our success model “Cooperation” to stress the integration factor
• Roughly 10% revenues decline in 2011 expected
Consequences for MTU
• Reduction in quantity
• Fewer new procurements (FTH, Talarion)
• Phase out of weapon systems
• Reduction of engine flight hours
• New structures to be implemented
Bundeswehr – Military Transformation
Main consequences of the transformation

November 9, 2010 Investor and Analyst Day 2010 36
Military Program Portfolio
F-4
2010 2030
BO-105
CH-53
Tornado
Transall
Eurofighter
Tiger
A400M
GE38
Cooperation Contract
Se
rvic
es
OE
M
2020200019901980
Change of MTU´s Military Product Portfolio in the next future

November 9, 2010 Investor and Analyst Day 2010 37
Challenge
• provide us with opportunities to expand our services for the air forces.The forces will continue to concentrate on pure military missions.
Budget limitations are challenging, but …
MEPC
• confirm our way to expand MTU´s military business on international markets.
• “The Bundeswehr will increasingly focus on its military core capabilities and sovereign duties. All otheractivities will have to be put under close scrutiny, and "make or buy" decisions will have to be made basedon a comprehensive cost analysis. The commission tasked with coming up with proposals for reorganizingthe Bundeswehr is seeing potentials in outsourcing more activities in the logistics and maintenance areas. “
(Commission for the structural reform, Bundeswehr, October 2010)

November 9, 2010 Investor and Analyst Day 2010 38
MTU Military Programmes Summary
• Existing and long-term production and support contracts
• Unique expertise in MRO (e.g. services, repair solutions)
• Highly trustful and strong customer relations
• Change process also provides future opportunities
• Continued exploration of International Market (ref.: MEPC)

November 9, 2010 Investor and Analyst Day 2010 39
Q&A

Commercial MRO Market LandscapeLeo KoppersSVP Marketing & Sales

November 9, 2010 Investor and Analyst Day 2010 41
0
6.000
12.000
18.000
24.000
30.000
06/2007 06/2010
New Mature Sunset
62%
35%
50%
46%
4%
3%+19%
# eng
2 GE90G, GP7 excl.Sunset = CF6-50
• Strong growth ofaddressable fleet
• High share of new types(less MRO-intensive)
Mature = CF34-3, CF6-80C, CFM56-3,PW2000, V2500-A1/-D5
New = CF34-8/10, CFM56-5B/-7, PW6000,V2500-A5
MTU Maintenance2Utilization
• EFH above pre-crisis levels
• In-production models showstronger utilization growththan older ones
EFH= Engine Flying Hours(incl. freighters)
Source: OAG-Back, UBS
0
3
6
9
12
15
Q2/2007 Q2/2010
EFHs (mil) +11%
0
10.000
20.000
30.000
40.000
50.000
06/2007 06/2010
New Mature Sunset
46%
38%
16%
33%
44%
23%
+6%
# eng
Total engine fleet1
Source: Ascend
• Structural change to lessMRO-intensive fleet
• Engine MRO demandtrough short-term
1 Active engines, RJ & airliners
Although traffic, flight hours and active fleet have recovered, the fleet has undergone astructural change driven by the crisis, high production rates and high fuel prices
Passenger traffic
• Global traffic and capacityis above pre-crisis levels
• Part of growing demandabsorbed by higher loadfactor vs. add. aircraft
0
1
2
3
4
5
2007 2010E
RPK (tn)+7%
Ø
PLF
77%
Ø
PLF
78%
RPK = Revenue Passenger KilometerPLF = Passenger Load Factor
Source: IATA, MTU-ASM estimates
Passenger Traffic and Engine Fleet Development

November 9, 2010 Investor and Analyst Day 2010 42
0
2.500
5.000
7.500
10.000
12.500
2008 09 10 11 12 13 14 15 16 17 18 19
MTU MTU-New MTU-Future Others
ASFI2008
MTU MaintenancePortfolio
09≠08 10≠09
-12% +4%1
ASFI `07
Total
09≠08 10≠09-11% -4%
ASFI ‘08
ASFI ‘09
Demandtrough
MTU has been affected in line with the market in the short term, however MTU portfolioengines show over-proportional growth in the longer term
• Return to 2008 levels by 2012 only
- Market further down in 2010
- Strong recovery expected in 2011
• MTU Maintenance has seen a declinecomparable to the total market for 2009vs. 2008 (CF6-50, CFM56-3retirements)
• MTU Maintenance is well placed tobenefit from the medium- to long-termMRO market growth
- Key programs: V2500, CFM56, CF34
- New programs: GE90G, GP7000
Impact of Global Economic Crisis on Engine MRO
Source: AeroStrategy Forecast Initiative (ASFI) 2007/08/09 (commercial jets >35 seats)Notes: 1 Including new programs, 2 ASFI 2009, 3 incl. New/Future
CAGR 2010-192
+7.3%
MTU Maintenanceextended portfolio3
MTU Maintenanceportfolio
+6.5%
Total market
+3.3%
(GE90G, GP7000)
# SVs
RemarksShop visits commercial jet engines

November 9, 2010 Investor and Analyst Day 2010 43
MTU Maintenance engine types are enjoying over-proportional growth – with a positive
impact on MTU’s market share as of today, and in future
Market Dynamics and Market Shares
Top 10 providers 2009*Com. engine MRO market 2010-2019 (mUS$1)
Market Share
Air France / KLM
Delta TechOps
American Airlines
SR Technics
Snecma Services
14%
6-7%
7-9%
10-13%
7-8%
3-4%
6%
4%
3%
5-6%
MRO Provider
1
5
3
2
4
9
6
8
10
7
GE Engine Services
Rolls-Royce2
Lufthansa Technik2
MTU Maintenance3
Pratt & Whitney
* Estimates based on AeroStrategy 2009, 2 Including JV, 3 MTU actuals
Source: AeroStrategy Forecast Inititiave 2009;1 includes MTU escalation adjustment @ 3.6% p.a
0
5.000
10.000
15.000
20.000
25.000
30.000
35.000
2010 2011 2012 2013 2014 2015 2016 2017 2018 2019
MTU MTU NEW/Future* Others
* GE90 Growth, GP7000, GEnx
CAGR 2010-2019:World (total): 8.3%MTU coverage 10.4%MTU incl. New/Future 11.8%

November 9, 2010 Investor and Analyst Day 2010 44
MTU Maintenance Initiatives
• Full suite of engine MRO services customizable up toTotal Engine Care (TEC®)
• New engines: GE90 Growth, GP7000
• New services: Expansion accessory/LRU management,dedicated on-wing teams, MTUPlus On-Wing Cleaning
Product/
service
portfolio
• Customized & flexible workscopes
• Fully-dedicated customer support
• Focus on customer satisfaction and quality
• Dedicated division for 3rd party repairs
Customized
technical
solutions
• Innovative and leading-edge processes (flowline®, MROInTakt) with strong capacity increase and TAT improvement
• Repair beats replacement philosophy, development ofproprietary cutting-edge MTUPlus repairs
• Make use of low-cost locations (China, Malaysia andPoland)
Cost
competitive-
ness

November 9, 2010 Investor and Analyst Day 2010 45
MTU Maintenance is by far the best placed independent and amongst the leading providers
Engine MRO* Supplier Landscape & Positioning* Commercial jet aircraft >35 seats, portfolio of JVs ≥50% considered
Portfolio Diversification1
øP
ort
folio
Matu
rity
OEM
Service Expander
Independent
Airline
Low
Low
Med
HighMed
Hig
h
NACIL-Future
IAI-Future
ADAT- Future
STANDARD [incl.CFM56-7]
EMIR UA
THY
TG
TAP
STANDARD AERO
ST Aero
SRT
SNECMA
SVA
SIA
RR
QF
PIA
PW
NACIL
LHTKAL
JAT
JAL
IHI
IBERIA
IAI
HAECO
GEES
GMF
FINNAIR
EGYPT
EGAT
DTO
CAL
CEES
AVEOS
ANA
AMR
AMECO AMS
AFI/KLMADAT
CTS PGTC TIMCO MYTECCTIMCO
SAA
NTP JETTHRUSTJAT
ETHOPIAN JALCo ITR MIAMINote:• Exited: VOLVO AERO, AVIO, Aerothrust, TMW
MTU-2009
MTU-Future
MTU-2010
Source: MTU Analysis 03/20101 Based on # engines offered, weighted by MRO market size in USD 2010-19
Recent developments:
• Few failures, bar a few “weak”independents:
- AeroThrust
- Turbine Motor Works
• Some independents/airlines have“theoretically” improved theirpositioning- Standard Aero*
- ADAT*
- NACIL*
- IAI Bedek
• New MTU engines in 2010:GE90 Growth, GP7000
* Co-operation w/ OEMs (licensing, baseload etc.)

November 9, 2010 Investor and Analyst Day 2010 46
Q&A

MTU Growth StrategyKlaus MüllerSVP Corporate Development

November 9, 2010 Investor and Analyst Day 2010 48
3.5
4.1
2.9Passengers worldwide(billions per year)
Source: ICAO, MTU/ASM July 2010
Demand for Global Mobility will Continue to Grow
2000 2005 2010 2015 2020 2025
1.7
2.02.4
Passenger Traffic Growth Forecast

November 9, 2010 Investor and Analyst Day 2010 49
After a Decade of A/C Upgrades the Industry Faces Many New A/CPrograms. MTU is Well Positioned to Participate
A318TU204A380CRJ700,CRJ900E170,E190An148
ConcordeTU144TU154YAK-42YAK-44A300DC10L1011IL76IL96VFW614
727737 JT8DC-9TridentVC-101-11747-1/2YAK-40F28
DC-8CaravelleComet
A320737 CFMI757MD80An-72A310MD11767747-4ATRF100BAe146
1950 - 59 1960 - 69 1970 - 79 1980 - 89 1990 -99 2000 - 09
717737 NGA319,A321MD-90An-74A340A330777Il-96CRJ-100(200ERJ-135/145328 JetFokker 70RJ Avro
AircraftDevelop-ments
(Entry intoServiceDate)
IndustrialzationStart Consolidation
NationalPrograms
EUW/B
W/Bs (delayed)
RJ70sNew entrantsCH/RU
BRARJ50s(scope clauses)
Deeper Market SegmentationEfficiency / Fuel / Noise
3
9
11
9
10
Decadeof…
USACs
EU/USN/B
ConsolidationGlobal Supply
5
NGSA?A320NEO?
CSeriesMS-21C919A350->787747-87X7?An224CRJ 1000SSJ100ARJ21MRJ
2010- 20 2020ff
…NGSA /CleanSheet?BOE VLA?China W/B?Russia?India?
10

November 9, 2010 Investor and Analyst Day 2010 50
Base: % =proportion active engines in 2010 vs. max. populationSource: AS, Oct. 2010
Some Large Fleets are Moving Towards Maturity
Fleet growthEstablish Engine EIS, Market success
+ Modifications
Mature fleetSpare Parts and rise of
Repairs/PMAs, Growing Surplus
Sunset fleetCannibalizsation, Surplus
Wide range of PMA, Repairs (LLPs)
100% 100% 50% 0%0% 50%
CFM56-3
JT8-2
JT8D
CF6-80C2
CF34-3
AE3007
CFM56-5C
CFM56-7
T500
T700
GE90B
GP7
2010- Types in MTU/OEM
Portfolio- Types in MRO-Portfolio- Volume = number of
active engines in 2009
RB211-535
PW4-100
GE90G
PW4-94´´
V2500 A5
CFM56-5B
T800
CF34-10
T900
CF34-8´´
CF6-80E
PW4-112
PW2000
PW6000
V2500-D5
V2500-A1
CFM56-5A
RB211-524
Spey
CF6-50
CFM56-2
JT9D

November 9, 2010 Investor and Analyst Day 2010 51
Base: % =proportion active engines in 2010 vs. max. populationSource: AS, Oct. 2010
MTU will Enhance its Exposure in the Mature “Sweet Spot”
100% 100% 50% 0%0% 50%
CFM56-3
JT8-2
CF34-3
CFM56-7
T500
T700
T900
CF34-8
GEnX
GP7
GE90G
PW4-94´´
T800
CF34-10
T1000
V2500 A5
Fleet growthEstablish Engine EIS, Market success
+ Modifications
Mature fleetSpare Parts and rise of
Repairs/PMAs, Growing Surplus
Sunset fleetCannibalization, Surplus
Wide range of PMA, Repairs (LLPs)
Irkut Engine
Comac LeapX
A320NEO?
TXWB
PW1000
SaM1146
PW4-100´´
CFM56-5B
CF6-80E
PW4-112
PW6000
CF6-80C2
GE90B
PW2000
V2500-D5
RB211-535
RB211-524
CFM56-5C
AE3007
CFM56-5A
V2500-A1
CF6-50
JT9D
Spey
CFM56-2JT8D
2020- Types in MTU/OEM
Portfolio- Types in MRO-Portfolio- Volume = number of
active engines in 2009

November 9, 2010 Investor and Analyst Day 2010 52
The Emergence of New OEM Players will Change Traditional SupplyChains. New Customers and Market Opportunities for MTU
2025??
• Established supply chains• Technology leadership• Established partnerships• Four OEMs, four 1st-tiers cover
~100% of market
Today:(2010)
UEC: 2016?
ACAE: 2016
• Changing supply chains?• New partnerships?• MeToo technology• New OEMs limit market share of
established players
Future:(2016)

November 9, 2010 Investor and Analyst Day 2010 53
Source: MTU/ASM Sep 2010
EJ200F404F414F110
JT8D-200CF6-80F117
TP400
openMTR390
GE38
1900
9100
2900
7900
0
4000
8000
12000
UAV H/L Fighter/Trainer
Transp./Tanker
CF6-80GEnx
GP7000
PW6000GTF
V2500GTF
ca. 31,000
Ø PW500PW300PW800
PW800 open
4200
8500 8200
6500
Very LightBizjets
LightBizjets
MediumBizjets
HeavyBizjets
4300
16300
7500
RJ NB WB
2700
TP 30-90
ca. 27,000ca. 22,000
AircraftDeliveries(2010-2029)
Demand for 80,000 Aircraft will Generate ~$850bn Engine Business

November 9, 2010 Investor and Analyst Day 2010 54
Target corridor
Our Target is to Grow Profitably and Faster than the Market:€6bn Revenue in 2020
Identified NewOpportunities
New Business
ExistingBusiness
* Based on actual Strategic Planning and Market Szenarios
2.000
3.000
4.000
5.000
6.000
7.000
2010 2011 2012 2013 2014 2015 2016 2017 2018 2019 2020
Market Growth (CAGR 6,3%)in all segments
€6bn Target Growth Drivers:
n.n.
GEnx,CSeries / MRJ
V2500 (OEM/MRO)GP7000CF34 (MRO)TP4000

November 9, 2010 Investor and Analyst Day 2010 55
Strategic Pillars
Strategic Target Fields
All Strategic Activities Have to Fit in our Strategy Framework for us toReach Our Growth Target
Customers /Partners
Products Branding Shareholders Employees Locations
Maintainleadership intechnology
Gain access tofastest growing
new engineprograms
Make use ofM&A
opportunities
Furtherimprove costcompetitive-
ness
Strengthen corebusiness byaccessing
related nichebusiness
Strategic Foundation
Quality, Reliability, Speed, Productivity and Intercultural Competence
Profitable GrowthStrategic target

November 9, 2010 Investor and Analyst Day 2010 56
Vision 2020: Targets and Activities
ProfitableGrowth
Grow faster than the market and maintainprofitability
Shareholder We are committed to shareholder value
LocationsWe maintain a global network of companies.We operate close to our customers
EmployeesWe are highly skilled and motivated, haveintercultural and entrepreneurial skills
Customers /Partners
We are global partner of all OEMs and airlines.We deliver overall customer satisfaction
ProductsWe are benchmark for highly efficienttechnologies
BrandWe are a leading brand in the aviation industry– well recognized and trusted
New programs: GEnx, GE38, PW800,PurePower, GE90 MRO, Parts repair...
Continuous dialogue
MTU Poland in operation,Establishment China Rep Office…
HR: Education and training, Incentives, …
Partnership PW, GE, RR, …Airline partners JBL, CSA, SDA…
Technology roadmap to market: GTF-Tech,TCFs and Blisk manufacturing…
Aligned marketing…
Target Projects and Activities (examples):
November 9, 2010 Investor and Analyst Day 2010 57
Summary
• The demand for global mobility is far frombeing saturated
• Many new programs and new emergingplayers stimulate the market in the nextdecade
• The supply chain offers new opportunities
• The market in the next decade opens upmany opportunities for MTU to growprofitably
• MTU targets profitable growth and will grow faster than the market (€6bn)
• We established Vision 2020 and the Strategy Framework to reach our growthtarget

November 9, 2010 Investor and Analyst Day 2010 58
Q&A

Quarterly Financial Disclosure
Inka Koljonen, Director Investor RelationsDr. Maximilian Brandl, SVP Finance & Accounting,

November 9, 2010 Investor and Analyst Day 2010 60
Introducing a New Format for the Quarterly Results Release
What´s new?• More information on underlying business trends – on group and segment level
• Slightly adjusted presentation structure and layout
• Net income will be adjusted for effects out of PPA – consistent with the definition of EBIT- In future PPA will be the only earnings adjustment item (and potential one-off items,
which do not relate to underlying business performance)
- This should diminish the range of EPS expectations in the market (many institutionslike Bloomberg, Reuters show a blend of reported and adjusted figures)
Why is MTU not adjusting for US$ and other valuation effects?• US$ volatility is immanent to our business model
• Short- and mid-term the earnings effect is managed by hedging
• Long-term the company has to “live with it”
In the following we will lead you through the new presentation – based on 9M2010 figures -and will be happy to discuss your comments afterwards

November 9, 2010 Investor and Analyst Day 2010 61
Agenda
• Business Highlights
• Financial Highlights
• Segment Reporting
• Group Key Figures
• Guidance
• Appendix
Principle structure of new quarterly report

November 9, 2010 Investor and Analyst Day 2010 62
Business Highlights
• Market trends in commercial aerospaceremain strongly supportive
• Latest air traffic numbers indicate (Sept 10)a yoy increase of 10.5% for passenger and14.8% for cargo traffic – capacity growthand park rates are improving
• For 2010 IATA expects 7.7% for passenger
traffic and 19.8% for cargo (acc. to third
upgrade in Sept.)
• New aircraft orders remain high, drivingupswing in deliveries
• Guidance 2010 confirmed
• A320 re-engining decision expected for year-end 2010
Market Environment
-30%
-20%
-10%
0%
10%
20%
30%
40%
Jan 08 Jul 08 Jan 09 Jul 09 Jan 10 Jul 10
0
40
80
120
160
200
240
280
Growth rate (year-on-year)
Monthly traffic (bn. RPKs)
Global International Passenger Traffic
Principle structure of new quarterly report

November 9, 2010 Investor and Analyst Day 2010 63
Commercial OEM Business
• Trends in commercial MRO business similar tospare parts business
• For Q4 further improvement expected
• Spare parts show moderate improvement, trend continues into Q4
• Series sales continue to increase, ramping up of GEnx and GP7000 programs will drive stronggrowth into 2011
• Decision about A320 re-engining moved towards year-end 2010 by Airbus/EADS
Commercial MRO Business
Principle structure of new quarterly report
November 9, 2010 Investor and Analyst Day 2010 64
Military Business
Cost savings
• Challenge 2010 program on track to meet target savings of 30 m€in 2010
• Potential defense budget cuts mainly a risk for maintenance in oldengine programs
• Ramping up of the A400M and U.S. programs will provide futuregrowth
US$ / Hedging• High volatility in US$ exchange rate confirms neutral currency view,
no change in hedging strategy
• Based on an avg. US$ assumption of 1.35 US$/€ for 2011, noeffect from currency
Principle structure of new quarterly report

November 9, 2010 Investor and Analyst Day 2010 65
Agenda
• Business Highlights
• Financial Highlights
• Segment Reporting
• Group Key Figures
• Guidance
• Appendix
Principle structure of new quarterly report

November 9, 2010 Investor and Analyst Day 2010 66
Financial Highlights
226
211
10,8% 11,3%
0
50
100
150
200
250
300
9M 2009 9M 2010
0,0%
5,0%
10,0%+7%
143
96
0
50
100
150
200
9M 2009 9M 2010
+49%
10093
2,04
1,91
0
25
50
75
100
125
150
9M 2009 9M 2010
0,0
0,5
1,0
1,5
2,0
2,5
+7%
+7%
1.955 1.992
0
500
1.000
1.500
2.000
2.500
9M 2009 9M 2010
+2%*)
*) in US$stable
Revenues (in m€) EBIT adj. (in m€)
Free Cash Flow (in m€)
Principle structure of new quarterly report
Net income / EPS reported (in m€ / €)
November 9, 2010 Investor and Analyst Day 2010 67
Agenda
• Business Highlights
• Financial Highlights
• Segment Reporting
• Group Key Figures
• Guidance
• Appendix
Principle structure of new quarterly report

November 9, 2010 Investor and Analyst Day 2010 68
OEM Segment
3%378.3366.7Military business
4%821.6790.9Commercial business
4%1,199.91,157.6Revenues
Change9M 20109M 2009(in m€)
3%4,066.53,965.1Order book in m€
6%3,881.93,662.3Commercial business in US$
-14%1,222.21,422.9Military business
Change30/09/201031/12/2009Order book in m€
• Commercial business US$ backlog increased by 6% driven by neworders for V2500 and GTF engines
• Adjusted for US$ effects commercial OEM revenues remained stable
• Underlying series sales increased at a mid to high single digit rate. Spareparts sales broadly flat yoy.
Principle structure of new quarterly report

November 9, 2010 Investor and Analyst Day 2010 69
OEM Segment
-10.8-5.4R&D capitalization
95.470.2R&D self-financed
22.1%20.3%Gross profit margin
13%265.2234.6Gross profit
13.8%13.7%EBIT adj. margin
5%165.9158.2EBIT adj.
4%1,199.91,157.6Revenues
Change9M 20109M 2009(in m€)
• R&D increased by 25 m€ to 95 m€
• EBIT margin remained stable at 13.8%
• Negative commercial mix effects compensated for by cost savings andmilitary.
Principle structure of new quarterly report
November 9, 2010 Investor and Analyst Day 2010 70
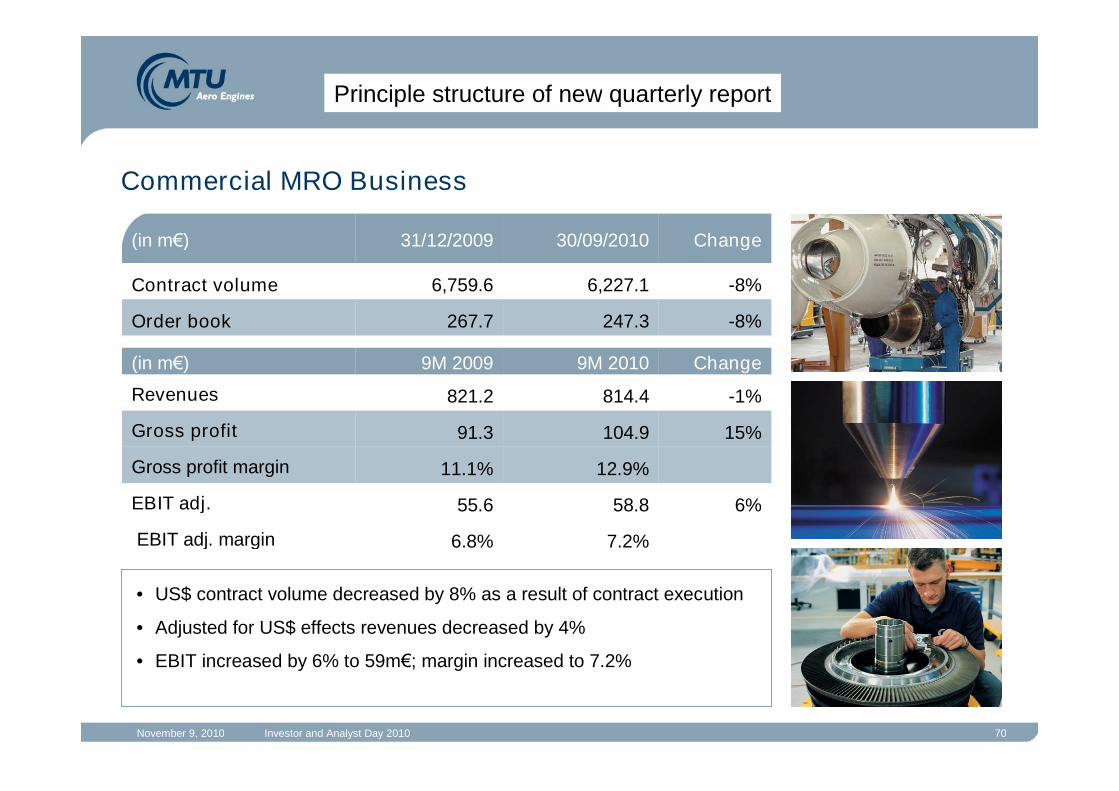
Commercial MRO Business
12.9%11.1%Gross profit margin
15%104.991.3Gross profit
7.2%6.8%EBIT adj. margin
6%58.855.6EBIT adj.
-1%814.4821.2Revenues
Change9M 20109M 2009(in m€)
• US$ contract volume decreased by 8% as a result of contract execution
• Adjusted for US$ effects revenues decreased by 4%
• EBIT increased by 6% to 59m€; margin increased to 7.2%
-8%247.3267.7Order book
-8%6,227.16,759.6Contract volume
Change30/09/201031/12/2009(in m€)
Principle structure of new quarterly report

November 9, 2010 Investor and Analyst Day 2010 71
Agenda
• Business Highlights
• Financial Highlights
• Segment Reporting
• Group Key Figures
• Guidance
• Appendix
Principle structure of new quarterly report
November 9, 2010 Investor and Analyst Day 2010 72
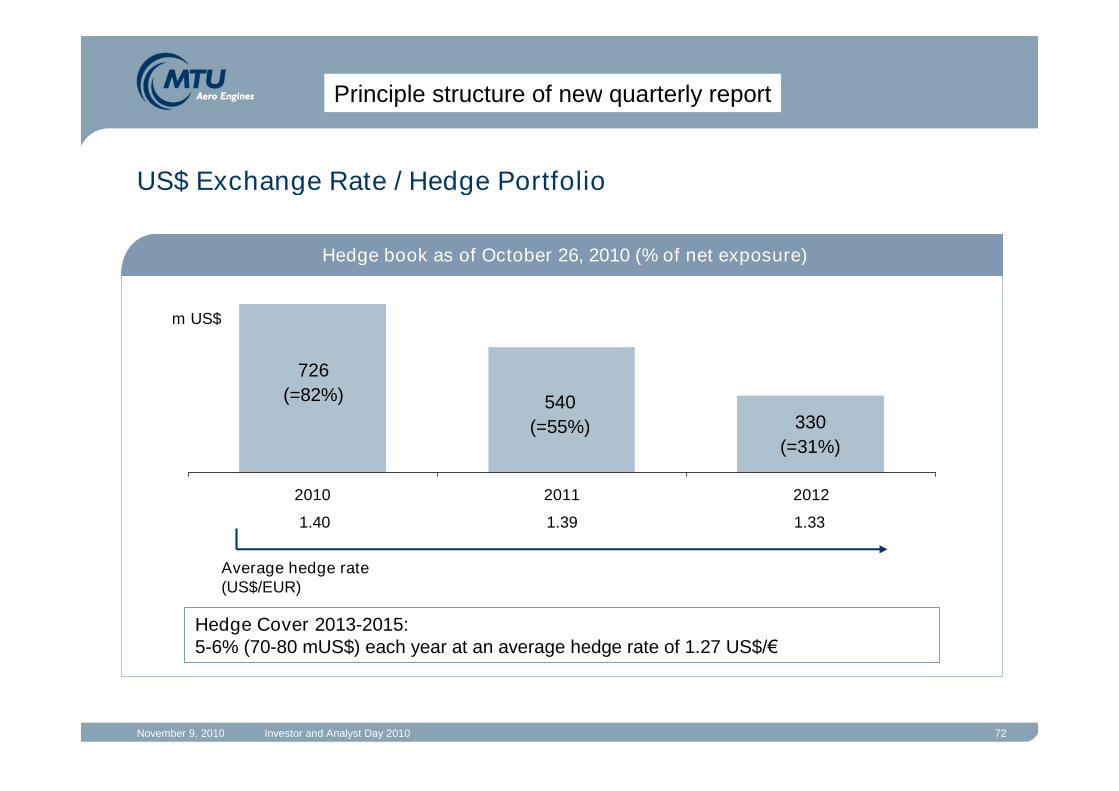
US$ Exchange Rate / Hedge Portfolio
2010 2011 2012
726
(=82%)
330
(=31%)
Average hedge rate(US$/EUR)
1.40 1.39
m US$
1.33
540
(=55%)
Hedge Cover 2013-2015:5-6% (70-80 mUS$) each year at an average hedge rate of 1.27 US$/€
Hedge book as of October 26, 2010 (% of net exposure)
Principle structure of new quarterly report

November 9, 2010 Investor and Analyst Day 2010 73
P&L Highlights
34.2%35.6%Tax rate
-62.9-63.8Tax
5%121.1115.5Net income adj.
5%2.482.37EPS adj.
3%184.0179.3EBT adj.
-34%-42.1-31.5Financial result
-16.0-18.8•Interests for pension provisions
-7.29.4• Non cash valuations (swaps)
-11.8
-21.2
-10.3
210.8
1,954.9
9M 2009
-9.8
-33.0
-9.1
226.1
1,992.3
9M 2010
2%Revenues
7%EBIT adj.
• US$ valuations / Interests / others
-56%Other financial result
12%Interest result
Change(in m€)
Principle structure of new quarterly report

November 9, 2010 Investor and Analyst Day 2010 74
9M 2010 Free Cash Flow
95,7
143,0
207,1
+ 103,5
- 167,6
0,0
50,0
100,0
150,0
200,0
250,0
CF from
operatingactivities
CF from
investingactivites
Short-term
financialsecurities
9M 2010
Free CashFlow
9M 2009
Free CashFlow
Cash flow from operating activities
• increased by 15% from 179.8 m€ in Sept. 09 to 207.1 m€ inSept. 10
Cash flow from investing activities
• includes short-term financial securities of 103.4 m€ in Sept.10
• w/o short-term financial securities capex would be 64.1 m€in Sept. 10 (compared to 84.1 m€ in Sept. 09)
Free cash flow
• FCF at 143 m€ is above of our guidance 2010
• Full year guidance of 120m€ implies a cash outflow in Q42010 for tax payments, investments in machinery for GEnxand limited military prepayments
Liquidity
• at the end of Sept 2010 was 89 m€
Cash Flow in m€ Comments
Principle structure of new quarterly report

November 9, 2010 Investor and Analyst Day 2010 75
Net Financial Debt improved to 48 m€ in September 2010
280 m€
137 m€
Net Debt142 m€
272 m€
224 m€
Net Debt48 m€
Dec 31, 2009 Sep 30, 2010
Principle structure of new quarterly report
35
53
66
151149
65
2012
89121
109
27
17
Financialliabilities
Financialassets
Financialliabilities
Financialassets
Derivative financialassets
Short-term financialsecurities
Cash and cashequivalents
Derivative financialliabilities
Other financialliabilities
Promissory notes
Convertible bond
Financial assets
Financial liabilities

November 9, 2010 Investor and Analyst Day 2010 76
Agenda
• Business Highlights
• Financial Highlights
• Segment Reporting
• Group Key Figures
• Guidance
• Appendix
Principle structure of new quarterly report

November 9, 2010 Investor and Analyst Day 2010 77
Guidance 2010 confirmed
~310292EBIT adj.
stable
~120
stable
~2,750
Guidance 2010
141Net income
2,611Revenues
120Free cash flow
11.2%EBIT adj. margin
FY 2009(in m€)
Reflects new exchange rate assumption of 1.30 $/€
Principle structure of new quarterly report

November 9, 2010 Investor and Analyst Day 2010 78
Q&A
Summary and Wrap-upReiner Winkler, CFO

November 9, 2010 Investor and Analyst Day 2010 80
Cautionary Note Regarding Forward-Looking StatementsCertain of the statements contained herein may be statements of future expectations and other forward-looking statements that are
based on management’s current views and assumptions and involve known and unknown risks and uncertainties that could causeactual results, performance or events to differ materially from those expressed or implied in such statements. In addition tostatements that are forward-looking by reason of context, the words “may,” “will,” “should,” “expect,” “plan,” “intend,” “anticipate,”“forecast,” “believe,” “estimate,” “predict,” “potential,” or “continue” and similar expressions identify forward-looking statements.
Actual results, performance or events may differ materially from those in such statements due to, without limitation, (i) competitionfrom other companies in MTU’s industry and MTU’s ability to retain or increase its market share, (ii) MTU’s reliance on certaincustomers for its sales, (iii) risks related to MTU’s participation in consortia and risk and revenue sharing agreements for new aeroengine programs, (iv) the impact of non-compete provisions included in certain of MTU’s contracts, (v) the impact of a decline inGerman or other European defense budgets or changes in funding priorities for military aircraft, (vi) risks associated with governmentfunding, (vii) the impact of significant disruptions in MTU’s supply from key vendors, (viii) the continued success of MTU’s researchand development initiatives, (ix) currency exchange rate fluctuations, (x) changes in tax legislation, (xi) the impact of any productliability claims, (xii) MTU’s ability to comply with regulations affecting its business and its ability to respond to changes in theregulatory environment, (xiii) the cyclicality of the airline industry and the current financial difficulties of commercial airlines, (xiv) oursubstantial leverage and (xv) general local and global economic conditions. Many of these factors may be more likely to occur, ormore pronounced, as a result of terrorist activities and their consequences.
The company assumes no obligation to update any forward-looking statement.
Any securities referred to herein have not been and will not be registered under the U.S. Securities Act of 1933, as amended (the“Securities Act”), and may not be offered or sold without registration thereunder or pursuant to an available exemption therefrom. Anypublic offering of securities of MTU Aero Engines to be made in the United States would have to be made by means of a prospectusthat would be obtainable from MTU Aero Engines and would contain detailed information about the issuer of the securities and itsmanagement, as well as financial statements.
Neither this document nor the information contained herein constitutes an offer to sell or the solicitation of an offer to buy anysecurities.
These materials do not constitute an offer of securities for sale in the United States; the securities may not be offered or sold in theUnited States absent registration or an exemption from registration.
No money, securities or other consideration is being solicited, and, if sent in response to the information contained herein, will notbe accepted.


