
i
INVESTIGATION ON THE APPLICATION OF NATURAL FIBER
(KATCHA) AS A WEAK
SUBGRADE SOIL REINFORCEMENT BLENDED WITH SAND:
IN CASE OF KOYEFECHE PROJECT 18 ROAD PROJECT
By
Bethel Getamesay Girma
A Thesis Submitted to the department of Civil Engineering,
School of Civil Engineering and Architecture
Presented in Partial Fulfillment of the Requirement for the Degree of Master’s in
Civil Engineering (Specialization in Geotechnical Engineering)
Office of Graduate Studies
Adama Science and Technology University
July, 2021
Adama Ethiopia

i
INVESTIGATION ON THE APPLICATION OF NATURAL FIBER
(KATCHA) AS A WEAK
SUBGRADE SOIL REINFORCEMENT BLENDED WITH SAND:
IN CASE OF KOYEFECHE PROJECT 18 ROAD PROJECT
By
Bethel Getamesay Girma
Advisor: Argaw Asha (Ph.D.)
A Thesis Submitted to the department of Civil Engineering,
School of Civil Engineering and Architecture
Presented in Partial Fulfillment of the Requirement for the Degree of Master’s in
Civil Engineering (Specialization in Geotechnical Engineering)
Office of Graduate Studies
Adama Science and Technology University
July, 2021
Adama Ethiopia

Investigation on the Application of Katcha Fiber as a Weak Subgrade Soil Reinforcement
Blended with Sand: In case of Koyefeche Project 18 Road Project
i ASTU M.Sc. Geotechnical Engineering July 2021
DECLARATION
I, hereby declare that this Master Thesis entitled “Investigation on the Application of Natural
fiber (Katcha) as a Weak Subgrade Soil Reinforcement Blended with Sand: In Case of
Koyefeche Project 18 Road Project” is my original work and has not been submitted for the
award of any academic degree in any other university. All sources of materials that are used for
this thesis have also been duly acknowledged.
Bethel Getamesay Girma ______________________ _______________
Name of the student Signature Date

Investigation on the Application of Katcha Fiber as a Weak Subgrade Soil Reinforcement
Blended with Sand: In case of Koyefeche Project 18 Road Project
i ASTU M.Sc. Geotechnical Engineering July 2021
Recommendation
I, the advisor of this thesis, hereby certify that I have read the revised version of the thesis
entitled “Investigation on the Application of Natural fiber (Katcha) as a Weak Subgrade Soil
Reinforcement Blended with Sand: In Case of Koyefeche Project 18 Road Project” prepared
under my guidance by Bethel Getamesay Girma submitted in partial fulfillment of the
requirements for the degree of Masters of Science in Civil Engineering (Specialization in
Geotechnical Engineering). Therefore, I recommend the submission of revised version of the
thesis to the department following the applicable procedures.
Argaw Asha (Ph.D.) ______________________ _______________
Advisor Signature Date

Investigation on the Application of Katcha Fiber as a Weak Subgrade Soil Reinforcement
Blended with Sand: In case of Koyefeche Project 18 Road Project
i ASTU M.Sc. Geotechnical Engineering July 2021
Approval Sheet
I, the advisors of the thesis entitled “Investigation on the Application of Natural fiber (Katcha)
as a Weak Subgrade Soil Reinforcement Blended with Sand: In Case of Koyefeche Project 18
Road Project” and developed by Bethel Getamesay Girma, hereby certify that the
recommendation and suggestions made by the board of examiners are appropriately
incorporated into the final version of the thesis.
Argaw Asha (Ph.D.) ______________________ _______________
Advisor Signature Date
We, the undersigned, members of the Board of Examiners of the thesis by Bethel Getamesay
Girma have read and evaluated the thesis entitled “Investigation on the Application of Natural
fiber (Katcha) as a Weak Subgrade Soil Reinforcement Blended with Sand: In Case of
Koyefeche Project 18 Road Project” and examined the candidate during open defense. This is,
therefore, to certify that the thesis is accepted for partial fulfillment of the requirement of the
degree of Master of Science in Geotechnical Engineering.
Yadeta Chemdesa (Ph.D.) __________________ _______________
Chairperson Signature Date
Endalu Tadele (Ph.D.) __________________ _______________
External Examiner Signature Date
Srikanth Vadlamudi (Ph.D.) __________________ _______________
Internal Examiner Signature Date
Finally, approval and acceptance of the thesis is contingent upon submission of its final copy to
the Office of Postgraduate Studies (OPGS) through the Department Graduate Council (DGC)
and School Graduate Committee (SGC).
__________________ _______________ ________________
Department Head Signature Date
__________________ _______________ ________________
School Dean Signature Date
__________________ _______________ ________________
Office of Postgraduate Studies, Dean Signature Date

Investigation on the Application of Katcha Fiber as a Weak Subgrade Soil Reinforcement
Blended with Sand: In case of Koyefeche Project 18 Road Project
i ASTU M.Sc. Geotechnical Engineering July 2021
ACKNOWLEDGEMENT
First of all, I would like to thank God for endowing me the courage, strength and health in order
to finish this research.
I gratefully acknowledge Adama Science and Technology University for providing the
scholarship opportunity.
I also want to extend my sincere appreciation to my advisor Dr. Argaw Asha for his valuable
advice, and critical comments from the beginning to the end of the thesis. Besides my advisor
I am thankful for all instructors who were helping me with a supportive idea and advices
specially Mr. Gemechis.
I would like to extend my deepest gratitude to all Ethiopian Construction Design and
Supervision Works Corporation soil laboratory staffs, Mr. Biruk Abdi, Mr. Alelign Asefa, Mr.
Mamueshet Hailu and Mr.Getu Dabi, for their encouragement and support, MELCON
construction, Engineer Workineh for his support during site investigation and sample taking
process and Ethiopian Conformity Assessment Enterprise, Mr. Ashenafi for his cooperation and
guidance during laboratory test program.
Last but not the least, my special thank goes to my family for the support and encouragement
which helped me in completion of this paper. My beloved brother, Mr. Endale who is always
by my side when times I needed him most.

Investigation on the Application of Katcha Fiber as a Weak Subgrade Soil Reinforcement
Blended with Sand: In case of Koyefeche Project 18 Road Project
ii ASTU M.Sc. Geotechnical Engineering July 2021
TABLE OF CONTENTS
ACKNOWLEDGEMENT ........................................................................................................... i
LIST OF TABLES.................................................................................................................... vii
LIST OF FIGURES .................................................................................................................... x
LIST OF ACRONYMS AND ABBREVIATION .................................................................. xiii
ABSTRACT ............................................................................................................................ xiv
CHAPTER ONE ......................................................................................................................... 1
INTRODUCTION ...................................................................................................................... 1
1.1. Background ...................................................................................................................... 1
1.2. Statement of the Problem ................................................................................................. 2
1.3. Objectives ........................................................................................................................ 3
1.3.1. General Objective ...................................................................................................... 3
1.3.2. Specific Objectives .................................................................................................... 3
1.4. Research Questions .......................................................................................................... 3
1.5. Significance of the Study ................................................................................................. 3
1.6. Scope and Limitation of the study ................................................................................... 4
1.7. Structure of the study ....................................................................................................... 4
CHAPTER TWO ........................................................................................................................ 5
LITERATURE REVIEW ........................................................................................................... 5
2.1. Origin and Formation of Residual Soils .......................................................................... 5
2.2. Soil Classification ............................................................................................................ 6
2.2.1. AASHTO Classification System ............................................................................... 6
2.2.2. Unified Soil Classification System (USCS) .............................................................. 7
2.3. Soil Stabilization .............................................................................................................. 8
2.3.1 Soil Reinforcement ..................................................................................................... 8

Investigation on the Application of Katcha Fiber as a Weak Subgrade Soil Reinforcement
Blended with Sand: In case of Koyefeche Project 18 Road Project
iii ASTU M.Sc. Geotechnical Engineering July 2021
2.3.2. Synthetic Fibers ......................................................................................................... 9
2.3.3. Natural Fibers .......................................................................................................... 10
2.3.3.1. Katcha Fiber ..................................................................................................... 10
2.4. Properties of Natural Fiber............................................................................................. 11
2.4.1. Biochemical Properties of Natural Fiber ................................................................. 11
2.4.2. Fiber Degradation and Treatment ........................................................................ 14
2.5. Soil Reinforcement Method ....................................................................................... 15
2.5.1. Random Inclusion ................................................................................................... 15
2.5.2. Systematic/Planar Inclusion .................................................................................... 16
2.6. Potential Applications of Fiber-Reinforcement ......................................................... 17
2.7. Previous works ............................................................................................................... 17
2.7.1. Banana Fiber ........................................................................................................... 17
2.7.2. Coir Fiber ................................................................................................................ 18
2.7.3. Jute Fiber ................................................................................................................. 19
2.7.4. Katcha Fiber ............................................................................................................ 19
2.7.5. Sisal Fiber ................................................................................................................ 20
2.8. Soil Stabilization by Using Natural Sand ...................................................................... 20
2.8.1. Properties of Natural Sand ...................................................................................... 20
2.8.2. Sand as a Soil Stabilizer .......................................................................................... 20
2.9. Summary of Literature Review ...................................................................................... 23
CHAPTER THREE .................................................................................................................. 26
MATERIALS AND METHODS ............................................................................................. 26
3.1. Introduction .................................................................................................................... 26
3.2. Description of the Study Area ........................................................................................ 26
3.3. Study Design .................................................................................................................. 28

Investigation on the Application of Katcha Fiber as a Weak Subgrade Soil Reinforcement
Blended with Sand: In case of Koyefeche Project 18 Road Project
iv ASTU M.Sc. Geotechnical Engineering July 2021
3.4. Materials ........................................................................................................................ 28
3.4.1. Soil .......................................................................................................................... 28
3.4.2. Natural Sand ............................................................................................................ 29
3.4.3. Katcha Fiber ............................................................................................................ 29
3.4.3.1. Katcha Fiber Preparation .................................................................................. 29
3.4.4. Kerosene .................................................................................................................. 30
3.5. Test Programs ................................................................................................................ 30
3.6. Methods.......................................................................................................................... 32
3.6.1. Sample Preparation ................................................................................................. 33
3.6.2. Moisture Content ..................................................................................................... 33
3.6.3. Specific Gravity ....................................................................................................... 34
3.6.4. Particle Size Distribution ........................................................................................ 34
3.6.5. Atterberg Limits Test .............................................................................................. 35
3.6.6. Soil Classification ................................................................................................... 36
3.6.7. Determination of Volumetric Shrinkages ............................................................... 36
3.6.8. Compaction Test ..................................................................................................... 36
3.6.9. California Bearing Ratio Test ................................................................................. 37
3.6.10. Unconfined Compressive Strength Test ................................................................ 39
3.6.11. Water Absorption Capacity Test of Katcha Fiber ................................................. 40
3.6.12. Tensile Strength Test of Katcha Fiber ................................................................... 40
CHAPTER FOUR .................................................................................................................... 42
RESULTS AND DISCUSSIONS ............................................................................................ 42
4.1. Introduction .................................................................................................................... 42
4.2. Properties of Natural soils .............................................................................................. 42
4.3. Properties of Sand .......................................................................................................... 44

Investigation on the Application of Katcha Fiber as a Weak Subgrade Soil Reinforcement
Blended with Sand: In case of Koyefeche Project 18 Road Project
v ASTU M.Sc. Geotechnical Engineering July 2021
4.4. Properties of Katcha Fiber ............................................................................................. 45
4.4.1. Effect of Kerosene on Water Absorption Capacity of Katcha Fiber ....................... 45
4.5. Effect of sand on Index property of soil ........................................................................ 47
4.5.1. Effect of Sand on Particle Size Distribution of Soil................................................ 47
4.5.2. Effect of Sand on Atterberg Limits ......................................................................... 49
4.5.3. Effect of Sand on Specific Gravity of Soil .............................................................. 50
4.5.4. Effect of Sand on Volumetric Shrinkage ................................................................ 51
4.6. Effect of Katcha fiber on Soil Property ......................................................................... 52
4.6.1. Effect of Katcha fiber on Compaction Characteristics of Soil ................................ 52
4.6.2. Effect of Katcha fiber on CBR and Percent Swell of Soil ...................................... 55
4.7. Effect of Sand on Reinforced Soil ................................................................................. 57
4.7.1. Effect of Sand on Compaction Characteristic of Reinforced Soil .......................... 58
4.7.2. Effect of Sand on CBR value of Reinforced Soil .................................................... 59
4.7.2.1. Effect of Sand Mixing on CBR value of Reinforced soil ................................. 59
4.7.2.2. Effect of Introducing Sand Layer to the Reinforced soil .................................. 61
4.8. Unconfined Compressive Strength Test ........................................................................ 62
4.9. Subgrade Construction Cost .......................................................................................... 64
5. CONCLUSIONS AND RECOMMENDATIONS ............................................................... 66
5.1. Conclusions .................................................................................................................... 66
5.2. Recommendations .......................................................................................................... 67
SPECIAL ACKNOWLEDGEMENT....................................................................................... 69
REFERENCE ........................................................................................................................... 70
APPENDICES .......................................................................................................................... 75
Appendix-A .............................................................................................................................. 76
Test Results of Natural Soils .................................................................................................... 76

Investigation on the Application of Katcha Fiber as a Weak Subgrade Soil Reinforcement
Blended with Sand: In case of Koyefeche Project 18 Road Project
vi ASTU M.Sc. Geotechnical Engineering July 2021
Appendix-B .............................................................................................................................. 86
Test Results of Sand ................................................................................................................. 86
Appendix-C .............................................................................................................................. 89
Test Results of Katcha fiber ..................................................................................................... 89
Appendix- D ............................................................................................................................. 93
Index Property of Sand Mixed soil ........................................................................................... 93
Appendix E ............................................................................................................................. 102
Moisture-Density Relation of Reinforced Soil and Reinforced Sand mixed soil ................... 102
Appendix-F ............................................................................................................................. 115
California Bearing Ratio (CBR) Test Results ........................................................................ 115
APPENDEX G ....................................................................................................................... 132
Unconfined Compressive Strength (UCS) Test Results ......................................................... 132

Investigation on the Application of Katcha Fiber as a Weak Subgrade Soil Reinforcement
Blended with Sand: In case of Koyefeche Project 18 Road Project
vii ASTU M.Sc. Geotechnical Engineering July 2021
LIST OF TABLES
Table 2.1. AASHTO Classification of Soils and Soil-Aggregate (ASTM-D3282, 1997) ......... 7
Table 2.2. Biochemical compositions and Tensile strength of plant fibers .............................. 13
Table 2.3. Biochemical composition of Katcha fiber and their implication ............................. 14
Table 2.4. Summary of related works on natural fiber ............................................................. 24
Table 2.5. Summary of related works on sand as stabilizer ..................................................... 25
Table 3.1. Katcha fiber used for soil reinforcement. ................................................................ 31
Table 3.2. Katcha fiber and Sand used for soil stabilization. ................................................... 32
Table 4.1. Properties of Natural Soils ....................................................................................... 42
Table 4.2. Water Absorption Capacity of Kerosene coated and uncoated Katcha fiber .......... 46
Table 4.4. Physical and Tensile properties of Katcha Fibers ................................................... 47
Table 4.5. Percent Gravel, Sand and Fines of Soil + Sand ....................................................... 48
Table 4.6. Atterberg Limits of the studied mixtures................................................................. 49
Table 4.7. The specific gravity of the studied soils and soil sand mix ..................................... 50
Table 4.8. Volumetric shrinkage test results for soil and soil-sand mix .................................. 51
Table 4.9. Compaction property of Soil and Reinforced soil sample....................................... 53
Table 4.10. Summary of MDD and OMC Property of reinforced soil ..................................... 54
Table 4.11. CBR and Percent Swell values of the reinforced and unreinforced soil ............... 57
Table 4.12. CBR value of Soil and Reinforced (1% and 35mm) soil mixed with sand ........... 60
Table 4.13. Sand layer position and CBR value of a reinforced soil ....................................... 61
Table 4.14. Summary of UCS, shear strength (Cu) and Percent increase in UCS value ......... 63
Table 4.15. Construction cost of subgrade by removal and replacement method .................... 64
Table 4.16 Construction cost of subgrade by stabilization method .......................................... 65
Table 4.17. Total cost comparison of subgrade construction ................................................... 65
Table A-1 Natural Moisture Content of soil sample 1(pit 1) and soil sample 2(pit 2) ............. 77
Table A-2 Specific Gravity of Soil Sample1 (Pit1) and Soil Sample 2(pit 2).......................... 77
Table A-3 Grain Size Analysis of soil sample 1(pit 1) ............................................................. 77
Table A-4 Grain Size Analysis of soil sample 2 (pit 2) ............................................................ 78
Table A-5 Liquid Limit and Plastic Limit test of Soil Sample 1(pit1) ..................................... 80
Table A-6 Liquid limit and Plastic Limit test of Soil Sample 2 (pit 2) .................................... 81
Table A-7 Compaction property of Soil Sample 1 (pit1) ......................................................... 82
Investigation on the Application of Katcha Fiber as a Weak Subgrade Soil Reinforcement
Blended with Sand: In case of Koyefeche Project 18 Road Project
viii ASTU M.Sc. Geotechnical Engineering July 2021
Table A-8 Compaction property of Soil Sample 2 (pit 2) ........................................................ 83
Table A-9 California Bearing Ratio (CBR) of soil sample 1(pit 1) ......................................... 84
Table A-10 California Bearing Ratio (CBR) of soil sample 2 (pit 2) ...................................... 85
Table B-1 Specific Gravity of sand .......................................................................................... 87
Table B-2 Dry sieve analysis of Sand ...................................................................................... 87
Table B-3 Atterberg Limit of sand ........................................................................................... 88
Table C-1 Specific Gravity of Kerosene Coated and uncoated Katcha Fiber .......................... 90
Table C-2 Moisture Regain of Katcha fiber ............................................................................. 90
Table C-3 Moisture content of Katcha fiber ............................................................................. 90
Table C- 4 Water Absorption test of Kerosene Coated and Uncoated 20 mm Katcha fiber .... 90
Table C-5 Tensile Strength test data ......................................................................................... 91
Table C-6 Tensile strength test of single strand uncoated Katcha fiber ................................... 91
Table C-7 Tensile strength test of single strand of kerosene coated Katcha fiber ................... 91
Table C-8 Tensile strength test on bundles of Kerosene Uncoated Katcha fiber ..................... 92
Table C-9 Tensile strength test on bundles of Kerosene Coated Katcha fiber ......................... 92
Table D-1Specific gravity of Soil Sample1 (Pit1) with 10%, 15% and 20% sand .................. 94
Table D-2 Grain Size Analysis of soil sample 1(pit 1) with 10% sand .................................... 94
Table D-3 Grain Size Analysis of soil sample 1(pit 1) with 15% sand .................................... 95
Table D-4 Grain Size Analysis of soil sample 1(pit 1) with 20% sand .................................... 96
Table D-5 Liquid Limit and Plastic Limit of Pit 1 Soil with 10% sand ................................... 98
Table D-6 Liquid Limit and Plastic Limit of pit 1Soil with 15% sand .................................... 99
Table D-7 Liquid Limit and Plastic Limit pit 1 Soil with 20% sand ...................................... 100
Table D-8 Volumetric Shrinkage of Pit 1 Soil with 0%, 10% 15%, and 20% sand ............... 101
Table E-1 Moisture-Density relations of Reinforced Soil with 0.5% of 20mm fiber ............ 103
Table E-2 Moisture-Density relations of Reinforced Soil with 0.5% of 35mm fiber ............ 104
Table E-3 Moisture-Density relations of Reinforced Soil with 0.5% of 50mm fiber ............ 105
Table E-4 Moisture-Density relations of Reinforced Soil with 1% of 20mm fiber ............... 106
Table E-5 Moisture-Density relations of Reinforced Soil with 1% of 35mm fiber ............... 107
Table E-6 Moisture-Density relations of Reinforced Soil with 1% of 50mm fiber ............... 108
Table E-7 Moisture-Density relations of Reinforced Soil with 1.5% of 20mm fiber ............ 109
Table E-8 Moisture-Density relations of Reinforced Soil with 1.5% of 35mm fiber ............ 110

Investigation on the Application of Katcha Fiber as a Weak Subgrade Soil Reinforcement
Blended with Sand: In case of Koyefeche Project 18 Road Project
ix ASTU M.Sc. Geotechnical Engineering July 2021
Table E-9 Moisture-Density relations of Reinforced Soil with 1.5% of 50mm fiber ............ 111
Table E-10 Moisture-Density relations of Stabilized Soil with 1% of 35mm +10% Sand .... 112
Table E-11 Moisture-Density relations of Stabilized Soil with 1% of 35mm +15% Sand .... 113
Table E-12 Moisture-Density relations of Stabilized Soil with 1% of 35mm +20% Sand .... 114
Table F-1 CBR Test Data ....................................................................................................... 116
Table F-2 CBR and Swell of Reinforced Soil with 0.5% of 20mm fiber ............................... 117
Table F-3 CBR and Swell of Reinforced Soil with 0.5% of 35mm fiber ............................... 118
Table F-4 CBR and Swell of Reinforced Soil with 0.5% of 50mm fiber ............................... 119
Table F-5 CBR and Swell of Reinforced Soil with 1% of 20mm fiber .................................. 120
Table F-6 CBR and Swell of Reinforced Soil with 1% of 35 mm fiber ................................. 121
Table F-7 CBR and Swell of Reinforced Soil with 1% of 50 mm fiber ................................. 122
Table F-8 CBR and Swell of Reinforced Soil with 1.5% of 20 mm fiber .............................. 123
Table F-9 CBR and Swell of Reinforced Soil with 1.5% of 35 mm fiber .............................. 124
Table F-10 CBR and Swell of Reinforced Soil with 1.5% of 50 mm fiber............................ 125
Table F-11 CBR and Swell of Stabilized Soil with 1% of 35 mm fiber+ 10% sand ............. 126
Table F-12 CBR and Swell of Stabilized Soil with 1% of 35 mm fiber+15% Sand .............. 127
Table F-13 CBR and Swell of Stabilized Soil with 1% of 35 mm fiber+20% Sand .............. 128
Table F-14 CBR and Swell of Stabilized Soil with 1% of 35 mm fiber+ 1st sand layer ........ 129
Table F-15 CBR and Swell of Stabilized Soil with 1% of 35 mm fiber+ 2nd sand layer ....... 130
Table F-16 CBR and Swell of Stabilized Soil with 1% of 35 mm fiber+ 3rd sand layer........ 131
Table G-1 UCS test data ......................................................................................................... 133
Table G-2 UCS of Soil Sample 1(pit 1) ................................................................................. 134
Table G-3 UCS of Reinforced Soil by 1%, 35mm Katcha fiber ............................................ 135
Table G- 4 UCS of Reinforced Soil by 1%, 35mm Katcha fiber blended with 20% sand ..... 137

Investigation on the Application of Katcha Fiber as a Weak Subgrade Soil Reinforcement
Blended with Sand: In case of Koyefeche Project 18 Road Project
x ASTU M.Sc. Geotechnical Engineering July 2021
LIST OF FIGURES
Figure 2.1. USCS plasticity chart (ASTM-D2487, 1985) .......................................................... 8
Figure 2.3. Photographic view of; (a) Enset Plant and (b) Katcha Fiber ................................. 10
Figure 2.4. Fibril matrix structure of plant fiber and the chemical composition of (a) Cellulose;
(b) Hemicellulose; and (c) Lignin (Gowthaman et al., 2018) .................................................. 12
Figure 2.2. Fiber reinforcement mechanism of soil; (a) Systematic/Planer inclusion; (b)
Random inclusion (Gowthaman et al., 2018) ........................................................................... 16
Figure 3.1. Study area (a) map of the study area and (b) Satellite view of the study area ....... 27
Figure 3.2. Photographic view of (a) Pit excavation and (b) Disturbed soil sample ................ 29
Figure 3.3. Photographic view of (a) Katcha fiber soaking; (b) Air dried Kerosene soaked
Katcha fiber and (c) 35 mm length Katcha fiber and Sand. ..................................................... 30
Figure 3.4. Photographic view of one of the position of sandy layer in compaction mould. ... 32
Figure 3.5. Photographic view of (a) dry mix of clay soil and Katcha fiber; (b) preparation of
soil-fiber– sand mix, (c) mix preparation for compaction test (d) remold soil sample of
reinforced soil. .......................................................................................................................... 37
Figure 3.6. photographic view of (a) Soaked CBR and (b) CBR Reading .............................. 38
Figure 3.7. The photographic view of (a) pure soil; (b) 1% and 35 mm reinforced soil and (c)
reinforced soil with 20% sand .................................................................................................. 39
Figure 3.8. Water Absorption test of Katcha fiber of (a) 20 mm (b) 35 and 50 mm length..... 40
Figure 3.9. Photographic view of tensile strength test of Katcha fiber (a) 600 mm length, (b)
200 mm length Katcha fiber and (c) 200 mm length single strand Katcha fiber ..................... 41
Figure 4.1. Grain size distribution curve of Natural Soils ........................................................ 43
Figure 4.2. Grain size distribution curve of sand ..................................................................... 44
Figure 4.3. Effect of Kerosene Soaking on Water Absorption Capacity of Katcha Fiber ....... 46
Figure 4.4. Grain size distribution curve of the natural soils and soil-sand mix ...................... 48
Figure 4.5. Atterberg limits of Soil mixtures with varying sand content. ................................ 49
Figure 4.6. The Casagrande plasticity chart of soil and Sand mixed soils ............................... 50
Figure 4.7. Variation in shrinkage limit of soil with varying amounts of sand ........................ 51
Figure 4.8. Combined compaction curve of soil and reinforced soil ....................................... 52
Figure 4.9. Effect of fiber content on (a) MDD; and (b) OMC of reinforced soil ................... 53
Figure 4.10. Effect of Katcha fiber length on (a) MDD; and (b) OMC of reinforced soil ....... 54

Investigation on the Application of Katcha Fiber as a Weak Subgrade Soil Reinforcement
Blended with Sand: In case of Koyefeche Project 18 Road Project
xi ASTU M.Sc. Geotechnical Engineering July 2021
Figure 4.11. Load Versus Penetration Curve of Unreinforced and Reinforced soil samples ... 55
Figure 4.12. CBR of reinforced soil with respect to (a) fiber length and (b) fiber content ...... 56
Figure 4.13. Percent swell values of reinforced soil (a) fiber content and (b) fiber length ..... 56
Figure 4.14. Combined compaction curve of Soil and Stabilized Soils ................................... 58
Figure 4.15. Effect of Sand mixing on (a) MDD and (b) OMC of reinforced soil .................. 58
Figure 4.16. Load Versus Penetration graph of soil and stabilized soil ................................... 59
Figure 4.17. Variation in CBR of reinforced soil with varying amounts of sand .................... 60
Figure 4.18. Load versus Penetration curve of the sand layer on reinforced soil sample ........ 61
Figure 4.19. Stress-Strain curve of Soil and Stabilized soil ..................................................... 62
Figure 4.20. UCS and Shear strength of soil, Reinforced soil and Reinforced soil +20% sand
.................................................................................................................................................. 63
Figure A-1 Particle size distribution curve of pit 1 and Pit 2 soil sample ............................... 80
Figure A-2 Liquid Limit determination of soil sample 1(Pit 1) ............................................... 81
Figure A-3 Liquid Limit determination of soil sample 2 (Pit 2) .............................................. 81
Figure A-4 Compaction Curve of soil sample 1(Pit 1) ............................................................. 82
Figure A-5 Compaction Curve of soil sample 2 (Pit 2) ............................................................ 83
Figure A-6 Load versus Penetration curve of soil sample 1 (pit 1) .......................................... 84
Figure A-7 Load versus Penetration curve of soil sample 2(pit 2). .......................................... 85
Figure B-1 Particle Size Distribution Curve of Sand ............................................................... 88
Figure B-2 Liquid Limit determination of sand ....................................................................... 88
Figure D-1 Particle size distribution curve of Pit 1 soil with 10%, 15% and 20% sand .......... 97
Figure D-2 Liquid limit determination of Pit 1 Soil with 10% Sand ....................................... 98
Figure D-3 Liquid Limit determination of Pit 1) Soil with 15% Sand ..................................... 99
Figure D- 4 Liquid Limit determination of Pit 1 Soil with 20% Sand. .................................. 100
Figure E-1 Compaction Curve of Reinforced Soil with 0.5% of 20mm fiber ........................ 103
Figure E-2 Compaction Curve of Reinforced Soil with 0.5% of 35mm fiber ........................ 104
Figure E-3 Compaction Curve of Reinforced Soil with 0.5% of 50mm fiber ........................ 105
Figure E-4 Compaction Curve of Reinforced Soil with 1% of 20mm fiber ........................... 106
Figure E-5 Compaction Curve of Reinforced Soil with 1% of 35mm fiber ........................... 107
Figure E-6 Compaction Curve of Reinforced Soil with 1% of 50mm fiber ........................... 108
Figure E-7 Compaction Curve of Reinforced Soil with 1.5% of 20mm fiber ........................ 109

Investigation on the Application of Katcha Fiber as a Weak Subgrade Soil Reinforcement
Blended with Sand: In case of Koyefeche Project 18 Road Project
xii ASTU M.Sc. Geotechnical Engineering July 2021
Figure E-8 Compaction Curve of Reinforced Soil with 1.5% of 35mm fiber ........................ 110
Figure E-9 Compaction Curve of Reinforced Soil with 1.5% of 50mm fiber ........................ 111
Figure E-10 Compaction Curve of Reinforced Soil with 1% of 35mm+10% Sand............... 112
Figure E-11 Compaction Curve of Reinforced Soil with 1% of 35mm+15% Sand............... 113
Figure E-12 Compaction Curve of Reinforced Soil with 1% of 35mm+20% Sand............... 114
Figure F-1 Load versus Penetration curve of Reinforced soil with 0.5% of 20mm fiber ...... 117
Figure F-2 Load versus Penetration curve of Reinforced soil with 0.5% of 35mm fiber ...... 118
Figure F-3 Load versus Penetration curve of Reinforced soil with 0.5% of 50mm fiber ...... 119
Figure F-4 Load versus Penetration curve of Reinforced soil with 1% of 20mm fiber ......... 120
Figure F-5 Load versus Penetration curve of Reinforced soil with 1% of 35 mm fiber ........ 121
Figure F-6 Load versus Penetration curve of Reinforced soil with 1% of 50 mm fiber ........ 122
Figure F-7 Load versus Penetration curve of Reinforced soil with 1.5% of 20 mm fiber ..... 123
Figure F-8 Load versus Penetration curve of Reinforced soil with 1.5% of 35 mm fiber ..... 124
Figure F-9 Load versus Penetration curve of Reinforced soil with 1.5% of 50 mm fiber ..... 125
Figure F-10 Load versus Penetration curve of Stabilized Soil with 1% of 35mm fiber +10%
Sand ........................................................................................................................................ 126
Figure F-11 Load versus Penetration curve of Stabilized Soil with 1% of 35mm fiber +15%
sand ......................................................................................................................................... 127
Figure F-12 Load versus Penetration curve of Stabilized Soil with 1% of 35mm fiber +20%
Sand ........................................................................................................................................ 128
Figure F-13 Load versus Penetration curve of Stabilized Soil with 1% of 35mm fiber+1st sand
layer ........................................................................................................................................ 129
Figure F-14 Load versus Penetration curve of Stabilized Soil with 1% of 35mm fiber+2nd
Sand layer ............................................................................................................................... 130
Figure F-15 Load versus Penetration curve of Stabilized Soil with 1% of 35mm fiber+3rd sand
layer ........................................................................................................................................ 131
Figure G-1 Stress-strain curve of the natural soil Sample 1(pit 1) ......................................... 135
Figure G-2 Stress-Strain curve of Reinforced Soil by 1%, 35mm Katcha fiber .................... 137
Figure G-3 Stress-Strain curve of Reinforced Soil by 1%, 35mm Katcha fiber + 20% sand 139

Investigation on the Application of Katcha Fiber as a Weak Subgrade Soil Reinforcement
Blended with Sand: In case of Koyefeche Project 18 Road Project
xiii ASTU M.Sc. Geotechnical Engineering July 2021
LIST OF ACRONYMS AND ABBREVIATION
AASHTO American Association of States Highways and Transport Official;
ASTM American Society for Testing Material;
CBR California Bearing Ratio;
ERA Ethiopian Road Authority;
g gram;
GI Group Index;
gm/cm3 Gram per Centimeter Cube;
Gs Specific Gravity;
Kpa Kilopascal;
LL Liquid Limit;
MDD Maximum Dry Density;
mm Millimeter;
NMC Natural Moisture Content;
OMC Optimum Moisture Content;
PI Plasticity Index;
PL Plastic Limit;
UCS Unconfined Compressive Strength;
USCS Unified Soil Classification System;
WAC Water Absorption Capacity, and
Wt Weight.

Investigation on the Application of Katcha Fiber as a Weak Subgrade Soil Reinforcement
Blended with Sand: In case of Koyefeche Project 18 Road Project
xiv ASTU M.Sc. Geotechnical Engineering July 2021
ABSTRACT The performance and quality of pavement are highly affected by the subgrade property.
Sometimes subgrades might be very weak to support the traffic loading, facing of such a soil is
probable in many parts of Ethiopia. The road project in Koyefeche project 18 faces weak
subgrade soil, which required external backfill material resulted the delay of project, additional
cost and reduction of natural resource. Soil reinforcement is one way of improving the strength
of a soil by using different type of natural fibers. Ethiopia is reach in both natural fiber and
sand. However, few works have been conducted to investigate the effect of using natural fibers
and sand on the properties of subgrade soil. Therefore the main aim of this thesis is to
investigate the effect of randomly oriented Katcha fiber and sand on weak subgrade soil
properties. Katcha fiber was first treated with kerosene and water absorption test were
conducted on kerosene coated and uncoated fiber to determine the fiber with lower water
absorption capacity; Kerosene-coated Katcha fiber gave lower water absorption than that of
uncoated one. Therefore Kerosene-coated Katcha fiber and Sand were two materials utilized in
this thesis. The Katcha fiber was mixed to the clay soil in 0.5%, 1% and 1.5% by dry weight of
the soil for 20mm, 35mm and 50mm length of each percent, and 10%, 15%, and 20% sand was
mixed by dry weight of the soil. Gradation, Consistency, Volumetric Shrinkage, Compaction,
California Bearing Ratio (CBR), and Unconfined Compressive Strength (UCS) properties are
particularly investigated. The analysis results showed that mixing of sand reduce the percent of
fine, plasticity index and shrinkage limit of the soil and mixing of Katcha fiber showed
significant change in Compaction, CBR and UCS of the clay soil. Test results indicate that the
MDD decrease, OMC and CBR increases with the increase in fiber length and percent. The
increase in CBR value is substantial at 1%, 35 mm length Katcha fiber. It was also observed
that mixing sand further decreases the OMC and increases the MDD and CBR value of soil,
this increment is considerable at 20% sand content. The application of 1% and 35mm Katcha
fiber increased the CBR by 189%, UCS by 59.76%, and a further increase in CBR by 240.91%
and UCS by 25.41% was obtained at 20% sand content and introducing sand as layer increased
the CBR value by 295.45%. Thus using of Katcha fiber and sand mixing and sand layer is found
to be an effective materials to improve the subgrade soil properties.
Keywords: Soil reinforcement, Katcha fiber, Sand, Kerosene, Weak Subgrade

Investigation on the Application of Katcha Fiber as a Weak Subgrade Soil Reinforcement
Blended with Sand: In case of Koyefeche Project 18 Road Project
1 ASTU M.Sc. Geotechnical Engineering July 2021
CHAPTER ONE
INTRODUCTION
1.1. Background
The stability of any structure including road depends on the strength properties of underground
soil on which it is constructed. The performance and pavement thickness of a road depends on
the properties of subgrade material including strength, drainage, ease of compaction and low
compressibility. Usually subgrades are consisted of locally available soil deposits that
sometimes might be very weak to support the traffic loading, in this causes where the in-situ
conditions are unsuitable, cost effective methods of improving the existing situations must be
identified and implemented (Aggarwal & Sharma, 2010; ERA Site Investigation Manual, 2013).
Ground modification refers to a different techniques used to improve the engineering
characteristics of the soil. It can be applied in various soil conditions such as expansive soils
and soils with inadequate mechanical properties. One way of modifying the ground is the use
of reinforcing elements in the form of strips, bars, sheets and fibers. The fiber reinforcement
involves mixing of natural or synthetic fibers with soil, where the fibers act as tensile resisting
elements that improve soil strength (Torio-kaimo et al., 2020).
A soil stabilized with fiber termed as fiber-reinforced soil and it can be defined as a soil mass
that contains randomly distributed, discrete fibers, which provide an improvement in the
mechanical behavior of the soil composite. The primary purpose of reinforcing soil mass is to
improve stability, increase bearing capacity, and to reduce settlements and occurrence of crack
in a soil mass. Reinforcement is not a new experience, it was practiced in ancient times like
Great Wall of China and ziggurats of Babylon (Hejazi et al., 2012). Currently increasing
attention is being paid to natural fibers, due to the simultaneous awareness is increasing on
environment protection from pollution and conserving energy. The renewed interest in the
natural fibers has resulted in large number of modifications to bring it equivalence and even
superior to synthetic fibers by using different treatment methods including physical and
chemical treatment to protect it from moisture induced degradation (Sumi & Unnikrishnan,
2015; Torio-kaimo et al., 2020).

Investigation on the Application of Katcha Fiber as a Weak Subgrade Soil Reinforcement
Blended with Sand: In case of Koyefeche Project 18 Road Project
2 ASTU M.Sc. Geotechnical Engineering July 2021
Using of natural fiber like Coir, Palm, Sisal, and Jute fibers is common in different countries
like China, India and Philippines, in Ethiopia natural fibers like Tef straw, Sisal, Katcha etc. has
been used for mud house construction in rural areas; but the application of natural fibers in road
construction is not yet practiced. This indicate more study is needed in locally available natural
fibers as a reinforcement material.
A naturally occurring sand can be used as stabilizer to improve the performance of soil. It can
be mixed as admixture to cohesive soils to alter the plasticity, compaction and strength of the
soil (Kollaros & Athanasopoulou, 2017). Furthermore sand can be introduced as a layer to solve
the problem of expansive soils by draining it in addition to reinforcing it (Nini, 2016). Therefore
sand can be applied at various form; mixing and intercalation layer to improve the soil property.
In this research sand also used as an admixture and as a layer for stabilization of the weak
subgrade soil in addition to the natural fiber for further improvement of the soil property.
This thesis presents the results of an experimental investigation on the effect of kerosene coated
Katcha fiber and sand on subgrade soil collected from Koyefeche project 18 road project. The
coated katcha fiber was introduced as a discrete element with 20 mm, 35 mm and 50 mm length
and content of 0.5%, 1% and 1.5%.Sand was mixed in varying ratio 10%, 15% and 20% and it
was also introduced as a layer in different position. Laboratory tests which include grain size
analysis, Atterberg limit, specific gravity, volumetric shrinkage, compaction, UCS, and soaked
CBR tests were conducted for natural and stabilized soils. In addition to this tensile strength,
Specific gravity and WAC of uncoated and kerosene coated Katcha fiber was determined.
1.2. Statement of the Problem
The road which is constructed in Addis Ababa Koyefeche Project 18 faces unsuitable subgrade
soil material which required removal and replacement of the subgrade soil which leads to the
increase in construction cost, duration and create inconvenience for the population movement.
Furthermore, additional borrow areas are needed to be excavated to get quality materials that
contribute to the reduction of nonrenewable natural resource for the next generation and finding
the disposal area of material was a problem. Thus, remedial action should be taken aimed at
mitigating the ongoing problem in the road construction considering the quality, cost and
duration of the project by using mechanical stabilization technique.

Investigation on the Application of Katcha Fiber as a Weak Subgrade Soil Reinforcement
Blended with Sand: In case of Koyefeche Project 18 Road Project
3 ASTU M.Sc. Geotechnical Engineering July 2021
1.3. Objectives
1.3.1. General Objective
The general objective of this thesis is to improve the weak subgrade soil by adding sand and
kerosene coated Katcha fiber.
1.3.2. Specific Objectives
To study the property of subgrade soil.
To investigate the effect of sand on gradation and consistency property of subgrade soil.
To investigate the effects of Katcha fiber (lengths and percent) and sand on Compaction,
CBR and UCS value of subgrade soil.
To determine the optimum amount of Katcha fiber, Sand and suitable position of sand
layer in reinforced soil.
1.4. Research Questions
1) What is the property of good subgrade soil?
2) What is the effect of sand on consistency and gradation property of weak subgrade soil?
3) What is the effect of Katcha fiber and sand on compaction, CBR and UCS characteristic
of clay soil?
4) What is the optimum amount of Katcha fiber, sand and suitable position of sand layer to
improve the clay soil property?
1.5. Significance of the Study
In Ethiopia, many research were done on improving the performance of problematic subgrade
soil by using chemical stabilization like cement, lime, marble dust, fly ash, etc. However, this
study provides a new ecofriendly method that can be implemented in any weather condition
unlike that of the chemical stabilization method.
Since, Ethiopia is rich in both Katcha fiber and Sand this thesis provided a new alternative
method of stabilization to improve the bearing capacity and workability of weak subgrade soil
by using Katcha fiber and sand. Improving the performance of existing soil can reduce the
construction cost of road project by avoiding the cut, disposal and fill material price and
moreover it contribute to conservation of natural resources for the upcoming generation

Investigation on the Application of Katcha Fiber as a Weak Subgrade Soil Reinforcement
Blended with Sand: In case of Koyefeche Project 18 Road Project
4 ASTU M.Sc. Geotechnical Engineering July 2021
Therefore this study introduces a new economical method to improve the performance of
subgrade soil by the combined effect of sand and Katcha fiber. The particular importance of the
study is not only for the koyefeche project 18 road project but also for other areas of similar soil
type and it can be used as reference material for future studies.
1.6. Scope and Limitation of the study
The study considered a quantitative experimental study; to measure the engineering properties
of subgrade soil samples collected from two test pits of koyefech project 18 road project at a
depth of 1.2 m and to determine the strength of stabilized subgrade soil.
Generally, the experiment includes tests performed in soil laboratory as grain size analysis,
consistency test, specific gravity, and volumetric shrinkage for identification of weak subgrade
soil and to study the effect of adding sand on the classification of the subgrade soil by AASHTO
and USCS classification system and compaction, CBR and UCS tests were conducted for
natural and stabilized soil by varying the length and content of Katcha fiber and sand content.
A laboratory test was also conducted to determine the physical and tensile properties of
individual fibers including individual fiber diameter, tensile strength, specific gravity and
moisture content and moisture regain of the fiber. However, this work is limited to determine
biochemical composition of the Katcha fiber due to the lack of chemical reagents which are
needed to determine the composition of natural fiber so this property of Katcha fiber was
adopted from previous researches conducted on Katcha fiber properties.
1.7. Structure of the study
The thesis includes five chapters. In the first chapter the background, statement of the problem,
objectives, research questions, significance of the study, scope and limitations of the work is
presented. The second chapter deals with a brief literature review comprising study on previous
similar works relevant to the present study about soil, natural fiber and method of soil
reinforcement. In the third chapter the method, description of the study area, the material used,
procedures to be followed and tools and techniques engaged in the laboratory to achieve the
specified objectives are presented. The fourth chapter presents the analysis and results obtained
from the experimental work. Finally, the conclusions drawn and recommendations made from
the findings are presented in the fifth chapter.

Investigation on the Application of Katcha Fiber as a Weak Subgrade Soil Reinforcement
Blended with Sand: In case of Koyefeche Project 18 Road Project
5 ASTU M.Sc. Geotechnical Engineering July 2021
CHAPTER TWO
LITERATURE REVIEW
2.1. Origin and Formation of Residual Soils
Soil can be defined as a complex heterogeneous material which contains different types of
minerals resulted from disintegration or weathering of parent rock due to various physical
phenomena. Soil property is not the same in all areas. The variation in the property, may occur
within a few kilometers (Mathur et al., 2017). The geotechnical property of a soil is affected by
parent rock, the degree of weathering, and climatic regime of the area (Saffari et al., 2019).
Residual soils are soils derived from the in situ weathering and decomposition of rock which
has not been transported from its original location. Residual soils are formed from parent rocks
by the in situ weathering of rocks, through Physical, Chemical and Biological processes.
Physical process involves on crushing of the rock to produces end products consisting of angular
blocks, cobbles, gravel, sand, silt and even clay sized rock flour without altering the mineral
constituents of the parent rock, and expose fresh surfaces to chemical. Chemical process, chiefly
hydrolysis, cation exchange and oxidation alter the original rock minerals to form more stable
clay minerals(Mitchell & Soga, 1994). Biological weathering includes both physical action like
splitting by root wedging and chemical action which includes bacteriological oxidation,
chelation and reduction of iron and sulphur compounds
Climate has a considerable influence on the rate of weathering. The extent and rate of chemical
weathering is largely controlled by the availability of moisture and temperature. Topography
controls the rate of weathering by partly determining the amount of available water for each
zone of weathering, the slope angle controls the amount of water available to move downward
through the weathering zone. On steep slopes precipitation of run-off is greater than infiltration
which is not favorable for deep weathering. On the other hand, on flatter slopes, run- off is not
so marked and long uninterrupted periods of weathering can take place; producing deep
weathered soil profile (Huat et al., 2009). As it is discussed above the property of residual soil
such as specific gravity, consistency limits, particle distribution, compaction, bearing capacity,
permeability and shear strength is affected by parent rock, the degree of weathering, climate,
and topography condition of the area.

Investigation on the Application of Katcha Fiber as a Weak Subgrade Soil Reinforcement
Blended with Sand: In case of Koyefeche Project 18 Road Project
6 ASTU M.Sc. Geotechnical Engineering July 2021
2.2. Soil Classification
Classification of soil plays important role to check the suitability of soil to be used as a
construction materials, identification and classification of soils is mainly done by mineralogical
classification and index tests. For mineralogical identification, X-ray diffraction, Differential
Thermal Analysis and Electron Microscope resolution are used, on the other hand, index tests
consists of grain size analysis, consistency test, and free swell are used for classifying the soil.
AASHTO and USCS systems are widely known classification systems which use index property
of soils determined by simple laboratory tests for soil classification.
2.2.1. AASHTO Classification System
AASHTO classification system is used to classify both soil and soil-aggregates based on
laboratory determination of particle-size distribution, liquid limit, and plasticity index. This
method is used when a precise engineering classification is needed, especially for highway
construction purposes. The system groups soil into seven major groups from A-1 to A-7 with a
total of 12 groups, including subgroups. The strength or quality of a soil decrease from left to
write across a table except A3 group which is found between A1 and A2 groups. Soil which
lays under groups A1- A4 are regarded as an excellent to good while soils lays under group A5-
A7 are ranges from fair to poor for subgrade material. Another important number in this
classification system is group index; the group index is a function of the liquid limit, the
plasticity index and the amount of material passing 0.075 mm sieve (ASTM-D3282, 1997).
The Group index (GI) of the soil is calculated by using equation 2.1
𝐺𝐼 = (𝐹 − 35)(0.2 + 0.005(𝐿𝐿 − 40)) + 0.01(𝐹 − 15)(𝑃𝐼 − 10) … … … … … … … … … … 2.1
Where: F is percentage passing No. 200 (75-µm) sieve,
LL is liquid limit, and
PI plasticity index

Investigation on the Application of Katcha Fiber as a Weak Subgrade Soil Reinforcement
Blended with Sand: In case of Koyefeche Project 18 Road Project
7 ASTU M.Sc. Geotechnical Engineering July 2021
Table 2.1. AASHTO Classification of Soils and Soil-Aggregate (ASTM-D3282, 1997)
General
classification
Granular Materials Silt-Clay Materials
(35% or less passing No.200) (More than 35% passing No.200)
Group
Classification
A-1
A-3
A-2
A-4 A-5 A-6
A-7
A-1-a A-1-b A-2-4 A-2-5 A-2-6 A-2-7 A-7-5,
A7-6
Sieve Analysis,
% Passing
No. 10 (200 mm)
No. 40 (425µm)
No. 200 (75 µm)
50 max …
30 max 50 max
15 max 25 max
…
51 min
10 max
… … … …
… … … …
10 max 35 max 35max 35 max
… … …
… … …
36 min 36min 36 min
…
…
36 min
Characteristic of
fraction passing
No. 40 (425 µm)
Liquid limit
Plasticity index
Usual type of
Significant
constituent
materials
…
6 max
Stone Fragment ,
Gravel and Sand
…
N.P
Fine
Sand
40 max 41 min 40 max 41 min
10 max 10 max 11 min 11 min
Silty or Clayey Gravel and Sand
40 max 41 min
40max
10 max 10 max
11min
Silty Soils
41min
11min
Clayey
Soils
General rating as subgrade Excellent to Good Fair to poor
2.2.2. Unified Soil Classification System (USCS)
The USCS use both particle size analysis and plasticity characteristic just like AASHTO
classification system. The system is used to determine the suitability of soils for all geotechnical
works. In this system the soils are classified in to fifteen groups, first the soils are classified in
to two categories as coarse grained soils, if more than 50% of the soil retained on No. 200 (0.075
mm) sieve and fine grained soils, if more than 50% of the soil passes No. 200 sieve. Coarse
grained soils are further divided in to eight groups and fine grained soils are divided in to seven
group(Arora, 2003).

Investigation on the Application of Katcha Fiber as a Weak Subgrade Soil Reinforcement
Blended with Sand: In case of Koyefeche Project 18 Road Project
8 ASTU M.Sc. Geotechnical Engineering July 2021
Figure 2.1. USCS plasticity chart (ASTM-D2487, 1985)
2.3. Soil Stabilization
The quality of subgrade is the input parameter in pavement design and construction. Practically
finding a good subgrade soil is not always possible, thus implementing different mechanism is
significant to solve this difficulty; like avoiding the particular site, design the planed structure
accordingly, and remove and replacement of soil but all this methods are not always suitable
for a certain project. Therefore a ground modification method should be identified and
implemented to improve the performance of exciting soil (Aggarwal & Sharma, 2010;
Hausman, 1990).
Soil stabilization is the process of alteration of one or more soil properties to create an improved
soil material possessing the desired properties for intended construction purpose. Stabilization
can be classified in to two major categories as chemical and mechanical processes. Chemical
stabilization includes the use of chemicals to modify the behavior of soil and Mechanical
stabilization includes methods which improve the soil property without altering the chemical
composition of the soil by compaction, and fibrous and other reinforcement of geomaterials to
improve strength of a soil (Das, 2003).
2.3.1 Soil Reinforcement
Soil reinforcement is included in the mechanical soil stabilization method. In this method either
natural or synthesized fibers are used to improve the soil parameters such as bearing capacity,
shear strength, compressibility, density and hydraulic conductivity. Both natural and synthetic
fibers can be used as a soil reinforcing material but due to simultaneous awareness increase on
0
10
20
30
40
50
60
0 10 20 30 40 50 60 70 80 90 100 110
Pla
stic
ity I
ndex
(%
)
Liquid Limit (%)

Investigation on the Application of Katcha Fiber as a Weak Subgrade Soil Reinforcement
Blended with Sand: In case of Koyefeche Project 18 Road Project
9 ASTU M.Sc. Geotechnical Engineering July 2021
environment and energy, increasing attention is being paid to natural fibers with a view to
conserving energy and protecting the environment rather than using of synthetic fiber, and waste
byproducts of different industries (Sumi & Unnikrishnan, 2015).
The standard fiber-reinforced soil is defined as a soil mass that contains randomly distributed,
discrete element which provide an improvement in the mechanical behavior of the soil
composite. The concept of fiber reinforcement was recognized more than 5000 years ago;
ancient civilizations used straw and hay to reinforce mud blocks in order to create reinforced
building blocks. There are several examples of reinforcing the soil like Great Wall of China
earliest example of reinforced earth using branches of trees as tensile elements, and ziggurats
of Babylon woven mats of read were used. The first modern form of soil reinforcement was
developed by Henry Vidal in 1966 since then the idea of reinforcement is getting a big concern
(Kulhar & Raisinghani, 2018).
2.3.2. Synthetic Fibers
Synthetic fibers are manufactured fibers for a certain purpose. Usually synthetic fibers includes
steel, glass, plastic, both macro plastic fibers and micro plastic fibers, and carbon fibers. This
fibers are widely applicable in different area including production of concrete, blocks, soil
reinforcement etc. All synthetic fibers can be used as a soil reinforcing material specifically
polypropylene fibers, have demonstrated positive benefits when used as reinforcement for soil
(Mohajerani et al., 2019).
A disadvantage of synthetic fibers is that they take a lot more energy to produce due to the
production method, hence these fibers are more cost. Some limitations of synthetic fibers
include their low biodegradability. For polypropylene fibers, when recycling plastic, there is a
risk if the prior history of the plastic is not known. If it was procured from an uncontrolled
environment, the resulting properties of the recycled fiber may be unstable and inconsistent and
also some of the synthetic fibers including such as glass fiber has smooth surface which
results lower friction with in a soil mass and reduce the strength of reinforced soil (Hejazi et al.,
2012; Mohajerani et al., 2019).

Investigation on the Application of Katcha Fiber as a Weak Subgrade Soil Reinforcement
Blended with Sand: In case of Koyefeche Project 18 Road Project
10 ASTU M.Sc. Geotechnical Engineering July 2021
2.3.3. Natural Fibers
Natural fibers include those originated from plant, animal and mineral sources. In soil
reinforcement the natural fiber refers to the plant based natural fibers due to bulk availability
and higher strength, this fibers are lignocellulosic in nature and are comprised of cellulose,
hemicelluloses, lignin, pectin and waxy substances (Sumi & Unnikrishnan, 2015).
These days, natural fibers are widely incorporated in many engineering applications due to their
abundance, cost, low density, strength, stiffness, enviromental freindly and so forth. Natural
fibers includes those originate from plant parts (banana, jute, coir, sisal, etc.), animal parts
(silk, hair, wool, etc.) and minerals sources. Geaotechnical intentions have been projected
towards plant fibers in terms of natural fiber based on the availability and applicability for large
scale application (Gowthaman et al., 2018; Hejazi et al., 2012; Sumi & Unnikrishnan, 2015).
2.3.3.1. Katcha Fiber
Katcha (ቃጫ) is a fiber which is extracted as a byproduct from Enset (እንሰት) plant. Ensete
ventricosum plant commonly known as Enset or false banana plant. It is thicker and larger than
banana often reaching up to 12 m in height and more than 1 m in diameter and it usually
harvested starting from 3 years (Teli & Terega, 2017).
(a) (b)
Figure 2.2. Photographic view of; (a) Enset Plant and (b) Katcha Fiber

Investigation on the Application of Katcha Fiber as a Weak Subgrade Soil Reinforcement
Blended with Sand: In case of Koyefeche Project 18 Road Project
11 ASTU M.Sc. Geotechnical Engineering July 2021
The Katcha fiber is extracted traditionally from the stalk part of plant by hand decortication
method by using a traditional sharp- edged blade against flat wood base plate along the stalk
length. The main aim of extraction of the pseudostem and leaf sheaths of Ensete is to produce
starchy pulp along with the corm which further processed and used as a food product, and a
fiber as a byproduct the extracted fibers are very long, often cut to 1-1.5m during extraction.
2.3.3.1.1. Availability of Katcha Fiber in Ethiopia
Ethiopia is one of the countries where Eniset plant occurs in domestic as well as wild form. The
wild Enset occurs in the highlands in the southwestern part whereas the cultivated one grows in
a wider area comprising the central, southern and southwestern parts mainly at higher altitudes
ranging from 1500 to 3100 m. Enset is well known for its drought resistance presently it is the
main crop of a sustainable indigenous African system, which ensures food security. In Ethiopia,
more than 20% of the total population, concentrated in the highlands of southern Ethiopia,
depend upon Enset. In addition to its use as a source of food, it is also utilized for Katcha fiber
production (Teli & Terega, 2017). Since the Enset plant is source of food it is widely available
in the country and getting katcha fiber would not be a problem.
2.4. Properties of Natural Fiber
2.4.1. Biochemical Properties of Natural Fiber
All plant based natural fibers are lignocellulosic in nature and are comprised of cellulose,
hemicelluloses, lignin, pectin and waxy substances. The cellulose fibrils made of chained-
cellulose molecules, are aligned along the length of the fiber, which provide higher mechanical
(tensile and flexural) strength, in addition of providing rigidity it determine the reinforcing
ability of fiber. Hemicellulose forms the cementing matrix and it influences the moisture
absorbent ability of the fiber structure (Gowthaman et al., 2018; Sumi & Unnikrishnan, 2015).
Lignin is a complex hydrocarbon polymer which gives rigidity to the stem. It plays important
role as a protection layer which prevent the internal structure of fiber form degradation, Pectin
provide flexibility and the waxes make up the last part of the fiber (John & Thomas, 2008).
Generally in natural fiber, Cellulose is responsible for fiber strength, hemicelluloses for thermal,
biological and moisture degradation, while lignin for UV degradation and char formation (Sumi
& Unnikrishnan, 2015). Thus the overall property of natural fiber is determined by its structure,
cell dimension, defects and chemical composition. A typical schematic diagram of fibril matrix

Investigation on the Application of Katcha Fiber as a Weak Subgrade Soil Reinforcement
Blended with Sand: In case of Koyefeche Project 18 Road Project
12 ASTU M.Sc. Geotechnical Engineering July 2021
structure (strands of cellulose molecules embedded in a matrix of hemicellulose and lignin)
from (Gowthaman et al., 2018) is shown in Figure 2.4.
Figure 2.3. Fibril matrix structure of plant fiber and the chemical composition of (a) Cellulose;
(b) Hemicellulose; and (c) Lignin (Gowthaman et al., 2018)
Commonly fibers like kenaf, hemp, flax, sisal, jute and bamboo with higher cellulose content
more than 50% reflect higher strength property and they are used as a soil reinforcement
material. Katcha fiber also exhibit cellulose content of more than 50% this shows the potential
applicability of katcha fiber as a reinforcement material. The biochemical compositions and
Tensile strength of plant fibers is illustrated in Table 2.2 with respect to their origins.

Investigation on the Application of Katcha Fiber as a Weak Subgrade Soil Reinforcement
Blended with Sand: In case of Koyefeche Project 18 Road Project
13 ASTU M.Sc. Geotechnical Engineering July 2021
Table 2.2. Biochemical compositions and Tensile strength of plant fibers
Source
of
Fiber
Fiber
Origin
Cellulose
(%)
Hemicellulose
(%)
Lignin
(%)
Tensile
strength
(MPa)
Elongation at
Break (%)
References
Banana Leaf 57.6- 65 19-29.1 5-13.3 392-677 2.7-5.9 (Bhatnagar et al.,
2015; Gowthaman
et al., 2018; Teli
& Terega, 2017)
Coir Fruit 32–46 15-30 40–45 100–225 12-52.45 (Gowthaman et
al., 2018; Sumi &
Unnikrishnan,
2015; Teli &
Terega, 2017)
Jute Stem 61-71 14-20 12-13 393-773 1.5–1.8 (Gowthaman et
al., 2018; Sumi &
Unnikrishnan,
2015; Teli &
Terega, 2017)
Sisal Leaf 57–71 10-16 11–12 317.5 3-7 (Gowthaman et
al., 2018; Sumi &
Unnikrishnan,
2015; Teli &
Terega, 2017)
Enset Stem 62-67.63 19-22.47 5-6.88 351.7 3.2 (Esayas et al.,
2018; Teli &
Terega, 2017;
Temesgen &
Sahu, 2014)
The biochemical composition of Katcha fiber with respect to their implication are presented in
the following table 2.3.

Investigation on the Application of Katcha Fiber as a Weak Subgrade Soil Reinforcement
Blended with Sand: In case of Koyefeche Project 18 Road Project
14 ASTU M.Sc. Geotechnical Engineering July 2021
Table 2.3. Biochemical composition of Katcha fiber and their implication
Fiber Component Implication
Properties (%)
Reference
Cellulose
Hemicellulose
Lignin
62-67.63
19-22.47
5-6.88
Complex carbohydrate responsible
for fiber strength, provide higher
mechanical (tensile and flexural)
strength.
Influences the moisture absorbent
ability of the fiber structure and
provide protection against thermal,
biological and moisture
degradation.
Prevent the internal structure of
fiber form degradation and protect
from UV degradation and char
formation
(Esayas et al., 2018; Teli
& Terega, 2017;
Temesgen & Sahu, 2014)
(Esayas et al., 2018; Teli
& Terega, 2017;
Temesgen & Sahu, 2014)
(Esayas et al., 2018; Teli
& Terega, 2017;
Temesgen & Sahu, 2014)
2.4.2. Fiber Degradation and Treatment
Despite natural fiber’s many advantages, their property still need to be improved to be used in
soil reinforcement to avoid or reduce the degradability of fiber in the soil composite.
Degradation due to water absorption and microorganisms remains as a major challenge in fiber
soil reinforcement technique. Plant based natural fibers contain groups which exhibit a tendency
to attract water molecules through hydrogen-bond formation causing the fibers to swell which
provides favorable conditions for microorganisms to live. The decrease in strength of lignin,
and hemicellulose leads to the increase the rate of degradation in fiber (Gowthaman et al., 2018;
Sumi & Unnikrishnan, 2015). In order to reduce degradability of fiber, treatment techniques is
needed to increase the hydrophobic property of fiber to ultimately minimize microbial
degradation and increases long term mechanical strength.
Different treatment techniques are available for fiber treatment which can be used to improve
the fiber performance in soil. The treatment techniques can be either physical or chemical.
Alkali treatment is one chemical treatment method which involves on subjecting of fiber to
alkali (commonly, aqueous Sodium Hydroxide (NaOH)) in order to modify the surface of fibers

Investigation on the Application of Katcha Fiber as a Weak Subgrade Soil Reinforcement
Blended with Sand: In case of Koyefeche Project 18 Road Project
15 ASTU M.Sc. Geotechnical Engineering July 2021
leading to increased wettability and interfacial strength of fibers with polymer resin. Treatment
of coir fibers with 5% aqueous NaOH at curing periods of 72 h to 96 h resulted in increased
wettability and dispersability of fibers in polymer matrix. An increase of 15% in tensile strength
was observed. Higher curing periods showed gradual decrease in strength this is due to the alkali
can dissolve and remove waxy coating from fiber surface and make it rough, excessive
concentration of alkali can possibly damage the fiber (Sumi & Unnikrishnan, 2015).
Other widely used method is physical coating or treatment in which the fiber surface is modified
by physical means, mostly using synthetic polymers. Kerosene and Bitumen are widely used
for this treatment mechanism which physically prevent the entry of moisture into fiber. A study
was conducted by (Ramasubbarao, 2014) on the water absorption capacity of uncoated and
kerosene coated coir fibers from the test water absorption capacity of fiber is reduced by 58%
for two days mellowing period of coir fiber. 100 % reduction in water absorption capacity was
recorded for a Coir fiber soaked in Kerosene for nine days (Torio-kaimo et al., 2020).
2.5. Soil Reinforcement Method
Different type of fiber can be used for soil reinforcement in varied forms, texture, stiffness,
content, length or aspect ratio, orientation and so forth among which content, length and
orientation of fibers are the most practical concerns in geotechnical applications. Basically, fiber
reinforced soil can be classified into two types based on their method of application as random
distributed fiber inclusion and systematic/planar fiber inclusion (using planar reinforcement)
(Gowthaman et al., 2018; Hejazi et al., 2012).
2.5.1. Random Inclusion
Random inclusion of fiber is a well-known soil improvement technique in which fibers
comprised of desired property and quantity are assorted as randomly distributed, discrete
elements and mixed and compacted in situ to provide an improvement in the mechanical
behavior of the soil composite (Gowthaman et al., 2018; Hejazi et al., 2012).
Random inclusion provide an isotropic increase in the strength of the soil composite without
introducing continuous planes of weakness. The distributed fibers subjected to tension
contribute to the increase in strength of specimens. Initially, soil particles subjected to stresses
attempt to dansify, which persuades deformation of fiber material, subsequently direct forces

Investigation on the Application of Katcha Fiber as a Weak Subgrade Soil Reinforcement
Blended with Sand: In case of Koyefeche Project 18 Road Project
16 ASTU M.Sc. Geotechnical Engineering July 2021
are generated on fiber at fiber-soil interlocking stage due to rotation and direct impact of soil
particles. Simultaneously, soil particles which are in contact with fiber, induce to develop
frictional forces on fibers in addition to interlocking forces. Eventually, the interlocking forces
coupled with frictional forces tend to mobilize the tensile stress on fiber material. Moreover,
random distribution of fibers mobilizes fiber-soil adhesive bonding, which utilizes additional
composite strength and the interaction of the flexible fibers behaves as a structural mesh that
holds the soil together which increase the soil structural integrity (Gowthaman et al., 2018).
2.5.2. Systematic/Planar Inclusion
In Systematic or planar inclusion fibers introduced by planner or layer systems in vertical,
horizontal or both direction. The application of natural fibers systematically requires
modification such as weaving, binding, combining or punching based on the requirements of
applications. In this system the soil is first compacted to the desired density and then the
reinforcement material is placed and the sequence repeated until the required lift is achieved.
The Planer inclusion technique mobilizes supplementary frictional strength along the fiber-
reinforced planes but compared to random inclusion systematic inclusion has its weakness
because the material in planar creates planes of weakness with un-reinforced zones, un-
reinforced zones necessitate the survival by its own strength but possibilities still exist to
generate failure planes through weaker un-reinforced zone (Gowthaman et al., 2018).
(a) (b)
Figure 2.4. Fiber reinforcement mechanism of soil; (a) Systematic/Planer inclusion; (b)
Random inclusion (Gowthaman et al., 2018)

Investigation on the Application of Katcha Fiber as a Weak Subgrade Soil Reinforcement
Blended with Sand: In case of Koyefeche Project 18 Road Project
17 ASTU M.Sc. Geotechnical Engineering July 2021
2.6. Potential Applications of Fiber-Reinforcement
Fiber-reinforcement has been considered in projects including slope stabilization, embankment
construction, subgrade stabilization, and as landfill covers. The general advantages of fiber
reinforcement are:
1. Conventional construction equipment can be used for field placement of fibers. A rotary
mixer of the type typically used in lime-soil mixing can be used to mix the fibers within
the soil lift. The lift can then be compacted using standard soil compaction methods,
without the concern of damaging the reinforcement (Li, 2005).
2. Unlike chemical stabilization methods lime, cement and other chemicals, fiber-
reinforcement is not significantly affected by weather condition it is possible to use fiber
reinforcement in any weather condition (Li, 2005; Sumi & Unnikrishnan, 2015).
3. The natural fibers used for reinforcement are relatively cheap, locally and widely
available, ecofriendly, easy to process and renewable (Sumi & Unnikrishnan, 2015).
2.7. Previous works
Worldwide a number of researches have been carried out so far to improve the properties of
weak soil by using different types of natural fibers. Some of them are pointed out here.
2.7.1. Banana Fiber
Banana fiber is one of a natural fiber, obtained from the pseudo-stem which is a cylindrical,
clustered aggregation of leaf stalk bases of banana plant. It has high strength, light weight,
smaller elongation, fire resistance quality, great potentialities and biodegradability and its
diameter ranges 0.08-0.25mm and length ranges 1-5 m (Bhatnagar et al., 2015).
A study in India by (Babu, 2019) had been performed to understand the physical mechanism
of stabilization of an expansive soil by adding banana fiber. The study aimed at stabilization of
black cotton soil with banana fiber in a random inclusion. The materials used in this test were
black cotton soil and banana fiber with a cut length of 1.5 cm and 0.3%-1.2% content with an
increment of 0.3% by dry weight of soil and compaction, UCS and CBR tests were conducted.
The final result from the experiment showed that, as the percentage of fiber increases the values
of OMC increase and MDD reduced. This is due to the water absorption and light weight
characteristic of fiber. The study also revealed that regardless of reducing MDD, addition of

Investigation on the Application of Katcha Fiber as a Weak Subgrade Soil Reinforcement
Blended with Sand: In case of Koyefeche Project 18 Road Project
18 ASTU M.Sc. Geotechnical Engineering July 2021
banana fiber increases the CBR as well as UCS value of a soil. Maximum CBR and UCS value
was obtained at 1.2% of fiber the increase is due to the banana fiber acting as reinforcement.
Another study was carried out in Malaysia by random inclusion of banana fiber to improve clay
soil property (Bawadi et al., 2020). Banana fibers of 0.3 %, 0.5 % and 1% by weight of soil had
been used as a soil reinforcement in influencing the strength of clay soil. In order to investigate
the influence of fiber Unconsolidated Undrained Triaxial and CBR tests were conducted. 1%
fiber gave the highest CBR and highest shear strength under different cell pressure.
2.7.2. Coir Fiber
Coir fiber is obtained from a matured coconut and it has been widely used to reinforce different
problematic soils. Generally its diameter ranges 0.1–0.6 mm and length ranges 50-350 mm and
coir degradation takes place much more slowly than other natural fibers and it retains much of
its tensile strength when it is wet (Rowell et al., 2000).
(Mohan & Manjesh, 2017) conducted a study to investigate the influence of randomly oriented
coir and jute fiber on medium compressible clayey soil strength parameter. Fibers with different
aspect ratios and percent of 0.25%, 0.5%, 0.75% and 1.0% by dry weight of soil was used.
The compaction test result showed the decreases in MDD and increases OMC with increase in
coir fiber dosage. The test result indicates that both un-soaked and soaked CBR value of soil
increases with the increase in fiber content. It was also observed that increase in CBR and UCS
value of reinforced soil is substantial at fiber content of 0.5 % and cut length of 30mm. It can
be concluded that CBR value of soil increases with the inclusion of coir fiber for both soaked
and un-soaked conditions substantially reduce the thickness of pavement.
(Lakshmi et al., 2018) conducted an experimental study on clayey sand using coir fiber with
varying percentage 0.3%, 0.6%, 0.9%, 1.2% and 1.5% by dry weight of a soil and with a cut
length of 10 mm, 20 mm, 30 mm, 40 mm and 50 mm. Standard compaction, CBR and UCS
tests were conducted to determine optimum fiber content and fiber length. Just like all
researches, the OMC of mix increased and MDD decreased gradually as the percent and length
of coir fiber increase, and CBR and UCS value increased up to a 1.2%. Soil with 1.2 % coir
fiber of length varying from 2cm to 3cm showed maximum increase in UCS of 43.2 % and 47.4

Investigation on the Application of Katcha Fiber as a Weak Subgrade Soil Reinforcement
Blended with Sand: In case of Koyefeche Project 18 Road Project
19 ASTU M.Sc. Geotechnical Engineering July 2021
% respectively and soaked CBR value was found to increase by approximately four times that
of unreinforced soil.
2.7.3. Jute Fiber
Jute is widely available in Asian Countries as well as Brazil and generally grows to 2.5–4.5 m
height with the base stem diameter of around 25 mm. Jute fibers have been found to be effective
in improving characteristics of soil and are being used extensively in rural road construction,
protection of river banks, stabilization of embankments, and so forth (Gowthaman et al., 2018).
(Aggarwal & Sharma, 2010) used bitumen coated Jute fiber of lengths 5 mm–20 mm by 5 mm
interval in different percentages 0.2% to 1.0% with 0.2% interval to reinforce weak subgrade
soil. Series of Compaction and CBR tests had been carried out on plane soil and soil with jute
fiber. To study the effect of diameter and length of jute fiber, diameter was varied from 2 to 8
mm. The result of proctor test showed that varying diameter of fiber 2-3 mm or 6-8 mm does
not make any appreciable trend on the result of OMC and MDD, this shows that the effect of
fiber diameter is negligible. The maximum CBR value is observed as 4.62% with 10mm long
and 0.8% jute fiber, an increase of more than 2.5 times than the plain soil CBR value of 1.82%.
An experimental study was conducted by (Kumar et al., 2015) to improve CBR value of a
subgrade soil by random inclusion of jute fiber of 20 mm to 100 mm length by 20 mm interval
and 1% to 5% fiber content by dry weight of the soil with 1% interval. The result showed that
as the fiber content increased, the CBR value of soil also increased and the increase is substantial
up to 5 % and the optimum length of fiber is between 60 to 80 mm. This shows that length and
present of fibers have a significant effects on the CBR value of soil.
2.7.4. Katcha Fiber
Katcha fiber is obtained from Enset plant by manual decortication method. Katcha fiber has
comparable strength and elongation at break with most commercially available fibers as
illustrated in Table 2.2. Its good tensile properties are attributed from its high cellulose content
and good crystallite orientation (Teli & Terega, 2017).
A study by (Tirfu, 2018) was conducted to improve the performance of weak subgrade soil by
random mixing of Katcha and Tef straw fiber separately on selected road section of Wolaita,
South Western Ethiopia. Both fibers were prepared from 0.25% -1.25% by dry weight of soil

Investigation on the Application of Katcha Fiber as a Weak Subgrade Soil Reinforcement
Blended with Sand: In case of Koyefeche Project 18 Road Project
20 ASTU M.Sc. Geotechnical Engineering July 2021
with an increment of 0.25% and 60 mm length. The result from laboratory test showed that, as
amount of both fiber increases, the OMC increased and the MDD decreased. This was explained
by the fact that natural fiber water absorption capacity is greater than that of soil replaced by
fiber. The value of soaked CBR increase from 2.1% to 5.4 % for Katcha fiber stabilized soil at
1% of fiber content and 4.4% for Teff straw fiber mix at 0.75%.
2.7.5. Sisal Fiber
Sisal fibers extracted from the leaves of the plants, which vary in size, between 6-10 cm in width
and 50-250 cm in length and diameter about 0.06 - 0.4mm (Kulhar & Raisinghani, 2018).
Recently, sisal plant has been recognized as a potential engineering material due to its strength,
durability, ability to stretch, and resistance to deterioration.
(Sandyarani et al., 2018) used sisal fiber with varying percentages 0.2%, 0.5%, 0.9% and 1.2%
and varying lengths 3 cm, 3.2 cm and 3.4 cm to increase the strength of black cotton soil. As
the amount of sisal fiber increase in the soil mix, the OMC increased and MDD of soil
decreased. The highest value of UCS and unsoaked CBR recorded at 0.5% and 3.4cm sisal fiber.
2.8. Soil Stabilization by Using Natural Sand
2.8.1. Properties of Natural Sand
Sand is a naturally occurring granular material composed of finely divided rock and mineral
particles. The composition of sand, varies depend on parent rock property, but the most common
constituent of sand is silica usually in the form of quartz. Because of its chemical inertness and
considerable hardness, it is the most common mineral resistant to weathering (Hiwot, 2016).
According to USCS sand size is defined as a particle with a diameter of between 0.075mm and
4.75mm, more than 50% of coarse fraction passes number 4 (4.75mm) sieve and more than 50%
retained on or above number 200 (75 µm) sieve.A coarse sand from 4.75-mm to 2.00-mm,
medium from 2.00-mm to 425-µm, and fine from 425-µm75-µm (ASTM-D2487, 1985).
2.8.2. Sand as a Soil Stabilizer
Extensive studies have been carried out on the stabilization of soils by using natural sand either
by mixing or by intercalation of sand layer. Some of the researches are pointed out here.
A research in Pakistan had been conducted to improve engineering characteristics of expansive
clays by mixing sand in varying percentage from 5%-35% with 5% interval (Farooq & Virk,

Investigation on the Application of Katcha Fiber as a Weak Subgrade Soil Reinforcement
Blended with Sand: In case of Koyefeche Project 18 Road Project
21 ASTU M.Sc. Geotechnical Engineering July 2021
2009). The main concern of the research was, to investigate the effects of sand mixing on
deformation and strength characteristics of swelling clay. Compaction, CBR and Consolidation
tests were performed in addition to basic property tests for pure clay soil and clay-sand samples.
From the tests the pure clay soil showed a swell potential and swell pressure of 3.5% and 90
Kpa respectively this value was reduced to 0.5% and 10Kpa when the clay mixed with 35% of
sand. The CBR values increased from a value of 4% in case of pure clay sample to a value of
8% and the MDD increased from 18.2 kN/m3 to 19.4 kN/m3 for clay mixed with 30-35% sand.
Another experimental study had been carried out in Algeria by (Louafi & Bahar, 2012) to
understand the physical mechanisms sand as a stabilizer of clay soil by at various forms: mixing
and intercalation layer with varying sand content 10%-70% by dry weight of soil by 10%. The
aim of this study was to analyze the effect of sand on the consistency and reduction of swelling
pressure of the expansive soil. The materials used in this test had been artificial soil clay known
as bentonite and beach sand having particle size of 0.1mm up to 2.0 mm. The Consistency,
Swelling and Ultrasonic tests were performed for soil, soil-sand mix and soil- sand layer.
The results of bentonite-sand mix showed a marked improvement in soil consistency and
swelling action for all percent of sand mix. Sand was introduced to the clay soil under non-
conventional forms as a layers of sand for 10%, 20% and 50%, and tested for two possible
distributions; a sample of bentonite where sand layer is above, and sand layer is in the middle.
The introduction of sand as layer showed reduction in swelling. It was found that the most
efficient distribution in reducing swelling is that of layers of sand placed between two layers of
clay compared to the sand layer placed on top. The ultrasonic pulse propagation showed an
increase in the volume of voids with increasing sand content. This modification in the structure
of treated soil by sand, made it possible the reduction in the swelling of clay by sand addition.
The research conducted by (Nini, 2016) to increase the CBR of clay soil by introdicng a layer
of sand between clay layers. In the research six type of soils and sand were used. For
identification test, sieve analysis, specific gravity, Atterberg limits, Proctor and CBR test were
conducted. Primarily, the Proctor test was done separately for all soils to find the OMC and
MDD. After it, the CBR test was performed on all soil, then, the CBR test was repeated on these
soils but this time after placing the sandy layer. Each time, the position of the sandy layer was
changed and termed as bottom, second, third and upper sandy layer.

Investigation on the Application of Katcha Fiber as a Weak Subgrade Soil Reinforcement
Blended with Sand: In case of Koyefeche Project 18 Road Project
22 ASTU M.Sc. Geotechnical Engineering July 2021
All the test results showed that the existence of sandy layer improved CBR value. The Deeper
is the sandy layer, higher is the drainage of excess pore water. The highest CBR value is
obtained for the bottom sand layer. When the position of the sandy layer is moving up it affect
the CBR negatively. The results in this research agree with (Louafi & Bahar, 2012) for sand
placed between two layers of clay gave lower swelling compared to sand layer at the top.
In a study by (Hiwot, 2016), the effect of crushed and natural sand was studied on different
parameters of expansive soil. The sand contents varied 20%-50% by increment of 10% for both
sand by dry weight of soil. Gradation, Atterberg Limit, Compaction, Free Swell, Swell
consolidation, UCS and CBR test were conducted for pure soil, soil-crushed sand mix and soil-
natural sand mix. The classification of the soil is changed from clay of high plasticity CH to
medium plasticity MH group for both types of sand. For the compaction test MDD increase and
OMC decrease with increasing of sand content, the UCS and CBR value of soil also improved.
40% of both natural and crushed sand found to be the optimum amount for stabilization.
(Rathod & Sathe, 2017) made an experimental study on four type of soil: Black cotton, Sandy
gravel, sandy silty and Loamy soil mixed with varying concentrations of coarse sand 10%, 20%
and 30%. Wet sieve, Atterberg limits, Compaction and soaked CBR tests were carried out on
native soils and soil-sand mix. Results of compaction tests showed that OMC decreased and
MDD increased with addition of sand for all type of soil. The CBR results exhibited a linearly
increasing trend for all soil-sand mix, 30% sand was found to be the maximum value which
give the highest CBR and MDD value. From the experiment it can be concluded that coarse
sand is an effective stabilizer for Black cotton and Loamy soil but it doesn’t have much
influence on Sandy gravel and Sandy silt soil. A similar study by (Tare et al., 2018),
investigated the behavior of black cotton soil used in subgrade stabilized with varying
concentrations of coir fiber from 0.15%-0.75% by 0.15% variation and sand of (3%-15%) by
conducting Index properties for native soil and Compaction and CBR for native soil, soil-coir
mix and soil- coir- sand mix with different percentages of sand. 0.45% Coir fiber and 15% sand
found to be the optimum stabilization scheme, which exhibited the greatest improvements in
CBR value of a soil.

Investigation on the Application of Katcha Fiber as a Weak Subgrade Soil Reinforcement
Blended with Sand: In case of Koyefeche Project 18 Road Project
23 ASTU M.Sc. Geotechnical Engineering July 2021
2.9. Summary of Literature Review
The literatures reviewed in this thesis have generally show that strength of the soil is improved
by reinforcement and sand mixing. The increase in strength of reinforced soil was reported to
be a function of: Fiber characteristics; such as; aspect ratio, percentage, strength, and fiber soil
interaction and method of mixing. Fiber length and content plays great roll than its diameter in
determining the strength, MDD and OMC of the soil fiber mix, this is due to the small diameter
size of natural fiber.
In comparison with systematically reinforced soils, randomly distributed reinforced soils exhibit
some advantages. Discrete fibers are easily applicable in the field by simply adding and mixing
with the soil, much like lime, cement or other additives. In addition it offers strength isotropy
and limit the development of potential planes of weakness parallel to oriented reinforcement.
Introduction of fiber to a soil generally increase the strength, reduce the MDD and increase the
OMC of a soil. The strength of reinforced soil increased due to interlocking and friction force
between soil and fiber which tend to mobilize the tensile stress on fiber and additionally fibers
behaves as a structural mesh that holds the soil together which increase the soil structural
integrity. The optimum amount of fiber content and length is varied based on fiber and soil type.
From different researches it can be concluded that as the length and percentage of fiber increased
beyond optimum content the strength of the soil composite reduced or does not show any
improvement. Comprehensive literature review shows that using of natural fibers in
geotechnical engineering is feasible in different fields including pavement layers, retaining
walls, earth block production etc.
As it is described in the previous researches it can be concluded that the strength and
deformation characteristics of expansive soil have been observed to be improved by sand
mixing and by intercalation of sand layer. By applying such method in practice, the unfavorable
effects of swelling clays to civil engineering structures, can be effectively mitigated and the
workability of soil also improved. Generally application of sand and fiber together can enhance
weak performance of soil. Related woks about stabilization of soil by using natural fiber and
sand are summarized in Table 2.4 and 2.5 respectively.

Investigation on the Application of Katcha Fiber as a Weak Subgrade Soil Reinforcement
Blended with Sand: In case of Koyefeche Project 18 Road Project
24 ASTU M.Sc. Geotechnical Engineering July 2021
Table 2.4. Summary of related works on natural fiber
Authors Title of the study Fiber Major finding
Type Length
(mm)
Percent
(%)
(Babu,
2019)
Soil Stabilization by
using Banana Fiber
Banana 15 0.3.0.6, 0.9
and 1.2
The highest CBR and UCS value
obtained at 1.2 %
(Bawadi
et al.,
2020)
Influence of Banana
Fiber on Shear
Strength of Clay Soil
Banana 20-50 0.3, 0.5
and 1
The highest CBR and shear
strength value recorded at 1%
banana fiber
(Mohan &
Manjesh,
2017)
A Study on
Stabilization of
Subgrade Soil Using
Natural Fibers
Coir
and
Jute
10, 20,
30, 40
and 50
0.25, 0.5,
0.75 and
1.0
The CBR and UCS value
substantial at 0.5 % and 30mm.
(Lakshmi
et al.,
2018)
Utilization of Coconut
Coir Fiber For
Improving Subgrade
Strength
Characteristics Of
Clayey Sand
Coir
5, 10,
15, and
20
0.3, 0.6,
0.9, 1.2
and 1.5
1.2 % of length 20mm to 30 mm
showed maximum increase in
UCS of 43.2 % and 47.4 %
respectively and soaked CBR
value was increased four times
than that of unreinforced soil.
(Aggarwal
& Sharma,
2010)
Application of Jute
Fiber in the
Improvement of
subgrade
Characteristics
Jute
20, 40,
60, 80
and 100
0.2, 0.4,
0.6, 0.8
and 1
The maximum CBR value was
recorded as 4.625 with 10 mm
long and 0.8 % jute fiber.
(Sandyara
ni et al.,
2018)
Stabilization of black
cotton soil by using
Sisal fiber
Sisal
30, 32
and 34
0.2, 0.5,
0.9 and 1.2
0.5% and 3.4cm sisal fiber gave
the highest value of UCS and
unsoaked CBR.
(Tirfu,
2018)
Problematic Sub-
Grade Soil
Reinforcement Using
Local Natural Fibers
Katcha
and
Tef
straw
40 and
60
0.25, 0.5,
0.75, 1 and
1.25
The value of soaked CBR
increase from 2.1% to 5.4 % for
1% katcha fiber and to 4.4% for
Teff straw fiber of 0.75 %.

Investigation on the Application of Katcha Fiber as a Weak Subgrade Soil Reinforcement
Blended with Sand: In case of Koyefeche Project 18 Road Project
25 ASTU M.Sc. Geotechnical Engineering July 2021
Table 2.5. Summary of related works on sand as stabilizer
Authors Title of the study Sand (%) Major finding
(Farooq &
Virk, 2009)
Improvement of
engineering characteristics
of expansive clays by sand
mixing
5, 10, 15,
20, 25, 30
and 35
Swell potential and swell
persure of the soil decrease
from 3.5 % to 0.5 % and 90 Kpa
to 10 Kpa respectively, MDD
increase from 18.2 kN/m3 to
19.4 kN/m3 and CBR value
increases from 4 % to 8 % for
30- 35 % sand mixing
(Louafi &
Bahar, 2012)
Sand: an additive for
stabilization of swelling clay
soils.
10- 70 by
10 %
interval
The consistency limit and
swelling of clay soil reduced,
and sand layer between two
soil layers showed a substantial
effect on the soil swell
reduction
(Nini, 2016) CBR of Soaked Clay
Drained by Sandy Layer
Sand was introduced as a
bottom, 2nd layer, 3rd layer and
upper sand layer. The 2nd sand
layer give the highest CBR
value under 5 mm penetration.
(Hiwot, 2016) An alternative for
Stabilization of Addis
Ababa Expansive Soil by
Crushed and Natural Sand
10, 20 30,
40 and 50
The LL,PL, and PI, OMC
reduced and MDD, CBR and
UCS value increased as sand
percent increased 40 % of each
sand fond to be the optimum
sand content of the mix
(Rathod &
Sathe, 2017)
Soil Stabilization by
Coarse Sand for Different
Soils and Pavement Cost
Evaluation
10 , 20
and 30
The percentage of fines
decreases and percent gravel
increases the sand content
increases from 0 to 10 30%. The
MDD increases and OMC
decreases, the CBR showed
substantial increase for black
cotton soil by 59 % at 30 %
sand.

Investigation on the Application of Katcha Fiber as a Weak Subgrade Soil Reinforcement
Blended with Sand: In case of Koyefeche Project 18 Road Project
26 ASTU M.Sc. Geotechnical Engineering July 2021
CHAPTER THREE
MATERIALS AND METHODS
3.1. Introduction
The study area, soil sampling techniques, materials used, laboratory testing methods and tools
are briefly discussed in this section. The laboratory tests for soils were conducted in the civil
engineering laboratories at Adama Science and Technology University civil engineering
department soil laboratory and Ethiopian Construction Design and Supervision Works
Corporation (ECDSWC) geotechnical laboratory and tensile strength test of Katcha fiber at
Ethiopian Conformity Assessment Enterprise (ECAE). As outlined in (ERA Site Investigation
Manual, 2013) moisture content, sieve analysis, plasticity index, compaction, CBR, and swell
tests are the fundamental parameters that have to be checked for subgrade material and also
UCS have to be checked for stabilized soil. Thus an experimental program was carried out to
determine moisture content, specific gravity, particle size distribution, Atterberg limit,
volumetric shrinkage, Compaction, CBR and UCS of native and stabilized soils.
3.2. Description of the Study Area
Addis Ababa, the capital city is found at the central part of the country. It is located at the
geographical coordinate of 9o North and 38o 45’East, with the general elevation of 2400 m above
sea level.
The Koyefeche condominium construction site is located in the South-Eastern Part of Addis
Ababa city in former Akaki kality sub city of district 09 current Lemi Kura sub city commonly
called ‘Koye-Feche’ situated at about 7 km in the eastern direction of Akaki town. In terms of
geographical coordinates, the site extends from 8o53’00” North to 8o54’30” North latitude, and
38o 48’45” East to 38o50’15” East longitude (Degife et al., 2018). From the total houses and
road projects Koyefeche Project 18 is still the ongoing project in which the construction of
houses and road infrastructures are on progress. The project consists 4 road projects that cover
a total length of 14 Kms.

Investigation on the Application of Katcha Fiber as a Weak Subgrade Soil Reinforcement
Blended with Sand: In case of Koyefeche Project 18 Road Project
27 ASTU M.Sc. Geotechnical Engineering July 2021
(a)
(b)
Figure 3.1. Study area (a) map of the study area and (b) Satellite view of the study area
The general elevation of Addis Ababa decreases towards the south and south east direction. As
such, in the Akaki-Kaliti sub-city, where the Koyefeche project 18 situated, the altitudinal
ranges of 1500 and 2300 m above sea level. The topography of study area is characterized by
gentle and relatively flat topography. The entire site has a slope between 0 to 8 percent. This
indicates that large part of the area is predominantly flat (Degife et al., 2018).
The climate of Addis Ababa City and its suburbs is characterized by two distinct seasonal
weather patterns Kiremt which represent the main wet season, extends from June to September,
contributing about 70% of the total annual rainfall. A minor rainy season, locally known as

Investigation on the Application of Katcha Fiber as a Weak Subgrade Soil Reinforcement
Blended with Sand: In case of Koyefeche Project 18 Road Project
28 ASTU M.Sc. Geotechnical Engineering July 2021
Belg, contributes moisture to the region from mid-February to mid-April. The remaining months
are dry season. The mean annual temperature of the study area over the record periods (1997-
2007) lays between 20.33 OC and 21OC. The highest and lowest mean annual temperature was
registered in the year 2007 and 1999 as 21.19OC and 19.29 OC respectively. The mean annual
rainfall over 33 years was found to be 1038.66 mm and the highest and lowest rainfall was
recorded in the year 1977 and 2001 as 1487.3 mm and 771.3 mm respectively (Degife et al.,
2018; Industrial Parks Development Corporation, 2017).
3.3. Study Design
This research considered quantitative experimental study since it was to measure the index and
engineering properties of soil and the improvement on the soil properties by random inclusion
of natural katcha fiber and Sand. Two representative disturbed soil samples at of depth of 1.2 m
were collected from different locations of a road section by systematic random sampling
technique by using field observation and previous laboratory test results. A laboratory
experiment program was designed to conduct all of the fundamental laboratory tests to
investigate the subgrade soil property, the effect of Katcha fiber and sand on properties of
subgrade soil. The disturbed soil samples were first air-dried and different laboratory tests were
conducted according to the American Society for Testing and Materials (ASTM) soil testing
procedures.
3.4. Materials
3.4.1. Soil
The soil was collected from a site called Koyefeche project 18 road project. Two study test pits
site 6 and site 9 were selected where the problematic soils were encountered. The sample soil
was extracted at a depth of 1.2 m from site 6, designated as test pit 1 and site 9, designated as
test pit 2 and different identification tests were performed in order to select the weaker soil for
stabilization work.

Investigation on the Application of Katcha Fiber as a Weak Subgrade Soil Reinforcement
Blended with Sand: In case of Koyefeche Project 18 Road Project
29 ASTU M.Sc. Geotechnical Engineering July 2021
(a) (b)
Figure 3.2. Photographic view of (a) Pit excavation and (b) Disturbed soil sample
3.4.2. Natural Sand
The sand was collected from local market of Addis Ababa it is originated from Wonji, one of
the sand provider area for Addis Ababa city. Gradation and specific gravity of sand were
determined in the laboratory. Three percentages of sand were employed for stabilization (10%,
15% and 20%) by dry weight of the soil in order to improve the property of the soil.
3.4.3. Katcha Fiber
Katcha is one of a well-known and easily available natural fiber in Ethiopia. The fiber was
almost white in color, it is purchased from local market of Gurage zone Aklil and Moher wereda
specifically from Dengez Kebele. The katcha fiber is selected from other locally available
natural fibers because it is abundant and viable natural resource than other natural fibers and
has good tensile strength which is comparable with other natural fibers. Its length ranges from
1m to 1.5 m.
3.4.3.1. Katcha Fiber Preparation
The primary task before starting mixing Katcha fiber with a clay soil is fiber treatment with
Kerosene gas to reduce the water absorption capacity and to reduce the rate of degradation and
microbial attack due to WAC of the Katcha fiber. As it is shown in Figure 3.3 the dried Katcha

Investigation on the Application of Katcha Fiber as a Weak Subgrade Soil Reinforcement
Blended with Sand: In case of Koyefeche Project 18 Road Project
30 ASTU M.Sc. Geotechnical Engineering July 2021
fiber was soaked in Kerosene for 1, 2 and 3 days to determine the effect of kerosene on water
absorption capacity of Katcha fiber. After soaking the Katcha fiber were removed from the
soaking dish after 24, 48 and 72 hours and allowed to dry by using sunlight. Then the fiber was
cut in to different three lengths of 20, 35 and 50 mm and it is prepared into three percent as 0.5,1
and 1.5% by weight of the dry soil. During mixing of fiber with dry soil was difficult as the
length and percent increased with in a soil mass.
(a) (b) (c)
Figure 3.3. Photographic view of (a) Katcha fiber soaking; (b) Air dried Kerosene soaked
Katcha fiber and (c) 35 mm length Katcha fiber and Sand.
3.4.4. Kerosene
Kerosene gas was used as a physical coating liquid to treat the Katcha fiber. 5 Liters of Kerosene
was purchased from TOTAL gas station located in Addis Ababa around Kebena near to British
embassy, and used for fiber treatment. It is was selected from other type of treatment chemicals
and physical treatment material because it is easily and widely available in Ethiopia, easy for
the application and also few litters of kerosene can be used to coat large amount of katcha fiber.
3.5. Test Programs
Generally the experimental program was divided in to four parts:
i. In the first part, the properties of the Clay Soil, Sand and Katcha were identified.

Investigation on the Application of Katcha Fiber as a Weak Subgrade Soil Reinforcement
Blended with Sand: In case of Koyefeche Project 18 Road Project
31 ASTU M.Sc. Geotechnical Engineering July 2021
Sieve analysis, consistency test, modified compaction and CBR tests were conducted to
determine the property of the clay soil and gradation and consistency tests were also
conducted for sand; tensile strength and specific gravity of Katcha fiber were
determined for both Kerosene coated and uncoated Katcha fiber.
ii. In the second part, the clay soil mixed with 0.5%, 1% and 1.5% Katcha fiber of each 20
mm, 35 mm and 50 mm length the mixing process was conducted by hand as shown in
figure 3.4 and modified compaction and CBR tests were conducted on soil fiber mix.
The optimum fiber content and length was determined from CBR test. The fiber content
and length used for reinforcement are presented in Table 3.1
Table 3.1. Katcha fiber used for soil reinforcement.
Soil Mixture
Fiber
Length (mm) 20 35 50
Percent (%)
100 % Soil 0 0 0
99.5 % soil 0.5 0.5 0.5
99 % soil 1 1 1
98.5 % soil 1.5 1.5 1.5
iii. Based on the test results after determining the optimum fiber content and length, three
percentages of sand were employed (10%, 15% and 20%) to the soil to study effect of
sand on gradation and index property of the soil and to soil fiber mix to study the effect
of sand on Compaction, CBR and UCS of the reinforced soil.

Investigation on the Application of Katcha Fiber as a Weak Subgrade Soil Reinforcement
Blended with Sand: In case of Koyefeche Project 18 Road Project
32 ASTU M.Sc. Geotechnical Engineering July 2021
Table 3.2. Katcha fiber and Sand used for soil stabilization.
Soil Mixture
Percentage (%)
Clay Soil Fiber Sand
0% Katcha fiber and 0% sand
10% Sand and 0% Katcha fiber
15% Sand and 0% Katcha fiber
20% Sand and 0% Katcha fiber
10% Sand and 1% Katcha fiber
15% Sand and 1% Katcha fiber
20% Sand and 1% Katcha fiber
100 0 0
90 0 10
85 0 15
80 0 20
89 1 10
84 1 15
79 1 20
iv. This step involves on the introduction of Sand as a layer in three different position as
1st, 2nd and 3rd sand layer in the CBR test to determine the suitable position of sand layer.
Figure 3.4. Photographic view of one of the position of sandy layer in compaction mould.
3.6. Methods
A series of laboratory tests including Natural Moisture Content, Grain size analysis, Specific
gravity, Atterberg limits, and volumetric shrinkage tests were conducted on the natural clay soil,
and soil-sand mix. The Modified Compaction, CBR, and UCS test were conducted on native
soil, soil-fiber mix, and soil-fiber-sand mix in order to determine weaker soil, maximum amount
of katcha fiber, and maximum amount of sand for stabilization.

Investigation on the Application of Katcha Fiber as a Weak Subgrade Soil Reinforcement
Blended with Sand: In case of Koyefeche Project 18 Road Project
33 ASTU M.Sc. Geotechnical Engineering July 2021
3.6.1. Sample Preparation
The Katcha fiber was taken as 0.5%, 1%, and 1.5% by dry weight of the soil and length of 20
mm, 35 mm and 50 mm was taken for each fiber percent. The mixing of fiber with the soil is
conducted by hand first the soil was spread on the mixing dish then Katcha fiber with a desired
amount and length of Katcha fiber was spread on the soil and the clay soil and fiber were mixed
in dry state and finally the specified amount of water was added for both compaction and CBR
test, no mixing equipment were used since the amount of soil and Katcha fiber used was small.
After the optimum amount of Katcha fiber determined from the CBR test sand was introduced
in to three different percentage (10%, 15%, and 20%) by dry weight of soil and Katcha fiber
mix. For this mixing the fiber and sand were added to a soil in dry state and mixed by hand as
shown in figure 3.5. After observing uniform distribution of fiber and sand on the clay soil mass,
water was added and wet mixing was conducted by hand.
After determining the optimum amount of sand, sand was introduced as a layer in a non-
conventional form to study the efficiency of using layers of sand for stabilization and it was
introduced in three possible distributions; first sand layer; a sand layer between one bottom soil-
fiber mix and three top soil-fiber mix layers, second sand layer a sand layer sandwiched between
two soil-fiber mix layers, and third sand layer a sand layer with three soil-fiber mix at the bottom
and followed by one soil-fiber mix layer at the top and CBR test was conducted for all positions
of the sand layer all replacement levels were made by mass.
While conducting mixing of clay soil and fiber difficulty was observed on the workability
property of the mix as the amount and length of fiber increased but this difficulty was solved as
sand was mixed to a soil.
3.6.2. Moisture Content
The moisture content is an indicator of the amount of water present in soil. The moisture content
of the soil samples were determined according to (ASTM-D2216, 1998) procedures, while the
moisture content (MCf ) and moisture regain (Mr) of katcha fiber was conducted in accordance
with (ASTM-D2495, 2007) procedures and the corresponding results were calculated according
to equation 3.1 and 3.2.

Investigation on the Application of Katcha Fiber as a Weak Subgrade Soil Reinforcement
Blended with Sand: In case of Koyefeche Project 18 Road Project
34 ASTU M.Sc. Geotechnical Engineering July 2021
𝑀𝐶𝑠 𝑎𝑛𝑑 𝑀𝑟 =(𝑀𝑜𝑠 − 𝑀𝑜𝑑) ∗ 100
𝑀𝑜𝑑… … … … … … … … … … … … … … … … … … … … … … 3.1
MCf =(Mos−Mod)∗100
𝑀𝑜𝑠… … … … … … … … … … … … … … … … … … … … … … … … … 3.2
Where Mos: mass of original sample, and Mod: mass of oven dry sample.
Drying oven, Balance, Moisture can, and Container Handling Apparatus (gloves, tongs) were
used to conduct this test.
3.6.3. Specific Gravity
The specific gravity (Gs) can be defend as the ratio of the mass of a given volume of a material
to the mass of an equal volume of water. In general it tells how much the material is lighter or
heavier than water. The test was conducted for native soil, sand, soil-sand mix, and katcha fiber.
Gs of soil was determined to be used in the particle size analysis for hydrometer test. The test
was conducted by following (ASTM-D854, 2002) procedure. To complete this test Pycnometer,
Balance, Drying Oven, and Hot plate capable of maintaining a temperature adequate to boil
water to remove entrapped air were used.
3.6.4. Particle Size Distribution
Grain size analysis is widely used in engineering classification of soils. It’s the quantitative
determination of the distribution of particle sizes in soils. The test can be performed in two
ways: Mechanical sieving for soils having relatively larger particle generally it used to identify
particles with a size greater than 75 μm and Hydrometer analysis performed for soil particle less
than 75 μm. The hydrometer test works based on Stokes’ low, which stats that the larger the
grain size, the greater it’s settling velocity in a fluid (Liu & Evett, 2000). Grain size analysis
was conducted for native soils and soil-sand mix in order to determine the effect of sand on the
gradation of the soil according to (ASTM-D422, 1998).
A hydrometer test was conducted by using solution of 40 g of sodium hexametaphosphate/liter
of solution. For hydrometer analysis 50 gram of soil and soil-sand mix passing sieve number 10
(2 mm) with three different percentage of sand was placed in the 150 milliliter beaker, for
samples tested with solution 125 milliliter of sodium hexametaphosphate solution (40 g/L) was
added and stirred until the soil is thoroughly wetted and allowed to soak for at least 16h and
immediately after dispersion, the soil-water slurry transferred to the glass sedimentation

Investigation on the Application of Katcha Fiber as a Weak Subgrade Soil Reinforcement
Blended with Sand: In case of Koyefeche Project 18 Road Project
35 ASTU M.Sc. Geotechnical Engineering July 2021
cylinder, and distilled water was added until the total volume is 1000 milliliter, a hydrometer
reading was conducted by using hydrometer 152H. Finally, the result from the two methods
were combined to produce the overall particle size distribution curve.
To accomplish both mechanical and hydrometer, Balances, Stirring Apparatus, Hydrometer
152H, Sedimentation Cylinder, Thermometer, Sieves, and Water Bath for maintaining the soil
suspension at a constant temperature during the hydrometer analysis were used.
3.6.5. Atterberg Limits Test
This test was conducted to determine the plastic limit (PL), Liquid Limit (LL), and the plasticity
index (PI) of the soils, and soil-sand mix by following the method given in (ASTM-D4318,
2000). Both the soil sample and sand used for the tests passed through number 40 (425 μm)
sieve and sand was mixed with a soil according to a specified proportion (10%, 15%, and 20%).
As stated in ASTM-D4318, LL is the water content, in percent, of a soil at the arbitrarily defined
boundary between the semi liquid and plastic states and it was determined by using the
Casagrande cup in which a groove is cut in the soil sample and the sample cup is raised and
dropped a specified number of times for the groove to barely close. The soil moisture content
at which this happens is termed as the liquid limit. The relationship between the water content
and number of blow is plotted on the graph and the water content corresponding to the
intersection of the line with the 25 blow abscissa is termed as the liquid limit of the soil.
The plastic limit is defined as the water content, in percent, of a soil at the boundary between
the plastic and semi-solid states, and it was determined by alternately pressing together and
rolling a soil into a 3 mm diameter thread until its water content is reduced to a point at which
the thread crumbles and can no longer be pressed together and re-rolled. The plasticity index
(PI) is calculated as the difference between the liquid limit and the plastic limit. Variations in
the LL, PL, and PI of native and sand mixed soils were then studied.
To conduct this tests in the laboratory, Liquid Limit Device (Casagrande cup), Flat Grooving
Tool, Spatula, Ground Glass Plate, Drying Oven, and Moisture Content Can were used.

Investigation on the Application of Katcha Fiber as a Weak Subgrade Soil Reinforcement
Blended with Sand: In case of Koyefeche Project 18 Road Project
36 ASTU M.Sc. Geotechnical Engineering July 2021
3.6.6. Soil Classification
The most widely used soil classification systems are AASHTO and USCS systems. For this
study both classification systems were used to classify the soils and soil sand mix by using
(ASTM-D2487, 1985; ASTM-D3282, 1997) respectively.
3.6.7. Determination of Volumetric Shrinkages
The volumetric shrinkage test is one of the Atterberg Limit tests used for determining the
shrinkage limit. This test was carried out in accordance with (ASTM-D427, 1998). The
shrinkage limit value obtained from the laboratory test can be used to evaluate the shrinkage
potential or possibility of development, of cracks in earthworks involving cohesive soils.
About 30 g of the soil samples and sand mixed soil passing number 40 (425 μm) sieve was
mixed with distilled water; the thoroughly mixed soil and soil sand paste was placed in the
shrinkage dish, and then allowed to dry in air for 24 h until the color of the soil turns from dark
to light and the sample was oven-dried to constant mass at 110oC. The volume of the dry soil
pat was determined by removing the pat from the shrinkage dish and immersing it in the glass
cup full of mercury.
The test was conducted for native soils and soil-sand mix. In order to accomplish the test
Evaporating Dish, Spatula, Shrinkage Dish, Glass Cup, Glass Plate, Balance, Mercury and
Shallow Pan were used.
3.6.8. Compaction Test
The compaction test is performed to understand the relationship between the dry density and
the moisture content of soil for some stated compaction energy. The compaction test can be
performed either by standard or modified procedure. For this study the Modified Compaction
tests were conducted by following (ASTM-D1557, 2000) procedures, to determine the MDD
and OMC of the investigated soils, soil-fiber mix, and soil-fiber-sand mix. The modified
compaction method was selected so that the density achieved in the laboratory would be closer
to those obtained by very heavy compaction equipment as employed in a road project.
ASTM D 1557-00 provide three alternative methods to determine the MDD and OMC of the
soil. Method A was followed since 20 % or less by mass of the soil was retained on the No. 4
(4.75-mm) sieve. According to this method the soil is compacted in five layers with 25 blows

Investigation on the Application of Katcha Fiber as a Weak Subgrade Soil Reinforcement
Blended with Sand: In case of Koyefeche Project 18 Road Project
37 ASTU M.Sc. Geotechnical Engineering July 2021
per layer by dropping 4.5Kg rammer from height of 457 mm in mold with 101.6 mm diameter.
The soil mixtures, with and without additives, were thoroughly mixed for one day prior to
compaction. The first series of compaction tests was aimed at determining the compaction
properties of native soils. The second series was carried out to determine the compaction
properties of the stabilized soils with varying amounts and length of Katcha fiber and natural
sand. All the soil samples and soil mix samples were not reused in the compaction test.
(a) (b) (c) (d)
Figure 3.5. Photographic view of (a) dry mix of clay soil and Katcha fiber; (b) preparation of
soil-fiber– sand mix, (c) mix preparation for compaction test (d) remold soil sample of
reinforced soil.
Different equipment including Mold with 101.6 mm average inside diameter, a height of 116.4
mm, and a volume of 944.cm3, manually operated Rammer with 4.54 Kg free falling from 457
mm height, Sample Extruder, Balance, 4.75mm opening Sieves, Mixing Tools, and plastic bags
were the main equipment which were used in the laboratory.
3.6.9. California Bearing Ratio Test
The CBR test is a test which used to indicate the strength of subgrade, sub base, and base course
materials for road pavement. In this study CBR test of soils with and without reinforcement and
sand mixing was conducted in accordance to (ASTM-D1883, 1999) procedures to study the
influence of length and content of kerosene coated Katcha fiber and effect of sand on CBR
values. For the preparation of reinforced soil samples, the desired amount of kerosene coated
Katcha fiber was randomly mixed in dry state before the addition of water. Then the water

Investigation on the Application of Katcha Fiber as a Weak Subgrade Soil Reinforcement
Blended with Sand: In case of Koyefeche Project 18 Road Project
38 ASTU M.Sc. Geotechnical Engineering July 2021
corresponding to OMC was added, mixed thoroughly and the samples were compacted to MDD
with five approximately equal layers in the CBR mould, each layer subjected to 56 uniformly
distributed blows by using rammer of 4.5 Kg. The same procedure was implemented when the
sand was added to the soil Katcha fiber composite. Samples from native soil and each soil
mixture have been tested after being soaked in water for 96 hours. The soaked condition
simulates the behavior of subgrade under heavy rainfall or flooded situations.
a b
Figure 3.6. photographic view of (a) Soaked CBR and (b) CBR Reading
The CBR value is calculated at 2.54 mm penetration since the CBR value decreases as the
penetration increases. Occasionally, the ratio at 5.08 mm depth is higher than 2.54 mm depth
and test must be repeated. If the check test shows similar results, the stress from 5.08 mm
penetration depth is taken as CBR value. The CBR value in %, was calculated according to
equation 3.3.
𝐶𝐵𝑅(%) =𝐿𝑜𝑎𝑑 𝑎𝑡 2.54𝑚𝑚 𝑜𝑟 5 𝑚𝑚
𝑆𝑡𝑎𝑛𝑑𝑎𝑟𝑑 𝑙𝑜𝑎𝑑 𝑎𝑡 2.54𝑚𝑚 𝑜𝑟 5𝑚𝑚∗ 100 … … … … … … … … … … … … … … … … … 3.3
To complete the full laboratory test, Loading Machine, Mold with diameter of 152.4 mm and a
height of 177.8 mm, Spacer Disk with 150.8 mm diameter and 61.37 mm in height, 4.5 kg

Investigation on the Application of Katcha Fiber as a Weak Subgrade Soil Reinforcement
Blended with Sand: In case of Koyefeche Project 18 Road Project
39 ASTU M.Sc. Geotechnical Engineering July 2021
Rammer, two Weights (surcharge weight) each of 2.27kg a total of 4.5kg used to simulate the
weight of the pavement and other loads specified, Expansion-Measuring Apparatus (tripod
supporting dial gage) and Gages for measuring the amount of swell during soaking and other
general apparatus such as mixing bowl, soaking tank, draying can and oven were used.
3.6.10. Unconfined Compressive Strength Test
The unconfined compressive strength of a soil mostly conducted for cohesive soils to investigate
the approximate shear strength in terms of total stress. In this test method, UCS is taken as the
maximum load attained per unit area and the shear strength (Cu), was calculated to be half of
the compressive stress at failure (ASTM-D2166, 2000).
This test was conducted in the laboratory for native soil, soil-fiber and soil-fiber- sand mixture
according to (ASTM-D2166, 2000) procedures. The soil samples and sand which passed
through sieve number 4 (4.75mm) used to prepare the remolded sample of 37 mm diameter and
74 mm height using OMC of a soil, soil-fiber-mix and soil-fiber-sand mix from compaction.
(a) (b) (c)
Figure 3.7. The photographic view of (a) pure soil; (b) 1% and 35 mm reinforced soil and (c)
reinforced soil with 20% sand
Compression Device, Sample Extruder, Deformation Indicator, Dial Comparator, Timer, and
Balance were used. Since the soil samples in the research were not soft Vernier calipers were
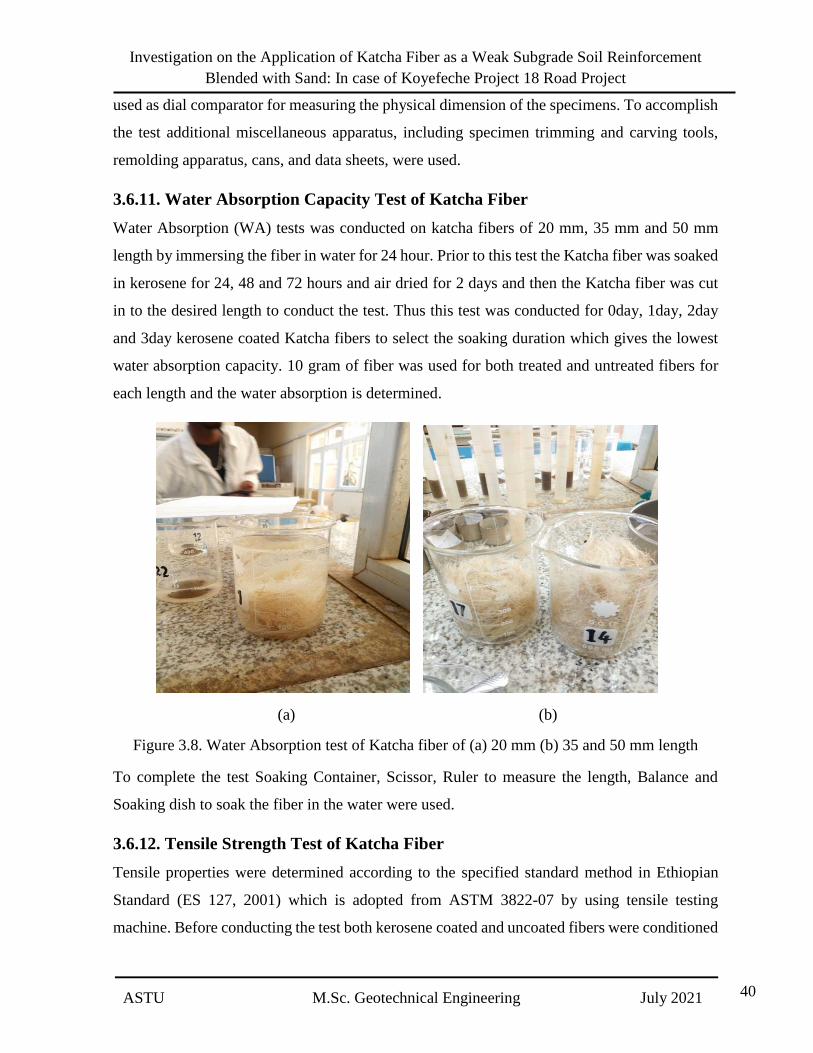
Investigation on the Application of Katcha Fiber as a Weak Subgrade Soil Reinforcement
Blended with Sand: In case of Koyefeche Project 18 Road Project
40 ASTU M.Sc. Geotechnical Engineering July 2021
used as dial comparator for measuring the physical dimension of the specimens. To accomplish
the test additional miscellaneous apparatus, including specimen trimming and carving tools,
remolding apparatus, cans, and data sheets, were used.
3.6.11. Water Absorption Capacity Test of Katcha Fiber
Water Absorption (WA) tests was conducted on katcha fibers of 20 mm, 35 mm and 50 mm
length by immersing the fiber in water for 24 hour. Prior to this test the Katcha fiber was soaked
in kerosene for 24, 48 and 72 hours and air dried for 2 days and then the Katcha fiber was cut
in to the desired length to conduct the test. Thus this test was conducted for 0day, 1day, 2day
and 3day kerosene coated Katcha fibers to select the soaking duration which gives the lowest
water absorption capacity. 10 gram of fiber was used for both treated and untreated fibers for
each length and the water absorption is determined.
(a) (b)
Figure 3.8. Water Absorption test of Katcha fiber of (a) 20 mm (b) 35 and 50 mm length
To complete the test Soaking Container, Scissor, Ruler to measure the length, Balance and
Soaking dish to soak the fiber in the water were used.
3.6.12. Tensile Strength Test of Katcha Fiber
Tensile properties were determined according to the specified standard method in Ethiopian
Standard (ES 127, 2001) which is adopted from ASTM 3822-07 by using tensile testing
machine. Before conducting the test both kerosene coated and uncoated fibers were conditioned

Investigation on the Application of Katcha Fiber as a Weak Subgrade Soil Reinforcement
Blended with Sand: In case of Koyefeche Project 18 Road Project
41 ASTU M.Sc. Geotechnical Engineering July 2021
for 24 hours by exposing them to freely moving air in an atmosphere having a relatively
humidity of 25% and a temperature of 25o c . Nearly 20 individual fibers were randomly tested
by using a gauge length of 200 mm and 600 mm for both Kerosene coated and uncoated fiber,
with a speed of 10mm/min and then average values of the readings were calculated. in the
second face additional 5 bundles of fiber each contains 65 single strand fiber were randomly
tested by using a gauge length of 200 mm and 600 mm for both coated and uncoated fibers,
with a speed of 10 mm/min and then average values of the readings were calculated and the
tensile strength of individual fiber is obtained by dividing the tensile strength of bundle of fibers
to a number of fibers this test is conducted to compare the result obtained from individual fiber
length test.
(a) (b) (c)
Figure 3.9. Photographic view of tensile strength test of Katcha fiber (a) 600 mm length, (b)
200 mm length Katcha fiber and (c) 200 mm length single strand Katcha fiber
The tensile strength, T in Mpa, was calculated according to equation 3.4
𝑇 =𝐹
𝐴… … … … … … … … … … … … … … … … … … … … … … … … … … … . . … … … 3.4
Where F: Tensile force exerted in newton (N) and
A: Cross-sectional area of the fiber in square millimeter (mm2). Since the fiber is almost circular
through all its length, the cross-section was assumed to be circular.

Investigation on the Application of Katcha Fiber as a Weak Subgrade Soil Reinforcement
Blended with Sand: In case of Koyefeche Project 18 Road Project
42 ASTU M.Sc. Geotechnical Engineering July 2021
CHAPTER FOUR
RESULTS AND DISCUSSIONS
4.1. Introduction
The analysis part was carried out based on the results obtained from the laboratory tests on soil
samples, soil sand mix, soil-fiber mix and soil-fiber-sand mix. Results obtained from the
experiment program were analyzed and interpreted using the statistical description method.
4.2. Properties of Natural soils
The first laboratory tests were conducted on soil samples from test Pit 1 and Pit 2 to analyze the
behavior of each soil sample and to identify weaker soil. The results obtained from the
identification test are presented in table 4.1.
Table 4.1. Properties of Natural Soils
Test Type Soil Test Results
Pit 1 Pit 2
NMC (%)
25.51 22.9
Specific Gravity 2.73 2.78
Atterberg Limit
Liquid Limit%
Plastic Limit%
Plastic Index%
75.40
44.60
30.80
70.40
44.60
25.80 Sieve Analysis
Clay%
Silt%
Sand %
Gravel %
39.71
48.00
7.07
5.17
7.39
25.76
48.84
18.00 Percent Passing No. 200 sieve 87.77 33.15
Soil Classification
AASHTO Classification
Unified Soil Classification
A-7-5 (35)
MH
A-2-7(3)
SM
Modified Compaction
MDD %
OMC %
1.4
30.3
1.47
28.75
CBR % 1.76 2.11

Investigation on the Application of Katcha Fiber as a Weak Subgrade Soil Reinforcement
Blended with Sand: In case of Koyefeche Project 18 Road Project
43 ASTU M.Sc. Geotechnical Engineering July 2021
The grain size distribution of the soils has been determined by both the wet sieve and
hydrometer analysis in according with (ASTM-D422, 1998). Results from the two methods
were combined by using accepted standards and the particle size distribution curves that are
shown in Figure 4.1 were generated. Particle size distribution curve for soil samples from Pit 1
and Pit 2 shows that about 87.77% and 33.15% of the soil passes through No. 200 sieve
respectively. The LL, PL and PI of the soil sample from pit 1 were determined to be 75.4%,
44.6%, and 30.8% while the value of LL, PL, and PI of the soil sample from pit 2 was 70.4%,
44.6%, and 25.8%. The consistency test result of the soil samples showed that the PL of the two
soils is similar while the LL of Pit 1 soil is higher than Pit 2. The variation in LL resulted
different value of PI. The PI value of the soils indicates that Pit 1 is highly plastic than Pit 2.
According to the AASHTO classification, the soil from Pit 1 lays under group A-7-5 (35), which
have fair to poor subgrade material property and soil sample from Pit 2 lays under A-2-7(3)
group, which are generally rated as excellent to good subgrade material property, according to
USCS the soil from Pit 1 grouped under MH (inorganic silt with high plasticity) and Pit 2 lays
under the group SM (Silty sand).
Figure 4.1. Grain size distribution curve of Natural Soils
0
10
20
30
40
50
60
70
80
90
100
0.00010.0010.010.1110100
Per
cent
Pas
s (%
)
Grain Size (mm)
Pit 1
Pit 2
Cobble Gravel Sand Size Fine Grained
Silt Clay

Investigation on the Application of Katcha Fiber as a Weak Subgrade Soil Reinforcement
Blended with Sand: In case of Koyefeche Project 18 Road Project
44 ASTU M.Sc. Geotechnical Engineering July 2021
The specific gravity of the soils was found to be 2.73 and 2.78 for soil samples of Pit 1 and Pit
2 respectively, the results lays within the range of 2.7-2.8 that is for inorganic clayey soils
classification according to (Liu & Evett, 2000).
The soil from Pit 1 has MDD of 1.4 g/cm3 and OMC of 30.3% and the soil from Pit 2 has MDD
of 1.47g/cm3 and OMC of 28.75%. The soaked CBR value of the soils was found to be 1.76%
and 2.11% with percent swell of 7.46% and 7.0% for pit 1 and pit 2 soil samples respectively.
ERA Pavement Design manual assigns the subgrade material strength for design to six strength
classes reflecting the sensitivity of thickness design to subgrade strength (ERA Pavement
Design Manuals, 2013). The CBR value of both soils in this research lays under the S1 class
which represents a subgrade material with a CBR value of less than 3% but as it is stated in the
manual, subgrades with CBR value less than 2%, required special treatment otherwise a cut and
fill is needed. Therefore, from AASHTO classification and from CBR value; soil sample from
Pit 1 with a CBR value of 1.76 % was selected for stabilization.
4.3. Properties of Sand
The sand used as a stabilizer for this research is characterized by the following properties
obtained from the laboratory tests: Gs= 2.66, LL= 28.5 (%), PL= 0 (%), PI= 28.5%, Gravel=
3.52%, Sand= 95.98% and Fine= 0.5%. Figure 4.2 shows the grain size distribution of the sand.
Figure 4.2. Grain size distribution curve of sand
0
10
20
30
40
50
60
70
80
90
100
0.00010.0010.010.1110100
Per
cent
Pas
s (%
)
Grain Size (mm)
Sand
CobbleGravel Sand Size Fine Grained
Silt Clay

Investigation on the Application of Katcha Fiber as a Weak Subgrade Soil Reinforcement
Blended with Sand: In case of Koyefeche Project 18 Road Project
45 ASTU M.Sc. Geotechnical Engineering July 2021
4.4. Properties of Katcha Fiber
The physical and tensile properties of Katcha fibers were studied in terms of diameter, specific
gravity, moisture content and regain, the water absorption capacity of kerosene treated and
untreated fiber and tensile strength of both treated and untreated fiber. The test results revealed
that the individual fibers showed average diameter of 128µm, Specific gravity of 1.12, the Gs
of katcha fiber is almost the same as the Gs of other natural fibers like jute (Aggarwal & Sharma,
2010). The moisture content and moisture regain were determined as 12.3%, and 13.64% for
uncoated and 11.1% and 11.36% for coated katcha fiber respectively as it can be seen from the
test result the moisture content and moisture regain of treated fiber is less than that of untreated
fiber this might have resulted from air drying process and effect of Kerosene of Kerosene coated
katcha fiber.
Moreover, the tensile strength test was conducted on both kerosene coated and uncoated fibers
of two different lengths, 200 and 600 mm. From the single tensile strength test, the average
tensile strength of kerosene coated fiber was found to be 403.55Mpa and 314.46Mpa for 200
mm and 600 mm respectively and for uncoated fiber it is found to be 340.74Mpa for 200 mm
and 302.5Mpa for 600 mm fiber length. And also the strength calculated from bundles of fiber
found to be 415.25Mpa and 321.86Mpa for kerosene coated Katcha fiber of 200 and 600 mm
length and 343.33Mpa and 313.81Mpa for uncoated fiber of 200 and 600 mm length. As it can
be seen from the result the tensile strength obtained from the bundles of fiber is greater than the
strength obtained from the individual fiber for both fibers; this increase might be attributed from
the effect of group of fiber but the variation is not that much significant.
The tensile strength test result showed that the shorter the fiber length attributed to the higher
tensile strength which agreed with a statement stated in (ASTM-D3822, 2007). Similar findings
have been reported in other experimental works on the characterization of Katcha fiber (Teli &
Terega, 2017) and also it was observed that kerosene coating increased the tensile strength.
4.4.1. Effect of Kerosene on Water Absorption Capacity of Katcha Fiber
This test is conducted to determine the effect of kerosene on the water absorption capacity of
Katcha fiber. Table 4.2 shows the effect of Kerosene soaking duration on the water absorption
capacity of Katcha fiber. The moisture content of both treated and untreated fiber was
determined based on (ASTM-D2495, 2007).

Investigation on the Application of Katcha Fiber as a Weak Subgrade Soil Reinforcement
Blended with Sand: In case of Koyefeche Project 18 Road Project
46 ASTU M.Sc. Geotechnical Engineering July 2021
Table 4.2. Water Absorption Capacity of Kerosene coated and uncoated Katcha fiber
Fiber Condition
Fiber Length
(mm)
Moisture
Content (%)
Average Moisture
Content (%)
Percent
Reduced
Untreated fiber 20
304
303.01 -
302.02
313
1day kerosene
soaked fiber 20
212.87
204.435 32.532
196
215
2days kerosene
soaked fiber 20
137
136.815 55.435
136.63
154
3days kerosene
soaked fiber 20
129.29
127.145 58.039
125
146
It is noticed that the maximum reduction is observed for 2 and 3 days soaked fiber. 2 days
soaking reduces the WAC by 55.43% and 3 days soaking reduced by 58.039% figure 4.3
illustrate the WAC reduction of Katcha fiber. Similar behavior was also observed in the
literature kerosene coated coir fiber-reinforced expansive soil by (Ramasubbarao, 2014).
0 10 20 30 40 50 60 70 80
0
10
20
30
40
50
60
Wat
er A
bsor
ptio
n R
educ
tion
(%)
Kerosene Soaking Duration (Hour)
20 mm Fiber length
Figure 4.3. Effect of Kerosene Soaking on Water Absorption Capacity of Katcha Fiber

Investigation on the Application of Katcha Fiber as a Weak Subgrade Soil Reinforcement
Blended with Sand: In case of Koyefeche Project 18 Road Project
47 ASTU M.Sc. Geotechnical Engineering July 2021
The explanation of reduction in WAC of kerosene coated fiber is probably a consequence of the
following reasons: (1) the Kerosene coating causes the surface of fiber hydrophobic and hence
alters the moisture absorption of the Katcha fiber without reducing its strength and (2) Kerosene
coating physically prevent the entry of moisture into the fiber, and it makes fiber more durable
in addition to the natural content of Hemicellulose (19% -22.47%) and Lignin(5%-6.88%)
(Esayas et al., 2018; Gowthaman et al., 2018; Teli & Terega, 2017; Temesgen & Sahu, 2014).
Thus soaking of Katcha fiber in kerosene reduced the water absorption affinity, it can be said
that the durability of kerosene coated Katcha fiber is increased against biological degradation.
Based on WAC test 3days kerosene soaking of fiber was selected for reinforcement since the
list WAC is found for 3 days kerosene soaking Katcha fiber.
Table 4.4. Physical and Tensile properties of Katcha Fibers
Fiber property Fiber condition
Uncoated Fiber 3 Days kerosene Coated Fiber
Diameter (mm) 0.128 0.128
Specific Gravity Gs 1.12 1.12
Tensile strength (MPa)
200 mm 600mm 200mm 600mm
340.740 302.5 403.55 314.46
Moisture content (MC) % 12.30 11.10
Moisture regain (MR) % 13.64 11.36
4.5. Effect of sand on Index property of soil
4.5.1. Effect of Sand on Particle Size Distribution of Soil
Grain size analysis was conducted on four samples soil, i.e. unmixed soil, 10%, 15%, and 20%
sand mixed soil samples by following (ASTM-D422, 1998) procedures. The grain size
distribution of the soil and mixed soils with different percent of sand is shown in Figure 4.4.

Investigation on the Application of Katcha Fiber as a Weak Subgrade Soil Reinforcement
Blended with Sand: In case of Koyefeche Project 18 Road Project
48 ASTU M.Sc. Geotechnical Engineering July 2021
Figure 4.4. Grain size distribution curve of the natural soils and soil-sand mix
It is clearly seen from Figure 4.4 that percentage passing No. 200 sieve (0.075 mm) reduced
from 87.77% to 76.87%, 73.13% and 69.15% for 10%, 15% and 20% sand mix respectively, as
the percentage of sand increased the content of gravel, sand and fines varied significantly.
Table 4.5. Percent Gravel, Sand and Fines of Soil + Sand
Soil mixture Gravel (%) Sand (%) Fines (%)
100% Soil and 0 Sand %
90% soil and 10% Sand
85 % Soil and 15% Sand
80 % Soil and 20% Sand
5.16 7.07 87.77
5.60 17.53 76.87
6.00 20.87 73.13
6.16 24.69 69.15
For 20% sand mixed in a soil, the percentage of fines has reduced by 21.21%, and percent of
gravel and sand content increased by 19.38%% and 249.22% respectively. It can be concluded
that sand is an effective stabilizer to reduce the percent fines and increase percent of gravel and
sand of a soil.
0
10
20
30
40
50
60
70
80
90
100
0.00010.0010.010.1110100
Per
cent
Pas
s (%
)
Grain Size (mm)
100% soil and
0% sand
90% Soil and
10% Sand
85% soil and
15% sand
80% soil and 20
% sand
Cobble Gravel Sand Size Fine Grained
Silt Clay

Investigation on the Application of Katcha Fiber as a Weak Subgrade Soil Reinforcement
Blended with Sand: In case of Koyefeche Project 18 Road Project
49 ASTU M.Sc. Geotechnical Engineering July 2021
4.5.2. Effect of Sand on Atterberg Limits
The sand used for this research has lower LL and zero PL. Thus the introduction of sand into
the soil resulted in a general decrease in LL and PI of a soil. Table 4.6 presents the results of
Atterberg limits value determined under different sand contents.
Table 4.6. Atterberg Limits of the studied mixtures.
Soil mixture LL PL PI
100% Soil and 0 Sand %
90% soil and 10% Sand
85 % Soil and 15% Sand
80 % Soil and 20% Sand
75.4 44.60 30.80
67.5 42.47 25.03
62.5 40.28 22.22
60.0 38.89 21.11
The LL, PL, and PI variations for both native and mixed soils are also shown in figure 4.5. As
the percent of sand increased from 0% to 20%, LL, PL, and PI of a soils reduced, this is due to
the fact that the percent fines, which is responsible for the plasticity of the soil, is reduced by
mixing of sand. It is observed that the addition of 20% sand was sufficient to enhance
workability of the soil by reducing the PI from 30.80% to 21.11%. Similar behavior was found
by other experimental work on stabilization of soil by sand (Kollaros & Athanasopoulou, 2017).
0 5 10 15 20
20
30
40
50
60
70
80
Moi
sture
Con
tent
(%)
Sand Content (%)
LL
PL
PI
Figure 4.5. Atterberg Limits of Soil mixtures with varying sand content.

Investigation on the Application of Katcha Fiber as a Weak Subgrade Soil Reinforcement
Blended with Sand: In case of Koyefeche Project 18 Road Project
50 ASTU M.Sc. Geotechnical Engineering July 2021
The Casagrande plasticity chart was drawn as shown in figure 4.6 to classify the soil and soil
sand mix. It is clearly seen from the figure 4.6 that the soil is categorized as MH (inorganic silt
of high plasticity) class. After the addition of sand, the mixed soil also falls in the same class of
MH soil, however, the LL and PI of soil decreased which showed a decrease in plasticity.
Figure 4.6. The Casagrande Plasticity chart of soil and Sand mixed soils
According to AASHTO classification system the native soil classified as A-7-5 (35) however
sand mixing changed the soil class from A-7-5 (35) to A-7-5 (23), A-7-5 (19) and A-7-5 (16)
for 10%, 15% and 20% sand respectively. According (ERA Pavement Design Manuals, 2013),
soil having GI of 20 or more indicates a poor subgrade material. Mixing of 15% and 20% sand
reduces the GI from 35 to 19 and 16 respectively.
4.5.3. Effect of Sand on Specific Gravity of Soil
The Specific Gravity Gs of the soil samples and soil-sand mix was determined using (ASTM-
D854, 2002). Table 4 .7 show Gs of soil and soil sand mix of different proportions.
Table 4.7. The specific gravity of the studied soils and soil sand mix
Soil mixture Specific Gravity (Gs)
100%Soil and 0 Sand %
90% soil and 10% Sand
85 % Soil and 15% Sand
80 % Soil and 20% Sand
2.73
2.62
2.64
2.59
0
10
20
30
40
50
60
0 10 20 30 40 50 60 70 80 90 100 110
Pla
stic
ity I
nd
ex (
%)
Liquid limit (%)
Soil
10% Sand
15% Sand
20% Sand

Investigation on the Application of Katcha Fiber as a Weak Subgrade Soil Reinforcement
Blended with Sand: In case of Koyefeche Project 18 Road Project
51 ASTU M.Sc. Geotechnical Engineering July 2021
As it is seen the Gs of the soil changed from 2.73 to 2.59 with increasing of sand. (Liu & Evett,
2000) suggested that Gs of inorganic clay soil is in the range of 2.7–2.80 and Gs of silty sand is
in the range of 2.67 to 2.7. The result indicates that the Gs changed from clay to silty sand.
4.5.4. Effect of Sand on Volumetric Shrinkage
The volumetric shrinkage is used for determining the shrinkage limit of a soil. It is defined as
the moisture content at which the soil does not undergo any further change in volume with loss
of moisture. This test was carried out in accordance with (ASTM-D427, 1998).
Table 4.8. Volumetric shrinkage test results for soil and soil-sand mix
Soil mixture Shrinkage Limit %
100%Soil and 0 Sand % 18.15
90% soil and 10% Sand 14.36
85 % Soil and 15% Sand 11.39
80 % Soil and 20% Sand 7.05
As it is illustrated in Table 4.8. The volumetric shrinkage of a soil reduced by 20.88%, 37.25%
and 61.16% as sand content increased from 10% to 20%. The reduction obtained by mixing of
20% sand is more than 50%, thus the result obtained by sand mixing can be taken as a promising
result to reduce the occurrence of desiccation crack in a clay soil mass.
0 5 10 15 20
0
2
4
6
8
10
12
14
16
18
20
Shrin
kage
Lim
it (%
)
Sand Content (%)
Figure 4.7. Variation in shrinkage limit of soil with varying amounts of sand

Investigation on the Application of Katcha Fiber as a Weak Subgrade Soil Reinforcement
Blended with Sand: In case of Koyefeche Project 18 Road Project
52 ASTU M.Sc. Geotechnical Engineering July 2021
4.6. Effect of Katcha fiber on Soil Property
The kerosene coated Katcha fiber of 20, 35, and 50 mm was mixed to the soil as 0.5%, 1% and
1.5% by dry weight of the soil for each length. A total of nine combinations thus were studied.
4.6.1. Effect of Katcha fiber on Compaction Characteristics of Soil
The compaction test was performed to determine the effect of Katcha fiber (length and percent)
on OMC and MDD of the studied soil. The test is conducted by using modified compaction
effort by following (ASTM-D1557, 2000) procedures.
20 25 30 35 40 45
1.15
1.20
1.25
1.30
1.35
1.40
Dry
Den
sity
(K
g/c
m3)
Water Content (%)
Soil
0.5% fiber length of 20 mm
0.5% fiber length of 35 mm
0.5% fiber length of 50 mm
1% fiber length of 20 mm
1% fiber length of 35 mm
1% fiber length of 50 mm
1.5% fiber length of 20 mm
1.5% fiber length of 35 mm
1.5% fiber length of 50 mm
Figure 4.8. Combined compaction curve of soil and reinforced soil
It is clearly seen from Figure 4.8 that the MDD decreases from 1.4gm/cm3 to 1.25gm/cm3 and
OMC increase from 30.3% to 37.5% when the Katcha fiber content increases from 0% to 1.5%
for each fiber length.
Table4.9 illustrated the effect of adding fiber on the compaction properties of the soil sample
and reinforced soil. It can be clearly seen that adding kerosene coated fiber increased the OMC
and decreased the MDD with increasing fiber length and content.

Investigation on the Application of Katcha Fiber as a Weak Subgrade Soil Reinforcement
Blended with Sand: In case of Koyefeche Project 18 Road Project
53 ASTU M.Sc. Geotechnical Engineering July 2021
Table 4.9. Compaction property of Soil and Reinforced soil sample.
Test type
Soil
Mixed soil with Fiber
0.5% Fiber 1% Fiber 1.5% Fiber
Fiber Length (mm)
Modified Procter
density
1.40
30.3
20 35 50 20 35 50 20 35 50
1.39
31.0
1.37
32.0
1.35
32.57
1.345
32.77
1.33
33.33
1.3
33.5
1.28
34.00
1.26
36.0
1.25
37.5
MDD (g/cm3)
OMC (%)
As it can be seen in the table the increase in OMC and decrease in MDD occur gradually with
the increase in fiber content and fiber length. Similar behavior was also observed in different
literatures which study about the natural fiber reinforced soils (Babu, 2019; Bawadi et al., 2020;
Lakshmi et al., 2018; Mohan et al., 2018; Sandyarani et al., 2018; Tirfu, 2018).
The relationship between the OMC and MDD with respect to fiber content and length are shown
in Figure. 4.9 (a) and (b) and Figure 4.10 (a) and (b), it is apparently seen that the results
obtained from the compaction test of the studied soil and reinforced soil samples that the OMC
increased and MDD decreased with increasing of fiber content and length.
MD
D (
gm
/cm
3)
Fiber Content (%)
20 mm
35 mm
50 mm
0.0 0.2 0.4 0.6 0.8 1.0 1.2 1.4 1.6
30
31
32
33
34
35
36
37
38
OM
C (
%)
Fiber Contenet (%)
20 mm
35 mm
50 mm
(a) (b)
Figure 4.9. Effect of fiber content on (a) MDD; and (b) OMC of reinforced soil

Investigation on the Application of Katcha Fiber as a Weak Subgrade Soil Reinforcement
Blended with Sand: In case of Koyefeche Project 18 Road Project
54 ASTU M.Sc. Geotechnical Engineering July 2021
From figure 4.9 (a) and (b) it can be seen that for the same fiber length, as the percentage of
fiber increases, MDD decreases and the OMC increase gradually. Higher value of MDD and
lower value of OMC of a reinforced soil is recorded at 0.5% fiber content and lower value of
MDD and higher value of OMC is obtained at 1.5% fiber content of 50 mm fiber lengths.
0 10 20 30 40 50
1.24
1.26
1.28
1.30
1.32
1.34
1.36
1.38
1.40
1.42
MD
D (
gm
/cm
3)
Fiber Length (mm)
0.5% Fiber
1% Fiber
1.5% Fiber
0 10 20 30 40 50
30
31
32
33
34
35
36
37
38
OM
C (
%)
Fiber Length (mm)
0.5% Fiber
1% Fiber
1.5 % Fiber
(a) (b)
Figure 4.10. Effect of Katcha fiber length on (a) MDD; and (b) OMC of reinforced soil
Figure 4.10 (a) and (b) shows that the length of Katcha fiber and MDD are inversely related, as
the fiber length increases the MDD decreases while the OMC is directly related with fiber
length. From the results it can observed that as the length of fiber increased from 20 mm to 50
mm, MDD decreased meanwhile OMC increased.
Table 4.10. Summary of MDD and OMC Property of reinforced soil
Generally adding of fiber increased OMC and decreased the MDD when compared to 100%
Fiber
content
(%)
Length
(mm)
MDD
(gm/cm3)
OMC
(%)
Decrease in
MDD (%)
Increase in
OMC (%)
0.5
0.00 1.40 30.30 - -
20 1.39 31.00 0.71 2.31
35 1.37 32.00 2.14 5.61
50 1.36 32.57 2.86 7.49
1
0.00 1.40 30.30 - -
20 1.35 32.77 3.57 8.15
35 1.33 33.33 5.00 10
50 1.30 33.50 7.14 10.56
1.5
0.00 1.40 30.30 - -
20 1.28 34.00 8.57 12.21
35 1.26 35.70 10.00 17.82
50 1.25 37.50 10.71 23.76

Investigation on the Application of Katcha Fiber as a Weak Subgrade Soil Reinforcement
Blended with Sand: In case of Koyefeche Project 18 Road Project
55 ASTU M.Sc. Geotechnical Engineering July 2021
soil sample. The explanation of this behavior is probably a consequence of the following
reasons: (1) the light weightiness of fiber, hence alters the MDD of the soils; the specific gravity
of fiber is generally lower than that of soil tested; (2) water absorbent characteristic of Katcha
fiber, as the content of fiber increased in the soil mass the soil fiber matrix become more water
absorbent than the soil alone and (3) the fiber length also attribute to the increase in OMC and
decrease in MDD because as the length of fiber increases the WAC also increased.
4.6.2. Effect of Katcha fiber on CBR and Percent Swell of Soil
CBR test is the most suitable test to quantify the quality of compacted subgrade material. The
load versus penetration graph of unreinforced and reinforced soil are shown in Figure 4.11.
0 1 2 3 4 5 6 7 8
0.0
0.2
0.4
0.6
0.8
Loa
d (K
N)
Penetration (mm)
Soil
Soil + 0.5% Fiber (20 mm)
Soil + 0.5% Fiber (35 mm)
Soil + 0.5% Fiber (50 mm)
Soil + 1% Fiber (20 mm)
Soil + 1% Fiber (35 mm)
Soil + 1% Fiber (50 mm)
Soil + 1.5% Fiber (20 mm)
Soil + 1.5% Fiber (35 mm)
Soil + 1.5% Fiber (50 mm)
Figure 4.11. Load Versus Penetration Curve of Unreinforced and Reinforced soil samples
The CBR value is calculated from the load versus penetration curve and the results showed that
the CBR increased for all fiber content and length regardless of decreasing MDD. This
increment may be attributed from the reinforcement effect of Katcha fiber.

Investigation on the Application of Katcha Fiber as a Weak Subgrade Soil Reinforcement
Blended with Sand: In case of Koyefeche Project 18 Road Project
56 ASTU M.Sc. Geotechnical Engineering July 2021
0 10 20 30 40 50
2.0
2.5
3.0
3.5
4.0
4.5
5.0
5.5
CB
R (
%)
Fiber Length (mm)
0.5% Fiber
1% Fiber
1.5% Fiber
0.0 0.2 0.4 0.6 0.8 1.0 1.2 1.4 1.6
2.0
2.5
3.0
3.5
4.0
4.5
5.0
5.5
CB
R (
%)
Fiber Conten (%)
20 mm length
35 mm length
50 mm length
(a) (b)
Figure 4.12. CBR of reinforced soil with respect to (a) fiber length and (b) fiber content
It should be noted from Figure 4.12 CBR value greater than 2% was attained by reinforcing the
soil, which shift subgrade strength class of a soil from S1 with CBR value of < 3% to subgrade
strength class of S2 and S3 with CBR value of 3% and 4% and 5%, 6% and 7% respectively
(ERA Pavement Design Manuals, 2013) for all reinforced soil samples. It is observed from the
figure that as the fiber content and length increased the CBR value of soil also increased.
0.0 0.2 0.4 0.6 0.8 1.0 1.2 1.4 1.6
5.0
5.5
6.0
6.5
7.0
7.5
Perc
en
t S
well
(%
)
Fiber Content (%)
20 mm Fiber
35 mm Fiber
50 mm Fiber
0 10 20 30 40 50
5.0
5.5
6.0
6.5
7.0
7.5
Perc
en
t S
well
(%
)
Fiber Length (mm)
0.5% Fiber
1% Fiber
1.5% Fiber
(a) (b)
Figure 4.13. Percent swell values of reinforced soil (a) fiber content and (b) fiber length
The Katcha fiber has decreased the percent swell value from 7.46 % to 5.00% with an increase
in fiber content from 0% to 1%. It should be noted from Figure. 13 that a 5% minimum swell
value required for pavement subgrades was thus attained by 1% and 35 mm length reinforced

Investigation on the Application of Katcha Fiber as a Weak Subgrade Soil Reinforcement
Blended with Sand: In case of Koyefeche Project 18 Road Project
57 ASTU M.Sc. Geotechnical Engineering July 2021
soil samples. At 1.5% katcha fiber the swell percent of reinforced soil increased however the
recorded percent swell is lower than that of unreinforced soil.
Table 4.11. CBR and Percent Swell values of the reinforced and unreinforced soil
Length
(mm)
Fiber
content
(%)
CBR
(%)
Percent
swell (%)
Increase
in CBR
(%)
Decrease
in Swell
(%)
20
0.00 1.76 7.46 - -
0.50 2.99 6.76 69.89 9.34
1.00 4.39 5.30 149.43 28.95
1.50 3.34 5.82 89.77 21.98
35
0.00 1.76 7.46 - -
0.50 3.16 6.29 79.55 15.68
1.00 5.09 5.06 189.20 32.17
1.50 2.99 6.07 69.89 18.63
50
0.00 1.76 7.46 - -
0.50 2.99 6.11 69.89 18.1
1.00 3.69 5.69 109.66 23.73
1.50 2.63 6.28 49.43 15.82
The highest CBR value and lowest swell of a reinforced soil was recorded for 1% of 35 mm
fiber length. The explanation of the increase in CBR value and reduction in swell percent is
probably due to the following reasons: (1) randomly distributed Katcha fiber in a soil mass
improves the load-deformation behavior by interacting with the soil particles mechanically
through surface friction and interlocking. (2) the interlock transfers the stress from the soil to
the discrete fibers by mobilizing the tensile strength of the discrete fibers. Thus, fiber
reinforcement works as frictional and tension resistance elements. However, further increment
of Katcha fiber beyond optimum fiber content and length attributed to the reduction in CBR
value and increase in percent swell this may be due to the local aggregation and balling of fiber
in the soil matrix without creating interlocking with the soil particle and increasing water-
absorbing characteristic of Katcha fiber.
4.7. Effect of Sand on Reinforced Soil
After determining the optimum fiber content of a reinforced soil from CBR, sand was introduced
to the reinforced soil in to two forms by mixing with the soil and as a layer.

Investigation on the Application of Katcha Fiber as a Weak Subgrade Soil Reinforcement
Blended with Sand: In case of Koyefeche Project 18 Road Project
58 ASTU M.Sc. Geotechnical Engineering July 2021
4.7.1. Effect of Sand on Compaction Characteristic of Reinforced Soil
A modified compaction test was employed to determine the OMC and MDD of reinforced sand
mixed soil by following (ASTM-D1557, 2000) standard.
15 20 25 30 35 40
1.20
1.25
1.30
1.35
1.40
1.45
Dry
Den
sity
(gm
/cm
3 )
Water Content (%)
Soil
Soil+ 1% fiber (35 mm)
Soil+ 1% fiber (35mm)+ 10% Sand
Soil+ 1% fiber (35mm)+ 15% Sand
Soil+ 1% fiber (35mm)+ 20% Sand
Figure 4.14. Combined compaction curve of Soil and Stabilized Soils
By mixing sand as stabilizer, the OMC decreases and the MDD increases, as shown in Figure.
4.14. It is interesting to note from Figure 4.14 that the significant reduction in MDD by adding
1% and 35mm fiber has been compensated by adding 20% sand. Figure 4.15 shows the increase
in MDD and decrease in OMC of sand mixed and unmixed reinforced soil.
0 5 10 15 20
1.32
1.34
1.36
1.38
1.40
1.42
1.44
MD
D (
gm
/cm
3)
Sand Content (%)
0 5 10 15 20
24
26
28
30
32
34
OM
C (
%)
Sand Content (%)
a b
Figure 4.15. Effect of Sand mixing on (a) MDD and (b) OMC of reinforced soil

Investigation on the Application of Katcha Fiber as a Weak Subgrade Soil Reinforcement
Blended with Sand: In case of Koyefeche Project 18 Road Project
59 ASTU M.Sc. Geotechnical Engineering July 2021
Mixing of 20% sand to the reinforced soil increased the MDD by 7.64% and reduced the OMC
27.99%. As it can be seen mixing sand into the soil is more effective in increasing MDD and
reducing OMC than soil reinforcement. When 20% sand mixed soil compared to the native soil
the MDD of soil increased by 2.78% and the OMC reduced by 20.79% for 20% of sand mixing.
The increase in MDD is an indicator of soil properties improvement by blending of sand. A
similar trend has been observed by (Tare et al., 2018) when sand was used as a stabilizer for
coir fiber reinforced soil sample. In addition to increasing the MDD and reducing OMC
blending of sand improves the workability of soil fiber mix during the laboratory tests.
4.7.2. Effect of Sand on CBR value of Reinforced Soil
4.7.2.1. Effect of Sand Mixing on CBR value of Reinforced soil
The CBR test was also conducted for sand mixed reinforced soil in order to study the effect of
sand on the bearing capacity and swell percent of the reinforced soil. The results obtained from
the CBR tests carried out on both reinforced and sand blended reinforced soil samples are shown
in Figure 4.16
0 1 2 3 4 5 6 7 8
0.0
0.2
0.4
0.6
0.8
1.0
Loa
d (K
N)
penetration (mm)
Soil
Reinforced Soil (1% fiber(35 mm))
Reinforced Soil+10% Sand
Reinforced Soil+15% Sand
Reinforced Soil+20% Sand
Figure 4.16. Load Versus Penetration graph of soil and stabilized soil
From the load penetration curve, it is clearly seen that load is increased for increasing sand
content. The mixing of 20% sand showed the highest load caring capacity, 10% and 15% sand
produce almost similar load caring capacity.

Investigation on the Application of Katcha Fiber as a Weak Subgrade Soil Reinforcement
Blended with Sand: In case of Koyefeche Project 18 Road Project
60 ASTU M.Sc. Geotechnical Engineering July 2021
0 5 10 15 20
5.0
5.2
5.4
5.6
5.8
6.0
CBR
(%)
Sand Content (%)
Figure 4.17. Variation in CBR of reinforced soil with varying amounts of sand
The results from the CBR test show that the CBR increased from 5.09% to 5.27%, 5.44% and
6.00% with an increase in sand content from 0% to 10%, 15% and 20% respectively. The
increment in CBR may be resulted from the gradual increase in MDD of reinforced soil and
reduction of percent swell. The Katcha fiber alone has increased the CBR value from 1.76 to
5.09% with an increase in fiber content from 0% to 1% at 35 mm length.
Table 4.12. CBR value of Soil and Reinforced (1% and 35mm) soil mixed with sand
Material
CBR
(%)
Percent
swell (%)
Percent increase
in CBR (%)
Percent decrease in
Swell (%)
Soil (100%) 1.76 7.46 - -
Reinforced soil
(1% and 35 mm) 5.09 5.06 189.20 32.17
Sand
(%)
10.00 5.27 5.10 199.43 31.64
15.00 5.44 5 209.09 33.00
20.00 6.00 4.80 240.91 35.66
As it can be seen in Table 4.12 when sand is mixed in to a reinforced soil, the soil enhanced the
CBR more effectively than fiber alone for increasing the CBR value by 240.91%. The percent
swell of the soil also reduced by 35.66% for 20% sand, similar reduction in swell was
determined by (Louafi & Bahar, 2012) when sand was used as an additive for stabilization of
swelling clay soils. As stated previously on the compaction test blending of sand to the
reinforced soil improved the workability of the soil.
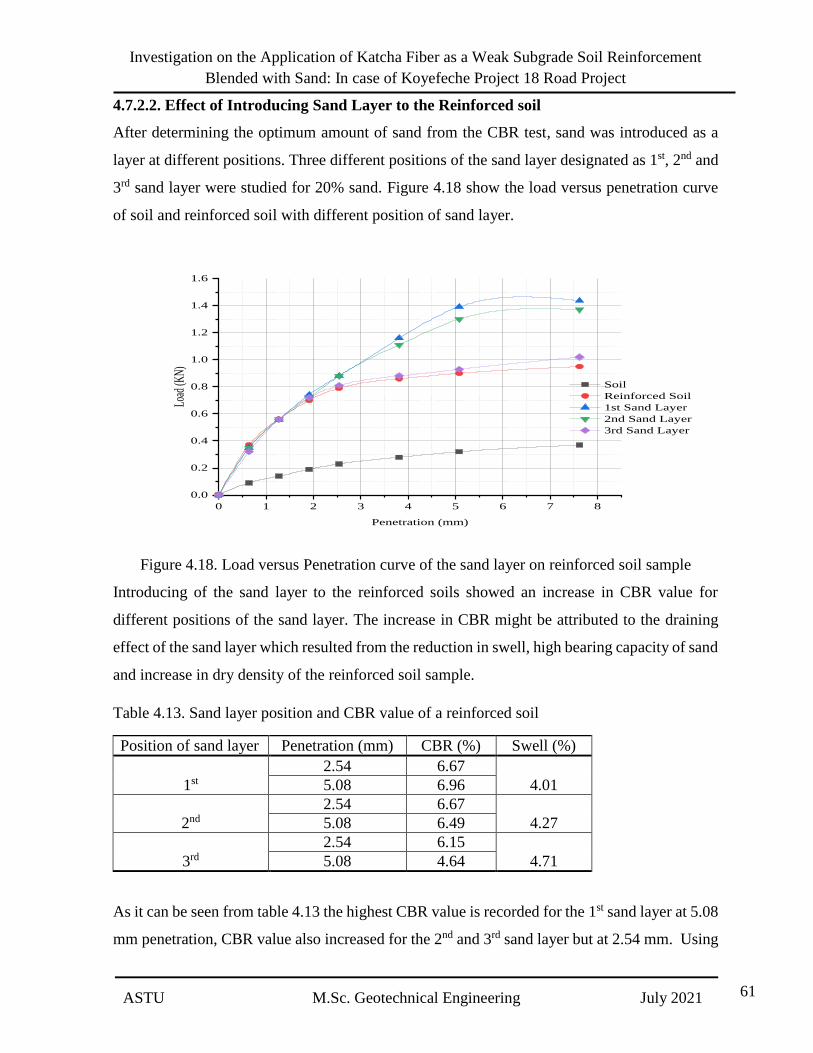
Investigation on the Application of Katcha Fiber as a Weak Subgrade Soil Reinforcement
Blended with Sand: In case of Koyefeche Project 18 Road Project
61 ASTU M.Sc. Geotechnical Engineering July 2021
4.7.2.2. Effect of Introducing Sand Layer to the Reinforced soil
After determining the optimum amount of sand from the CBR test, sand was introduced as a
layer at different positions. Three different positions of the sand layer designated as 1st, 2nd and
3rd sand layer were studied for 20% sand. Figure 4.18 show the load versus penetration curve
of soil and reinforced soil with different position of sand layer.
0 1 2 3 4 5 6 7 8
0.0
0.2
0.4
0.6
0.8
1.0
1.2
1.4
1.6
Load
(KN
)
Penetration (mm)
Soil
Reinforced Soil
1st Sand Layer
2nd Sand Layer
3rd Sand Layer
Figure 4.18. Load versus Penetration curve of the sand layer on reinforced soil sample
Introducing of the sand layer to the reinforced soils showed an increase in CBR value for
different positions of the sand layer. The increase in CBR might be attributed to the draining
effect of the sand layer which resulted from the reduction in swell, high bearing capacity of sand
and increase in dry density of the reinforced soil sample.
Table 4.13. Sand layer position and CBR value of a reinforced soil
Position of sand layer Penetration (mm) CBR (%) Swell (%)
1st
2.54 6.67
4.01 5.08 6.96
2nd
2.54 6.67
4.27 5.08 6.49
3rd
2.54 6.15
4.71 5.08 4.64
As it can be seen from table 4.13 the highest CBR value is recorded for the 1st sand layer at 5.08
mm penetration, CBR value also increased for the 2nd and 3rd sand layer but at 2.54 mm. Using

Investigation on the Application of Katcha Fiber as a Weak Subgrade Soil Reinforcement
Blended with Sand: In case of Koyefeche Project 18 Road Project
62 ASTU M.Sc. Geotechnical Engineering July 2021
sand layer is effective in reducing swelling of the reinforced soil sample. It was found that the
most efficient position of the sand layer in reducing swelling is the 1st sand layer compared to
the 2nd and 3rd sand layer. The percent swell was reduced by 20.75%, 15.61% and 6.92% for 1st,
2nd, and 3rd sand layers respectively when compared with reinforced soil. A similar finding was
observed in the research conducted by (Nini, 2016) to improve the CBR of the clay by
introducing sand layer as a draining filter and also the reduction in swell of a clay soil was also
observed on a test conducted by (Louafi & Bahar, 2012) by using sand layer as an additive for
stabilization of swelling clay soils.
Generally the introduction of sand as a layer gave a promising result in increasing the CBR
value and reducing the percent swell for a subgrade material. So this method can be used as an
alternative method to improve the performance of a subgrade soil.
4.8. Unconfined Compressive Strength Test
Unconfined Compressive Strength (UCS) test was only conducted for optimum percentage of
Katcha fiber and Sand which was selected based on CBR value which was 1% and 20%
percentage replacement of 35 mm Katcha fiber and Sand respectively and for native soil.
The tests were conducted according to (ASTM-D2166, 2000) procedures. Stress-Stain plots of
the native soil, reinforced soil and Sand mixed reinforced soils are shown in Figure. 4.19.
0 2 4 6 8 10 12
0
100
200
300
400
500
Axi
al S
tres
s (K
pa)
Strain (ϵ (%))
Soil
Reinforced Soil
Reinforced Soil + 20% Sand
Figure 4.19. Stress-Strain curve of Soil and Stabilized soil

Investigation on the Application of Katcha Fiber as a Weak Subgrade Soil Reinforcement
Blended with Sand: In case of Koyefeche Project 18 Road Project
63 ASTU M.Sc. Geotechnical Engineering July 2021
According to (ERA Site Investigation Manual, 2013) the UCS of stabilized soil have to be
checked in order to determine the effect of stabilizer on the native soil property.
315.36
503.82
395.56
157.36
251.91
197.78
Soil Reinforced Reinforced soil+ 20% sand
0
100
200
300
400
500
Str
ess
(Kp
a)
UCS
Shear Strength
Figure 4.20. UCS and Shear strength of soil, Reinforced soil and Reinforced soil +20% sand
As it can be seen in the figure the UCS of soil is found to be 315.36Kpa and the highest UCS
was recorded as 503.82 Kpa for reinforced soil by 1%, 35 mm kerosene coated Katcha fiber.
The UCS of reinforced sand blended soil showed a lower value of UCS than that of reinforced
soil. The addition of sand to reinforced soil reduces the interlock between the soil particles and
the soil fiber interaction, as a result lower value of UCS was recorded but this value of mixed
soil is greater than that of the native soil. As it can be seen in table 4.14 reinforcing the soil
increased the UCS of a soil by 59.76% while mixing of sand increased the UCS of a soil by
25.41% the decrease in UCS of soil resulted from the non-cohesive property of sand.
Table 4.14. Summary of UCS, shear strength (Cu) and Percent increase in UCS value
Mix UCS (Kpa) CU (Kpa) Increase in UCS (%)
Soil 315.36 157.36 0
Reinforced Soil 503.82 251.91 59.76
Reinforced soil +20% Sand 395.56 197.78 25.41

Investigation on the Application of Katcha Fiber as a Weak Subgrade Soil Reinforcement
Blended with Sand: In case of Koyefeche Project 18 Road Project
64 ASTU M.Sc. Geotechnical Engineering July 2021
The shear strength (Cu) of the soil samples was calculated as half of the unconfined compression
strength (qu). The shear strength was improved by the addition of Katcha fiber and thereafter it
decreases with addition of sand. The increase in shear strength is due to perfect interlocking of
Katcha fiber with the soil and thereafter it decreased when sand was mixed due to reduced
interlock between soil and fiber mix by non-cohesive property of sand.
4.9. Subgrade Construction Cost
The subgrade construction cost is calculated for both removal and replacement and stabilization
construction methods. The construction cost by removal and replacement of subgrade material
is taken from the current material cost used in the site including labor, equipment, and overhead
and profit costs.
The construction cost comparison is done by considering: the road layers above the subgrade
are the same, site clearance and removal of top soil to a depth of 0.2 m and placing and
compaction cost is the same for both methods, the optimum amount 1% Kerosene coated Katcha
fiber of length 35 mm and 20% sand by weight of soil determined from CBR test, the current
cost of 16 m3 sand is 3200 Birr and 4 Liter of kerosene was used for soaking 7 Kg Katcha fiber.
Table 4.15. Construction cost of subgrade by removal and replacement method
No Description Unit Quantity Unit
price
(birr)
Total
price
(birr)
1 SITE CLEARANCE
1.2 Clearing and Grubbing m2 7000 20 140000
2 EARTH WORK
Removal of unsuitable material
2.1 In layer thickness of 200mm or less m3 1400 120 168,000
2.2 In layer thickness of exciding 200mm m3 7000 320 2,240,000
3 BACKFILLING
3.1 Using imported selected material m3 7000 375 2,625,000
4 ROAD BED PREPARATION AND
COMPACTION
4.1 Compaction to 95% of modified AASHTO
density
m3 7000 175 1,225,000
Total (birr)
6,398,000

Investigation on the Application of Katcha Fiber as a Weak Subgrade Soil Reinforcement
Blended with Sand: In case of Koyefeche Project 18 Road Project
65 ASTU M.Sc. Geotechnical Engineering July 2021
Table 4.16 Construction cost of subgrade by stabilization method
No Description Unit Quantity Unit
price
(birr)
Total price
(birr)
1 SITE CLEARANCE
1.2 Clearing and Grubbing m2 7000 20 140000
2 EARTH WORK
2.1 In layer thickness of 200mm or less m3 1400 120 168,000
3 BACKFILLING
Using stabilized excavated material
3.1 Katcha Fiber Kg 70,000 16 1120,000
3.2 Sand m3 1400 200 280,000
3.3 Kerosene L 40,000 21.50 860,000
4 ROAD BED PREPARATION AND
COMPACTION
4.1 Compaction to 95% of modified AASHTO
density
m3 7000 175 1,225,000
Total (birr)
3,793.000
Table 4.17. Total cost comparison of subgrade construction
No Description Total cost in birr
1
2
3
Subgrade construction by removal and replacement method
Subgrade construction by stabilized Soil
Difference
6,398,000
3,793.000
2,605,000
From table 4.17 it is seen that for native soil total cost of construction is around 6,398,000
Birr/km, and for 1% , 35 mm Katcha fiber and 20% sand stabilized soil the cost of construction
is 3,793.000 Birr/km, by stabilizing the existing soil it can be saved up to 2,605,000 Birr /km.

Investigation on the Application of Katcha Fiber as a Weak Subgrade Soil Reinforcement
Blended with Sand: In case of Koyefeche Project 18 Road Project
66 ASTU M.Sc. Geotechnical Engineering July 2021
5. CONCLUSIONS AND RECOMMENDATIONS
5.1. Conclusions
The thesis investigate the potential applicability of katcha fiber and Sand to improve the
performance of weak subgrade soil to avoid removal and replacement of the residual soil. Thus,
the thesis presents the effect of Katcha fiber on strength of the soil and sand on gradation,
consistency and volumetric shrinkage of soil and on compaction, CBR and UCS of reinforced
soil. On the basis of the test results, the following conclusions can be drawn:
From the laboratory test results of natural soil, it is observed that the properties of soil
under the study did not full fill the requirement to be used as a subgrade material unless
the properties of the soil are improved.
The water absorption capacity of Katcha fiber is reduced by Kerosene coating. The
WAC of the fiber reduced by 58% for three days kerosene soaked fiber. The tensile
strength is found to be 340.74MPa and 302.5MPa for untreated fiber and 403.55MPa
and 314.46MPa for kerosene treated fiber of 200 and 600 mm fiber length respectively.
The gradation of the soil after mixing of 10%, 15% and 20% sand varied compared to
gradation of native soil, as percentage of sand increased the content of gravel and sand
increased while percent of fines decreased significantly. Mixing of 20% sand increased
percent of gravel and sand from 5.16% to 6.16% and from 7.07 to 24.69% respectively.
The PI of soil decreased from 30.8% to 21.11% with increasing sand content. Reduction
of PI is an indicator of improvement correlated with an increase in the strength and a
reduction in swelling and compressibility. Although volumetric shrinkage of sand mixed
soil have been considerably reduced with increasing sand content when compared to
native soil, mixing of 20% sand reduce the volumetric shrinkage of the soil by 61.2%.
The MDD and OMC of soil was significantly affected by mixing of Katcha fiber. The
MDD reduced and OMC increased as the fiber content and length increased with in the
soil mass. The considerable drop in MDD 1.33gm/cm3 obtained at 1% fiber of 35mm
length has been compensated by mixing 20% sand to 1.44gm/cm3. On the other hand,
the OMC was also reduced from 33.33% to 24% when 20% sand mixed to 1%, 35mm
length Katcha fiber reinforced soil.

Investigation on the Application of Katcha Fiber as a Weak Subgrade Soil Reinforcement
Blended with Sand: In case of Koyefeche Project 18 Road Project
67 ASTU M.Sc. Geotechnical Engineering July 2021
The notable improvement in CBR of a soil observed at 1% katcha fiber of 20 and 35
mm length. The CBR of a soil increased from 1.76% to 5.1% for 1%, 35mm Katcha
fiber, the CBR increase is 190% over unreinforced soil. Mixing of sand showed further
improvement on the CBR value of reinforced soil; the increment is around 240 % over
native soil. Also the swell percent of a soil reduced by reinforcement and blending of
sand, the swell percent of a soil was reduced from 7.44% to 5.06% and 4.8% for
reinforced soil by 1% 35mm fiber and for 20 % sand mixing respectively. Although the
CBR test demonstrated that the existence of sandy layer is advantageous for CBR value
of a soil. The highest CBR value and the lowest swelling potential obtained at lower
sandy layer.
The values of UCS of a soil increased from 315.36Kpa to 503.8Kpa at 1% of 35mm
katcha fiber. While mixing of sand reduce the reinforced soil strength but the UCS of a
soil is greater than that of native soil strength. The decrease in UCS value is resulted
from the decrease in bond between the soil and Katcha fiber due to non-cohesive
property sand.
The road construction cost can be reduced by stabilizing the in situ subgrade soil with
1%, 35mm Katcha fiber and 20% Sand. The stabilization method reduced the total
construction cost of subgrade by 40.71%/for 1Km road section construction.
From the foregoing investigation, it would appear that kerosene coated Katcha fiber performs
satisfactorily to improve the performance of weak subgrade soil. Further improvement on index
property, strength and workability of a soil and reinforced soil can be achieved by sand mixing.
And also introducing of sand as a layer improved the bearing capacity of the soil and it can be
considered as an alternative stabilization method. Therefore using Katcha fiber and sand can be
considered as an economic and ecofriendly stabilization practice, because of the cost,
availability and environmental friendly property of katcha fiber and sand.
5.2. Recommendations
This thesis has attempted to obtain the optimum stabilization proportion of Katcha fiber with
respect to its length and content and sand to improve the performance of weak subgrade soil.
However, due to financial constraints, lack of laboratory, and lack of chemical reagents and
time limitations the present research work did not cover the biochemical tests on the Katcha

Investigation on the Application of Katcha Fiber as a Weak Subgrade Soil Reinforcement
Blended with Sand: In case of Koyefeche Project 18 Road Project
68 ASTU M.Sc. Geotechnical Engineering July 2021
fiber. In view of this, it would be desirable to consider the following recommendations on better
use of natural fiber and sand in road construction.
The country is endowed with widely distributed different type of natural fiber including
katcha, Tef straw, barley straw etc. Therefor it is recommended to study the biochemical
composition of fibers to determine their strength and suitability for soil reinforcement.
In order to prepare proportioning guide-line on Katcha fiber and sand application as a
soil stabilizer, an intensive and deep research is recommended on the applicability of
Katcha fiber and Sand on different type of soils.
Further study is recommended on durability and life span of Katcha fiber with in the
soil mass without losing its strength.
Further study is recommended on the effect of Kerosene on Biochemical composition,
and Physical properties of Katcha fiber and its effect on the soil mass and surrounding
environment.
The fibers can either be mixed to the soil matrix manually or mechanically by using
different mixing machines. However there are no standard designed machine to cut the
fibers in a desired length, thus a machine capable of cutting fiber to a desired length
should be designed for bulk application of fiber in the field.

Investigation on the Application of Katcha Fiber as a Weak Subgrade Soil Reinforcement
Blended with Sand: In case of Koyefeche Project 18 Road Project
69 ASTU M.Sc. Geotechnical Engineering July 2021
SPECIAL ACKNOWLEDGEMENT
This research project is funded by Adama Science and Technology University under the grant
number:
ASTU/SM-R/247/21
Adama, Ethiopia

Investigation on the Application of Katcha Fiber as a Weak Subgrade Soil Reinforcement
Blended with Sand: In case of Koyefeche Project 18 Road Project
70 ASTU M.Sc. Geotechnical Engineering July 2021
REFERENCE
Aggarwal, P., & Sharma, B. (2010). Application of Jute Fiber in the Improvement of Subgrade
Characteristics. ACEE, 01(01), 50–53.
Arora. (2003). Soil Mechanics and Foundtion Engineering. A.K.Jain.
ASTM-D1557. (2000). Standard Test Methods for Laboratory Compaction Characteristics of
Soil Using Modified Effort. In ASTM Standard Guide (pp. 1–10). ASTM International.
ASTM-D1883. (1999). Standard Test Method for CBR ( California Bearing Ratio ) of Soils in
Place. In Annual Book of ASTM Standards (pp. 1–8). ASTM International.
ASTM-D2166. (2000). Standard Test Method for Unconfined Compressive Strength of
Cohesive Soil. In Annual Book of ASTM Standards (pp. 1–7). ASTM International.
ASTM-D2216. (1998). Standard Test Method for Laboratory Determination of Water
(Moisture) Content of Soil and Rock by Mass. In Annual Book of ASTM Standards (pp.
1–5). ASTM International.
ASTM-D2487. (1985). Standard Practice for Classification of Soils for Engineering Purposes
(Unified Soil Classification System). In Annual Book of ASTM Standards (pp. 1–11).
ASTM International.
ASTM-D2495. (2007). Standard test method for moisture in cotton by oven-drying. In Annual
Book of ASTM Standards. ASTM International.
ASTM-D3282. (1997). Standard Practice for Classification of Soils and Soil-Aggregate
Mixtures for Highway Construction Purposes. In Annual Book of ASTM Standards (pp.
1–6). ASTM International.
ASTM-D3822. (2007). Standard Test Method for Tensile Properties of Single Textile Fibers.
In Annual Book of ASTM Standards (pp. 1–10). ASTM International.
ASTM-D422. (1998). Standard Test Method for Particle-Size Analysis of Soils. In Annual
Book of ASTM Standards (pp. 1–8). ASTM International.
ASTM-D427. (1998). Standard Test Method for Shrinkage Factors of Soils by the Mercury
Method. In Annual Book of ASTM Standards (pp. 3–6). ASTM International.

Investigation on the Application of Katcha Fiber as a Weak Subgrade Soil Reinforcement
Blended with Sand: In case of Koyefeche Project 18 Road Project
71 ASTU M.Sc. Geotechnical Engineering July 2021
ASTM-D4318. (2000). Standard Test Methods for Liquid Limit, Plastic Limit, and Plasticity
Index of Soils. In Annual Book of ASTM Standards (pp. 1–14). ASTM International.
ASTM-D854. (2002). Standard Test Methods for of Soil Specific Gravity Solids by Water
Pycnometer. In Annual Book of ASTM Standards (pp. 1–7). ASTM International.
Babu, V. R. (2019). Soil Stabilization By Using Banana Fibre. International Journal of Scientific
Research and Review, 8(1), 738–742.
Bawadi, N. F., Alhamidi, M. A. A., Mansor, A. F., & Anuar, S. A. (2020). Influence of Banana
Fiber on Shear Strength of Clay Soil. IOP Conference Series: Materials Science and
Engineering, 864(1).
Bhatnagar, R., Gupta, G., & Yadav, S. (2015). A Review on Composition and Properties of
Banana Fibers. International Journal of Scientific & Engineering Research, 6(5), 49–52.
Das, B. . (2003). Chemical and Mechanical Stabilization. Transportation Research Board.
Degife, A., Fikirte Demissie, Kalkidan, G. S. O., Asnake, K., Desta, M. A. D., Mengesh, S. A.,
Zewdie, M., Rebbi, H., & Abstract. (2018). Towards Mainstreaming Environmental
Impact Assessment into Housing Development Projects in Ethiopia : The Case of Koye-
Feche Condominium Housing Development Project , Addis Ababa. 10(1), 41–57.
ERA Pavement Design Manuals. (2013). Pavement Design Manual Volume I Flexible
Pavements. In ERA Design Manuals: Vol. I (p. 281). Ethiopian Roads Authority.
ERA Site Investigation Manual. (2013). Site Investigation Manual. In ERA Design Manuals (p.
212). Ethiopian Roads Authority.
ES 127. (2001). Determination of breaking load by single strand method. In Ethiopian Standard.
Esayas, E., C Agon Ass, E., & Assefa, S. (2018). Development of Wall Construction Material
Stabilized with Enset Vegetable Fibers for Rural Housing Units. American Journal of Civil
Engineering and Architecture, 6(2), 54–62.
Farooq, K., & Virk, K. A. (2009). Improvement of engineering characteristics of expansive
clays by sand mixing. Proceedings of the 17th International Conference on Soil Mechanics
and Geotechnical Engineering: The Academia and Practice of Geotechnical Engineering,

Investigation on the Application of Katcha Fiber as a Weak Subgrade Soil Reinforcement
Blended with Sand: In case of Koyefeche Project 18 Road Project
72 ASTU M.Sc. Geotechnical Engineering July 2021
1, 785–788.
Gowthaman, S., Nakashima, K., & Kawasaki, S. (2018). A State-of-the-Art Review on Soil
Reinforcement Technology Using Natural Plant Fiber Materials : Past Findings , Present
Trends and Future Directions. MDPI, i.
Hausman, M. R. (1990). Engineering Principles of Ground Modification. Mc-Graw and Hill
Publishing.
Hejazi, S. M., Mohammad, S., Sayyed, M., & Zadhoush, A. (2012). A simple review of soil
reinforcement by using natural and synthetic fibers. Construction and Building Materials,
30, 100–116.
Hiwot, S. (2016). An Alternative for Stabilization of Addis Ababa Expansive Soil by Crushed
and Natural Sand (Issue June). Addis Ababa University.
Huat, B., Sew, G. S., & Ali, F. H. (2009). Tropical Residual Soils Engineering (B. B.K.Huat,
G. S. Sew, & F. H. Ali (eds.)). A.A.Balkema Publishers.
Industrial Parks Development Corporation. (2017). Updated Environmental and Social impact
Assessment for Kilinto Industrial Park. March.
John, M. J., & Thomas, S. (2008). Biofibres and biocomposites. Carbohaydrate Polymers
Elsevier, 71, 343–345.
Kollaros, G., & Athanasopoulou, A. (2017). Sand As a Soil Stabilizer. Bulletin of the
Geological Society of Greece, 50(2), 770–777.
Kulhar, K. S., & Raisinghani, M. (2018). Engineering Performance Review of Soil
Reinforcement with Natural Fibers. Journal of Civil Enfineering and Environmental
Technology, 5(1), 20–26.
Kumar, D., Nigam, S., Nangia, A., & Tiwari, S. (2015). Improvement in CBR Values of Soil
Reinforced with Jute Fibre. 3(5), 290–293.
Lakshmi, S. M., Sasikala, S., Padmavath, V., Priya, S., & Saranya, V. (2018). Utilization of
Coconut Coir Fibre For Improving Subgrade Strength Characteristics Of Clayey Sand.
International Research Journal of Engineering and Technology, 05(April).

Investigation on the Application of Katcha Fiber as a Weak Subgrade Soil Reinforcement
Blended with Sand: In case of Koyefeche Project 18 Road Project
73 ASTU M.Sc. Geotechnical Engineering July 2021
Li, C. (2005). Mechanical response of fiber-reinforced soil. University of Texas at Austin.
Liu, C., & Evett, J. (2000). Soil Properties Testing, Measurment, and Evaluation (4th ed.).
Prentice-Hall,Inc.
Louafi, B., & Bahar, R. (2012). SAND: An Additive for Stabilzation of Swelling Clay Soils.
International Journal of Geosciences, 03(04), 719–725.
Mathur, U., Kumar, N., Pandey, T. N., & Choudhary, A. (2017). Study of Index Properties of
the Soil. Ijariie, 3, 656–661.
Mitchell, J. K., & Soga, K. (1994). Fundamentals of Soil Behavior. In Soil Science (erd, Vol.
158, Issue 1). JOHN WILEY & SONS, INC.
Mohajerani, A., Hui, S. Q., Mirzababaei, M., Arulrajah, A., Horpibulsuk, S., Kadir, A. A.,
Rahman, M. T., & Maghool, F. (2019). Amazing types, properties, and applications of
fibres in construction materials. Materials, 12(16), 1–45.
Mohan, M., & Manjesh, L. (2017). A Study on Stabilization of Subgrade Soil Using Natural
Fibers ( Coir and Jute ). 42–49.
Nini, R. (2016). CBR of Soaked Clay Drained by Sandy Layer. World Congress on Civil,
Structural, and Environmental Engineering, 1–6.
Ramasubbarao, G. V. (2014). Strength Behavior of Kerosene Coated Coir Fiber Reinforced
Expansive Soil. Architecture and Civil Engineering Vol., 12(June), 113–120.
Rathod, R. G., & Sathe, S. S. (2017). Soil Stabilization by Coarse Sand for Different Soils and
Pavement Cost Evaluation. International Journal of Innovative Research in Science,
Engineering and Technology, 6(1), 803–824.
Rowell, R. M., Han, J. S., & Rowell, J. S. (2000). Characterization and Factors Effecting Fiber
Properties. Natural Polymers and Agrofibers Composites, 115–134.
Saffari, P., Nie, W., Noor, M. J. M., Zhang, X., & Liang, Q. (2019). Characterization the
geotechnical properties of a Malaysian granitic residual soil grade v. IOP Conference
Series: Earth and Environmental Science, 289(1).
Sandyarani, Mathada, V. S., & Sharanakumar. (2018). Stabilization of black cotton soil by using

Investigation on the Application of Katcha Fiber as a Weak Subgrade Soil Reinforcement
Blended with Sand: In case of Koyefeche Project 18 Road Project
74 ASTU M.Sc. Geotechnical Engineering July 2021
Sisal fiber. International Research Journal of Engineering and Technology (IRJET),
119(17), 311–322.
Sumi, & Unnikrishnan, N. (2015). Natural Fibres in Engineering Applications: An Overview.
International Jornal of Scientific and Engineering Research, 5(7), 260–265.
Tare, V., Singh, D., & MeShram, K. (2018). Stabilization of Black Cotton Soil with Sand and
Non Woven Coir Technical Paper Stabilization of Black Cotton Soil with Sand and Non
Woven Coir. Indian Highways, February, 39–43.
Teli, M. D., & Terega, J. M. (2017). Chemical , Physical and Thermal Characterization of
Ensete ventricosum Plant Fibre. International Research Journal of Engineering and
Technology (IRJET), 04(12), 67–75.
Temesgen, A. G., & Sahu, O. (2014). Process Ability Enhancement of False Banana Fibre for
Rural Development. Journal of Agricultural Economics, Extension and Rural
Development, 1(6), 64–73.
Tirfu, M. (2018). Problematic Sub-Grade Soil Reinforcement Using Local Natural Fibers on
Selected Road Section from Problematic Sub-Grade Soil Reinforcement Using Local
Natural Fibers on Selected Road Section from Wolaita , South Western Ethiopia. Addis
Ababa University.
Torio-kaimo, L. V., Diego, A. M. S., & Alcantara, M. T. M. (2020). Unconfined Compressive
Strength of Clay Reinforced with Kerosene-Treated Coir Fiber. International Journal of
GEOMATE, 18(69), 97–103.

Investigation on the Application of Katcha Fiber as a Weak Subgrade Soil Reinforcement
Blended with Sand: In case of Koyefeche Project 18 Road Project
75 ASTU M.Sc. Geotechnical Engineering July 2021
APPENDICES

Investigation on the Application of Katcha Fiber as a Weak Subgrade Soil Reinforcement
Blended with Sand: In case of Koyefeche Project 18 Road Project
76 ASTU M.Sc. Geotechnical Engineering July 2021
Appendix-A
Test Results of Natural Soils

Investigation on the Application of Katcha Fiber as a Weak Subgrade Soil Reinforcement
Blended with Sand: In case of Koyefeche Project 18 Road Project
77 ASTU M.Sc. Geotechnical Engineering July 2021
Table A-1 Natural Moisture Content of soil sample 1(pit 1) and soil sample 2(pit 2)
Test Method ASTM-D4643-00
Specimen reference Pit 1 Pit 2
Container no 333 Z D 16
Mass of wet Soil +Container (m2) gm 97 100 107.2 88
Mass of dry Soil +Container (m3) gm 81 81.2 90.2 73.5
Mass of container (m1) gm 16 10 16 10
Mass of moisture(m2-m3) gm 16 18.8 17 14.5
Mass of dry soil (m3-m1) gm 65 71.2 74.2 63.5
Moisture content (m3-m1)*100/(m3-m1) % 24.615 26.404 22.911 22.835
Average moisture content (%) 25.51 22.87
Table A-2 Specific Gravity of Soil Sample1 (Pit1) and Soil Sample 2(pit 2)
Test Method ASTM-D 854
Determination number Pit 1 Pit 2
Bottle no 6 9 12 7
Wt. of bottle + Water+ Soil (g) 167.4 167.6 166.7 167.3
T
Wt. of bottle + Water (g) 157.8 158 157.2 157.8
Wt. of bottle + Dry soil (g) 67 64.2 66.7 67
Wt. of bottle (g) 52.000 50.000 51.900 52.000
Wt. of soil (g) 15 15 15 15
Specific Gravity 2.778 2.778 2.727 2.727
Average Specific Gravity 2.78 2.73
Table A-3 Grain Size Analysis of soil sample 1(pit 1)
Sieve size
Retained for 1st Sieving Percent Passing
(mm) Weight % Rtd. (%)
75 0.00 0.00 100.00
63 0.00 0.00 100.00
50 0.00 0.00 100.00
37.5 0.00 0.00 100.00
25 0.00 0.00 100.00
19 0.00 0.00 100.00
12.5 8.80 1.95 98.05
9.5 4.50 1.00 97.05
4.75 10.00 2.22 94.84

Investigation on the Application of Katcha Fiber as a Weak Subgrade Soil Reinforcement
Blended with Sand: In case of Koyefeche Project 18 Road Project
78 ASTU M.Sc. Geotechnical Engineering July 2021
2 6.60 1.46 93.37
1.18 4.50 1.00 92.38
0.6 4.60 1.02 91.36
0.3 4.80 1.06 90.29
0.15 5.10 1.13 89.16
0.075 6.30 1.40 87.77
Pan 396.10 87.77
Total 451 100
b. Hydrometer
Elaps
ed
Time,
t,min
Actual
Hydrome
ter
Reading
Ra
Te
mp
(oC)
Effectiv
e Depth,
L
(cm)
K
From
Table
Temprat
ure
Correcti
on
Factor
Ct
Modified
Hydromet
er
Reading
R= Ra -
Cz+Ct
Particle
Diameter
D
(mm)
Percenta
ge Pass
(%)
Corrected
Percentag
e Pass
(%)
0
2 41.500 19 9.28
0.013
29 -0.25
35.111 0.0286 68.29 59.93
5 38.500 19 9.78
0.013
29 -0.25
32.111 0.0186 62.45 54.81
15 36.500 19 10.11
0.013
29 -0.25
30.111 0.0109 58.56 51.40
30 33.500 19 10.60
0.013
29 -0.25
27.111 0.0079 52.73 46.28
60 30.500 19 11.10
0.013
29 -0.25
24.111 0.0057 46.89 41.16
250 27.500 21 11.59
0.012
96 0.18
21.856 0.0028 42.51 37.31
1440 22.500 19 12.42
0.013
29 -0.25
16.111 0.0012 31.33 27.50
Table A-4 Grain Size Analysis of soil sample 2 (pit 2)
Sieve
Size
Retained for
1st Sieving Percent Passing
(mm) Weight % Rtd. (%)
75 0.00 0.00 100.00
63 0.00 0.00 100.00
50 0.00 0.00 100.00
37.5 0.00 0.00 100.00
25 0.00 0.00 100.00
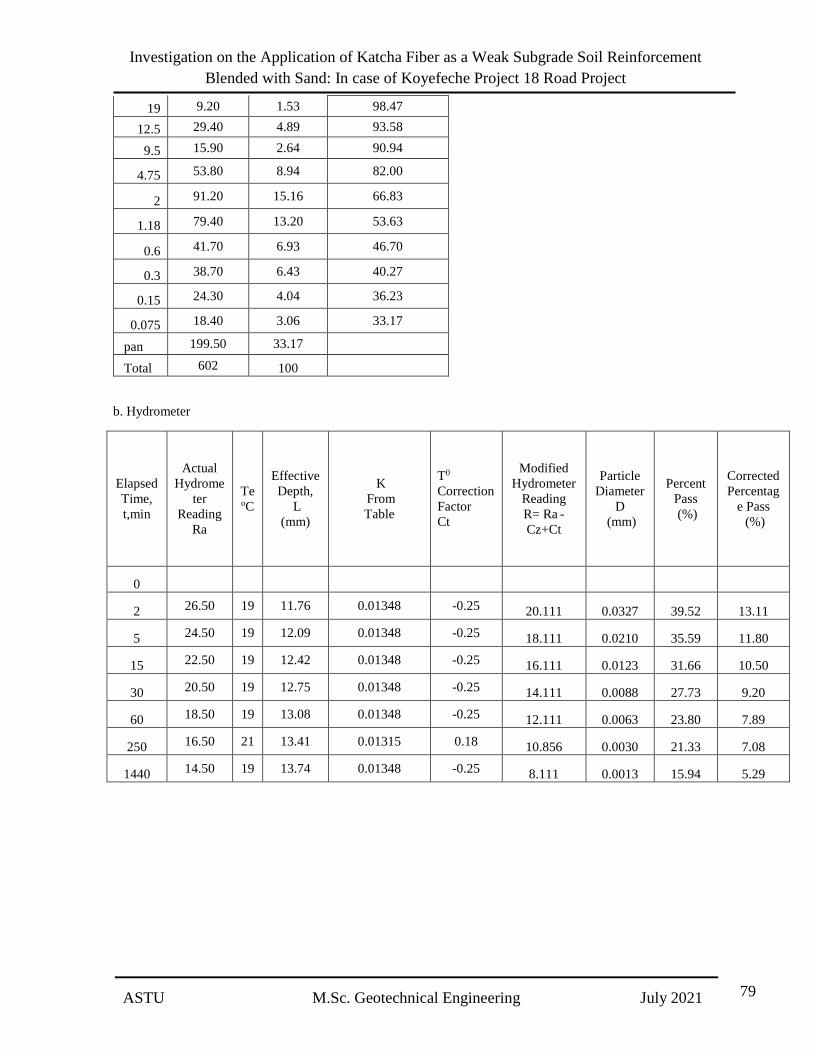
Investigation on the Application of Katcha Fiber as a Weak Subgrade Soil Reinforcement
Blended with Sand: In case of Koyefeche Project 18 Road Project
79 ASTU M.Sc. Geotechnical Engineering July 2021
19 9.20 1.53 98.47
12.5 29.40 4.89 93.58
9.5 15.90 2.64 90.94
4.75 53.80 8.94 82.00
2 91.20 15.16 66.83
1.18 79.40 13.20 53.63
0.6 41.70 6.93 46.70
0.3 38.70 6.43 40.27
0.15 24.30 4.04 36.23
0.075 18.40 3.06 33.17
pan 199.50 33.17
Total 602 100
b. Hydrometer
Elapsed
Time,
t,min
Actual
Hydrome
ter
Reading
Ra
Te oC
Effective
Depth,
L
(mm)
K
From
Table
T0
Correction
Factor
Ct
Modified
Hydrometer
Reading
R= Ra -
Cz+Ct
Particle
Diameter
D
(mm)
Percent
Pass
(%)
Corrected
Percentag
e Pass
(%)
0
2 26.50 19 11.76 0.01348 -0.25 20.111 0.0327 39.52 13.11
5 24.50 19 12.09 0.01348 -0.25 18.111 0.0210 35.59 11.80
15 22.50 19 12.42 0.01348 -0.25 16.111 0.0123 31.66 10.50
30 20.50 19 12.75 0.01348 -0.25 14.111 0.0088 27.73 9.20
60 18.50 19 13.08 0.01348 -0.25 12.111 0.0063 23.80 7.89
250 16.50 21 13.41 0.01315 0.18 10.856 0.0030 21.33 7.08
1440 14.50 19 13.74 0.01348 -0.25 8.111 0.0013 15.94 5.29

Investigation on the Application of Katcha Fiber as a Weak Subgrade Soil Reinforcement
Blended with Sand: In case of Koyefeche Project 18 Road Project
80 ASTU M.Sc. Geotechnical Engineering July 2021
Figure A-1 Particle size distribution curve of pit 1 and Pit 2 soil sample
Table A-5 Liquid Limit and Plastic Limit test of Soil Sample 1(pit1)
Test Method ASTM-D 4318
Type of Test Liquid Limit Test Plastic Limit Test
Trial 1 Trial 2 Trial 3 Trial 4 Trial 1 Trial 2
No. of Blows
N 34 27 23 18 - -
Mass of moist
Sample + Can M1
26.35 29.49 32.46 34.72 27.54 27.54
Mass of Dried
Sample + Can M2
21.65 23.35 24.94 25.64 23.49 23.63
Mass of Can
Mc 14.85 14.91 15.11 14.77 14.35 14.92
Mass of Moist Mm=M1-M2 4.70 6.14 7.52 9.08 4.05 3.91
Mass of Dried
Sample Md=M2-Mc
6.80 8.44 9.83 10.87 9.14 8.71
Moisture Content
(%)
= (Mm / Md ) x
100 69.12 72.75 76.50 83.53 44.31 44.89
Liquid Limit = 75.4% Plastic Limit= 44.6%
Plasticity Index (PI = LL - PL) =30.8
0
10
20
30
40
50
60
70
80
90
100
0.00010.0010.010.1110100
Per
cent
Pas
s (%
)
Grain Size (mm)
Pit 1
Pit 2
cobble Gravel Sand Size Fine Grained
Silt Clay

Investigation on the Application of Katcha Fiber as a Weak Subgrade Soil Reinforcement
Blended with Sand: In case of Koyefeche Project 18 Road Project
81 ASTU M.Sc. Geotechnical Engineering July 2021
Figure A-2 Liquid Limit determination of soil sample 1(Pit 1)
Table A-6 Liquid limit and Plastic Limit test of Soil Sample 2 (pit 2)
Test Method ASTM-D 4318
Type of Test Liquid Limit Test Plastic Limit Test
Trial 1 Trial 2 Trial 3 Trial 4 Trial 1 Trial 2
No. of Blows N 33 28 23 18 - -
Mass of moist
Sample + Can M1
26.57 29.31 32.35 34.60 27.25 27.29
Mass of Dried
Sample + Can M2
21.80 23.65 24.64 25.91 23.35 23.38
Mass of Can
Mc 14.36 15.35 14.02 14.58 14.84 14.37
Mass of Moist Mm=M1-M2 4.77 5.66 7.71 8.69 3.90 3.91
Mass of Dried
Sample Md=M2-Mc
7.44 8.30 10.62 11.33 8.51 9.01
Moisture Content
(%) = (Mm / Md ) x100 64.11 68.19 72.60 76.70 45.83 43.40
Liquid Limit = 70.4% Plastic Limit= 44.61%
Plasticity Index (PI = LL - PL) = 25.8
Figure A-3 Liquid Limit determination of soil sample 2 (Pit 2)
30.00
40.00
50.00
60.00
70.00
80.00
90.00
100.00
10 100
Mo
istu
re
Co
nte
nt
%
Number of Blows
30.00
40.00
50.00
60.00
70.00
80.00
90.00
100.00
10 100Mois
ture
Co
nte
nt
%
Number of blows

Investigation on the Application of Katcha Fiber as a Weak Subgrade Soil Reinforcement
Blended with Sand: In case of Koyefeche Project 18 Road Project
82 ASTU M.Sc. Geotechnical Engineering July 2021
Table A-7 Compaction property of Soil Sample 1 (pit1)
Figure A-4 Compaction Curve of soil sample 1(Pit 1)
1.302
1.372
1.397
1.240
1.260
1.280
1.300
1.320
1.340
1.360
1.380
1.400
1.420
1.440
24 25 26 27 28 29 30 31 32 33 34
Dry
Den
sity
(gm
/cc)
Water Content (%)
Test Method ASTM- D 1557
Trial 1 Trial 2 Trial 3 Trial 4
Water in cc - - - -
Wt.of mould + Wet sample(g) 5455.00 5580.10 5642.80 5600.00
Wt.of mould (g) 3921.00 3921.00 3921.00 3921.00
Wt.of wet soil(g) 1534.00 1659.10 1721.80 1679.00
Volume of mould cm3 944.00 944.00 944.00 944.00
Wet Density gm /cm3 1.63 1.758 1.824 1.779
Moisture content
Wet soil + tin (g) 129.60 86.00 94.60 90.70
Dry soil + tin (g) 107.00 70.70 76.30 70.30
Wt of tin (g) 16 16.30 16.50 10.00
Wt of Water (g) 22.60 15.30 18.30 20.40
Wt of Dry soil (g) 91.00 54.40 59.80 60.30
Moisture content % 24.84 28.13 30.60 33.831
Dry Density gm /cm3 1.302 1.372 1.397 1.329

Investigation on the Application of Katcha Fiber as a Weak Subgrade Soil Reinforcement
Blended with Sand: In case of Koyefeche Project 18 Road Project
83 ASTU M.Sc. Geotechnical Engineering July 2021
Table A-8 Compaction property of Soil Sample 2 (pit 2)
Test Method ASTM-D1557
Lab.test No. Trial 1 Trial 2 Trial 3 Trial 4
Water in cc - - - -
Wt.of mould + Wet sample(g) 5308.9 5485.3 5464.2 5353.7
Wt.of mould (g) 3710.3 3710.3 3710.3 3710.3
Wt.of wet soil(g) 1598.6 1775.0 1753.9 1643.4
Volume of mould cm3 944 944 944 944
Wet Density gm /cm3 1.69 1.88 1.858 1.74
Moisture content
Wet soil + tin (g) 94.70 97.60 96.70 75.00
Dry soil + tin (g) 78.80 80.00 77.60 58.30
Wt of tin (g) 10 17.3 16.6 10
Wt of Water (g) 15.90 17.60 19.10 16.70
Wt of Dry soil (g) 68.80 62.70 61 48.3
Moisture content % 23.11 28.07 31.31 34.58
Dry Density gm /cm3 1.376 1.468 1.415 1.294
Figure A-5 Compaction Curve of soil sample 2 (Pit 2)
1.376
1.468
1.415
1.294
1.280
1.300
1.320
1.340
1.360
1.380
1.400
1.420
1.440
1.460
1.480
22 23 24 25 26 27 28 29 30 31 32 33 34 35 36 37 38
Dry
Den
sity
gm
/cc
Water Content %

Investigation on the Application of Katcha Fiber as a Weak Subgrade Soil Reinforcement
Blended with Sand: In case of Koyefeche Project 18 Road Project
84 ASTU M.Sc. Geotechnical Engineering July 2021
Table A-9 California Bearing Ratio (CBR) of soil sample 1(pit 1)
Test Method ASTM-D1883
Penetration
(mm)
Load
dial
divs.
Ring
Factor
N/div
Load
(kN)
Swell Data
Gauge
reading
Initial
(mm)
Final
(mm)
0 0 46.367 0.00
961 1909
0.64 2 " 0.09
%
swell
7.465
1.27 3 "
1.91 4 " 0.19
2.54 5.0 " 0.23
3.81 6 " 0.28
5.08 7 " 0.32
7.62 8 " 0.37
0.00
Penetration (mm)
Load (kN)
Standard
Load (kN)
CBR,
% % Swell
Blow/layer= 56/5
2.54 0.23 13.2 1.76 7.46
MDD= 1.4
5.08 0.32 20.0 1.62 OMC 30.3%
Figure A-6 Load versus Penetration curve of soil sample 1 (pit 1)
0.00
0.20
0.40
0.60
0 1 2 3 4 5 6 7 8
Load
(kN
)
Penetration (mm)

Investigation on the Application of Katcha Fiber as a Weak Subgrade Soil Reinforcement
Blended with Sand: In case of Koyefeche Project 18 Road Project
85 ASTU M.Sc. Geotechnical Engineering July 2021
Table A-10 California Bearing Ratio (CBR) of soil sample 2 (pit 2)
Test Method ASTM-D1883
Penetration
(mm)
Load
dial
divs.
Ring
Factor
N/div
Load
(kN)
Swell Data
Gauge
reading
Initial
(mm)
Final
(mm)
0 0
46.367 0.00
890 1789
0.64 1.5
" 0.07
%
swell
7.08
1.27 3.5
" 0.16
1.91 5
" 0.23
2.54 6
" 0.28
3.81 8
" 0.37
5.08 9
" 0.42
7.62 11
" 0.51
0.00
Penetration (mm)
Load (kN)
Standard
Load (kN) CBR, % % Swell
Blow/layer=
56/5
2.54 0.23 13.2 2.11
7.08
MDD= 1.32
5.08 0.32 20.0 2.09 OMC 30.89%
Figure A-7 Load versus Penetration curve of soil sample 2(pit 2).
0.00
0.20
0.40
0.60
0 1 2 3 4 5 6 7 8
Lo
ad (
kN
)
Penetration (mm)

Investigation on the Application of Katcha Fiber as a Weak Subgrade Soil Reinforcement
Blended with Sand: In case of Koyefeche Project 18 Road Project
86 ASTU M.Sc. Geotechnical Engineering July 2021
Appendix-B
Test Results of Sand

Investigation on the Application of Katcha Fiber as a Weak Subgrade Soil Reinforcement
Blended with Sand: In case of Koyefeche Project 18 Road Project
87 ASTU M.Sc. Geotechnical Engineering July 2021
Table B-1 Specific Gravity of sand
Test Method ASTM-D854
Determination number 1 2
Bottle no 125 21
Wt. of bottle + Water+ Soil (g) 166.55 163.1
T
Wt. of bottle + Water (g) 157.19 153.73
Wt. of bottle + Dry soil (g) 64.580 64.2
Wt. of bottle (g) 49.580 50.000
Wt. of soil (g) 15 15
Specific Gravity 2.660 2.664
Average Specific gravity (Gs) 2.662
Table B-2 Dry sieve analysis of Sand
Sieve
Size(mm)
Retained for
1st Sieving Percent Passing
(mm) Weight % Rtd. (%)
75 0.00 0.00 100.00
63 0.00 0.00 100.00
50 0.00 0.00 100.00
37.5 0.00 0.00 100.00
25 0.00 0.00 100.00
19 0.00 0.00 100.00
12.5 0.00 0.00 100.00
9.5 0.00 0.00 100.00
4.75 17.70 3.52 96.48
2 43.10 8.58 87.90
1.18 97.80 19.46 68.44
0.6 165.40 32.91 35.54
0.3 137.70 27.40 8.14
0.15 36.50 7.26 0.88
0.075 1.90 0.38 0.50
2.50 0.50
503 100

Investigation on the Application of Katcha Fiber as a Weak Subgrade Soil Reinforcement
Blended with Sand: In case of Koyefeche Project 18 Road Project
88 ASTU M.Sc. Geotechnical Engineering July 2021
Figure B-1 Particle Size Distribution Curve of Sand
Table B-3 Atterberg Limit of sand
Test Method ASTM-D 4318
Type of Test Liquid Limit Test
Trial 1 Trial 2 Trial 3 Trial 4
No. of Blows N 11 16 23 26
Mass of moist Sample + Can M1 30.15 31.70 34.53 37.64
Mass of Dried Sample + Can M2 28.51 29.52 30.25 32.36
Mass of Can Mc 14.95 14.36 14.92 14.54
Mass of Moist Mm=M1-M2 1.64 2.18 4.28 5.28
Mass of Dried Sample Md=M2-Mc 13.56 15.16 15.33 17.82
Moisture Content = Mm / Md x 100 12.09 14.38 27.92 29.63
Liquid Limit (LL) 28.5
0
28.5
Plastic Limit (PL)
Plasticity Index (PI)
Figure B-2 Liquid Limit determination of sand
0
10
20
30
40
50
60
70
80
90
100
0.00010.0010.010.1110100
Per
cent
Pas
s (%
)
Grain Size (mm)
cobble Gravel Sand Size Fine Grained
Silt Clay
1.00
6.00
11.00
16.00
21.00
26.00
31.00
36.00
1 10 100
Mo
istu
re C
on
ten
t %
Number of blows

Investigation on the Application of Katcha Fiber as a Weak Subgrade Soil Reinforcement
Blended with Sand: In case of Koyefeche Project 18 Road Project
89 ASTU M.Sc. Geotechnical Engineering July 2021
Appendix-C
Test Results of Katcha fiber

Investigation on the Application of Katcha Fiber as a Weak Subgrade Soil Reinforcement
Blended with Sand: In case of Koyefeche Project 18 Road Project
90 ASTU M.Sc. Geotechnical Engineering July 2021
Table C-1 Specific Gravity of Kerosene Coated and uncoated Katcha Fiber
Test Method ASTM D854
Untreated Fiber Treated Fiber
botl number 6 9 13 12
B+W+fiber (g) 158.2 156.4 157.2 156
B+W (g) 157.4 154 156 154
B+Dry fiber (g) 66.6 64.2 64.8 65.4
B (g) 51.6 49.2 49.8 50.4
Dry fiber (g) 15 15 15 15
Specific Gravity 1.06 1.19 1.09 1.15
Average Specific Gravity 1.12 1.12
Table C-2 Moisture Regain of Katcha fiber
Test Method ASTM D2495 – 07
Fiber Condition untreated fiber 3 days soaked fiber
Wet fiber + can (g) M1 173 173 173 173
dry fiber + can (g) M2 166.8 167.2 168 167.8
can(g) Mc 123 123 123 123
moisture mass Mw= M1-M2 6.2 5.8 5 5.2
dry fiber (g) Md=M2-MC 43.8 44.2 45 44.8
Moisture Regain (%) =(Md/Mw)*100 14.16 13.12 11.11 11.61
Average Moisture regain (%) 13.64 11.36
Table C-3 Moisture content of Katcha fiber
Test Method ASTM D2495 – 07
untreated fiber 2 days soaked fiber
Wet fiber + can (g) M1 173 173 173 173
Dry fiber + can (g) M2 166.7 167 167.7 167.2
Can(g) Mc 123 123 123 123
Moisture mass Mw=M1-M2 6.3 6 5.3 5.8
wet fiber (g) Mn= M1-Mc 50 50 50 50
Moisture Content ( %)=(Mw/Mn)*100 12.60 12.00 10.60 11.60
Average Moisture Content (%) 12.30 11.10
Table C- 4 Water Absorption test of Kerosene Coated and Uncoated 20 mm Katcha fiber
20mm fiber length untreated fiber treated for 1 day treated for 2 day treated for 3 day
Wet fiber + can (g) M1 218 217.3 207.6 207 198.7 199.9 199.7 198.5
Dry fiber + can (g) M2 187.6 187.4 186.1 187.4 185 186.1 186.9 186
can(g) Mc 177.6 177.5 176 177.4 175 176 177 176
Moisture mass Mw= M1-M2 30.4 29.9 21.5 19.6 13.7 13.8 12.8 12.5
dry fiber (g)Md=M2-MC 10 9.9 10.1 10 10 10.1 9.9 10
Moisture Content,(Md/Mw)*100 304.00 302.02 212.87 196.00 137.00 136.63 129.29 125.00
Average moisture content (%) 303.01 204.44 136.82 127.15

Investigation on the Application of Katcha Fiber as a Weak Subgrade Soil Reinforcement
Blended with Sand: In case of Koyefeche Project 18 Road Project
91 ASTU M.Sc. Geotechnical Engineering July 2021
Table C-5 Tensile Strength test data
Sample type : Katcha Fiber Test Type : Tensile
Standard : ES 127/ ASTM- D3822 Test Speed : 10.000 mm/min
Diameter=0.128 mm Area= 0.0129 mm2
Number of strands in one bundle of fiber = 65
Table C-6 Tensile strength test of single strand uncoated Katcha fiber
Fiber Length
200 mm 600 mm
TEST No Force at break (N) Tensile strength
(Mpa)
Force at break (N) Tensile strength
(Mpa)
1 4.5 348.8372 3.72 288.3721
2 4.4 341.0853 3.98 308.5271
3 4.5 348.8372 3.9 302.3256
4 4.9 379.845 4 310.0775
5 5.2 403.1008 3.7 286.8217
6 4.55 352.7132 3.77 292.2481
7 4.5 348.8372 3.88 300.7752
8 4.26 330.2326 3.99 309.3023
9 4.3 333.3333 3.92 303.876
10 4.1 317.8295 3.98 308.5271
11 4.5 348.8372 3.76 291.4729
12 4.2 325.5814 3.98 308.5271
13 4.2 325.5814 3.99 309.3023
14 4.5 348.8372 3.78 293.0233
15 4.3 333.3333 4 310.0775
16 4.18 324.031 3.88 300.7752
17 4.2 325.5814 3.9 302.3256
18 4.3 333.3333 3.92 303.876
19 4.2 325.5814 4 310.0775
20 4 310.0775 4 310.0775
Average 4.3895 340.2713 3.9 302.5
Table C-7 Tensile strength test of single strand of kerosene coated Katcha fiber
Fiber Length
200 mm 600 mm
TEST No Force at break (N) Tensile strength
(Mpa)
Force at break (N) Tensile strength
(Mpa)
1 5.3 412.0845 4 310.0775 2 5.2 403.1008 4.1 317.8295 3 4.96 384.4961 4 310.0775 4 5.2 403.1008 4.1 317.8295 5 5.2 403.1008 4 310.0775 6 4.95 383.7209 3.98 308.5271

Investigation on the Application of Katcha Fiber as a Weak Subgrade Soil Reinforcement
Blended with Sand: In case of Koyefeche Project 18 Road Project
92 ASTU M.Sc. Geotechnical Engineering July 2021
7 5.2 403.1008 4 310.0775 8 5.28 409.3023 3.99 309.3023 9 5 387.5969 4.1 317.8295 10 4.96 384.4961 4 310.0775 11 5 387.5969 3.99 309.3023 12 4.98 386.0465 4 310.0775 13 5.2 403.1008 4.2 325.5814 14 5.21 403.876 4.15 321.7054 15 5.3 410.8527 4.1 317.8295 16 5.21 403.876 4.1 317.8295 17 5.4 418.6047 4.2 325.5814 18 5.6 434.1085 4.13 320.155 19 5.45 422.4806 3.99 309.3023 20 5.5 426.3566 4 310.077 Average 5.205 403.55 4.056 314.457
Table C-8 Tensile strength test on bundles of Kerosene Uncoated Katcha fiber
Fiber Length
200 mm 600 mm
TEST No Force at break (N) Tensile strength
(Mpa)
Force at break (N) Tensile strength
(Mpa)
1 224.44 17450.612 240 18660.43 2 228.2 17742.959 327.43 25458.27 3 233.85 18182.256 238.06 18509.59 4 355.45 27636.874 205.11 15947.67 5 393.21 30572.782 200.23 15568.24 Average 287.03 22317.097 242.166 18828.84 Single
strand 343.340 313.814
Table C-9 Tensile strength test on bundles of Kerosene Coated Katcha fiber
Fiber Length
200 mm 600 mm
TEST No Force at break (N) Tensile strength
(Mpa)
Force at break (N) Tensile strength
(Mpa)
1 237.95 18501.039 187 18271.67 2 419.24 32596.661 253.04 19674.31 3 321.11 25036.077 296.26 23034.75 4 445.27 34620.540 280.21 21786.83 5 311.27 24201.800 280.85 21836.59 Average 346.968 26991.223 259.472 20920.83 Single
strand 415.250 321.859

Investigation on the Application of Katcha Fiber as a Weak Subgrade Soil Reinforcement
Blended with Sand: In case of Koyefeche Project 18 Road Project
93 ASTU M.Sc. Geotechnical Engineering July 2021
Appendix- D
Index Property of Sand Mixed soil

Investigation on the Application of Katcha Fiber as a Weak Subgrade Soil Reinforcement
Blended with Sand: In case of Koyefeche Project 18 Road Project
94 ASTU M.Sc. Geotechnical Engineering July 2021
Table D-1Specific gravity of Soil Sample1 (Pit1) with 10%, 15% and 20% sand
Test Method ASTM D-854
Sand content (%) 10%sand 15% sand 20% sand
determination number
Bottle no 3 5 12 17 13 19
Wt. of bottle + Water+ Soil (g) 164.59 166.91 167.53 167.37 163.51 164.75
T
Wt. of bottle + Water (g) 155.36 157.59 158.26 158 154.36 155.49
Wt. of bottle + Dry soil (g) 66.31 66.3 68.21 68.38 64.32 64
Wt. of bottle (g) 31.31 51.3 53.21 53.38 49.32 49.43
Wt. of soil (g) 15 15 15 15 15 15
Specific Gravity 2.600 2.641 2.618 2.664 2.564 2.613
Average Specific gravity 2.62 2.64 2.59
Table D-2 Grain Size Analysis of soil sample 1(pit 1) with 10% sand
Wet Sieve + Hydrometer
Sieve size (mm)
Retained for 1st Sieving Percent Passing
(%) Weight % Rtd.
3" 75 0.00 0.00 100.00
21/2" 63 0.00 0.00 100.00
2" 50 0.00 0.00 100.00
11/2" 37.5 0.00 0.00 100.00
1" 25 0.00 0.00 100.00
3/4" 19 0.00 0.00 100.00
1/2" 12.5 11.50 3.83 96.17
3/8" 9.5 0.00 0.00 96.17
No 4 4.75 5.30 1.77 94.40
No 10 2 7.80 2.60 91.80
No 16 1.18 10.60 3.53 88.27
No 30 0.6 13.20 4.40 83.87
No 50 0.3 11.30 3.77 80.11
No 100 0.15 5.90 1.97 78.14
No 200 0.075 3.80 1.27 76.87
Pan 230.70 76.87
Total 300 100

Investigation on the Application of Katcha Fiber as a Weak Subgrade Soil Reinforcement
Blended with Sand: In case of Koyefeche Project 18 Road Project
95 ASTU M.Sc. Geotechnical Engineering July 2021
Elapsed
Time,
t,min
Actual
Hydrometer
Reading
Ra
Temp
(oC)
Effective
Depth,
L
(mm)
K
From
Table
Temprature
Correction
Factor
Ct
Modified
Hydrometer
Reading
R= Ra -
Cz+Ct
Particle
DiameterD
(mm)
Percentage
Pass
(%)
Corrected
Percentage
Pass
(%)
0
2 44.000 20 8.87 0.01375 0.0 37.959 0.0290 76.45 58.77
5 42.000 20 9.20 0.01375 0.0 35.959 0.0187 72.42 55.67
15 40.000 20 9.53 0.01375 0.0 33.959 0.0110 68.39 52.58
30 38.500 20 9.78 0.01375 0.0 32.459 0.0079 65.37 50.25
60 35.500 20 10.27 0.01375 0.0 29.459 0.0057 59.33 45.61
250 33.000 23 10.69 0.01326 0.7 28.324 0.0027 57.04 43.85
1440 20.500 20 12.75 0.01375 0.0 14.459 0.0013 29.12 22.39
Table D-3 Grain Size Analysis of soil sample 1(pit 1) with 15% sand
Sieve size Retained for 1st Sieving Percent Passing
(mm) Weight % Retained (%)
3" 75 0.00 0.00 100.00
21/2" 63 0.00 0.00 100.00
2" 50 0.00 0.00 100.00
11/2" 37.5 0.00 0.00 100.00
1" 25 0.00 0.00 100.00
3/4" 19 0.00 0.00 100.00
1/2" 12.5 9.00 3.00 97.00
3/8" 9.5 0.00 0.00 97.00
No 4 4.75 9.00 3.00 94.00
No 10 2 6.90 2.30 91.70
No 16 1.18 11.30 3.77 87.93
No 30 0.6 16.30 5.43 82.50
No 50 0.3 16.40 5.47 77.03
No 100 0.15 8.20 2.73 74.30
No 200 0.075 3.50 1.17 73.13

Investigation on the Application of Katcha Fiber as a Weak Subgrade Soil Reinforcement
Blended with Sand: In case of Koyefeche Project 18 Road Project
96 ASTU M.Sc. Geotechnical Engineering July 2021
Pan 219.40 73.13
Total 300 100
Elapsed
Time,
t,min
Actual
Hydrometer
Reading
Ra
Temp
(oC)
Effective
Depth,
L
(mm)
K
From
Table
Temprature
Correction
Factor
Ct
Modified
Hydrometer
Reading
R= Ra -
Cz+Ct
Particle
DiameterD
(mm)
Percentage
Pass
(%)
Corrected
Percentage
Pass
(%)
0
2 43.000 20 9.04 0.01367 0.0 36.959 0.0291 74.09 54.18
5 42.000 20 9.20 0.01367 0.0 35.959 0.0185 72.08 52.72
15 40.500 20 9.45 0.01367 0.0 34.459 0.0108 69.08 50.52
30 38.000 20 9.86 0.01367 0.0 31.959 0.0078 64.07 46.85
60 36.500 20 10.11 0.01367 0.0 30.459 0.0056 61.06 44.65
250 34.000 23 10.52 0.01318 0.7 29.324 0.0027 58.78 42.99
1440 22.000 20 12.50 0.01367 0.0 15.959 0.0013 31.99 23.40
Table D-4 Grain Size Analysis of soil sample 1(pit 1) with 20% sand
Sieve size Retained for 1st Sieving Percent Passing
(mm) Weight % Rtd. (%)
3" 75 0.00 0.00 100.00
21/2" 63 0.00 0.00 100.00
2" 50 0.00 0.00 100.00
11/2" 37.5 0.00 0.00 100.00
1" 25 0.00 0.00 100.00
3/4" 19 0.00 0.00 100.00
1/2" 12.5 8.80 2.93 97.07
3/8" 9.5 5.20 1.73 95.33
No 4 4.75 4.50 1.50 93.84
No 10 2 6.20 2.07 91.77
No 16 1.18 9.00 3.00 88.77
No 30 0.6 18.00 6.00 82.77
No 50 0.3 22.80 7.60 75.17
No 100 0.15 13.40 4.47 70.71
No 200 0.075 4.70 1.57 69.14
Pan 207.50 69.14
Total 300 100

Investigation on the Application of Katcha Fiber as a Weak Subgrade Soil Reinforcement
Blended with Sand: In case of Koyefeche Project 18 Road Project
97 ASTU M.Sc. Geotechnical Engineering July 2021
Elapsed
Time,
t,min
Actual
Hydrometer
Reading
Ra
Temp
(oC)
Effective
Depth,
L
(mm)
K
From
Table
Temprature
Correction
Factor
Ct
Modified
Hydrometer
Reading
R= Ra -
Cz+Ct
Particle
DiameterD
(mm)
Percentage
Pass
(%)
Corrected
Percentage
Pass
(%)
0
2 41.000 20 9.37 0.01388 0.0 34.959 0.0300 70.91 49.03
5 38.000 20 9.86 0.01388 0.0 31.959 0.0195 64.83 44.82
15 37.000 20 10.03 0.01388 0.0 30.959 0.0113 62.80 43.42
30 35.000 20 10.36 0.01388 0.0 28.959 0.0082 58.74 40.62
60 33.000 20 10.69 0.01388 0.0 26.959 0.0059 54.69 37.81
250 30.000 23 11.18 0.01339 0.7 25.324 0.0028 51.37 35.52
1440 20.000 20 12.83 0.01388 0.0 13.959 0.0013 28.32 19.58
Figure D-1 Particle size distribution curve of Pit 1 soil with 10%, 15% and 20% sand
0
10
20
30
40
50
60
70
80
90
100
0.00010.0010.010.1110100
Per
cent
Pas
s (%
)
Grain Size (mm)
100% soil and 0% sand90% soil and 10% sand85% soil and 15% sand80% soil and 20 % sand
Cobble Gravel Sand Size
Silt Clay
Fine Grained

Investigation on the Application of Katcha Fiber as a Weak Subgrade Soil Reinforcement
Blended with Sand: In case of Koyefeche Project 18 Road Project
98 ASTU M.Sc. Geotechnical Engineering July 2021
Table D-5 Liquid Limit and Plastic Limit of Pit 1 Soil with 10% sand
Test Method ASTM-D 4318 Type of Test Liquid Limit Test Plastic Limit Test
Trial 1
Trial 2
Trial 3
Trial 4
Trial 1
Trial 2
No. of Blows N 33 25 22 15 - -
Mass of moist
Sample + Can M1
26.50 28.40 30.40 34.50 25.50 25.40
Mass of Dried
Sample + Can M2
22.00 23.00 24.00 26.00 22.30 22.20
Mass of Can Mc 14.94 15.09 14.63 14.88 14.85 14.58
Mass of Moist Mm=M1-M2 4.50 5.40 6.40 8.50 3.20 3.20
Mass of Dried
Sample Md=M2-Mc
7.06 7.91 9.37 11.12 7.45 7.62
Moisture Content
(%)
= (Mm / Md ) x
100 63.74 68.27 68.30 76.44 42.95 41.99
Liquid Limit = 67.5 % Plastic Limit= 42.47%
Plasticity Index (PI = LL - PL) = 24.53
Figure D-2 Liquid limit determination of Pit 1 Soil with 10% Sand
30.00
40.00
50.00
60.00
70.00
80.00
90.00
100.00
10 100
Mois
ture
Conte
nt
%
Number of blows

Investigation on the Application of Katcha Fiber as a Weak Subgrade Soil Reinforcement
Blended with Sand: In case of Koyefeche Project 18 Road Project
99 ASTU M.Sc. Geotechnical Engineering July 2021
Table D-6 Liquid Limit and Plastic Limit of pit 1Soil with 15% sand
Test Method ASTM-D 4318
Type of Test Liquid Limit Test Plastic Limit Test
Trial 1
Trial 2
Trial 3
Trial 4
Trial 1
Trial 2
No. of Blows N 32 28 22 17 - -
Mass of moist
Sample + Can M1
25.45 25.83 27.00 28.50 28.22 29.11
Mass of Dried
Sample + Can M2
21.50 21.56 22.30 23.00 24.28 25.05
Mass of Can Mc 14.87 14.52 14.88 15.07 14.85 14.58
Mass of Moist Mm=M1-M2 3.95 4.27 4.70 5.50 3.94 4.06
Mass of Dried
Sample Md=M2-Mc
6.63 7.04 7.42 7.93 9.43 10.47
Moisture
Content (%)
= (Mm / Md )
x 100 59.58 60.65 63.34 69.36 41.78 38.78
Liquid Limit = 62.5 % Plastic Limit= 40.28%
Plasticity Index (PI = LL - PL) = 22.22
Figure D-3 Liquid Limit determination of Pit 1) Soil with 15% Sand
30.00
40.00
50.00
60.00
70.00
80.00
90.00
100.00
10 100
Mo
istu
re
Co
nte
nt
%
Number of blows

Investigation on the Application of Katcha Fiber as a Weak Subgrade Soil Reinforcement
Blended with Sand: In case of Koyefeche Project 18 Road Project
100 ASTU M.Sc. Geotechnical Engineering July 2021
Table D-7 Liquid Limit and Plastic Limit pit 1 Soil with 20% sand
Test Method ASTM-D 4318
Type of Test Liquid Limit Test Plastic Limit Test
Trial 1
Trial 2
Trial 3
Trial 4
Trial 1
Trial 2
No. of Blows
N 35 27 22 17 - -
Mass of moist
Sample + Can M1
26.20 28.30 27.20 25.40 29.43 30.64
Mass of Dried
Sample + Can M2
22.10 23.40 22.50 21.20 25.20 26.37
Mass of Can Mc 14.91 15.14 14.93 14.50 14.75 14.92
Mass of Moist Mm=M1-M2 4.10 4.90 4.70 4.20 4.23 4.27
Mass of Dried
Sample Md=M2-Mc
7.19 8.26 7.57 6.70 10.45 11.45
Moisture Content
(%)
= (Mm / Md ) x
100 57.02 59.32 62.09 62.69 40.48 37.29
Liquid Limit = 60.00 % Plastic Limit= 38.89%
Plasticity Index (PI = LL - PL) = 21.11
Figure D- 4 Liquid Limit determination of Pit 1 Soil with 20% Sand.
30.00
40.00
50.00
60.00
70.00
80.00
90.00
100.00
10 100
Mo
istu
re C
onte
nt
%
Number of Blows

Investigation on the Application of Katcha Fiber as a Weak Subgrade Soil Reinforcement
Blended with Sand: In case of Koyefeche Project 18 Road Project
101 ASTU M.Sc. Geotechnical Engineering July 2021
Table D-8 Volumetric Shrinkage of Pit 1 Soil with 0%, 10% 15%, and 20% sand
Test Method ASTM- D427
Sand Content 0% 10% 15% 20%
Mass of dish + wet soil W1 g
64.33
64.17
62.24
61.9
59
58
57.02
55.63
Mass of dish + dry soil W3 g 53.85 53.67 52.93 51.32 49.1 49 47.26 46.33
Mass of dish Wd g 37.4 37.17 37.33 35 33 35.34 32.35 32.18
Mass of water (W1 – W3) g 10.48 10.5 9.31 10.58 9.9 9 9.76 9.3
Mass of dry soil (W3-W) =
W0 g
16.45 16.5 15.6 16.32 16.1 13.66 14.91 14.15
Mass of wet soil (W1-W) =
W2 g
26.93 27 24.91 26.9 26 22.66 24.67 23.45
Moisture Content 𝑊1−𝑊3
𝑊𝑜x 100
w %
63.71
63.64
59.68
64.83
61.49
65.89
65.46
65.72
Volume of dish V Cm3 19.00 19.50 13.50 15.60 15.5 14 17 17
Volume of dry soil V0 Cm3 11.50 12.00 6.30 7.50 7.5 6.5 8.5 8.5
Volume change (V -
V0)
ΔV ml
7.50 7.50 7.20 8.10 8.00 7.5 8.50 8.50
Unit Volume Change ΔV
Wo∗ 100
ΔU
%
45.59
45.45
46.15
49.63
49.69
54.9
57.01
60.07
Shrinkage Limit
( W- Δ U) SL %
18.12
18.18
13.53
15.20
11.80
10.98
8.45
5.65
Average Shrinkage
Limit %
18.15
14.36
11.39
7.05

Investigation on the Application of Katcha Fiber as a Weak Subgrade Soil Reinforcement
Blended with Sand: In case of Koyefeche Project 18 Road Project
102 ASTU M.Sc. Geotechnical Engineering July 2021
Appendix E
Moisture-Density Relation of Reinforced Soil and Reinforced
Sand mixed soil

Investigation on the Application of Katcha Fiber as a Weak Subgrade Soil Reinforcement
Blended with Sand: In case of Koyefeche Project 18 Road Project
103 ASTU M.Sc. Geotechnical Engineering July 2021
Table E-1 Moisture-Density relations of Reinforced Soil with 0.5% of 20mm fiber
Test Method ASTM- D 1557
Trial 1 Trial 2 Trial 3 Trial 4
Water in cc - - - -
Wt.of mould + Wet sample(g) 4512.60 4634.50 4730.00 4665.00
Wt.of mould (g) 3003.70 3003.70 3003.70 3003.70
Wt.of wet soil(g) 1508.90 1630.80 1726.30 1661.30
Volume of mould cm3 944.00 944.00 944.00 944.00
Wet Density gm /cm3 1.598 1.728 1.829 1.760
Moisture content
Wet soil + tin (g) 82.10 99.60 86.60 89.20
Dry soil + tin (g) 70.50 82.00 67.60 66.50
Wt of tin (g) 16.40 16.30 9.30 10.00
Wt of Water (g) 11.60 17.60 19.00 22.70
Wt of Dry soil (g) 54.10 65.70 58.30 56.50
Moisture content % 21.44 26.79 32.59 40.18
Dry Density gm /cm3 1.316 1.363 1.379 1.255
MDD= 1.386 gm /cm3 and OMC=31%
Figure E-1 Compaction Curve of Reinforced Soil with 0.5% of 20mm fiber
1.316
1.363
1.379
1.255
1.240
1.260
1.280
1.300
1.320
1.340
1.360
1.380
1.400
20 21 22 23 24 25 26 27 28 29 30 31 32 33 34 35 36 37 38 39 40 41 42
Dry
Den
sity
(gm
/cm
3)
Water Content (%)

Investigation on the Application of Katcha Fiber as a Weak Subgrade Soil Reinforcement
Blended with Sand: In case of Koyefeche Project 18 Road Project
104 ASTU M.Sc. Geotechnical Engineering July 2021
Table E-2 Moisture-Density relations of Reinforced Soil with 0.5% of 35mm fiber
Test Method ASTM- D 1557
Trial 1 Trial 2 Trial 3 Trial 4
Water in cc - - - -
Wt.of mould + Wet sample(g) 5395.70 5542.70 5635.20 5584.60
Wt.of mould (g) 3924.00 3924.00 3924.00 3924.00
Wt.of wet soil(g) 1471.70 1618.70 1711.20 1660.60
Volume of mould cm3 944.00 944.00 944.00 944.00
Wet Density gm /cm3 1.559 1.715 1.813 1.759
Moisture content
Wet soil + tin (g) 83.30 84.20 69.90 104.30
Dry soil + tin (g) 71.00 69.40 55.00 80.20
Wt of tin (g) 17.30 16.70 10.10 16.60
Wt of Water (g) 12.30 14.80 14.90 24.10
Wt of Dry soil (g) 53.70 52.70 44.90 63.60
Moisture content % 22.91 28.08 33.18 37.89
Dry Density gm /cm3 1.268 1.339 1.361 1.276
MDD= 1.365gm /cm3 and OMC=32%
Figure E-2 Compaction Curve of Reinforced Soil with 0.5% of 35mm fiber
1.268
1.339
1.361
1.276
1.200
1.220
1.240
1.260
1.280
1.300
1.320
1.340
1.360
1.380
20 21 22 23 24 25 26 27 28 29 30 31 32 33 34 35 36 37 38 39 40 41
Dry
Den
sity
(g
m/c
m3)
Water Content (%)

Investigation on the Application of Katcha Fiber as a Weak Subgrade Soil Reinforcement
Blended with Sand: In case of Koyefeche Project 18 Road Project
105 ASTU M.Sc. Geotechnical Engineering July 2021
Table E-3 Moisture-Density relations of Reinforced Soil with 0.5% of 50mm fiber
Test Method ASTM- D 1557
Trial 1 Trial 2 Trial 3 Trial 4
Water in cc - - - -
Wt.of mould + Wet sample(g) 5052.90 5197.80 5239.40 5168.50
Wt.of mould (g) 3535.40 3535.40 3535.40 3535.40
Wt.of wet soil(g) 1517.50 1662.40 1704.00 1633.10
Volume of mould cm3 944.00 944.00 944.00 944.00
Wet Density gm /cm3 1.608 1.761 1.805 1.730
Moisture content
Wet soil + tin (g) 77.50 110.30 114.90 101.30
Dry soil + tin (g) 65.10 88.20 90.10 78.80
Wt of tin (g) 17.00 16.60 17.10 17.00
Wt of Water (g) 12.40 22.10 24.80 22.50
Wt of Dry soil (g) 48.10 71.60 73.00 61.80
Moisture content % 25.78 30.87 33.97 36.41
Dry Density gm /cm3 1.278 1.346 1.347 1.268
MDD= 1.356 gm /cm3 and OMC=32.56%
Figure E-3 Compaction Curve of Reinforced Soil with 0.5% of 50mm fiber
1.278
1.346 1.347
1.268
1.250
1.260
1.270
1.280
1.290
1.300
1.310
1.320
1.330
1.340
1.350
1.360
1.370
1.380
25 26 27 28 29 30 31 32 33 34 35 36 37 38
Dry
Den
sity
(gm
/cm
3)
Water Content (%)

Investigation on the Application of Katcha Fiber as a Weak Subgrade Soil Reinforcement
Blended with Sand: In case of Koyefeche Project 18 Road Project
106 ASTU M.Sc. Geotechnical Engineering July 2021
Table E-4 Moisture-Density relations of Reinforced Soil with 1% of 20mm fiber
Test Method ASTM- D 1557
Trial 1 Trial 2 Trial 3 Trial 4
Water in cc - - - -
Wt.of mould + Wet sample(g) 5460.70 5520.20 5609.60 5590.00
Wt.of mould (g) 3924.00 3924.00 3924.00 3924.00
Wt.of wet soil(g) 1536.70 1596.20 1685.60 1666.00
Volume of mould cm3 944.00 944.00 944.00 944.00
Wet Density gm /cm3 1.628 1.691 1.786 1.765
Moisture content
Wet soil + tin (g) 98.70 101.30 82.90 88.80
Dry soil + tin (g) 79.50 80.50 65.30 69.70
Wt of tin (g) 9.80 10.00 11.60 17.30
Wt of Water (g) 19.20 20.80 17.60 19.10
Wt of Dry soil (g) 69.70 70.50 53.70 52.40
Moisture content % 27.55 29.50 32.77 36.45
Dry Density gm /cm3 1.276 1.306 1.345 1.293
MDD= 1.345gm /cm3 and OMC=32.56%
Figure E-4 Compaction Curve of Reinforced Soil with 1% of 20mm fiber
1.276
1.306
1.345
1.293
1.250
1.260
1.270
1.280
1.290
1.300
1.310
1.320
1.330
1.340
1.350
1.360
25 26 27 28 29 30 31 32 33 34 35 36 37 38
Dry
Den
sity
(gm
/cm
3)
Water Content (%)

Investigation on the Application of Katcha Fiber as a Weak Subgrade Soil Reinforcement
Blended with Sand: In case of Koyefeche Project 18 Road Project
107 ASTU M.Sc. Geotechnical Engineering July 2021
Table E-5 Moisture-Density relations of Reinforced Soil with 1% of 35mm fiber
Test Method ASTM- D 1557
Trial 1 Trial 2 Trial 3 Trial 4
Water in cc - - - -
Wt.of mould + Wet sample(g) 5268.90 5376.30 5397.20 5353.70
Wt.of mould (g) 3710.30 3710.30 3710.30 3710.30
Wt.of wet soil(g) 1558.60 1666.00 1686.90 1643.40
Volume of mould cm3 944.00 944.00 944.00 944.00
Wet Density gm /cm3 1.651 1.765 1.787 1.741
Moisture content
Wet soil + tin (g) 93.70 95.90 96.90 73.00
Dry soil + tin (g) 74.80 76.60 75.60 55.30
Wt of tin (g) 10.00 17.30 16.60 10.00
Wt of Water (g) 18.90 19.30 21.30 17.70
Wt of Dry soil (g) 64.80 59.30 59.00 45.30
Moisture content % 29.17 32.55 36.10 39.07
Dry Density gm /cm3 1.278 1.331 1.313 1.252
MDD= 1.33gm /cm3 and OMC=33.33%
Figure E-5 Compaction Curve of Reinforced Soil with 1% of 35mm fiber
1.278
1.331
1.313
1.252
1.240
1.250
1.260
1.270
1.280
1.290
1.300
1.310
1.320
1.330
1.340
24 25 26 27 28 29 30 31 32 33 34 35 36 37 38 39 40
Dry
Den
sity
(gm
/cm
3)
Water Content (%)

Investigation on the Application of Katcha Fiber as a Weak Subgrade Soil Reinforcement
Blended with Sand: In case of Koyefeche Project 18 Road Project
108 ASTU M.Sc. Geotechnical Engineering July 2021
Table E-6 Moisture-Density relations of Reinforced Soil with 1% of 50mm fiber
Test Method ASTM- D 1557
Trial 1 Trial 2 Trial 3 Trial 4
Water in cc - - - -
Wt.of mould + Wet sample(g) 4481.20 4548.00 4647.00 4618.00
Wt.of mould (g) 3003.70 3003.70 3003.70 3003.70
Wt.of wet soil(g) 1477.50 1544.30 1643.30 1614.30
Volume of mould cm3 944.00 944.00 944.00 944.00
Wet Density gm /cm3 1.565 1.636 1.741 1.710
Moisture content
Wet soil + tin (g) 99.00 106.70 94.60 100.80
Dry soil + tin (g) 82.30 85.10 74.80 78.20
Wt of tin (g) 17.60 9.80 16.20 16.70
Wt of Water (g) 16.70 21.60 19.80 22.60
Wt of Dry soil (g) 64.70 75.30 58.60 61.50
Moisture content % 25.81 28.69 33.79 36.75
Dry Density gm /cm3 1.244 1.271 1.301 1.251
MDD= 1.302gm /cm3 and OMC=33.35%
Figure E-6 Compaction Curve of Reinforced Soil with 1% of 50mm fiber
1.244
1.271
1.301
1.251
1.240
1.250
1.260
1.270
1.280
1.290
1.300
1.310
1.320
25 26 27 28 29 30 31 32 33 34 35 36 37 38
Dry
Den
sity
(gm
/cm
3)
Water Content (%)
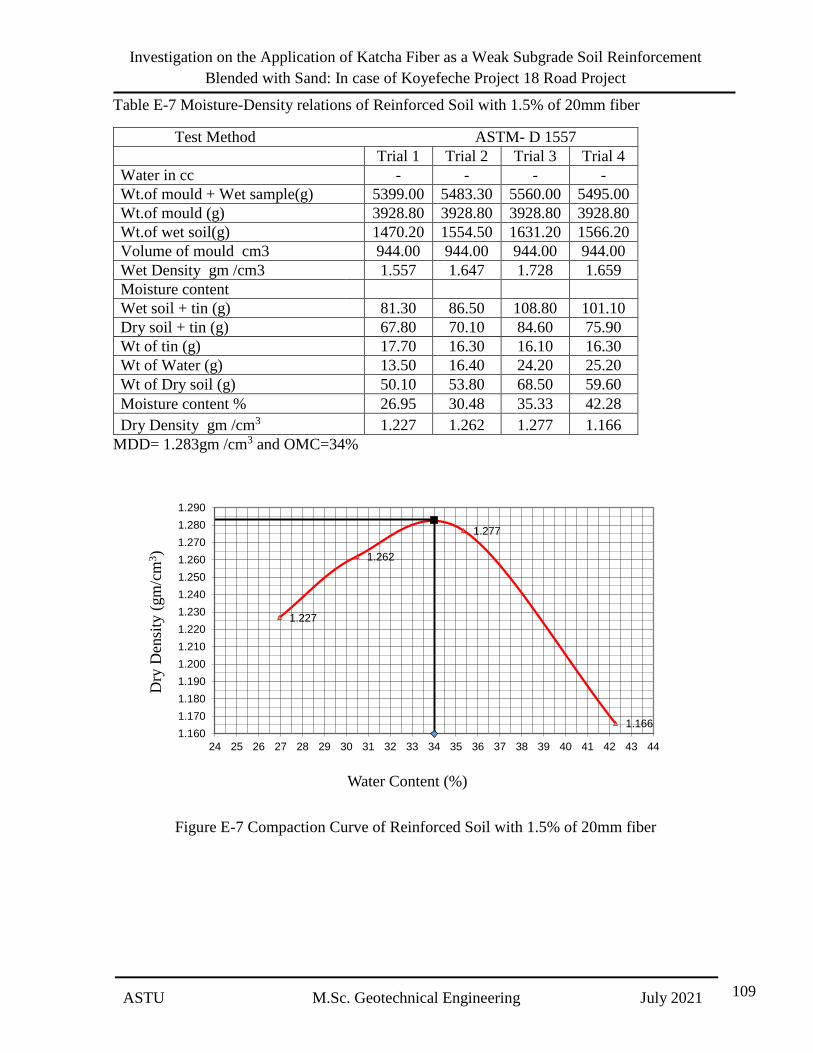
Investigation on the Application of Katcha Fiber as a Weak Subgrade Soil Reinforcement
Blended with Sand: In case of Koyefeche Project 18 Road Project
109 ASTU M.Sc. Geotechnical Engineering July 2021
Table E-7 Moisture-Density relations of Reinforced Soil with 1.5% of 20mm fiber
Test Method ASTM- D 1557
Trial 1 Trial 2 Trial 3 Trial 4
Water in cc - - - -
Wt.of mould + Wet sample(g) 5399.00 5483.30 5560.00 5495.00
Wt.of mould (g) 3928.80 3928.80 3928.80 3928.80
Wt.of wet soil(g) 1470.20 1554.50 1631.20 1566.20
Volume of mould cm3 944.00 944.00 944.00 944.00
Wet Density gm /cm3 1.557 1.647 1.728 1.659
Moisture content
Wet soil + tin (g) 81.30 86.50 108.80 101.10
Dry soil + tin (g) 67.80 70.10 84.60 75.90
Wt of tin (g) 17.70 16.30 16.10 16.30
Wt of Water (g) 13.50 16.40 24.20 25.20
Wt of Dry soil (g) 50.10 53.80 68.50 59.60
Moisture content % 26.95 30.48 35.33 42.28
Dry Density gm /cm3 1.227 1.262 1.277 1.166
MDD= 1.283gm /cm3 and OMC=34%
Figure E-7 Compaction Curve of Reinforced Soil with 1.5% of 20mm fiber
1.227
1.262
1.277
1.1661.160
1.170
1.180
1.190
1.200
1.210
1.220
1.230
1.240
1.250
1.260
1.270
1.280
1.290
24 25 26 27 28 29 30 31 32 33 34 35 36 37 38 39 40 41 42 43 44
Dry
Den
sity
(gm
/cm
3)
Water Content (%)

Investigation on the Application of Katcha Fiber as a Weak Subgrade Soil Reinforcement
Blended with Sand: In case of Koyefeche Project 18 Road Project
110 ASTU M.Sc. Geotechnical Engineering July 2021
Table E-8 Moisture-Density relations of Reinforced Soil with 1.5% of 35mm fiber
Test Method ASTM- D 1557
Trial 1 Trial 2 Trial 3
Water in cc - - -
Wt.of mould + Wet sample(g) 5411.70 5543.40 5492.00
Wt.of mould (g) 3921.00 3921.00 3921.00
Wt.of wet soil(g) 1490.70 1622.40 1571.00
Volume of mould cm3 944.00 944.00 944.00
Wet Density gm /cm3 1.579 1.719 1.664
Moisture content
Wet soil + tin (g) 101.70 96.00 115.30
Dry soil + tin (g) 80.90 75.10 86.30
Wt of tin (g) 16.70 17.00 17.20
Wt of Water (g) 20.80 20.90 29.00
Wt of Dry soil (g) 64.20 58.10 69.10
Moisture content % 32.40 35.97 41.97
Dry Density gm /cm3 1.193 1.264 1.172
MDD= 1.264gm /cm3 and OMC=35.7%
Figure E-8 Compaction Curve of Reinforced Soil with 1.5% of 35mm fiber
1.193
1.264
1.172
1.160
1.170
1.180
1.190
1.200
1.210
1.220
1.230
1.240
1.250
1.260
1.270
32 33 34 35 36 37 38 39 40 41 42 43
Dry
Den
sity
(gm
/cm
3)
Water Content (%)

Investigation on the Application of Katcha Fiber as a Weak Subgrade Soil Reinforcement
Blended with Sand: In case of Koyefeche Project 18 Road Project
111 ASTU M.Sc. Geotechnical Engineering July 2021
Table E-9 Moisture-Density relations of Reinforced Soil with 1.5% of 50mm fiber
Test Method ASTM- D 1557
Trial 1 Trial 2 Trial 3 Trial 4
Water in cc - - - -
Wt.of mould + Wet sample(g) 5426.00 5548.00 5536.00 5498.00
Wt.of mould (g) 3921.00 3921.00 3921.00 3921.00
Wt.of wet soil(g) 1505.00 1627.00 1615.00 1577.00
Volume of mould cm3 944.00 944.00 944.00 944.00
Wet Density gm /cm3 1.594 1.724 1.711 1.671
Moisture content
Wet soil + tin (g) 94.20 102.40 104.10 107.00
Dry soil + tin (g) 72.90 79.10 79.30 80.00
Wt of tin (g) 9.70 16.40 16.60 16.00
Wt of Water (g) 21.30 23.30 24.80 27.00
Wt of Dry soil (g) 63.20 62.70 62.70 64.00
Moisture content % 33.70 37.16 39.55 42.19
Dry Density gm /cm3 1.192 1.257 1.226 1.175
DD= 1.255gm /cm3 and OMC=37.48%
Figure E-9 Compaction Curve of Reinforced Soil with 1.5% of 50mm fiber
1.192
1.257
1.226
1.175
1.160
1.170
1.180
1.190
1.200
1.210
1.220
1.230
1.240
1.250
1.260
1.270
32 33 34 35 36 37 38 39 40 41 42 43
Dry
Den
sity
(gm
/cm
3)
Water Content (%)

Investigation on the Application of Katcha Fiber as a Weak Subgrade Soil Reinforcement
Blended with Sand: In case of Koyefeche Project 18 Road Project
112 ASTU M.Sc. Geotechnical Engineering July 2021
Table E-10 Moisture-Density relations of Stabilized Soil with 1% of 35mm +10% Sand
Test Method ASTM- D 1557
Lab.test No. Trial 1 Trial 2 Trial 3 Trial 4
Water in cc - - - -
Wt.of mould + Wet sample(g) 4525.8 4717.4 4641.6 4616.00
Wt.of mould (g) 3001.8 3001.8 3001.8 3001.8
Wt.of wet soil(g) 1524.0 1715.6 1639.8 1614.2
Volume of mould cm3 944 944 944 944
Wet Density gm /cm3 1.61 1.82 1.74 1.71
Moisture content
Wet soil + tin (g) 101.10 100.20 108.70 109.40
Dry soil + tin (g) 86.00 81.50 86.10 86.10
Wt of tin (g) 16.3 16.3 16.6 16.6
Wt of Water (g) 15.10 18.70 22.60 23.30
Wt of Dry soil (g) 69.7 65.2 69.5 69.5
Moisture content % 21.66 28.68 32.52 33.53
Dry Density gm /cm3 1.240 1.412 1.311 1.281
Figure E-10 Compaction Curve of Reinforced Soil with 1% of 35mm+10% Sand
1.240
1.412
1.311
1.281
1.220
1.240
1.260
1.280
1.300
1.320
1.340
1.360
1.380
1.400
1.420
20 21 22 23 24 25 26 27 28 29 30 31 32 33 34 35 36 37 38
Dry
Den
sity
(gm
/cm
3)
Water Content (%)

Investigation on the Application of Katcha Fiber as a Weak Subgrade Soil Reinforcement
Blended with Sand: In case of Koyefeche Project 18 Road Project
113 ASTU M.Sc. Geotechnical Engineering July 2021
Table E-11 Moisture-Density relations of Stabilized Soil with 1% of 35mm +15% Sand
Test Method ASTM- D 1557
Lab.test No. Trial 1 Trial 2 Trial 3 Trial 4
Water in cc - - - -
Wt.of mould + Wet sample(g) 5467 5622 5608 5596
Wt.of mould (g) 3929.1 3929.1 3929.1 3929.1
Wt.of wet soil(g) 1537.9 1692.9 1678.90 1666.9
Volume of mould cm3 944 944 944 944
Wet Density gm /cm3 1.63 1.79 1.778 1.766
Moisture content
Wet soil + tin (g) 113.60 130.30 131.1 131
Dry soil + tin (g) 96.50 107.00 104.5 103.7
Wt of tin (g) 16.6 16.9 16 16
Wt of Water (g) 17.10 23.30 26.60 27.3
Wt of Dry soil (g) 79.9 90.1 88.5 87.7
Moisture content % 21.4 25.86 30.06 31.13
Dry Density gm /cm3 1.342 1.425 1.367 1.347
Figure E-11 Compaction Curve of Reinforced Soil with 1% of 35mm+15% Sand
1.342
1.425
1.367
1.347
1.300
1.320
1.340
1.360
1.380
1.400
1.420
1.440
20 21 22 23 24 25 26 27 28 29 30 31 32 33 34
Dry
Den
sity
(gm
/cm
3)
Water Content (%)

Investigation on the Application of Katcha Fiber as a Weak Subgrade Soil Reinforcement
Blended with Sand: In case of Koyefeche Project 18 Road Project
114 ASTU M.Sc. Geotechnical Engineering July 2021
Table E-12 Moisture-Density relations of Stabilized Soil with 1% of 35mm +20% Sand
Test Method ASTM- D 1557
Lab.test No. Trial 1 Trial 2 Trial 3 Trial 4
Water in cc - - - -
Wt.of mould + Wet sample(g) 4490.4 4676.9 4709.3 4681.8
Wt.of mould (g) 3001.8 3001.8 3001.8 3001.8
Wt.of wet soil(g) 1488.6 1675.1 1707.5 1680.0
Volume of mould cm3 944 944 944 944
Wet Density gm /cm3 1.58 1.77 1.81 1.78
Moisture content
Wet soil + tin (g) 146.90 153.60 118.60 145.10
Dry soil + tin (g) 130.10 130.90 95.60 110.50
Wt of tin (g) 32.7 33.1 16.8 10.4
Wt of Water (g) 16.80 22.70 23.00 34.60
Wt of Dry soil (g) 97.4 97.8 78.8 100.1
Moisture content % 17.25 23.21 29.19 34.57
Dry Density gm /cm3 1.3449 1.4402 1.4001 1.3225
Figure E-12 Compaction Curve of Reinforced Soil with 1% of 35mm+20% Sand
1.345
1.440
1.400
1.323
1.300
1.320
1.340
1.360
1.380
1.400
1.420
1.440
1.460
1.480
1.500
14 16 18 20 22 24 26 28 30 32 34 36
Dry
Den
sity
(g
m/c
m3)
Water Content (%)

Investigation on the Application of Katcha Fiber as a Weak Subgrade Soil Reinforcement
Blended with Sand: In case of Koyefeche Project 18 Road Project
115 ASTU M.Sc. Geotechnical Engineering July 2021
Appendix-F
California Bearing Ratio (CBR) Test Results

Investigation on the Application of Katcha Fiber as a Weak Subgrade Soil Reinforcement
Blended with Sand: In case of Koyefeche Project 18 Road Project
116 ASTU M.Sc. Geotechnical Engineering July 2021
Table F-1 CBR Test Data
Plunger Area 1935 mm 2 Rammer Weight 4.54 kg Blows/ Layer 56/5 Diameter of mould 152.4 mm Volume of mold 2124 cm Ring Calibration Factor 46.367 N/division
All the CBR tests were conducted based on the above data provided and compacted at OMC
and MDD of each soil sample.

Investigation on the Application of Katcha Fiber as a Weak Subgrade Soil Reinforcement
Blended with Sand: In case of Koyefeche Project 18 Road Project
117 ASTU M.Sc. Geotechnical Engineering July 2021
Table F-2 CBR and Swell of Reinforced Soil with 0.5% of 20mm fiber
Test Method ASTM-D1883
Penetration
mm
Load dial
divs.
Ring Factor
N/div
Load
(kN) Swell Data
0 0 46.367 0.00
Gauge
reading
0.64 4 " 0.19 Initial Final
1.27 6 " 0.28 1223.000 2082.000
1.91 7.5 " 0.35
Swell
(%) 6.76
2.54 8.5 " 0.39
3.81 10 " 0.46
5.08 11 " 0.51
7.62 12 " 0.56
0.00
Penetration in mm
Load ,kN Standard Load,
KN
CBR, % % Swell
2.54 0.39 13.2 2.99 6.76
5.08 0.51 20.0 2.55
Figure F-1 Load versus Penetration curve of Reinforced soil with 0.5% of 20mm fiber
0.00
0.20
0.40
0.60
0 1 2 3 4 5 6 7 8
Load
(kN
)
Penetration (mm)

Investigation on the Application of Katcha Fiber as a Weak Subgrade Soil Reinforcement
Blended with Sand: In case of Koyefeche Project 18 Road Project
118 ASTU M.Sc. Geotechnical Engineering July 2021
Table F-3 CBR and Swell of Reinforced Soil with 0.5% of 35mm fiber
Test Method ASTM-D1883
Penetration mm Load dial
divs.
Ring Factor
N/div
Load (kN) Swell Data
0 0 46.367 0.00 Gauge
reading
0.64 4 " 0.19 Initial Final
1.27 6.5 " 0.30 1770.000 2569.000
1.91 8 " 0.37 Swell (%) 6.29
2.54 9.0 " 0.42
3.81 10 " 0.46
5.08 11 " 0.51
7.62 12 " 0.56
CBR Results
Penetration (mm) Load ,kN Standard Load,
kN
CBR, % % Swell
2.54 0.42 13.2 3.16 6.29
5.08 0.51 20.0 2.55
Figure F-2 Load versus Penetration curve of Reinforced soil with 0.5% of 35mm fiber
0.00
0.20
0.40
0.60
0 1 2 3 4 5 6 7 8
Lo
ad (
kN
)
Penetration (mm)

Investigation on the Application of Katcha Fiber as a Weak Subgrade Soil Reinforcement
Blended with Sand: In case of Koyefeche Project 18 Road Project
119 ASTU M.Sc. Geotechnical Engineering July 2021
Table F-4 CBR and Swell of Reinforced Soil with 0.5% of 50mm fiber
Test Method ASTM-D1883
Penetration
mm
Load dial
divs.
Ring Factor
N/div
Load
(kN) Swell Data
0 0 46.367 0.00
Gauge
reading
0.64 3.5 " 0.16 Initial Final
1.27 5.5 " 0.26 960.000 1736.000
1.91 7 " 0.32 Swell (%) 6.11
2.54 8.5 " 0.39
3.81 9.5 " 0.44
5.08 10.5 " 0.49
7.62 11 " 0.51
0.00
CBR Results
Penetration (mm) Load ,kN Standard Load,
kN
CBR, % % Swell
2.54 0.39 13.2 2.99 6.11
5.08 0.49 20.0 2.43
Figure F-3 Load versus Penetration curve of Reinforced soil with 0.5% of 50mm fiber
0.00
0.20
0.40
0.60
0 1 2 3 4 5 6 7 8
Lo
ad (
kN
)
Penetration (mm)

Investigation on the Application of Katcha Fiber as a Weak Subgrade Soil Reinforcement
Blended with Sand: In case of Koyefeche Project 18 Road Project
120 ASTU M.Sc. Geotechnical Engineering July 2021
Table F-5 CBR and Swell of Reinforced Soil with 1% of 20mm fiber
Test Method ASTM-D1883
Penetration mm Load dial
divs.
Ring Factor
N/div Load (kN)
Swell Data
0 0 46.367 0.00
Gauge
reading
0.64 5.5 " 0.26 Initial Final
1.27 8.5 " 0.39 651.000 1324.000
1.91 11 " 0.51 Swell (%) 5.30
2.54 12.5 " 0.58
3.81 13.5 " 0.63
5.08 14.5 " 0.67
7.62 15 " 0.70
CBR Results
Penetration (mm) Load (KN) Standard Load (Kn) CBR
(%)
% Swell
2.54 0.58 13.2 4.39 5.30
5.08 0.67 20.0 3.36
Figure F-4 Load versus Penetration curve of Reinforced soil with 1% of 20mm fiber
0.00
0.40
0.80
0 1 2 3 4 5 6 7 8
Lo
ad (
kN
)
Penetration (mm)

Investigation on the Application of Katcha Fiber as a Weak Subgrade Soil Reinforcement
Blended with Sand: In case of Koyefeche Project 18 Road Project
121 ASTU M.Sc. Geotechnical Engineering July 2021
Table F-6 CBR and Swell of Reinforced Soil with 1% of 35 mm fiber
Test Method ASTM-D1883
Penetration
(mm)
Load dial
divs.
Ring Factor
N/div
Load (kN) Swell Data
0 0 46.367 0.00 Gauge
reading
0.64 6 " 0.28 Initial Final
1.27 10 " 0.46 514.000 1156.000
1.91 13 " 0.60 Swell(%) 5.06
2.54 14.5 " 0.67
3.81 15.5 " 0.72
5.08 16.5 " 0.77
7.62 17 " 0.79
CBR Results
Penetration (mm) Load (kN) Standard Load (kN) CBR (%) % Swell
2.54 0.67 13.2 5.09 5.06
5.08 0.77 20.0 3.83
Figure F-5 Load versus Penetration curve of Reinforced soil with 1% of 35 mm fiber
0.00
0.40
0.80
1.20
0 1 2 3 4 5 6 7 8
Load
(kN
)
Penetration (mm)

Investigation on the Application of Katcha Fiber as a Weak Subgrade Soil Reinforcement
Blended with Sand: In case of Koyefeche Project 18 Road Project
122 ASTU M.Sc. Geotechnical Engineering July 2021
Table F-7 CBR and Swell of Reinforced Soil with 1% of 50 mm fiber
Test Method ASTM-D1883
Penetration
mm
Load dial
divs.
Ring Factor
N/div Load (kN)
Swell Data
0 0 46.367 0.00
Gauge
reading
0.64 4 " 0.19 Initial Final
1.27 7 " 0.32 1449.000 2171.000
1.91 9 " 0.42 Swell(%) 5.69
2.54 10.5 " 0.49
3.81 12 " 0.56
5.08 13.5 " 0.63
7.62 14 " 0.65
0.00
CBR Results
Penetration (mm) Load (kN) Standard Load (kN) CBR, % % Swell
2.54 0.49 13.2 3.69 5.69
5.08 0.63 20.0 3.13
Figure F-6 Load versus Penetration curve of Reinforced soil with 1% of 50 mm fiber
0.00
0.80
0 1 2 3 4 5 6 7 8
Lo
ad (
kN
)
Penetration (mm)

Investigation on the Application of Katcha Fiber as a Weak Subgrade Soil Reinforcement
Blended with Sand: In case of Koyefeche Project 18 Road Project
123 ASTU M.Sc. Geotechnical Engineering July 2021
Table F-8 CBR and Swell of Reinforced Soil with 1.5% of 20 mm fiber
Test Method ASTM-D1883
Penetration
mm
Load dial
divs.
Ring Factor
N/div Load (kN)
Swell Data
0 0 46.367 0.00
Gauge
reading
0.64 4.5 " 0.21 Initial Final
1.27 7 " 0.32 1536.000 2275.000
1.91 8.5 " 0.39 Swell(%) 5.82
2.54 9.5 " 0.44
3.81 10.5 " 0.49
5.08 11.5 " 0.53
7.62 12 " 0.56
0.00
Penetration (mm) Load ,kN Standard Load, kN CBR, % % Swell
2.54 0.44 13.2 3.34 5.82
5.08 0.53 20.0 2.67
Figure F-7 Load versus Penetration curve of Reinforced soil with 1.5% of 20 mm fiber
0.00
0.40
0.80
0 1 2 3 4 5 6 7 8
Load
(kN
)
Penetration (mm)

Investigation on the Application of Katcha Fiber as a Weak Subgrade Soil Reinforcement
Blended with Sand: In case of Koyefeche Project 18 Road Project
124 ASTU M.Sc. Geotechnical Engineering July 2021
Table F-9 CBR and Swell of Reinforced Soil with 1.5% of 35 mm fiber
Test Method ASTM-D1883
Penetration
mm
Load dial
divs.
Ring Factor
N/div Load (kN)
Swell Data
0 0 46.367 0.00
Gauge
reading
0.64 4 " 0.19 Initial Final
1.27 6 " 0.28 1467.000 2238.000
1.91 7.5 " 0.35 Swell(%) 6.07
2.54 8.5 " 0.39
3.81 9.5 " 0.44
5.08 10.5 " 0.49
7.62 11 " 0.51
0.00
CBR Results
Penetration (mm) Load (kN) Standard Load (kN) CBR (%) % Swell
2.54 0.39 13.2 2.99 6.07
5.08 0.49 20.0 2.43
Figure F-8 Load versus Penetration curve of Reinforced soil with 1.5% of 35 mm fiber
0.00
0.40
0.80
0 1 2 3 4 5 6 7 8
Load
(kN
)
Penetration (mm)

Investigation on the Application of Katcha Fiber as a Weak Subgrade Soil Reinforcement
Blended with Sand: In case of Koyefeche Project 18 Road Project
125 ASTU M.Sc. Geotechnical Engineering July 2021
Table F-10 CBR and Swell of Reinforced Soil with 1.5% of 50 mm fiber
Test Method ASTM-D1883
Penetration
mm
Load dial
divs.
Ring Factor
N/div Load (kN)
Swell Data
0 0 46.361 0.00
Gauge
reading
0.64 3 " 0.14 Initial Final
1.27 5 " 0.23 1093.000 1891.000
1.91 6.5 " 0.30 Swell(%) 6.28
2.54 7.5 " 0.35
3.81 8.5 " 0.39
5.08 9.5 " 0.44
7.62 11 " 0.51
0.00
CBR Results
Penetration (mm) Load (kN) Standard Load (kN) CBR ( %) % Swell
2.54 0.35 13.2 2.63 6.28
5.08 0.44 20.0 2.20
Figure F-9 Load versus Penetration curve of Reinforced soil with 1.5% of 50 mm fiber
0.00
0.40
0.80
0 1 2 3 4 5 6 7 8
Load
, kN
Penetration (mm)

Investigation on the Application of Katcha Fiber as a Weak Subgrade Soil Reinforcement
Blended with Sand: In case of Koyefeche Project 18 Road Project
126 ASTU M.Sc. Geotechnical Engineering July 2021
Table F-11 CBR and Swell of Stabilized Soil with 1% of 35 mm fiber+ 10% sand
Test Method ASTM-D1883
Penetration
mm
Load dial
divs.
Ring Factor
N/div Load (kN)
Swell Data
0 0 46.367 0.00
Gauge
reading
0.64 6 " 0.28 Initial Final
1.27 9.5 " 0.44 1195.0 1843.0
1.91 13 " 0.60 Swell(%) 5.10
2.54 15.0 " 0.70
3.81 16.5 " 0.77
5.08 18 " 0.83
7.62 19 " 0.88
0.00
CBR Results
Penetration (mm) Load (KN) Standard Load (KN) CBR (%) % Swell
2.54 0.70 13.2 5.27 5.10
5.08 0.83 20.0 4.17
Figure F-10 Load versus Penetration curve of Stabilized Soil with 1% of 35mm fiber +10%
Sand
0.00
0.20
0.40
0.60
0.80
1.00
0 1 2 3 4 5 6 7 8
Load
(kN
)
Penetration (mm)

Investigation on the Application of Katcha Fiber as a Weak Subgrade Soil Reinforcement
Blended with Sand: In case of Koyefeche Project 18 Road Project
127 ASTU M.Sc. Geotechnical Engineering July 2021
Table F-12 CBR and Swell of Stabilized Soil with 1% of 35 mm fiber+15% Sand
Test Method ASTM-D1883
Penetration
mm
Load dial
divs.
Ring Factor
N/div Load (kN) Swell Data
0 0 46.367 0.00
Gauge
reading
0.64 6 " 0.28 intial final
1.27 9.5 " 0.44 870.000 1502.000
1.91 13 " 0.60 Swell(%) 4.98
2.54 15.5 " 0.72
3.81 16.5 " 0.77
5.08 18 " 0.83
7.62 19.5 " 0.90
0.00
CBR Results
Penetration (mm) Load (KN) Standard Load (KN) CBR (%) % Swell
2.54 0.72 13.2 5.44 4.98
5.08 0.83 20.0 4.17
Figure F-11 Load versus Penetration curve of Stabilized Soil with 1% of 35mm fiber +15%
sand
0.00
0.40
0.80
1.20
0 1 2 3 4 5 6 7 8
Load
(kN
)
Penetration (mm)

Investigation on the Application of Katcha Fiber as a Weak Subgrade Soil Reinforcement
Blended with Sand: In case of Koyefeche Project 18 Road Project
128 ASTU M.Sc. Geotechnical Engineering July 2021
Table F-13 CBR and Swell of Stabilized Soil with 1% of 35 mm fiber+20% Sand
Test Method ASTM-D1883
Penetration mm Load dial
divs.
Ring Factor
N/div Load (kN)
Swell Data
0 0 46.367 0.00
Gauge
reading
0.64 8 " 0.37 Initial Final
1.27 12 " 0.56 1350.000 1959.000
1.91 15 " 0.70 Swell(%) 4.80
2.54 17.0 " 0.79
3.81 18.5 " 0.86
5.08 19.5 " 0.90
7.62 20.5 " 0.95
CBR Results
Penetration (mm) Load (KN) Standard Load (kN) CBR (%) % Swell
2.54 0.79 13.2 5.97 4.80
5.08 0.90 20.0 4.52
Figure F-12 Load versus Penetration curve of Stabilized Soil with 1% of 35mm fiber +20%
Sand
0.00
0.40
0.80
1.20
0 1 2 3 4 5 6 7 8
Lo
ad, (k
N)
Penetration (mm)

Investigation on the Application of Katcha Fiber as a Weak Subgrade Soil Reinforcement
Blended with Sand: In case of Koyefeche Project 18 Road Project
129 ASTU M.Sc. Geotechnical Engineering July 2021
Table F-14 CBR and Swell of Stabilized Soil with 1% of 35 mm fiber+ 1st sand layer
Test Method ASTM-D1883
Penetration mm Load dial
divs. Ring Factor
N/div Load (kN) Swell Data
0 0 46.367 0.00
Gauge
reading
0.64 7.5 " 0.35 Initial Final
1.27 12 " 0.56 463.000 972.000
1.91 16 " 0.74 Swell(%) 4.01
2.54 19.0 " 0.88
3.81 25 " 1.16
5.08 30 " 1.39
7.62 31 " 1.44
0.00
CBR Results
Penetration (mm) Load (kN) Standard Load (kN) CBR (%) % Swell
2.54 0.88 13.2 6.67 4.01
5.08 1.39 20.0 6.96
Figure F-13 Load versus Penetration curve of Stabilized Soil with 1% of 35mm fiber+1st sand
layer
0.00
0.40
0.80
1.20
1.60
0 1 2 3 4 5 6 7 8
Load
(kN
)
Penetration (mm)

Investigation on the Application of Katcha Fiber as a Weak Subgrade Soil Reinforcement
Blended with Sand: In case of Koyefeche Project 18 Road Project
130 ASTU M.Sc. Geotechnical Engineering July 2021
Table F-15 CBR and Swell of Stabilized Soil with 1% of 35 mm fiber+ 2nd sand layer
Test Method ASTM-D1883
Penetration mm Load dial
divs.
Ring Factor
N/div Load (kN)
Swell Data
0 0 46.367 0.00
Gauge
reading
0.64 7.5 " 0.35 Initial Final
1.27 12 " 0.56 414.000 956.000
1.91 15.5 " 0.72 Swell(%) 4.27
2.54 19.0 " 0.88
3.81 24 " 1.11
5.08 28 " 1.30
7.62 29.5 " 1.37
0.00
CBR Results
Penetration (mm) Load (kN) Standard Load (kN) CBR (%) % Swell
2.54 0.88 13.2 6.67 4.27
5.08 1.30 20.0 6.49
Figure F-14 Load versus Penetration curve of Stabilized Soil with 1% of 35mm fiber+2nd
Sand layer
0.00
0.40
0.80
1.20
1.60
0 1 2 3 4 5 6 7 8
Load
(kN
)
Penetration (mm)

Investigation on the Application of Katcha Fiber as a Weak Subgrade Soil Reinforcement
Blended with Sand: In case of Koyefeche Project 18 Road Project
131 ASTU M.Sc. Geotechnical Engineering July 2021
Table F-16 CBR and Swell of Stabilized Soil with 1% of 35 mm fiber+ 3rd sand layer
Test Method ASTM-D1883
Penetration mm Load dial
divs.
Ring Factor
N/div Load (kN)
Swell Data
0 0 46.367 0.00
Gauge
reading
0.64 7 " 0.32 Initial Final
1.27 12 " 0.56 524.000 1122.000
1.91 15.5 " 0.72 Swell(%) 4.71
2.54 17.5 " 0.81
3.81 19 " 0.88
5.08 20 " 0.93
7.62 22 " 1.02
" 0.00
CBR Results
Penetration (mm) Load (kN) Standard Load (kN) CBR, % % Swell
2.54 0.81 13.2 6.15 4.71
5.08 0.93 20.0 4.64
Figure F-15 Load versus Penetration curve of Stabilized Soil with 1% of 35mm fiber+3rd sand
layer
0.00
0.40
0.80
1.20
0 1 2 3 4 5 6 7 8
Load
(kN
)
Penetration (mm)

Investigation on the Application of Katcha Fiber as a Weak Subgrade Soil Reinforcement
Blended with Sand: In case of Koyefeche Project 18 Road Project
132 ASTU M.Sc. Geotechnical Engineering July 2021
APPENDEX G
Unconfined Compressive Strength (UCS) Test Results

Investigation on the Application of Katcha Fiber as a Weak Subgrade Soil Reinforcement
Blended with Sand: In case of Koyefeche Project 18 Road Project
133 ASTU M.Sc. Geotechnical Engineering July 2021
The following data is constant for all UCS tests that were conducted for this study
Table G-1 UCS test data
Specimen Data
Diameter (mm) 37
Lenth (mm) 74
Area (AO) (mm2 ) 1075.86
Volume (mm3) 79575.86
Rate (mm/min) 1.50
Ring Factor (kN/div) 0.00205

Investigation on the Application of Katcha Fiber as a Weak Subgrade Soil Reinforcement
Blended with Sand: In case of Koyefeche Project 18 Road Project
134 ASTU M.Sc. Geotechnical Engineering July 2021
Table G-2 UCS of Soil Sample 1(pit 1)
Moisture content
Wet Sample + Container(gm) 144.90 Volume, (mm3) 79575
Dry Sample + Container(gm) 111.30
Bulk
density(gm/cm3 1.821
Wt. Of Water(gm) 36.30 Drydensity(gm/cm3) 1.399
Wt. Of Container (gm) 0.00
Wt of Dry Sample (gm) 111.30
Water Content (%) 30.19
Deformation
Dial
Reading
Load
Dial
Reading
Sample
Deformation,
ΔL(mm)
Strain
(ε)
%
Strain Corrected Area A'
Load
(kN)
Stress
(kPa)
0 0.0 0.00 0.00 0.000 1075.350 0.000 0.00
20 82.0 0.20 0.003 0.270 1078.256 0.168 155.90
40 105.0 0.40 0.005 0.541 1081.162 0.215 199.09
60 125.0 0.60 0.008 0.811 1084.069 0.256 236.38
80 145.0 0.80 0.011 1.081 1086.975 0.297 273.47
100 155.0 1.00 0.014 1.351 1089.881 0.318 291.55
120 164.0 1.20 0.016 1.622 1092.788 0.336 307.65
140 168.0 1.40 0.019 1.892 1095.694 0.344 314.32
160 169.0 1.60 0.022 2.162 1098.600 0.346 315.36
180 169.0 1.80 0.024 2.432 1101.507 0.346 314.52
200 168.0 2.00 0.027 2.703 1104.413 0.344 311.84
220 167.0 2.20 0.030 2.973 1107.319 0.342 309.17
240 166.0 2.40 0.032 3.243 1110.226 0.340 306.51
260 166.0 2.60 0.035 3.514 1113.132 0.340 305.71
280 166.0 2.80 0.038 3.784 1116.038 0.340 304.92
300 166.0 3.00 0.041 4.054 1118.945 0.340 304.13
320 166.0 3.20 0.043 4.324 1121.851 0.340 303.34
340 166.0 3.40 0.046 4.595 1124.757 0.340 302.55
360 166.0 3.60 0.049 4.865 1127.664 0.340 301.77
380 166.0 3.80 0.051 5.135 1130.570 0.340 301.00
400 165.0 4.00 0.054 5.405 1133.477 0.338 298.42
420 165.0 4.20 0.057 5.676 1136.383 0.338 297.65
440 165.0 4.40 0.059 5.946 1139.289 0.338 296.90
460 165.0 4.60 0.062 6.216 1142.196 0.338 296.14

Investigation on the Application of Katcha Fiber as a Weak Subgrade Soil Reinforcement
Blended with Sand: In case of Koyefeche Project 18 Road Project
135 ASTU M.Sc. Geotechnical Engineering July 2021
Figure G-1 Stress-strain curve of the natural soil Sample 1(pit 1)
Table G-3 UCS of Reinforced Soil by 1%, 35mm Katcha fiber
Moisture Content
Wt of Wet Sample + Container(gm) 142.00 Volume, (mm3) 79575.86
Wt of Dry Sample + Container(gm) 106.60
Bulk
density(gm/cm3) 1.784
Wt. Of Water(gm) 35.40
Dry
density(gm/cm3) 1.342
Wt. Of Container (gm) 0.00
Wt of Dry Sample (gm) 106.60
Water Content (%) 33.21
Deformation
Dial
Reading
Load
Dial
Reading
Sample
Deformation,
ΔL(mm)
Strain
(ε)
%
Strain
Corrected Area
A'
Load
(kN)
Stress
(kPa)
0 0.0 0.00 0.00 0.000 1075.350 0.000 0.00
20 55.0 0.20 0.003 0.270 1078.256 0.119 110.18
40 74.0 0.40 0.005 0.541 1081.162 0.160 147.84
60 92.0 0.60 0.008 0.811 1084.069 0.199 183.31
80 108.0 0.80 0.011 1.081 1086.975 0.233 214.61
100 124.0 1.00 0.014 1.351 1089.881 0.268 245.75
120 140.0 1.20 0.016 1.622 1092.788 0.302 276.72
140 154.0 1.40 0.019 1.892 1095.694 0.333 303.59
160 167.0 1.60 0.022 2.162 1098.600 0.361 328.35
180 180.0 1.80 0.024 2.432 1101.507 0.389 352.97
200 191.0 2.00 0.027 2.703 1104.413 0.413 373.56
220 202.0 2.20 0.030 2.973 1107.319 0.436 394.03
240 210.0 2.40 0.032 3.243 1110.226 0.454 408.57
260 220.0 2.60 0.035 3.514 1113.132 0.475 426.90
0.0020.0040.0060.0080.00
100.00120.00140.00160.00180.00200.00220.00240.00260.00280.00300.00320.00340.00360.00
0.000 0.010 0.020 0.030 0.040 0.050 0.060 0.070
Ax
ial
Str
ess
(kP
a)
Strain (ϵ)

Investigation on the Application of Katcha Fiber as a Weak Subgrade Soil Reinforcement
Blended with Sand: In case of Koyefeche Project 18 Road Project
136 ASTU M.Sc. Geotechnical Engineering July 2021
280 228.0 2.80 0.038 3.784 1116.038 0.492 441.28
300 234.0 3.00 0.041 4.054 1118.945 0.505 451.71
320 240.0 3.20 0.043 4.324 1121.851 0.518 462.09
340 246.0 3.40 0.046 4.595 1124.757 0.531 472.42
360 251.0 3.60 0.049 4.865 1127.664 0.542 480.78
380 255.0 3.80 0.051 5.135 1130.570 0.551 487.19
400 258.0 4.00 0.054 5.405 1133.477 0.557 491.66
420 260.0 4.20 0.057 5.676 1136.383 0.562 494.20
440 262.0 4.40 0.059 5.946 1139.289 0.566 496.73
460 264.0 4.60 0.062 6.216 1142.196 0.570 499.25
480 266.0 4.80 0.065 6.486 1145.102 0.575 501.75
500 268.0 5.00 0.068 6.757 1148.008 0.579 504.25
520 270.0 5.20 0.070 7.027 1150.915 0.583 506.73
540 271.0 5.40 0.073 7.297 1153.821 0.585 507.32
560 273.0 5.60 0.076 7.568 1156.727 0.590 509.78
580 275.0 5.80 0.078 7.838 1159.634 0.594 512.23
600 276.0 6.00 0.081 8.108 1162.540 0.596 512.81
620 277.0 6.20 0.084 8.378 1165.446 0.598 513.38
640 278.0 6.40 0.086 8.649 1168.353 0.600 513.95
660 280.0 6.60 0.089 8.919 1171.259 0.605 516.37
680 281.0 6.80 0.092 9.189 1174.165 0.607 516.93
700 282.0 7.00 0.095 9.459 1177.072 0.609 517.49
720 284.0 7.20 0.097 9.730 1179.978 0.613 519.87
740 285.0 7.40 0.100 10.000 1182.884 0.616 520.42
760 286.0 7.60 0.103 10.270 1185.791 0.618 520.97
780 287.0 7.80 0.105 10.541 1188.697 0.620 521.51
800 289.0 8.00 0.108 10.811 1191.604 0.624 523.87
820 291.0 8.20 0.111 11.081 1194.510 0.629 526.21
840 293.0 8.40 0.114 11.351 1197.416 0.633 528.54
860 295.0 8.60 0.116 11.622 1200.323 0.637 530.86

Investigation on the Application of Katcha Fiber as a Weak Subgrade Soil Reinforcement
Blended with Sand: In case of Koyefeche Project 18 Road Project
137 ASTU M.Sc. Geotechnical Engineering July 2021
Figure G-2 Stress-Strain curve of Reinforced Soil by 1%, 35mm Katcha fiber
Table G- 4 UCS of Reinforced Soil by 1%, 35mm Katcha fiber blended with 20% sand
Moisture Content
Wt of Wet Sample + Container(gm) 144.30 Volume, (mm3) 79575.86
Wt of Dry Sample + Container(gm) 116.20
Bulk
density(gm/cm3) 1.813
Wt. Of Water(gm) 28.1
Dry
density(gm/cm3) 1.460
Wt. Of Container (gm) 0.00
Wt of Dry Sample (gm) 116.20
Water Content (%) 24.18
Deformation
Dial
Reading
Load
Dial
Reading
Sample Deformation,
ΔL(mm) Strain(ε)
%
Strain
Corrected Area
A'
Load
(kN) Stress (kPa)
0 0.0 0.00 0.00 0.000 1075.350 0.000 0.00
20 67.0 0.20 0.003 0.270 1078.256 0.137 127.38
40 97.0 0.40 0.005 0.541 1081.162 0.199 183.92
60 127.0 0.60 0.008 0.811 1084.069 0.260 240.16
80 158.0 0.80 0.011 1.081 1086.975 0.324 297.98
100 171.0 1.00 0.014 1.351 1089.881 0.351 321.64
120 182.0 1.20 0.016 1.622 1092.788 0.373 341.42
140 192.0 1.40 0.019 1.892 1095.694 0.394 359.22
160 200.0 1.60 0.022 2.162 1098.600 0.410 373.20
180 210.0 1.80 0.024 2.432 1101.507 0.431 390.83
200 215.0 2.00 0.027 2.703 1104.413 0.441 399.08
220 220.0 2.20 0.030 2.973 1107.319 0.451 407.29
240 222.0 2.40 0.032 3.243 1110.226 0.455 409.92
0.0040.0080.00
120.00160.00200.00240.00280.00320.00360.00400.00440.00480.00520.00560.00
0.000 0.020 0.040 0.060 0.080 0.100 0.120 0.140
Ax
ial
Str
ess
(kP
a)
Strain (ϵ)

Investigation on the Application of Katcha Fiber as a Weak Subgrade Soil Reinforcement
Blended with Sand: In case of Koyefeche Project 18 Road Project
138 ASTU M.Sc. Geotechnical Engineering July 2021
260 224.0 2.60 0.035 3.514 1113.132 0.459 412.53
280 226.0 2.80 0.038 3.784 1116.038 0.463 415.13
300 228.0 3.00 0.041 4.054 1118.945 0.467 417.71
320 232.0 3.20 0.043 4.324 1121.851 0.476 423.94
340 234.0 3.40 0.046 4.595 1124.757 0.480 426.49
360 238.0 3.60 0.049 4.865 1127.664 0.488 432.66
380 242.0 3.80 0.051 5.135 1130.570 0.496 438.81
400 244.0 4.00 0.054 5.405 1133.477 0.500 441.30
420 246.0 4.20 0.057 5.676 1136.383 0.504 443.78
440 248.0 4.40 0.059 5.946 1139.289 0.508 446.24
460 250.0 4.60 0.062 6.216 1142.196 0.513 448.70
480 252.0 4.80 0.065 6.486 1145.102 0.517 451.14
500 254.0 5.00 0.068 6.757 1148.008 0.521 453.57
520 256.0 5.20 0.070 7.027 1150.915 0.525 455.99
540 258.0 5.40 0.073 7.297 1153.821 0.529 458.39
560 260.0 5.60 0.076 7.568 1156.727 0.533 460.78
580 262.0 5.80 0.078 7.838 1159.634 0.537 463.16
600 264.0 6.00 0.081 8.108 1162.540 0.541 465.53
620 266.0 6.20 0.084 8.378 1165.446 0.545 467.89
640 268.0 6.40 0.086 8.649 1168.353 0.549 470.23
660 270.0 6.60 0.089 8.919 1171.259 0.554 472.57
680 272.0 6.80 0.092 9.189 1174.165 0.558 474.89
700 274.0 7.00 0.095 9.459 1177.072 0.562 477.20
720 276.0 7.20 0.097 9.730 1179.978 0.566 479.50
740 278.0 7.40 0.100 10.000 1182.884 0.570 481.79
760 280.0 7.60 0.103 10.270 1185.791 0.574 484.07
780 282.0 7.80 0.105 10.541 1188.697 0.578 486.33
800 284.0 8.00 0.108 10.811 1191.604 0.582 488.59
820 284.0 8.20 0.111 11.081 1194.510 0.582 487.40
840 282.0 8.40 0.114 11.351 1197.416 0.578 482.79

Investigation on the Application of Katcha Fiber as a Weak Subgrade Soil Reinforcement
Blended with Sand: In case of Koyefeche Project 18 Road Project
139 ASTU M.Sc. Geotechnical Engineering July 2021
Figure G-3 Stress-Strain curve of Reinforced Soil by 1%, 35mm Katcha fiber + 20% sand
0.0020.0040.0060.0080.00
100.00120.00140.00160.00180.00200.00220.00240.00260.00280.00300.00320.00340.00360.00380.00400.00420.00440.00460.00480.00500.00
0.000 0.010 0.020 0.030 0.040 0.050 0.060 0.070 0.080 0.090 0.100 0.110 0.120 0.130 0.140
Ax
ial
Str
ess
(kP
a)
Strain (ϵ)


