
Introduction to Web Dynpro Business Graphics in SAP Web AS 6.40Jeff GeboNetWeaver Foundation RIG
SAP AG 2003, Title of Presentation, Speaker Name / 2
l Internet Graphics Services Overview
l Configuring Web Dynpro for Business Graphics
l Simple Business Graphics
l Introduction to the Chart Designer
l Advanced Business Graphics and Geo Maps
Contents:
Introduction to Business Graphics
SAP AG 2003, Title of Presentation, Speaker Name / 3
After completing this unit, you will be able to:
l Have an understanding of the IGS architecture.
l Add charts to your Web Dynpro applications.
l Use Web Dynpro IGS integration to create simple Business Graphics.
l Understand the purpose of the Chart Designer.
l Understand what Geo Maps are and how they can be integrated into Web Dynpro.
l Understand how to configure the IGS for Web Dynpro Applications.
l Configure your Java Engine to create Business Graphics
Introduction to Business Graphics: Unit Objectives
SAP AG 2003, Title of Presentation, Speaker Name / 4
After completing this topic, you will be able to:
l Have an understand of what the IGS can be used for.
l Have an understanding of the architecture of the IGS.
Internet Graphics Services Overview: Topic Objectives
SAP AG 2003, Title of Presentation, Speaker Name / 5
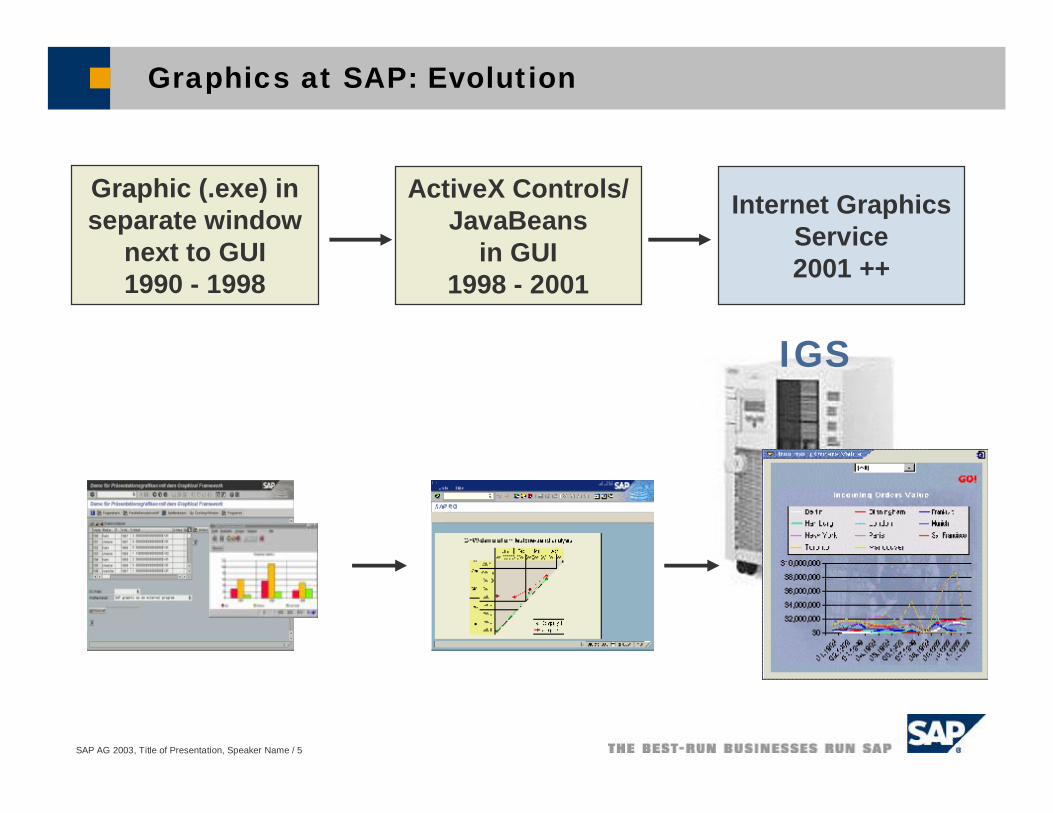
Graphic (.exe) in separate window
next to GUI1990 - 1998
Internet GraphicsService 2001 ++
IGS
Graphics at SAP: Evolution
ActiveX Controls/ JavaBeans
in GUI1998 - 2001

SAP AG 2003, Title of Presentation, Speaker Name / 6
What is the Internet Graphics Service (IGS) ?
What is it / what is it for?A server-based engine forgenerating content
How can you access the IGS?RFC or HTTPData from SAP/external system
What front end can I use?Front end-independent- SAP GUI for Windows, Java- SAP GUI for HTML- BSP applications- Web Dynpro applications- potentially ANY Web application

SAP AG 2003, Title of Presentation, Speaker Name / 7
IGS
What is the IGS used for ?
Non-graphical output
Output formatsJPEG, GIF,PNG, BMP,WBMP,VML, SVGIN: <Airport>
<NEW ORLEANS,LA,MSY>OUT: <Lat,Long>
<29-59-36.200N,090-15-28.900W>

SAP AG 2003, Title of Presentation, Speaker Name / 8
Benefits: Generates Content for Any Front End
Internet Browsers (HTML based)
Enterprise Portals
SAPGUI for Java / HTML
SAPGUI for Windows

SAP AG 2003, Title of Presentation, Speaker Name / 9
Example: Business Warehouse Map & Chart Graphic

SAP AG 2003, Title of Presentation, Speaker Name / 10
Inside IGS: Distributed Architecture
System Boundaries
Network
Communication componentData conversion (syntax)
Data interpreter (semantics)(optional) graphic generating Component
Workload-balancing check
PortwatcherPortwatcher
GeocoderGeocoder
PortwatcherPortwatcher
Semantic interpreterfor GIS Geocoder
Semantic interpreterfor GIS Geocoder
“Chart Engine“Interpreter
“Chart Engine“Interpreter
PortwatcherPortwatcher
ChartControl
ChartControl
“Chart”Interpreter
“Chart”Interpreter
GeocoderGeocoder
“GIS“Interpreter
“GIS“Interpreter
RFCListenerRFC
ListenerHTTP
ListenerHTTP
Listener
MultiplexerMultiplexer

SAP AG 2003, Title of Presentation, Speaker Name / 11
Inside IGS: Data Flow
RFCListener
RFCListener
HTTPListenerHTTP
Listener
MultiplexerMultiplexer
SAP / external system
PortwatcherPortwatcher
ChartEngineChart
Engine GeocoderGeocoder
GISInterpreter
GISInterpreter
Query
ChartRequest
Results
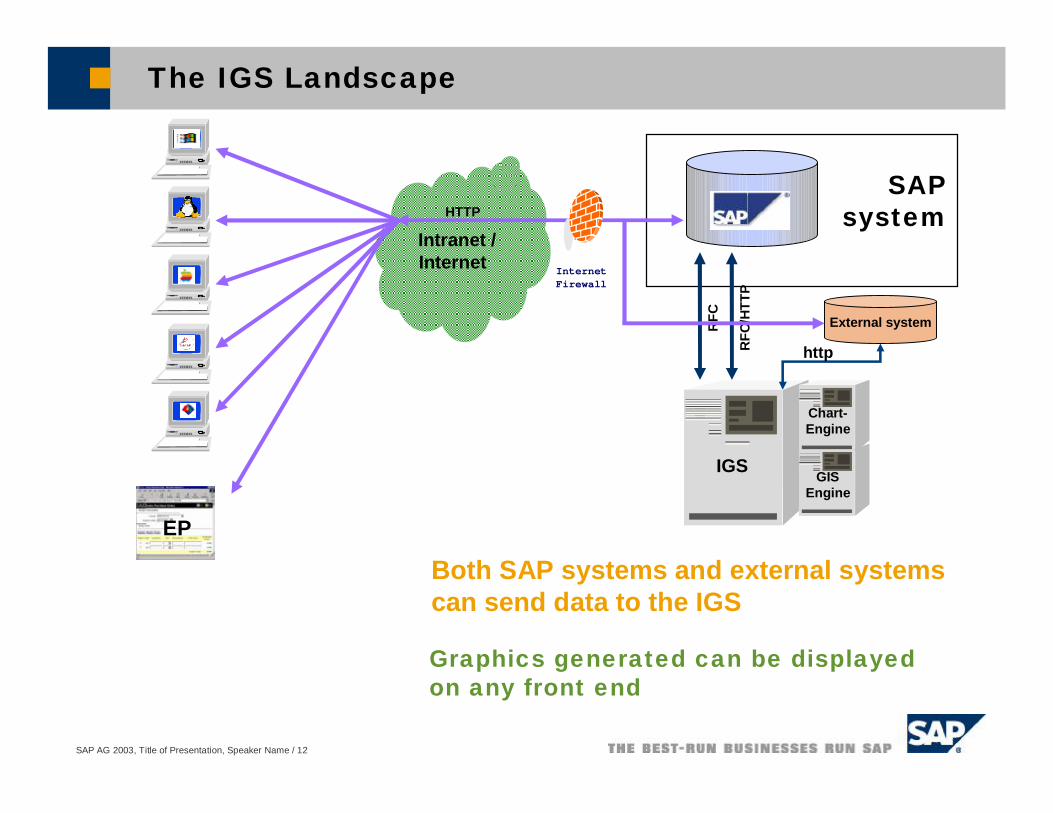
SAP AG 2003, Title of Presentation, Speaker Name / 12
SAP system
The IGS Landscape
IGS GISEngine
Chart-Engine
Intranet /Internet
External system
RFC
/HTT
P
RFC
HTTP
EP
Both SAP systems and external systems can send data to the IGS
Graphics generated can be displayed on any front end
http
InternetFirewall

SAP AG 2003, Title of Presentation, Speaker Name / 13
Local IGS Monitoring and Administration
The IGS web administration interface
Called via URL:http://<hostname>:<http listener port>
Example:http://localhost:8030

SAP AG 2003, Title of Presentation, Speaker Name / 14
Key Features and Benefits of the IGS
Server-based infrastructure
Scalablen Multiprocessor (multiprocess,
multithreaded)n Distributed
Client independencen SAP GUI, Web Dynpro, ...
Server platform independencen All SAP Web AS platforms
n Even in mixed environments
Generates any type of contentn Supports various data output
formats: JPEG, BMP, WBMP, SVG, VML, GIF, PNG
Extensiblen Integration of new
componentsu New chart types / interpreters
n SDK available for new interpreters
Support for various protocolsn RFC and HTTPn Data from SAP or external
systems
SAP AG 2003, Title of Presentation, Speaker Name / 15
You should now be able to:
l Understand of what the IGS can be used for.
l Understand the architecture of the IGS.
Internet Graphics Services Overview: Topic Summary

SAP AG 2003, Title of Presentation, Speaker Name / 16
After completing this topic, you will be able to:
l Configure your Java Engine to create Business Graphics
Configuring Web Dynpro for Business Graphics: Topic Objectives

SAP AG 2003, Title of Presentation, Speaker Name / 17
Start the Visual Admin
n Start the engine administrator console from the path:<Drive>:\usr\sap\<System ID>\JC00\j2ee\admin\go.bat

SAP AG 2003, Title of Presentation, Speaker Name / 18
Configuration Adapter Service
The Configuration Adapter Service allows you to change the servers properties.In this case, you are to setup the default IGS Url property for Web Dynpro.
Click the change buttonand then double clickthe “Propertysheet default”shown below.

SAP AG 2003, Title of Presentation, Speaker Name / 19
Setting the Default IGS Url
Click the IGSUrlproperty, this will show the below
window.
Enter in your default local IGS. The format is:
http://<server name>:<port>/Click “Apply Custom”.
Note: Once you have applied you configuration setting you must restartThe Java engine for it to take effect!

SAP AG 2003, Title of Presentation, Speaker Name / 20
You should now be able to:
l Configure your Java Engine to create Business Graphics
Configuring Web Dynpro for Business Graphics: Topic Summary

SAP AG 2003, Title of Presentation, Speaker Name / 21
After completing this topic, you will be able to:
l Add a Simple Business Graphic to your Web Dynpro application
l Use the important properties of Business Graphics.
l How to pass data to your Business Graphic.
Simple Business Graphics : Topic Objectives

SAP AG 2003, Title of Presentation, Speaker Name / 22
Simple Business Graphics
n A simple business graphic is a chart consisting of a category and one or more Simple Series.
n Column charts, bar charts and pie charts are typical examples of simple business graphics.
n Simple business graphics are to be distinguished from complex business graphics such as scatter charts and portfolio charts.
Column chart with 3 Simple Series

SAP AG 2003, Title of Presentation, Speaker Name / 23
Adding Business Graphics to Web Dynpro Apps
n Add a BusinessGraphic UI Element type to your view.n Do this by adding a child element
of type “BusinessGraphics” to your view.
n To change the chart type, go to the properties of your chart and change the “chartType” property.
n Simple Business Graphics are made up of Simple Series.
Example: You want a graphic to compare 3 company’s sales per month over the past year. For this you would need to create 3 Simple Series, one for each company.
n A Simple Series is essentially just an array. n For the above example each Simple Series
would have 12 values, one for each month.

SAP AG 2003, Title of Presentation, Speaker Name / 24
Adding Simple Series
n For your simple Business Graphic you must define Simple Series.
nYou must define a Category…the category defines your Simple Series. For instance, in the previous example the category would be used to store the name of the month.
n To add a Simple Series or category, just right click on your Business Graphic in the Outline window and select “Insert Category” or “Insert Series”

SAP AG 2003, Title of Presentation, Speaker Name / 25
Mapping to Context Elements
n Business Graphics pull data from the view’s context.
n Remember, a Simple Series is essentially an array. To create an array type structure in the context we need a Node.
n Each Simple Series you defined for your Business Graphic must be bound to a context element, which is of some numeric type.
n Categories must also be bound to context elements.
n The Business Graphic itself is bound to the Node that contains the Simple Series and Category context elements.

SAP AG 2003, Title of Presentation, Speaker Name / 26
Example: Loading Data Into the Context Elements
IPrivateSimpleGraphicsView.IANode aNode = wdContext.nodeA();IPrivateSimpleGraphicsView.IAElement elm;
for (int i = 0; i < 10; i++){
elm = wdContext.createAElement();elm.setCategoryText("Category " + i);elm.setSeries1Value(i);elm.setSeries2Value(10 - i);aNode.addElement(elm);
}
n The above code creates 10 elements in the “A” Node collection.
n Each element has 3 values: CategoryText, Series1Value, and Series2Value

SAP AG 2003, Title of Presentation, Speaker Name / 27
Example Output
SAP AG 2003, Title of Presentation, Speaker Name / 28
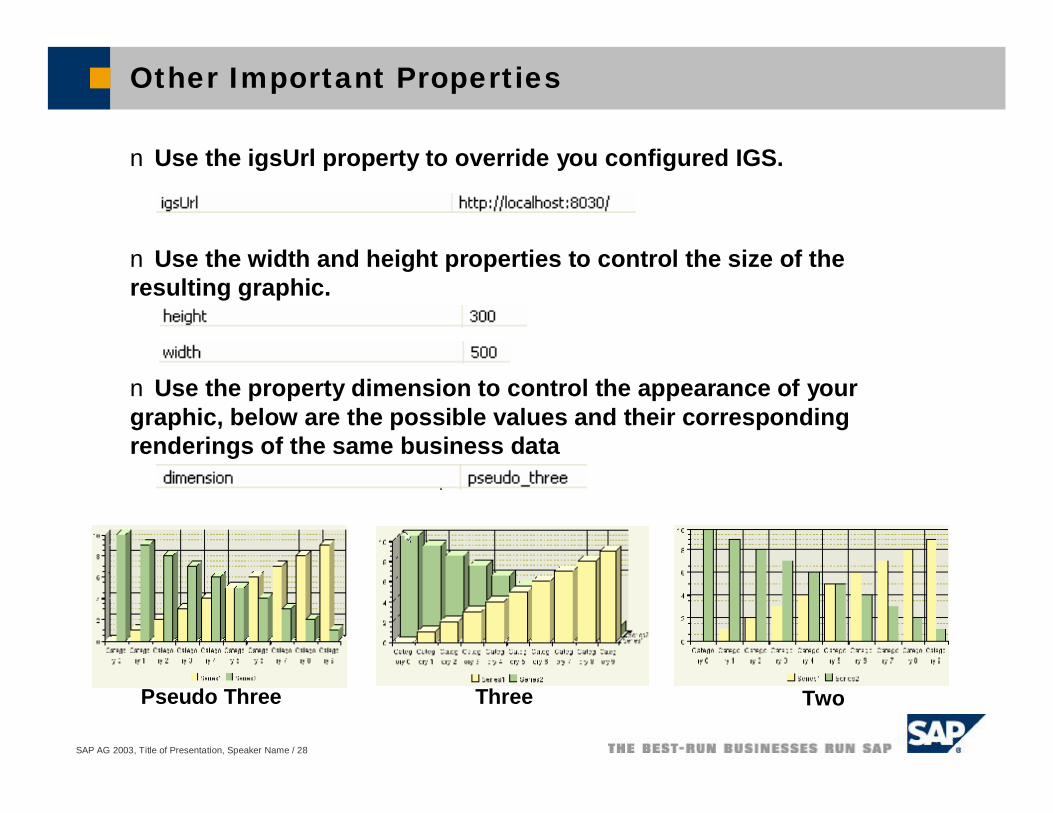
Other Important Properties
n Use the igsUrl property to override you configured IGS.
n Use the width and height properties to control the size of the resulting graphic.
n Use the property dimension to control the appearance of your graphic, below are the possible values and their corresponding renderings of the same business data
Pseudo Three Three Two

SAP AG 2003, Title of Presentation, Speaker Name / 29
More Important Properties
n A legend for your Business Graphic is created by default.
n For each Simple Series, there is a legend description.
n To set the proper text for it, change the label property of your Business Graphic’s Simple Series.
Result of change the label property

SAP AG 2003, Title of Presentation, Speaker Name / 30
You should now be able to:
l Add a Simple Business Graphic to your Web Dynpro application
l Use the important properties of Business Graphics.
l How to pass data to your Business Graphic.
Simple Business Graphics: Topic Summary

SAP AG 2003, Title of Presentation, Speaker Name / 31
After completing this topic, you will be able to:
l Learn how to start the Chart Designer.
l Use the Chart Designer to make basic changes to your Business Graphic.
Introduction to the Chart Designer: Topic Objectives
SAP AG 2003, Title of Presentation, Speaker Name / 32
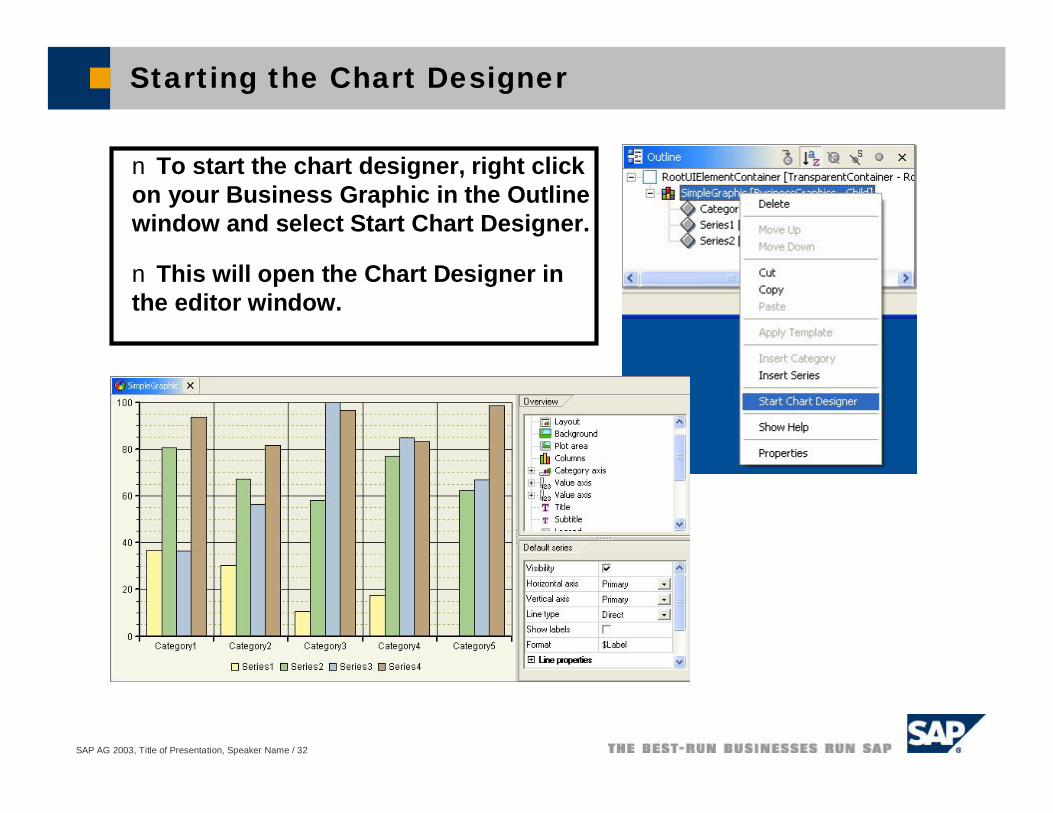
Starting the Chart Designer
n To start the chart designer, right click on your Business Graphic in the Outline window and select Start Chart Designer.
n This will open the Chart Designer in the editor window.

SAP AG 2003, Title of Presentation, Speaker Name / 33
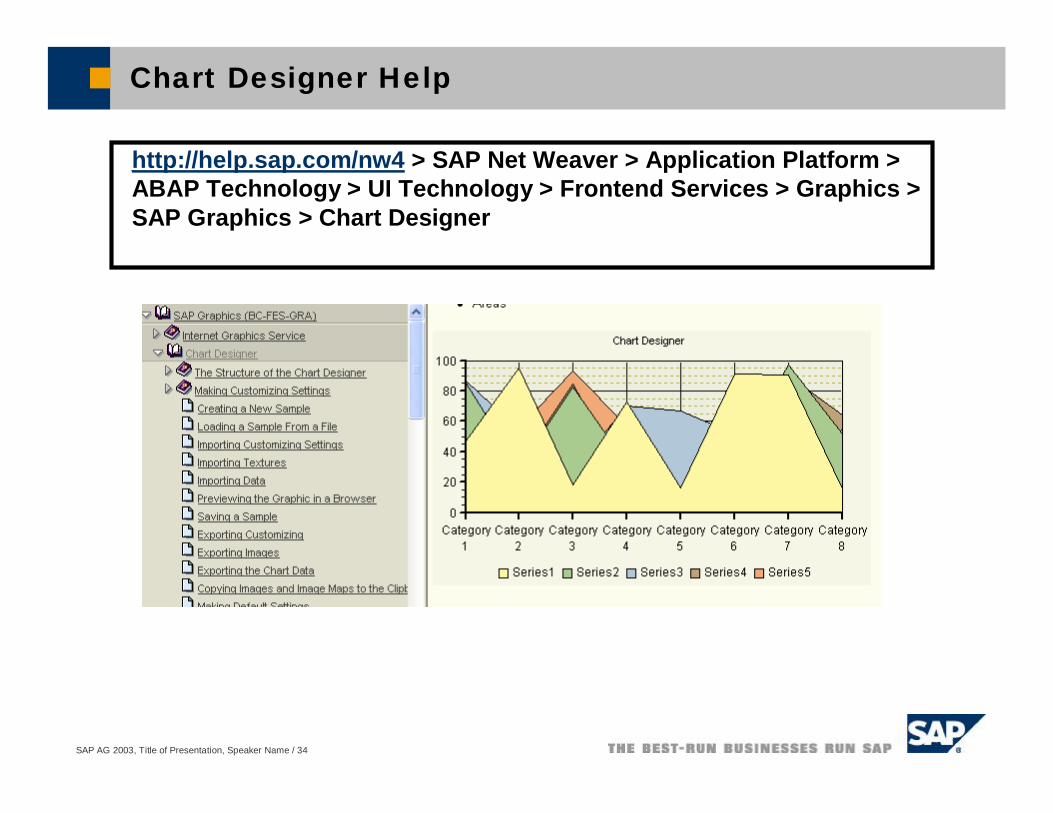
Features of the Chart Designer
n The features of the Chart Designer depend on the type of chart you are working with (ie: columns or pie chart).
n Add Descriptions to the Legend
n Add a Title to your Business Graphic
n Give descriptions to the category axis and value axis (in the case it is a columns chart).
n Change fonts, color schemes, back ground colors, borders etc.
SAP AG 2003, Title of Presentation, Speaker Name / 34
Chart Designer Help
http://help.sap.com/nw4 > SAP Net Weaver > Application Platform > ABAP Technology > UI Technology > Frontend Services > Graphics > SAP Graphics > Chart Designer

SAP AG 2003, Title of Presentation, Speaker Name / 35
You should now be able to:
l Start the Chart Designer.
l Use the Chart Designer to make basic changes to your Business Graphic.
Introduction to the Chart Designer: Topic Summary
SAP AG 2003, Title of Presentation, Speaker Name / 36
After completing this topic, you will be able to:
l Get an idea of the advanced Business Graphics that are possible
l See what is possible with GeoMaps.
Advanced Business Graphics and Geo Services: Topic Objectives

SAP AG 2003, Title of Presentation, Speaker Name / 37
Simple Pie Chart

SAP AG 2003, Title of Presentation, Speaker Name / 38
Polar Chart

SAP AG 2003, Title of Presentation, Speaker Name / 39
Portfolio Chart

SAP AG 2003, Title of Presentation, Speaker Name / 40
Split Pie Chart

SAP AG 2003, Title of Presentation, Speaker Name / 41
Gantt Chart

SAP AG 2003, Title of Presentation, Speaker Name / 42
Gantt Chart Code Example
n There is a Gantt Chart tutorial available in the SAP Net WeaverDeveloper Studio Help.

SAP AG 2003, Title of Presentation, Speaker Name / 43
GeoServices and Geo Maps
n Geo services comprise geocoding, routing, and map display.
n Geocoding transforms an address into a geographical coordinate.
n Routing is the calculation procedure used to determine a route between a starting point and a destination, via intermediate stops if desired. The results of this calculation are the route, the distance, and the navigation instructions.
Example: http://maps.yahoo.comallows you to calculate driving directions.
3rd Party Product

SAP AG 2003, Title of Presentation, Speaker Name / 44
Geo Services and Geo Map example
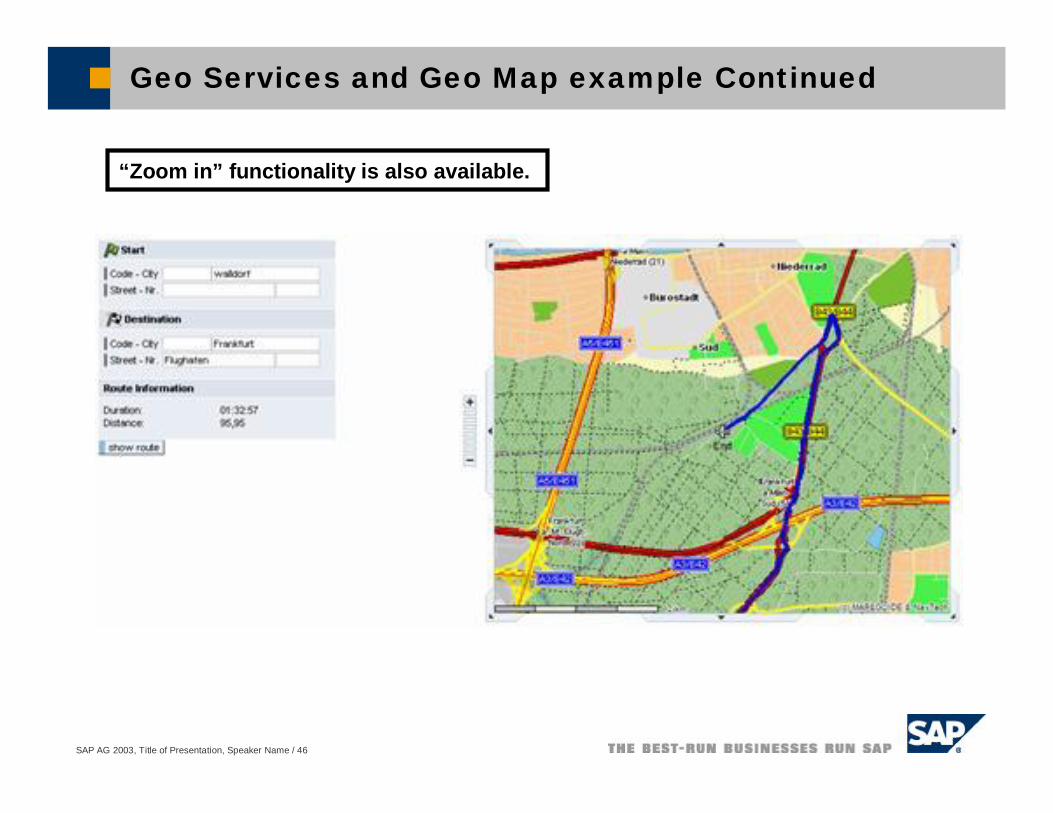
Example showing a Map of Germany. Allows you to enter a start address andDestination address…Geo Services will then determine the route for you.

SAP AG 2003, Title of Presentation, Speaker Name / 45
Geo Services and Geo Map example Continued
Route from Walldorf to Frankfurt.Notice that distance and drive duration are displayed as well.
SAP AG 2003, Title of Presentation, Speaker Name / 46
Geo Services and Geo Map example Continued
“Zoom in” functionality is also available.

SAP AG 2003, Title of Presentation, Speaker Name / 47
Example Geo Map Coding
WDGeoCoderAddress addressStart = new WDGeoCoderAddress("16","Neurottstraße","Walldorf","","69190","DE");
WDGeoCoderAddress addressEnd = new WDGeoCoderAddress("","Flughafen","Frankfurt","","60549","DE");
// give the addresses to the geoCoder and let the geocoordinates calculateIWDGeoCoder geoCoder = WDGeoFactory.createGeoCoder();try {
geoCoder.setIgsUrl(new URL("http://pgwdf134.wdf.sap.corp:44780"));try {
geoCoder.addAddress("0", addressStart);geoCoder.addAddress("1", addressEnd);
} catch (WDException e1) {e1.printStackTrace();
}} catch (MalformedURLException e) {
e.printStackTrace();}geoCoder.execute();
You must use the Geo Services API in Web
Dynpro to create your Geo Map images.
The IGS Url must point to an IGS configured
for Geo Services.

SAP AG 2003, Title of Presentation, Speaker Name / 48
You should now be able to:
l Have an understanding of the IGS architecture.
l Add charts to your Web Dynpro applications.
l Use the Web Dynpro API to create simple Business Graphics.
l Understand the purpose of the Chart Designer.
l Understand what GeoMaps are and how they can be integrated into Web Dynpro.
l Understand how to configure the IGS for Web Dynpro Applications.
l Configure your Java Engine to create Business Graphics
Introduction to Business Graphics: Unit Summary


