
1
Introduction to Cost Accounting
Dr. Varadraj Bapat Indian Institute of Technology,
Mumbai [email protected]
9892413119
Dr. Varadraj Bapat
CA., CWA., M.Com., DISA, PhD. School of Management
Indian Institute of Technology, Mumbai
Teaching Interests: Financial Accounting,
Management Accounting, Indian Economy
Research Interests: Financial Accounting, Financial
Inclusion, Corporate Finance
Others: Yoga, Spirituality, Sanskrut, Bharatiya
Sanskriti, ABVP

3
Cost Accounting
Cost Accounting
Cost
Classification of Cost
Product Cost
Period Cost

STREAMS OF ACCOUNTING
Financial Accounting, Cost Accounting and Management Accounting
the similarities and difference in these three streams of accounting
FINANCIAL ACCOUNTING
Recording of Financial Transactions
Summerising Reporting - Preparation of
Financial Statements
Targeted to External Users

COST ACCOUNTING
Recording of Costs
Analysis of Costs
Preparation of Cost Statements
Targeted to Internal Users

MANAGEMENT ACCOUNTING
Recording of Financial & other data
Analysis of Financial and other information
Preparation of Statements for Managerial Decisions

Dr. V
ara
dra
j Ba
pa
t, IIT M
um
ba
i
8
Cost Accounting
Cost accounting involves recording, controlling estimating and reporting for costs.

Dr. V
ara
dra
j Ba
pa
t, IIT M
um
ba
i
9
Cost Accounting
Cost accounting process begins with the recording of expenditure or the bases on which they are calculated and ends with the preparation of statements for ascertaining and controlling costs.

Dr. V
ara
dra
j Ba
pa
t, IIT M
um
ba
i
10
Objectives:
The main objectives of Cost Accounting are as follows:
1. Ascertainment of cost
2. Cost control and cost reduction
Dr. V
ara
dra
j Ba
pa
t, IIT M
um
ba
i
11
Cost Accounting Objectives:
3. Assisting management in decision-making including pricing, profit planning, budgeting
Dr. V
ara
dra
j Ba
pa
t, IIT M
um
ba
i
12
Advantages
1. Helps in identifying unprofitable activities, losses or inefficiencies in any form.
2. Application of cost reduction techniques, operation research techniques and value analysis technique

Dr. V
ara
dra
j Ba
pa
t, IIT M
um
ba
i
13
COST
Anything incurred during the production of the good or service to get the output into the hands of the customer.
Factory Production Consumer
Dr. V
ara
dra
j Ba
pa
t, IIT M
um
ba
i
14
WHAT IS COST?
A cost can be defined as the amount of resources given up in exchange for any goods or service.

Dr. V
ara
dra
j Ba
pa
t, IIT M
um
ba
i
15
COST
e.g.
Material cost, Labour cost, electricity cost, fuel cost etc.

Dr. V
ara
dra
j Ba
pa
t, IIT M
um
ba
i
16
COST
Capitalised Cost:
The cost incurred on fixed assets are capitalised cost. E.g. cost incurred to purchase machineries. These cost are not covered here, except which is subsequently treated as expenses (depreciation).

Dr. V
ara
dra
j Ba
pa
t, IIT M
um
ba
i
17
Cost Classification
• By elements
• By function
• As direct and indirect
• By controllability
• By normality
• By variability
• By relevance

Dr. V
ara
dra
j Ba
pa
t, IIT M
um
ba
i
18
By Nature or Element
Under this classification the costs are divided into three categories i.e. material cost, labour cost and expenses.

Dr. V
ara
dra
j Ba
pa
t, IIT M
um
ba
i
19
ELEMENTS OF COST
Material Labour Expenses

Dr. V
ara
dra
j Ba
pa
t, IIT M
um
ba
i
20
Material The cost which is incurred on physical substance or thing. e.g. Components or raw materials purchased

Dr. V
ara
dra
j Ba
pa
t, IIT M
um
ba
i
21
Labour The cost incurred on human efforts. e.g. ??

Dr. V
ara
dra
j Ba
pa
t, IIT M
um
ba
i
22
Labour The cost incurred on human efforts. e.g. Salary, Wages, Bonus, Incentives, Retirement Benefits, Perquisites

Dr. V
ara
dra
j Ba
pa
t, IIT M
um
ba
i
23
Expenses The cost incurred for services. Expenses are other than material and labour are covered here. e.g. ??

Dr. V
ara
dra
j Ba
pa
t, IIT M
um
ba
i
24
Expenses The cost incurred for services. Expenses are other than material and labour are covered here. e.g. Electricity expenses, Rent, Telephone

Dr. V
ara
dra
j Ba
pa
t, IIT M
um
ba
i
25
By Function In this classification costs are
divided according to the function for which they have been incurred. They include ??

Dr. V
ara
dra
j Ba
pa
t, IIT M
um
ba
i
26
By Function In this classification costs are
divided according to the function for which they have been incurred. E.g. production cost, office & administration cost, selling & distribution costs

Dr. V
ara
dra
j Ba
pa
t, IIT M
um
ba
i
27
By Function
Production cost: materials, direct labour, stores overheads etc.
Office & administration cost: cost of formulating policy, directing the organisation and controlling the operations. E.g ??

Dr. V
ara
dra
j Ba
pa
t, IIT M
um
ba
i
28
By Function
Selling and distribution expenses or marketing cost: expenditure incurred generating demand, on moving articles to prospective customers etc.
Dr. V
ara
dra
j Ba
pa
t, IIT M
um
ba
i
29
Direct costs are costs which can be easily attributed to a particular cost center/ product. e.g.- the cost of hard disks while assembling an PC.
DIRECT COST

Dr. V
ara
dra
j Ba
pa
t, IIT M
um
ba
i
30
INDIRECT COST Cost that must be allocated in order to be assigned to a product or department. This cannot be assigned directly to any particular cost centre. e.g. ??

Dr. V
ara
dra
j Ba
pa
t, IIT M
um
ba
i
31
INDIRECT COST
Eg. Costs incurred by the computer maintenance and support group, wages paid to security staff, storage cost of units produced.

Dr. V
ara
dra
j Ba
pa
t, IIT M
um
ba
i
32
By Variability
According to variability classification cost are classified into three groups viz. fixed, variable and semi-variable.
Dr. V
ara
dra
j Ba
pa
t, IIT M
um
ba
i
33
Variable Costs are those costs that vary directly and proportionately with the output. There is a constant ratio between the change in cost and change in the level of output. Examples
VARIABLE COST
Dr. V
ara
dra
j Ba
pa
t, IIT M
um
ba
i
34
Examples of variable cost are direct wages, direct material, Petrol cost for vehicle.
VARIABLE COST

Dr. V
ara
dra
j Ba
pa
t, IIT M
um
ba
i
35
Fixed Cost is a cost which does not change in total for a given time period despite wide fluctuations in output or volume of activity. Examples
FIXED COST
Dr. V
ara
dra
j Ba
pa
t, IIT M
um
ba
i
36
Fixed Cost Examples are rent, property, taxes
FIXED COST
Dr. V
ara
dra
j Ba
pa
t, IIT M
um
ba
i
37
FIXED AND VARIABLE COSTS
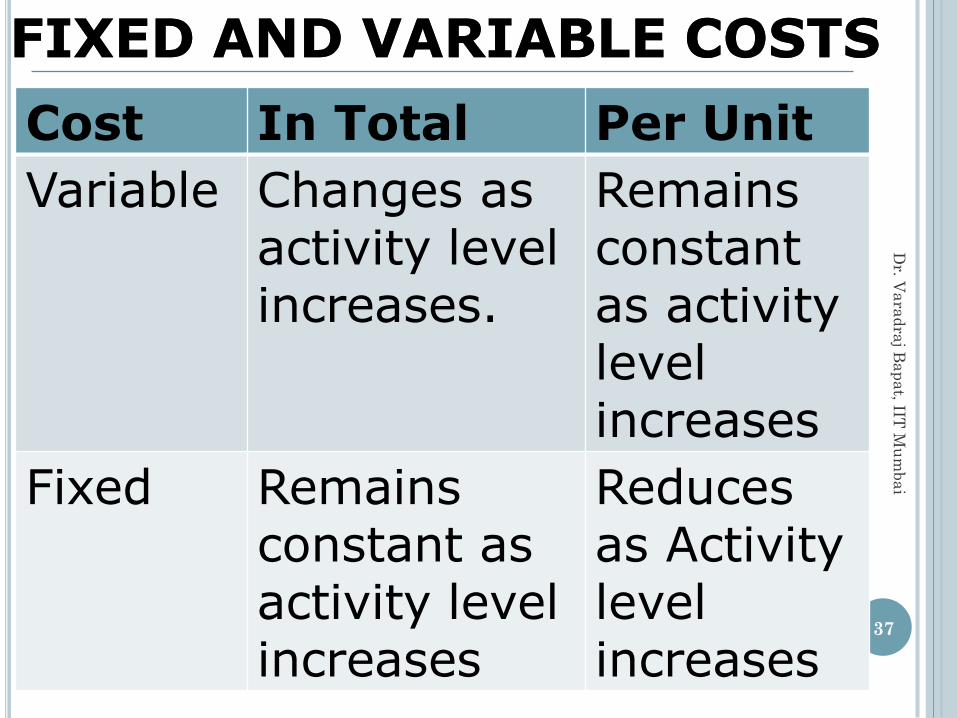
Cost In Total Per Unit
Variable Changes as activity level increases.
Remains constant as activity level increases
Fixed Remains constant as activity level increases
Reduces as Activity level increases
FIXED AND VARIABLE COSTS
Dr. V
ara
dra
j Ba
pa
t, IIT M
um
ba
i
38
Semi-variable Cost
These costs contain both fixed and variable components and thus partly affected by fluctuation in the level of activity.
Examples

Dr. V
ara
dra
j Ba
pa
t, IIT M
um
ba
i
39
Semi-variable Cost
Examples of semi variable costs are telephone bill, electricity, Maintenance.

Dr. V
ara
dra
j Ba
pa
t, IIT M
um
ba
i
40
A company has prepared
budget for July and Aug 2013.
Particulars 1000 Units
2000 Units
Direct Material 50000 100000
Direct Labour 28000 56000
Rent of the factory 75000 75000
Power 35000 50000
Maintenance 17000 26000
Example

Dr. V
ara
dra
j Ba
pa
t, IIT M
um
ba
i
41
By Controllability
Costs here may be classified as
controllable and un- controllable cost. Controllable costs are the cost which can be influenced by an action of the specified member of the undertaking. Uncontrollable cost are those which are not controllable.

Dr. V
ara
dra
j Ba
pa
t, IIT M
um
ba
i
42
By Controllability
The distinction between controllable
and uncontrollable costs is not very sharp.
Infact no cost is uncontrollable; it is only in relation to a particular individual that we may specify a
particular to be either controllable or
uncontrollable.

Dr. V
ara
dra
j Ba
pa
t, IIT M
um
ba
i
43
By Controllability
For example, expenditure incurred by
tool room is controllable by foreman in- charge of that section but share which is apportioned to machine shop can not to be controlled by machine shop foreman.

Dr. V
ara
dra
j Ba
pa
t, IIT M
um
ba
i
44
By Normality
According to this basis cost may be categorized as normal Cost and abnormal cost. Normal cost is normally incurred at a given level of output under the conditions in which that level of output is normally attained.
Dr. V
ara
dra
j Ba
pa
t, IIT M
um
ba
i
45
By Normality
And cost which is abnormally incurred is called as abnormal cost.
e.g. cost of material which is evaporated is normal loss where as goods lost by fire or theft is treated as abnormal loss.

Dr. V
ara
dra
j Ba
pa
t, IIT M
um
ba
i
46
Relevant costs are those future costs which differ between alternatives. Relevant costs may also be defined as the cost which are affected and changed by a decision.
By relevance

Dr. V
ara
dra
j Ba
pa
t, IIT M
um
ba
i
47
Sunk costs are all costs incurred in the past that cannot be changed by any decision made now or in the future. Sunk costs should not be considered in decisions. e.g. cost incurred on research of a product will be irrelevant while
By relevance

Dr. V
ara
dra
j Ba
pa
t, IIT M
um
ba
i
48
making decision whether to undertake production or not, in make or buy (the raw materials) decision cost of the material, wage rate will be relevant on the other hand factory rent will be irrelevant
By relevance

Dr. V
ara
dra
j Ba
pa
t, IIT M
um
ba
i
49
DIFFERENTIAL COSTS
Differential cost is the difference between any two alternatives. Differential costs are equal to the additional variable expenses incurred in respect of the additional output, plus the increase in fixed costs if any

Dr. V
ara
dra
j Ba
pa
t, IIT M
um
ba
i
50
OPPORTUNITY COSTS
Opportunity cost is the cost of opportunity lost. It is the cost of selecting one course of action in terms of opportunity which are given up to carry out that course of action. Opportunity cost is the benefit lost by rejecting the best competing alternative to one chose.

Dr. V
ara
dra
j Ba
pa
t, IIT M
um
ba
i
51
The benefit lost is usually the net earnings or profit that might have been earned from rejected alternative.
For example if we invest 1 lakh in a business then the opportunity cost would be the amount of interest that money would have earned if it was in bank,

Dr. V
ara
dra
j Ba
pa
t, IIT M
um
ba
i
52
An individual is earning Rs. 2.5 lakhs in year, now if he think to start his own proprietary business of computer maintenance, his opportunity cost will be 2.5 lakhs per annum.

Dr. V
ara
dra
j Ba
pa
t, IIT M
um
ba
i
53
AVERAGE COSTS
Marginal cost is the extra cost incurred to produce one additional unit
Average cost is the total cost to produce a quantity divided by the quantity produced.
MARGINAL COSTS

Dr. V
ara
dra
j Ba
pa
t, IIT M
um
ba
i
54
Sh
aile
sh J
. Meh
ta S
chool o
f Ma
na
gem
en
t
PRODUCT COST
Product Cost is the cost incurred to make or manufacture the product and sell it. These are also known as inventoriable costs. eg

Dr. V
ara
dra
j Ba
pa
t, IIT M
um
ba
i
55
PERIOD COSTS
Period Costs are the costs which are charged as expenses against the revenue of the period in which they are incurred. These costs are treated as expenses of the period in which they are incurred. eg

Dr. Varadraj Bapat, IIT Mumbai 1
Module 12.
Cost Volume Profit Analysis
Dr. Varadraj Bapat Indian Institute of Technology,
Mumbai [email protected]
9892413119
Dr. Varadraj Bapat
CA., CWA., M.Com., DISA, PhD.
School of Management
Indian Institute of Technology, Mumbai
Teaching Interests: Financial Accounting,
Management Accounting, Indian Economy
Research Interests: Financial Accounting,
Financial Inclusion, Corporate Finance
Others: Yoga, Spirituality, Sanskrut, Bharatiya
Sanskriti, ABVP
Dr. Varadraj Bapat, IIT Mumbai 3
Cost Volume Profit (CVP)
Introduction
Fixed costs
Variable costs
Semi variable costs
Contribution margin
Break even point
PV Ratio

Dr. Varadraj Bapat, IIT Mumbai 4
CVP Analysis
CVP analysis is the analysis of three variable viz. cost, volume and profit. Such analysis explores the relationship existing amongst costs, revenue, activity level and resulting profit. It aims at measuring variation of cost with profit.

Dr. Varadraj Bapat, IIT Mumbai 5
Fixed Cost
These are the costs which incurred for a period and which within certain output and turnover limits, tend to be unaffected by fluctuations in the levels of activity (Output or turnover).
Dr. Varadraj Bapat, IIT Mumbai 6
For example: Rent, insurance of factory building etc. remain the same for different levels of production.
Dr. Varadraj Bapat, IIT Mumbai 7
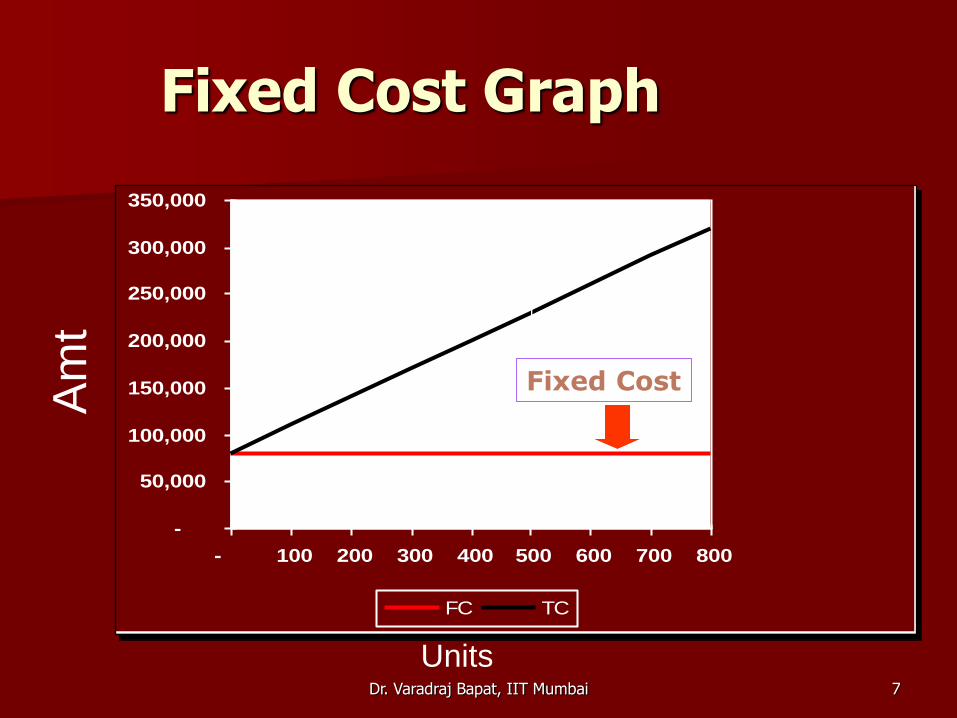
Fixed Cost Graph
-
50,000
100,000
150,000
200,000
250,000
300,000
350,000
- 100 200 300 400 500 600 700 800
FC TC
Fixed Cost
Total Cost
Am
t
Units

Dr. Varadraj Bapat, IIT Mumbai 8
Variable Cost
These costs tend to very with the volume of activity. Any increase in activity results in an increase in the variable cost and vice versa.
For example: Cost of direct labour, direct material, etc.

Dr. Varadraj Bapat, IIT Mumbai 9
Variable Cost Graph
-
10,000
20,000
30,000
40,000
50,000
60,000
70,000
80,000
90,000
- 100 200 300 400 500 600 700 800
VC
Variable Cost
`
Units

Dr. Varadraj Bapat, IIT Mumbai 10
These costs contain both fixed and variable components and thus partly affected by fluctuation in the level of activity.
Examples of semi variable costs are telephone bill, gas and electricity etc.
Semi-Variable Cost

Dr. Varadraj Bapat, IIT Mumbai 11
Semi-Variable Cost Graph
-
5,000
10,000
15,000
20,000
25,000
30,000
35,000
40,000
45,000
- 100 200 300 400 500 600 700
SVC
Semi-Variable Cost
`
Units
Dr. Varadraj Bapat, IIT Mumbai 12
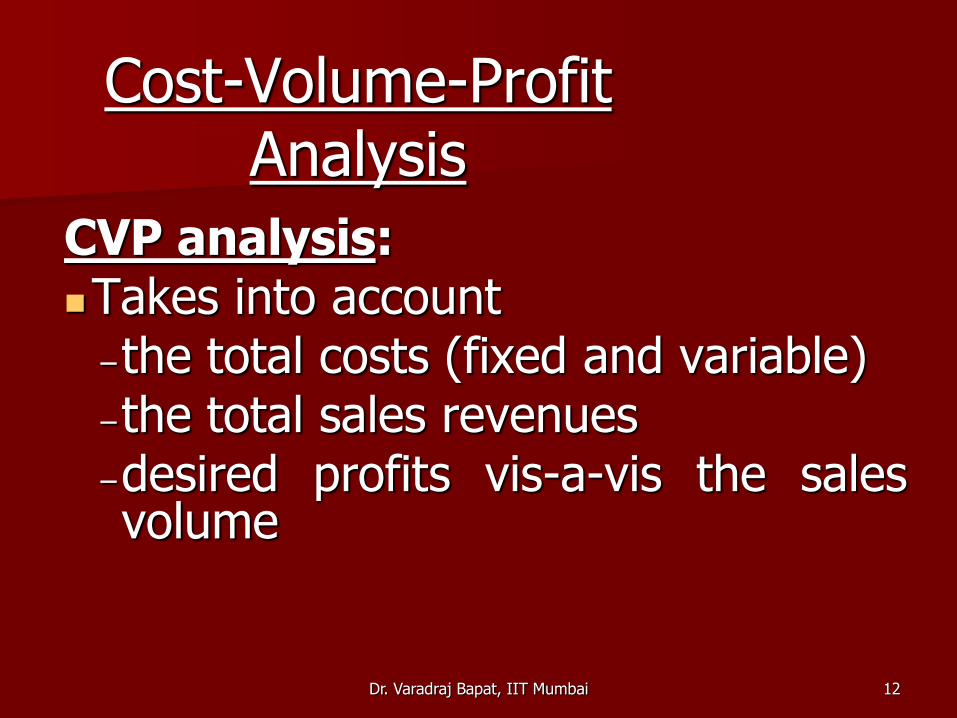
Cost-Volume-Profit Analysis
CVP analysis: Takes into account –the total costs (fixed and variable) –the total sales revenues –desired profits vis-a-vis the sales volume
Dr. Varadraj Bapat, IIT Mumbai 13
It is used for forecasting or predicting how the changes in costs and sales volume affect profit. It is also known as 'Break-Even Analysis'.
CVP analysis could be helpful in the following situations:

Dr. Varadraj Bapat, IIT Mumbai 14
Budget planning: for forecasting profit by considering cost and profit relation, and volume of production volume. This will help in determining the sales volume required to make a profit. –To make decisions regarding pricing and sales volume.

Dr. Varadraj Bapat, IIT Mumbai 15
Determining the sales mix of different products, in what proportions each of the products can be sold. –Preparing flexible budget considering costs at different levels of production

Dr. Varadraj Bapat, IIT Mumbai 16
Objectives of CVP Analysis
–Understand the interaction among
Prices of products
Volume or level of activity
Per unit variable cost
Total fixed cost
Mix of product sold

Dr. Varadraj Bapat, IIT Mumbai 17
Assumptions of CVP Analysis
• Expenses can be classified as either variable or fixed.
• CVP relationships are linear over a wide range of production and sales.
• Sales prices, unit variable cost, and total fixed expenses will not vary within the relevant range.
Dr. Varadraj Bapat, IIT Mumbai 18
• Volume is the only cost driver.
• The relevant range of volume is specified.
• Inventory levels will be unchanged.
• The sales mix remains unchanged during the period.

Dr. Varadraj Bapat, IIT Mumbai 19
Calculations
Profit Equation and Contribution Margin
1.Profit =Sales -Total costs
2.Profit = Sales -Total variable costs - Total Fixed costs
3.Contribution margin = Total revenue – Total variable costs

Dr. Varadraj Bapat, IIT Mumbai 20
Sales XX
-Variable Cost (XX)
Contribution XX
-Fixed Cost (XX)
Profit XX

Dr. Varadraj Bapat, IIT Mumbai 21
Profit = (S-V)*Q – FC
Q = (FC + Expected Profit)
(S-VC)
Q is the no. of units required to be sold to obtain target profit.
S=Selling Price p.u. VC=Variable cost p.u. FC=Fixed Cost

Dr. Varadraj Bapat, IIT Mumbai 22
Suppose that Super Games wants to produce a new toy bike and has forecast the following information.
Price per bike = `800 Variable cost per bike = ` 300
Fixed costs related to bike production = ` 55,00,000
Target profit = ` 2,00,000 Estimated sales = 12,000 bikes
Example:

Dr. Varadraj Bapat, IIT Mumbai 23
We determine the quantity of bikes needed for break even and the target profit as follows:
Dr. Varadraj Bapat, IIT Mumbai 24
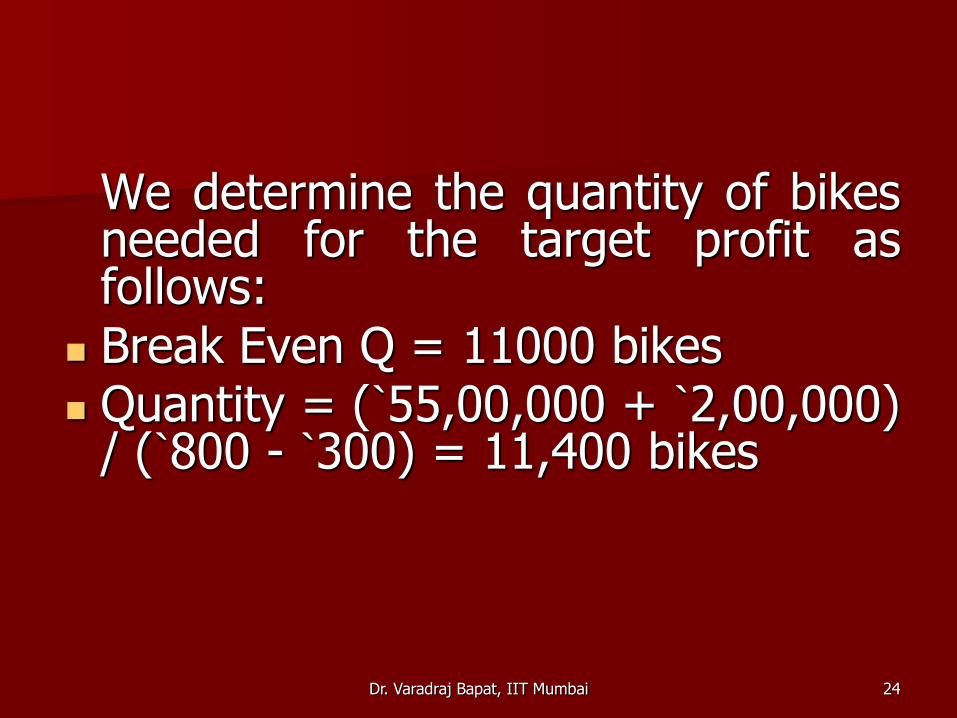
We determine the quantity of bikes needed for the target profit as follows:
Break Even Q = 11000 bikes Quantity = (`55,00,000 + `2,00,000)
/ (`800 - `300) = 11,400 bikes
Dr. Varadraj Bapat, IIT Mumbai 25
Profit Volume Ratio (PV)
The contribution margin ratio (CMR) i.e. PV ratio is the percentage by which the selling price (or revenue) per unit exceeds the variable cost per unit, or contribution margin as a percentage of revenue.

Dr. Varadraj Bapat, IIT Mumbai 26
Example
For Hero1, we could use the forecast information about volume (12,000 bikes) to determine the contribution margin ratio.
Total revenue = `800 * 12,000 = ` 96,00,000
Dr. Varadraj Bapat, IIT Mumbai 27
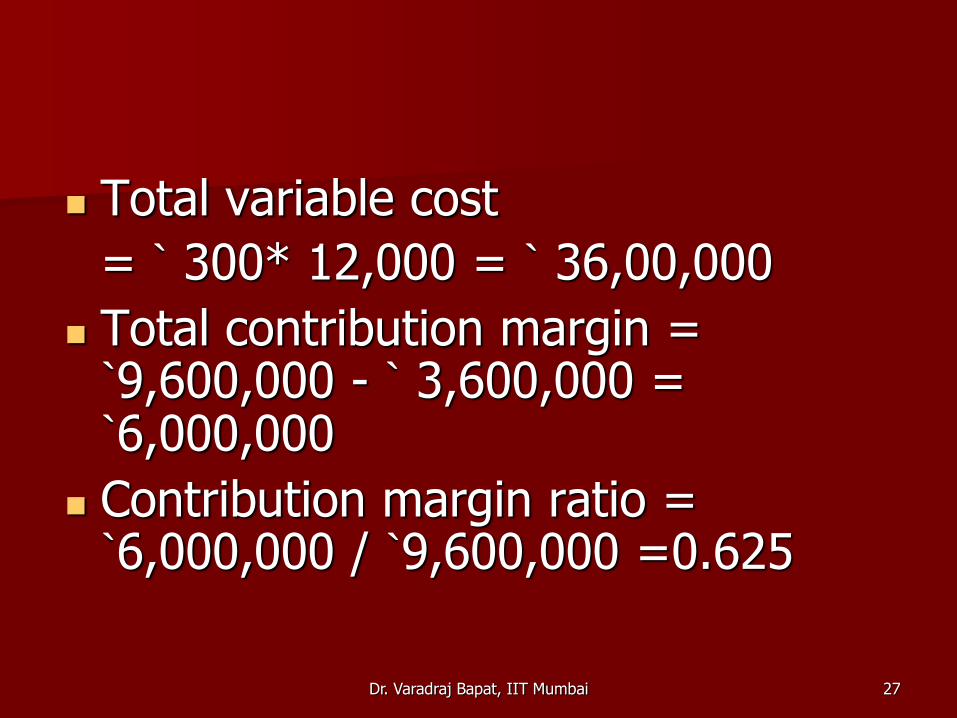
Total variable cost
= ` 300* 12,000 = ` 36,00,000
Total contribution margin = `9,600,000 - ` 3,600,000 = `6,000,000
Contribution margin ratio = `6,000,000 / `9,600,000 =0.625

Dr. Varadraj Bapat, IIT Mumbai 28
BEP analysis
Breakeven analysis is used to find the minimum level of production required
Evaluates both fixed and variable costs

Dr. Varadraj Bapat, IIT Mumbai 29
Uses:
1. To find a suitable product mix
2. To find the sales required to reach a desired revenue.
3. The profits at certain price level and sales

Dr. Varadraj Bapat, IIT Mumbai 30
Break even Point (BEP)
A CVP analysis can be used to determine the BEP, or level of operating activity at which revenues cover all fixed and variable costs, resulting in zero profit.
In other words this is the point where no profit or losses have been made

Dr. Varadraj Bapat, IIT Mumbai 31
Break even Applications
• Pricing decisions:- Enables to study the effect of changing price and volume relationship on total profits.
• Make or Buy Decision:-
• Temporary Shut Down:-

Dr. Varadraj Bapat, IIT Mumbai 32
• Modernizations or automation decisions:- Analysis the profit in implication of a modernization or automation programme.
• Expansion Decisions :- studies the aggregate effect of a general expansion in production and sales.
• New Product decisions :- Enables to determine the sale volume required for a firm (or an individual product) to breakeven , given expected sales price and expected costs.
Dr. Varadraj Bapat, IIT Mumbai 33
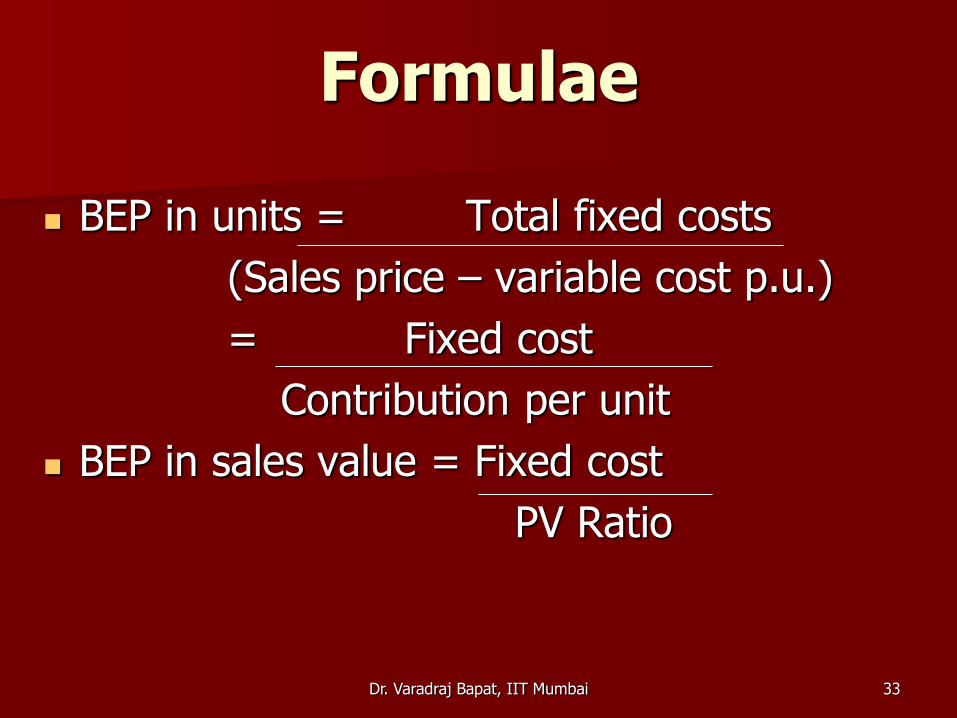
Formulae
BEP in units = Total fixed costs
(Sales price – variable cost p.u.)
= Fixed cost
Contribution per unit
BEP in sales value = Fixed cost
PV Ratio

Dr. Varadraj Bapat, IIT Mumbai 34
Example
• Sales 5000 units
• Sales price per unit Rs. 50
• Variable cost per unit Rs. 30
• Fixed cost Rs. 35000
• Therefore, contribution per unit = 50-30 =Rs. 20

Dr. Varadraj Bapat, IIT Mumbai 35
BEP in units = 35000/20 = 1750 units
1750 * 50 = Rs. 87500
BEP in sales value = 1750 * 50 = Rs. 87500
=35000*20/50
= Rs. 87500

Dr. Varadraj Bapat, IIT Mumbai 36
-
50,000
100,000
150,000
200,000
250,000
300,000
350,000
400,000
450,000
- 100 200 300 400 500 600 700 800
Cost-Volume-Profit Graph
Fixed expenses
Units Sold
Total expenses
Total sales Break-even point

Dr. Varadraj Bapat, IIT Mumbai 37
Margin of safety
• Represents the strength of the business
• Margin of Safety= Actual Sale –
BEP Sale
• Margin of safety% = (Sales - BEP)/Sales x 100

Dr. Varadraj Bapat, IIT Mumbai 38
• Margin of safety = (5000-1750) 5000 =65%
• Hence even if the sales decrease by 65%, the business wont face any loss

Dr. Varadraj Bapat, IIT Mumbai 39


