Download - Intro to Vision Zero Presentation

Vision Zero Saves Lives
San Diego organizations signed on to Vision Zero:AIA Design Committee, BAME CDC, Bayside Community Center, Beautiful PB, Bike SD, City Heights CDC, Discover Pacific Beach, Downtown San Diego Partnership, El Cajon Boulevard Business
Improvement Association, Great Streets San Diego, Pacific Beach Town Council, Safe Kids San Diego, San Diego Chamber of Commerce, San Diego County Bicycle Coalition, San Diego Safe Routes to School
Coalition, The Urban Collaborative Project
* City of San Diego Comprehensive Pedestrian Collision Analysis, April 2014, Transportation and Stormwater Division
Goal: End all traffic fatalities in 10 years• On average, 1,000 pedestrians and bicyclists are hit and
seriously injured each year in San Diego. • Pedestrian collisions increased 20% in 2012 and fatalities
almost doubled – these numbers have not decreased.*• Vehicle collisions with bicyclists and pedestrians happen on
the same corridors.• Residents living in disadvantaged neighborhoods are 10x more likely to be hit by a car.

• San Diego has the 3rd highest pedestrian collision rate in the region, behind National City and El Cajon.
• This contributes to a high rate in the greater region - noted as 6th highest out of 50 metro regions in the U.S.
• Pedestrian safety and access projects were the two most solicited types of projects by the CPC in 2013 in its Neighborhood Input Process for Infrastructure Priorities and Needs, representing almost half of all requests.
• Urban communities and business districts desire small scaled community projects to beautify their streets and neighborhoods.
Vision ZeroMakes Safe Streets AND
Responds to Community Priorities

15% 1
%
80%
Walk
Bike
Drive35%
10%
21%
WalkBikeDrive
Travel by Mode in San DiegoAll Trips - 2010
Fatalities by Mode in San DiegoAll Trips - 2012
More People Die Walking and Biking
Data Sources: National Household Travel Survey 2010 Statewide Integrated Traffic Records System 2012
10 - 24 65+ All Ages30
32
34
36
38
40
42
44
46
9
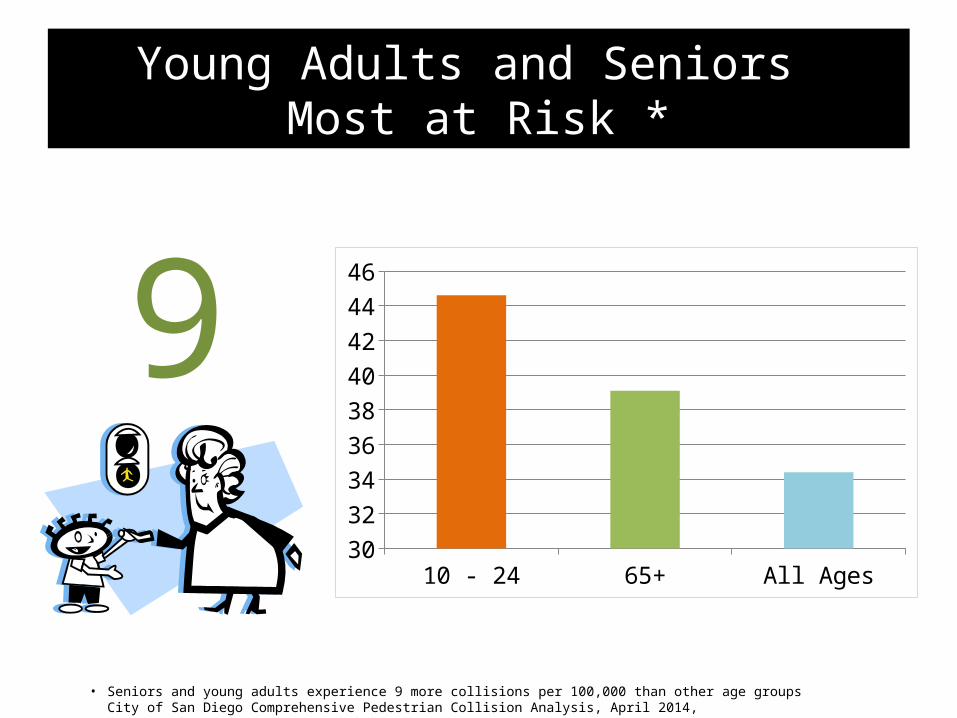
Young Adults and Seniors Most at Risk *
• Seniors and young adults experience 9 more collisions per 100,000 than other age groupsCity of San Diego Comprehensive Pedestrian Collision Analysis, April 2014, Transportation and Stormwater Division
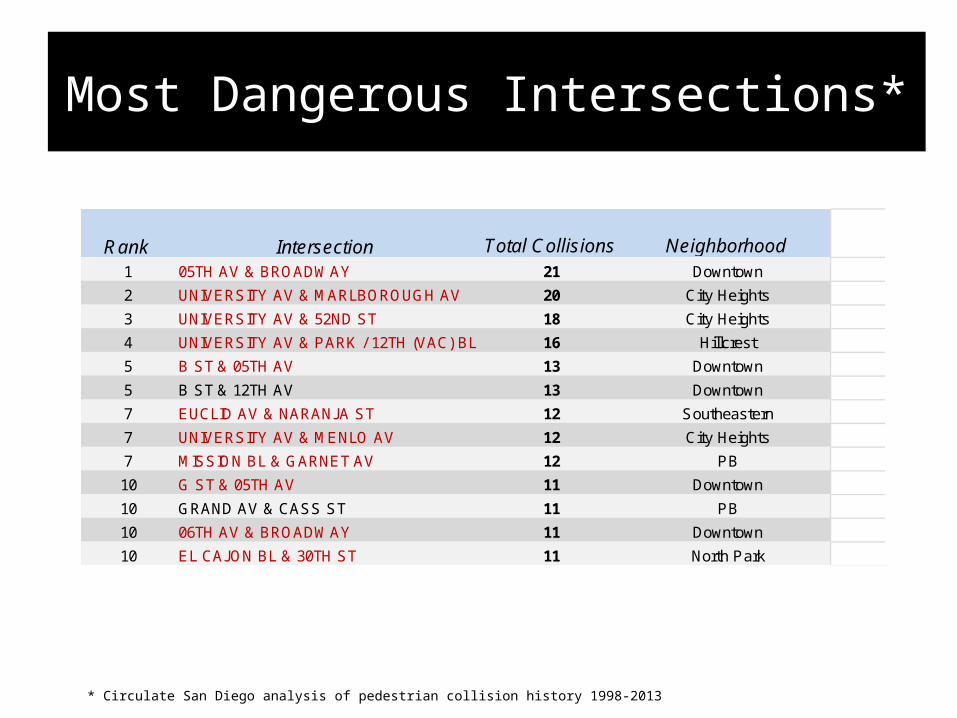
Rank Intersection Total Collisions Neighborhood1 05TH AV & BROADWAY 21 Downtown
2 UNIVERSITY AV & MARLBOROUGH AV 20 City Heights
3 UNIVERSITY AV & 52ND ST 18 City Heights
4 UNIVERSITY AV & PARK / 12TH (VAC) BL 16 Hillcrest
5 B ST & 05TH AV 13 Downtown
5 B ST & 12TH AV 13 Downtown
7 EUCLID AV & NARANJ A ST 12 Southeastern
7 UNIVERSITY AV & MENLO AV 12 City Heights
7 MISSION BL & GARNET AV 12 PB
10 G ST & 05TH AV 11 Downtown
10 GRAND AV & CASS ST 11 PB
10 06TH AV & BROADWAY 11 Downtown
10 EL CAJ ON BL & 30TH ST 11 North Park
Most Dangerous Intersections*
* Circulate San Diego analysis of pedestrian collision history 1998-2013

Vehicle collisions with bicyclists
and pedestrians have occurred on the same
corridors.
City of San Diego, Pedestrian
Collision History2008-2012*
* City of San Diego Comprehensive Pedestrian Collision Analysis, April 2014, Transportation and Stormwater Division
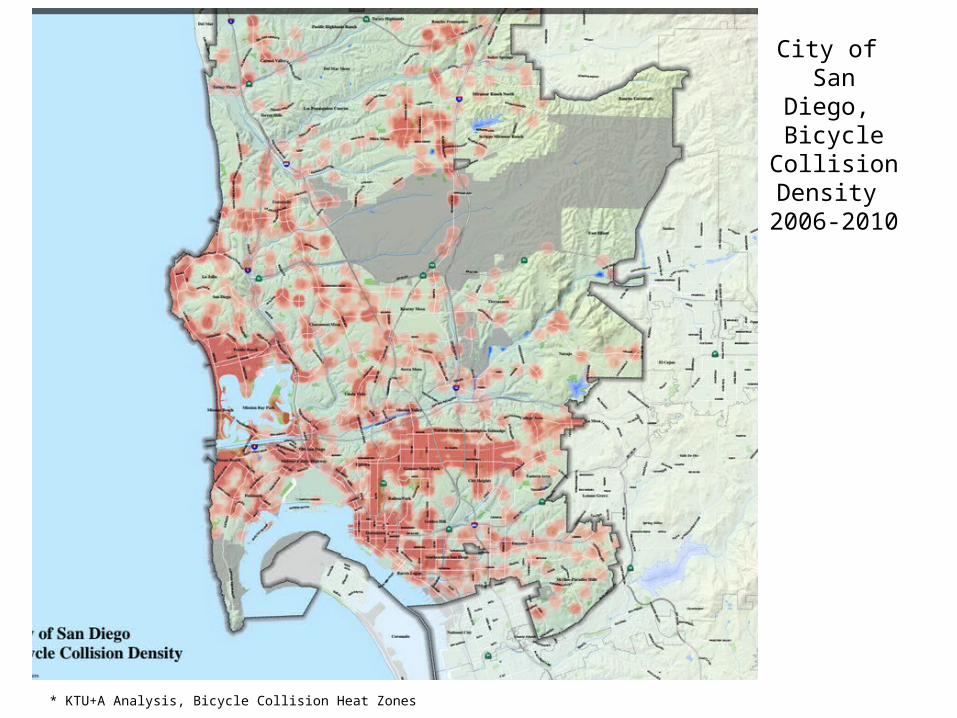
City of San Diego,
Bicycle Collision Density
2006-2010
* KTU+A Analysis, Bicycle Collision Heat Zones

30% of Collisions happen in 8 corridors:•University Ave•El Cajon Blvd•Broadway•Market St•5th Ave•Garnet Ave (167)
(not pictured)•Euclid Ave•Imperial Ave
City of San Diego Pedestrian Collisions
1998-2012
* Circulate San Diego analysis of pedestrian collision history 1998-2012, numbers printed represent # collisions 1998-2012
567
377
173
169
164
171
144

• Adopt mayoral Vision Zero Resolution • Fix top ten most dangerous intersections with things like zebra striped
crosswalks, curb extensions, and no turn on red signals• Fund bike lanes, road diets and crosswalks to calm traffic speeds and provide
safe transit access on 8 most dangerous corridors – FY16 Budget• Police + City Transportation Education Campaign• Update Pedestrian Crossing Policy*• Adopt Pedestrian Master Plan**• Fund small scale public improvements to beautify neighborhoods and calm
traffic speeds• Amend vehicular Level of Service policy• Adopt Complete Streets policy• Create Vision Zero Task Force to guide program implementation
* Council Policy 200-06 slated for Council review and adoption Spring 2015
** Underway since 2007 but not completed yet
Vision Zero GOALS
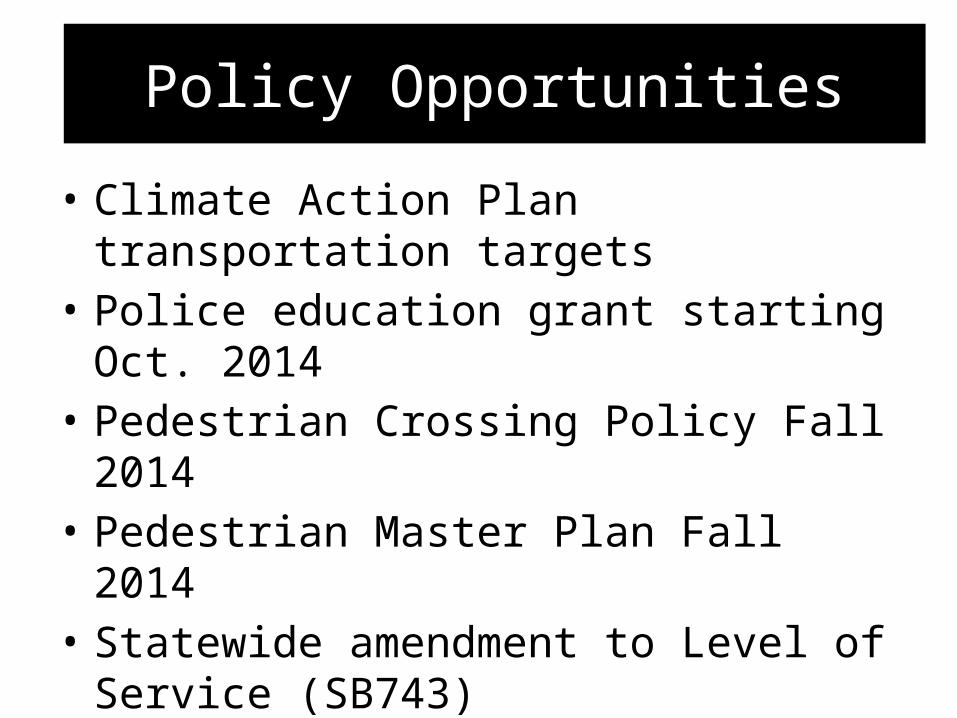
• Climate Action Plan transportation targets• Police education grant starting Oct. 2014• Pedestrian Crossing Policy Fall 2014• Pedestrian Master Plan Fall 2014• Statewide amendment to Level of Service
(SB743)
Policy Opportunities


