
Interconnected Generation Proposed Rates -Billing ExamplesNatalia Mack I Rates ManagerDavid L. Thompson I VP of Markets

Interconnected Generation Proposed Rate Changes
Service Availability Charge $22.50 per month
Delivery Charge (Distribution) $0.02712/kWh Transmission Cost of Service Charge $0.01356/kWh Base Power Charge, Flat $0.04450/kWh
Net Metering Credit, Flat - $0.04450/kWh
Service Availability Charge $22.50 per month
Peak Demand Charge (Distribution) $5.15/kW Transmission Cost of Service Charge/Credit ~ $5.00/kW 1
Base Power Charge, Time-of-Use Varies per TOU/kWh
Base Power Energy Credit, Time-of-Use Varies per TOU/kWh1 Estimated amount. Amount varies per month based on PUCT rate.
Current: Net Metering Rate for Residential
Proposed Rates: Net Billing Rate for Residential (Proposed - Starting January 1, 2022)

How would I be billed under the Proposed Rates?Service Availability Charge – Used to recover Fixed Costs
Change: None
Monthly charge of $22.50 per meter
Billing discounts available to reduce charge• EBilling (paperless billing) – $1.00 credit• EDraft (automatic bank draft) – $1.50 credit• Both billing discounts can be combined – $2.50 credit
Interconnected Generation Proposed Rate Changes
3
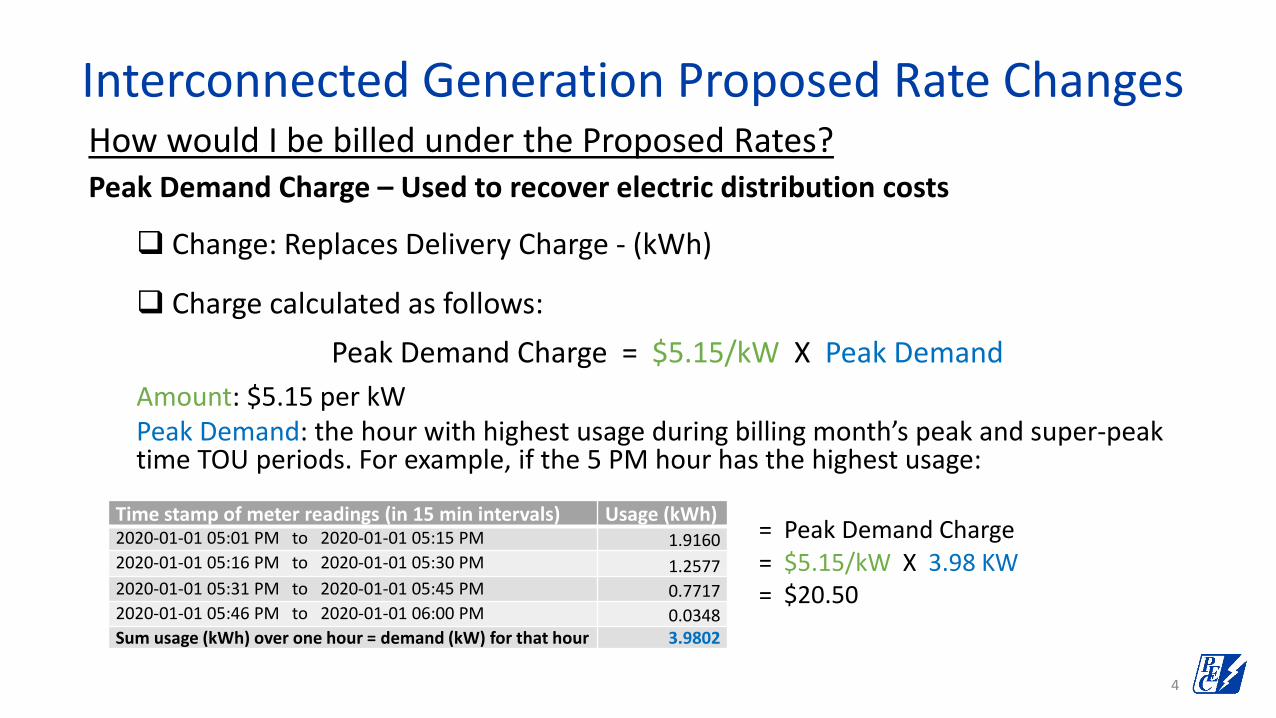
How would I be billed under the Proposed Rates?Peak Demand Charge – Used to recover electric distribution costs
Change: Replaces Delivery Charge - (kWh)
Charge calculated as follows: Peak Demand Charge = $5.15/kW X Peak Demand
Amount: $5.15 per kW Peak Demand: the hour with highest usage during billing month’s peak and super-peak time TOU periods. For example, if the 5 PM hour has the highest usage:
= Peak Demand Charge= $5.15/kW X 3.98 KW= $20.50
Interconnected Generation Proposed Rate Changes
4
Time stamp of meter readings (in 15 min intervals) Usage (kWh)2020-01-01 05:01 PM to 2020-01-01 05:15 PM 1.91602020-01-01 05:16 PM to 2020-01-01 05:30 PM 1.25772020-01-01 05:31 PM to 2020-01-01 05:45 PM 0.77172020-01-01 05:46 PM to 2020-01-01 06:00 PM 0.0348Sum usage (kWh) over one hour = demand (kW) for that hour 3.9802
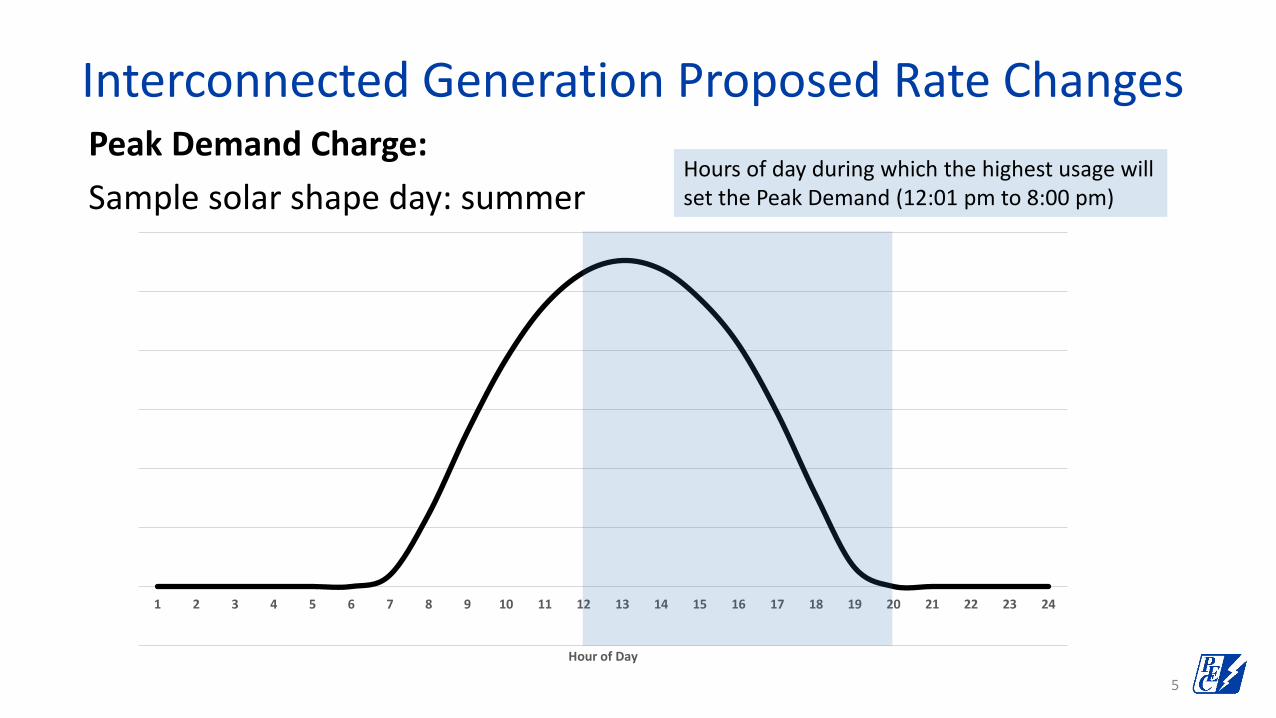
Peak Demand Charge:Sample solar shape day: summer
-0.5
0.0
0.5
1.0
1.5
2.0
2.5
3.0
1 2 3 4 5 6 7 8 9 10 11 12 13 14 15 16 17 18 19 20 21 22 23 24
Hour of Day
Hours of day during which the highest usage will set the Peak Demand (12:01 pm to 8:00 pm)
Interconnected Generation Proposed Rate Changes
5

Peak Demand Charge:Sample solar shape day: non-summer
-0.5
0.0
0.5
1.0
1.5
2.0
2.5
3.0
1 2 3 4 5 6 7 8 9 10 11 12 13 14 15 16 17 18 19 20 21 22 23 24
Hour of Day
Hours of day during which the highest usage will set the Peak Demand (from 5:01 am to 8:00 am and from 4:01 pm to 7:00 pm)
Interconnected Generation Proposed Rate Changes
6

How would I be billed under the Proposed Rates?Time-of-Use (TOU) Base Power Charge – Used to recover cost of power purchased on behalf of members
Change: Replaces Flat Base Power Charge
Energy consumption charged in the appropriate TOU time period
Charges will be calculated as follows: Base Power Charges = TOU ($/kWh) X Energy Delivered
Amount: varies per TOU time periodEnergy Delivered: total sum of Energy Received (kWh) during billing month’s time TOU periods
See next slides for details
Interconnected Generation Proposed Rate Changes
7
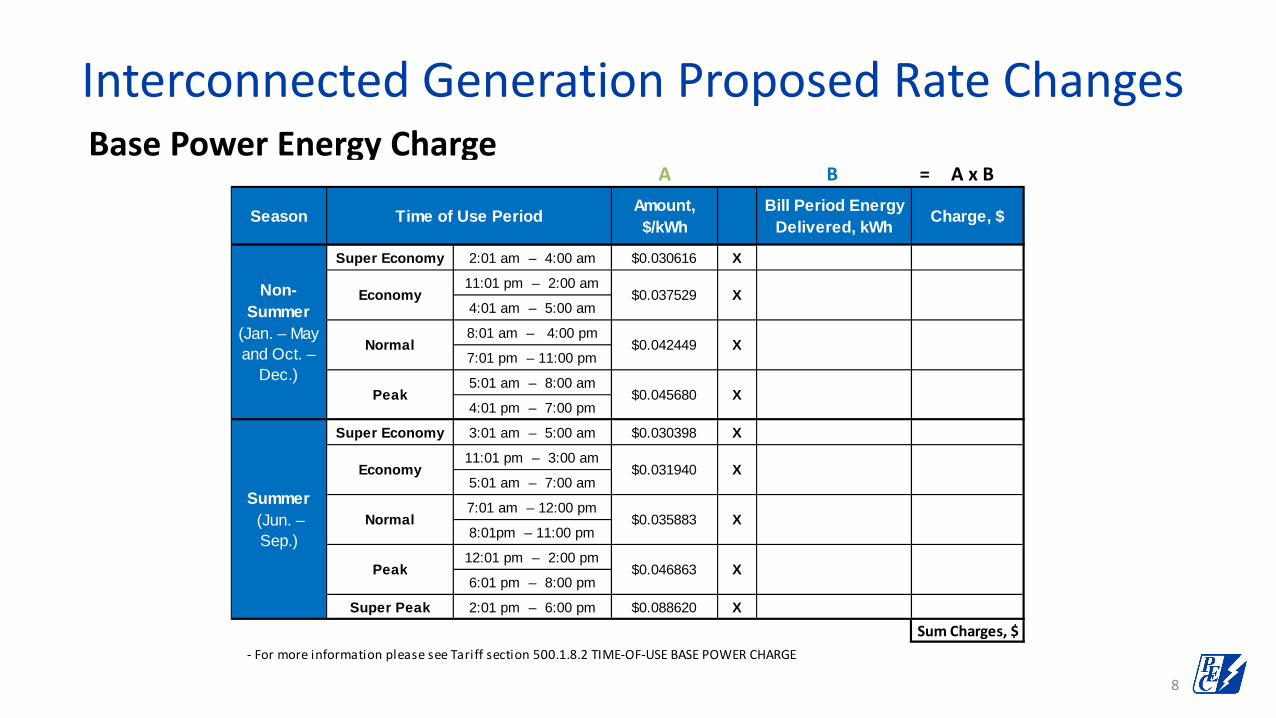
Base Power Energy ChargeInterconnected Generation Proposed Rate Changes
8
A B = A x B
Season Amount, $/kWh
Bill Period Energy Delivered, kWh Charge, $
Super Economy 2:01 am – 4:00 am $0.030616 X11:01 pm – 2:00 am
4:01 am – 5:00 am
8:01 am – 4:00 pm
7:01 pm – 11:00 pm
5:01 am – 8:00 am
4:01 pm – 7:00 pm
Super Economy 3:01 am – 5:00 am $0.030398 X 11:01 pm – 3:00 am
5:01 am – 7:00 am
7:01 am – 12:00 pm
8:01pm – 11:00 pm
12:01 pm – 2:00 pm
6:01 pm – 8:00 pm
Super Peak 2:01 pm – 6:00 pm $0.088620 X Sum Charges, $
- For more information please see Tariff section 500.1.8.2 TIME-OF-USE BASE POWER CHARGE
X
X
X
X
X
X
Time of Use Period
Non-Summer
(Jan. – May and Oct. –
Dec.)
Economy $0.037529
Normal $0.042449
Peak $0.045680
Summer (Jun. – Sep.)
Economy $0.031940
Peak $0.046863
Normal $0.035883

Time-of-Use Base Power ChargeSample solar shape day: summer
Interconnected Generation Proposed Rate Changes
9
Economy Super Economy
EconomyNormal
Peak
Super Peak
Peak
Normal
0
0.01
0.02
0.03
0.04
0.05
0.06
0.07
0.08
0.09
0.1
1 2 3 4 5 6 7 8 9 10 11 12 13 14 15 16 17 18 19 20 21 22 23 24
Cost
per
kW
h
Hour of Day
Flat Base Power
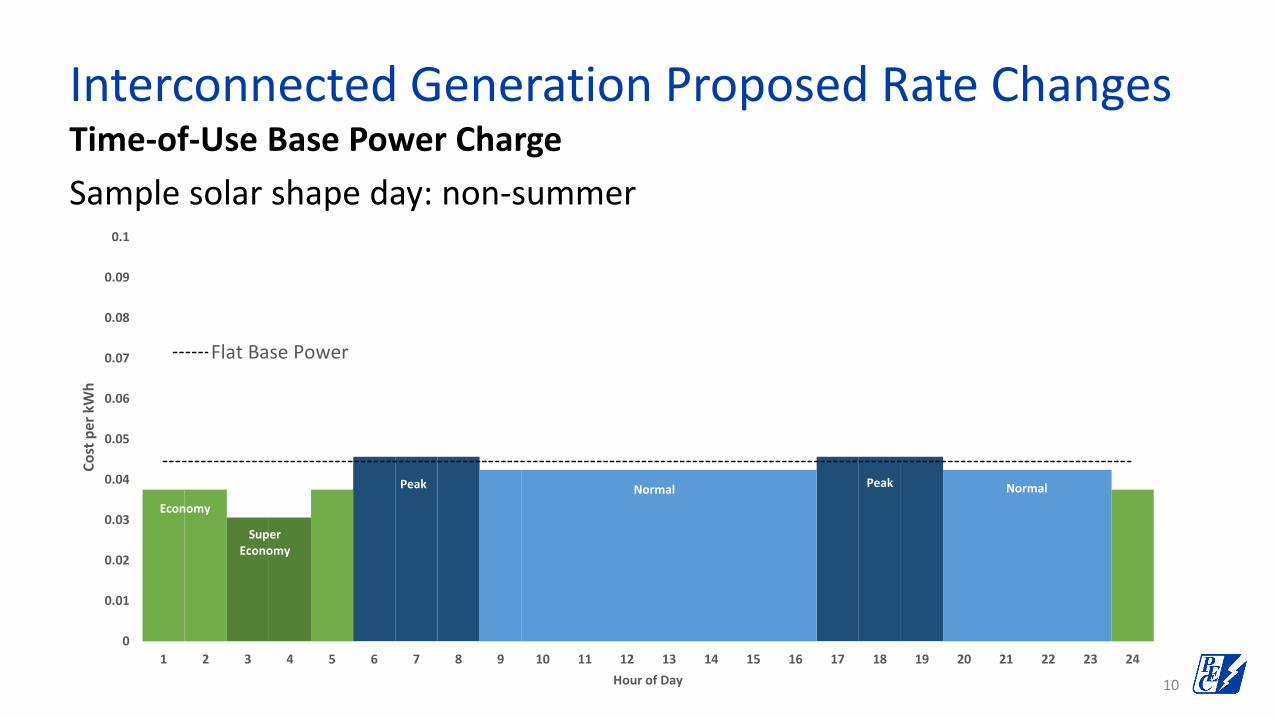
Time-of-Use Base Power ChargeSample solar shape day: non-summer
Interconnected Generation Proposed Rate Changes
10
Economy
SuperEconomy
Peak Normal Peak Normal
0
0.1
0.2
0.3
0.4
0.5
0.6
0.7
0.8
0.9
1
0
0.01
0.02
0.03
0.04
0.05
0.06
0.07
0.08
0.09
0.1
1 2 3 4 5 6 7 8 9 10 11 12 13 14 15 16 17 18 19 20 21 22 23 24
Cost
per
kW
h
Hour of Day
Flat Base Power
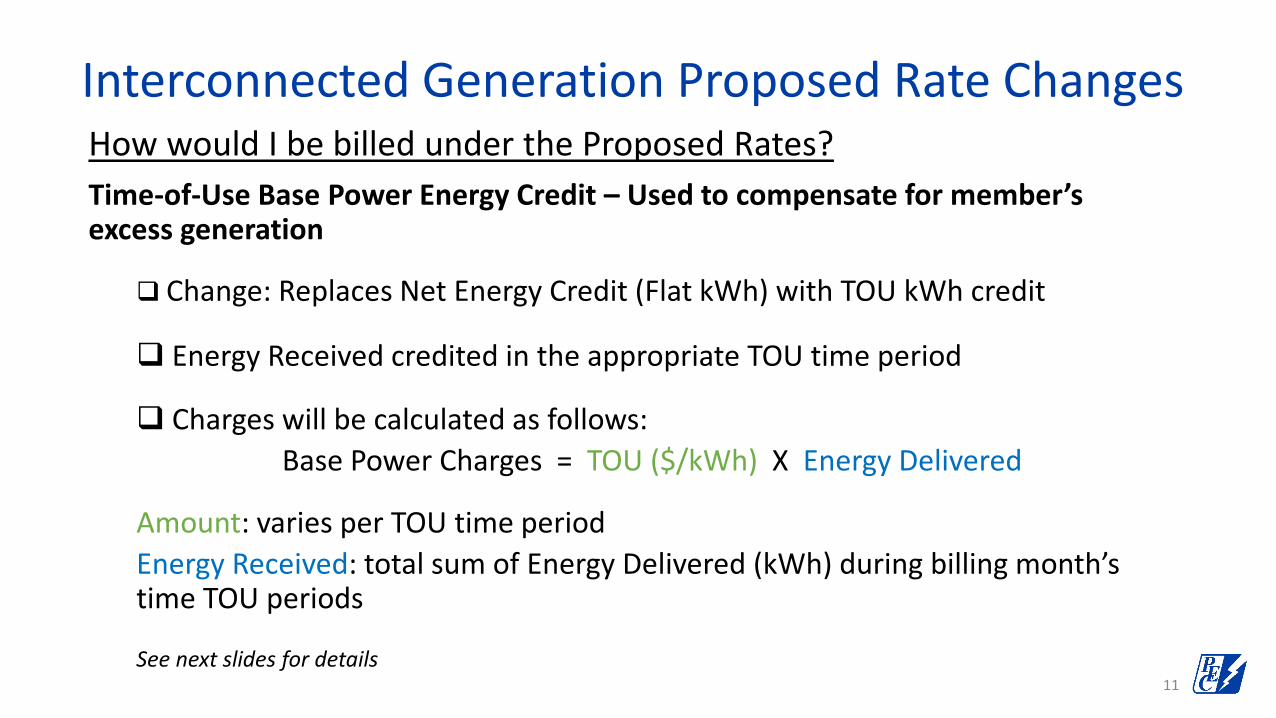
How would I be billed under the Proposed Rates?Time-of-Use Base Power Energy Credit – Used to compensate for member’s excess generation
Change: Replaces Net Energy Credit (Flat kWh) with TOU kWh credit
Energy Received credited in the appropriate TOU time period
Charges will be calculated as follows: Base Power Charges = TOU ($/kWh) X Energy Delivered
Amount: varies per TOU time periodEnergy Received: total sum of Energy Delivered (kWh) during billing month’s time TOU periods
See next slides for details
Interconnected Generation Proposed Rate Changes
11

Base Power Energy CreditInterconnected Generation Proposed Rate Changes
12
A B = A x B
Season Amount, $/kWh
Bill Period Energy Received, kWh Credit, $
Super Economy 2:01 am – 4:00 am -$0.030616 X11:01 pm – 2:00 am
4:01 am – 5:00 am
8:01 am – 4:00 pm
7:01 pm – 11:00 pm
5:01 am – 8:00 am
4:01 pm – 7:00 pm
Super Economy 3:01 am – 5:00 am -$0.030398 X 11:01 pm – 3:00 am
5:01 am – 7:00 am
7:01 am – 12:00 pm
8:01pm – 11:00 pm
12:01 pm – 2:00 pm
6:01 pm – 8:00 pm
Super Peak 2:01 pm – 6:00 pm -$0.088620 X Sum Credits, $
- For more information please see Tariff section 500.1.13 BASE POWER ENERGY CREDIT
X
X
Non-Summer
(Jan. – May and Oct. –
Dec.)
Economy -$0.037529
Normal
Time of Use Period
X
-$0.042449
Peak -$0.045680
Normal -$0.035883
X
X
X
Summer (Jun. – Sep.)
Economy -$0.031940
Peak -$0.046863
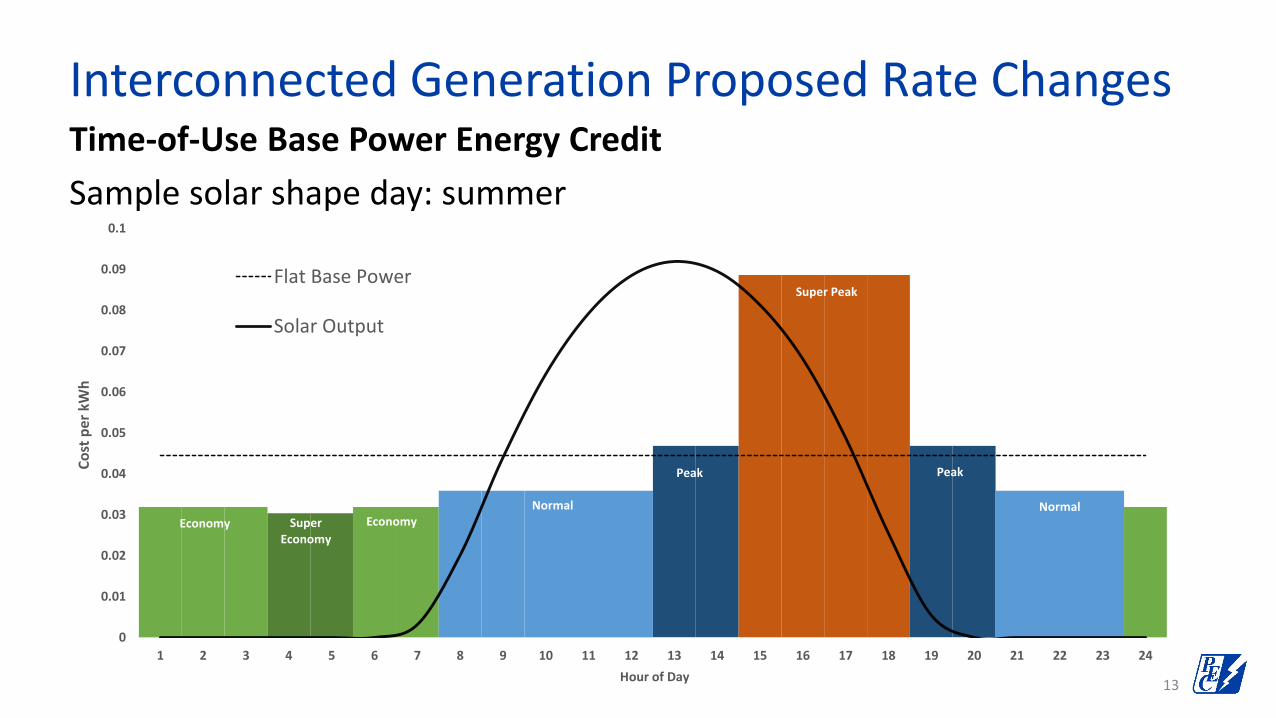
Time-of-Use Base Power Energy CreditSample solar shape day: summer
Interconnected Generation Proposed Rate Changes
13
Economy Super Economy
EconomyNormal
Peak
Super Peak
Peak
Normal
0
0.5
1
1.5
2
2.5
3
0
0.01
0.02
0.03
0.04
0.05
0.06
0.07
0.08
0.09
0.1
1 2 3 4 5 6 7 8 9 10 11 12 13 14 15 16 17 18 19 20 21 22 23 24
Cost
per
kW
h
Hour of Day
Flat Base Power
Solar Output

Time-of-Use Base Power Energy CreditSample solar shape day: non-summer
Interconnected Generation Proposed Rate Changes
14
Economy
SuperEconomy
Peak Normal Peak Normal
0
0.5
1
1.5
2
2.5
3
0
0.01
0.02
0.03
0.04
0.05
0.06
0.07
0.08
0.09
0.1
1 2 3 4 5 6 7 8 9 10 11 12 13 14 15 16 17 18 19 20 21 22 23 24
Cost
per
kW
h
Hour of Day
Flat Base Power
Solar Output
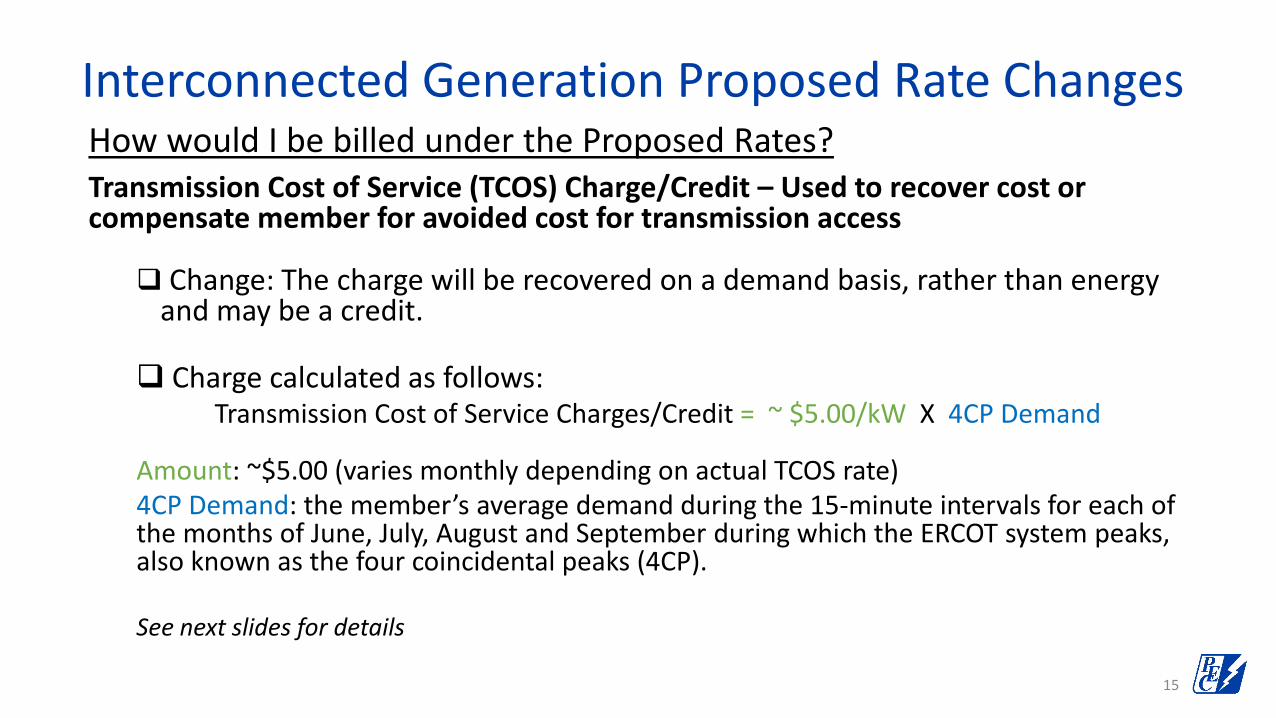
How would I be billed under the Proposed Rates?Transmission Cost of Service (TCOS) Charge/Credit – Used to recover cost or compensate member for avoided cost for transmission access
Change: The charge will be recovered on a demand basis, rather than energy and may be a credit.
Charge calculated as follows: Transmission Cost of Service Charges/Credit = ~ $5.00/kW X 4CP Demand
Amount: ~$5.00 (varies monthly depending on actual TCOS rate)4CP Demand: the member’s average demand during the 15-minute intervals for each of the months of June, July, August and September during which the ERCOT system peaks, also known as the four coincidental peaks (4CP).
See next slides for details
Interconnected Generation Proposed Rate Changes
15
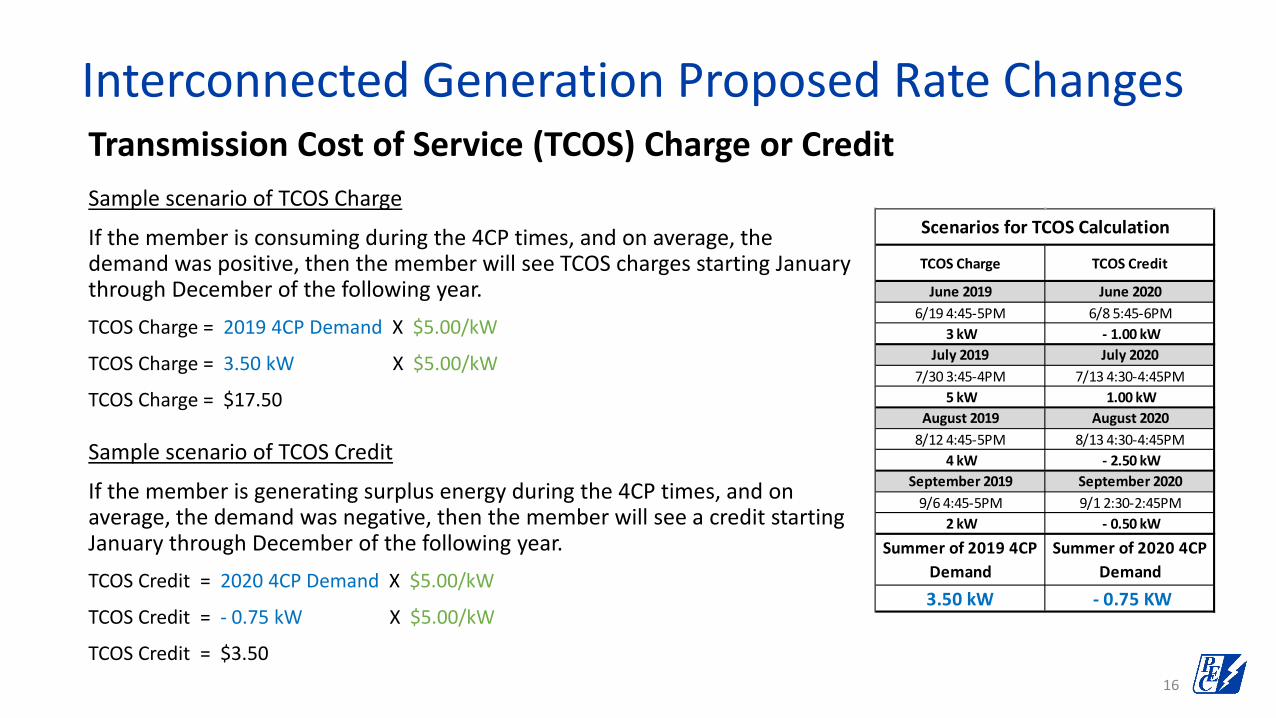
Sample scenario of TCOS Charge
If the member is consuming during the 4CP times, and on average, the demand was positive, then the member will see TCOS charges starting January through December of the following year.TCOS Charge = 2019 4CP Demand X $5.00/kW
TCOS Charge = 3.50 kW X $5.00/kW
TCOS Charge = $17.50
Sample scenario of TCOS Credit
If the member is generating surplus energy during the 4CP times, and on average, the demand was negative, then the member will see a credit starting January through December of the following year.TCOS Credit = 2020 4CP Demand X $5.00/kW
TCOS Credit = - 0.75 kW X $5.00/kW
TCOS Credit = $3.50
Interconnected Generation Proposed Rate Changes
16
Scenarios for TCOS Calculation
TCOS Charge TCOS Credit
Summer of 2020 4CP Demand
- 0.75 KW
August 20208/13 4:30-4:45PM
- 2.50 kWSeptember 20209/1 2:30-2:45PM
- 0.50 kW
June 20206/8 5:45-6PM
- 1.00 kWJuly 2020
7/13 4:30-4:45PM 1.00 kW
September 20199/6 4:45-5PM
2 kW
Summer of 2019 4CP Demand
3.50 kW
June 20196/19 4:45-5PM
3 kWJuly 2019
7/30 3:45-4PM 5 kW
August 20198/12 4:45-5PM
4 kW
Transmission Cost of Service (TCOS) Charge or Credit

Transmission Cost of Service (TCOS) Charge: Summer (June – September)
-0.5
0.0
0.5
1.0
1.5
2.0
2.5
3.0
1 2 3 4 5 6 7 8 9 10 11 12 13 14 15 16 17 18 19 20 21 22 23 24
Hour of Day
Interconnected Generation Proposed Rate Changes
17
Hours when a member’s 4CP demand may be set during the summer months of June, July, August, and September (typically 2:00 pm to 7:00 pm)

Scenario Information• Member type: Residential• Distributed Generation (DG) size: 7 KW• DG type: solar• Average energy usage without solar: 1,250 kWh/month
Monthly billing example will show bills for:• Month in 2021 – Net Metering Rate (Current) • Month in 2022 – Net Billing Rate with energy based TCOS charges (New)• Month in 2023 – Net Billing Rate (New)
Interconnected Generation Proposed Rate ChangesProposed Net Billing Rate - Billing Examples
18

Interconnected Generation Proposed Rate Changes
19
System Specifications System Specifications System SpecificationsSystem size 7 kW System size 7 kW System size 7 kW
Billing Determinants Value Unit Billing Determinants Value Unit Billing Determinants Value UnitDelivered Energy (DE) 943 kWh Peak Demand 5.00 kW Peak Demand 5.00 kWReceived Energy (RE) 401 kWh Delivered Energy (DE) 943 kWh Delivered Energy (DE) 943 kWhNet Energy (DE-RE) 542 kWh Super Economy 71 kWh Super Economy 71 kWh
Economy 171 kWh Economy 171 kWhNormal 460 kWh Normal 460 kWh
Peak 240 kWh Peak 240 kWhReceived Energy (RE) 401 kWh Received Energy (RE) 401 kWh
Super Economy 0 kWh Super Economy 0 kWhEconomy 0 kWh Economy 0 kWh
Normal 382 kWh Normal 382 kWhPeak 19 kWh Peak 19 kWh
Net Energy 542 kWh 4CP Demand 1.00 kW
Current Activity Current Activity Current ActivityService Availability Charge $22.50 22.50$ Service Availability Charge 22.50$ Service Availability Charge 22.50$ Delivery Charge 542 kWh @ $0.027120 14.70$ Peak Demand Charge 5 kW @ $5.15 25.75$ Peak Demand Charge 5 kW @ $5.15 25.75$ Base Power Cost 542 kWh @ $0.044500 24.13$ Base Power Cost Base Power CostTCOS Charge 542 kWh @ $0.013560 7.35$ Super Economy 71 kWh @ $0.030616 2.19$ Super Economy 71 kWh @ $0.030616 2.19$
Economy 171 kWh @ $0.037529 6.43$ Economy 171 kWh @ $0.037529 6.43$ Normal 460 kWh @ $0.042449 19.54$ Normal 460 kWh @ $0.042449 19.54$
Peak 240 kWh @ $0.045680 10.95$ Peak 240 kWh @ $0.045680 10.95$ Base Power Energy Credit Base Power Energy Credit
Super Economy 0 kWh @ -$0.030616 -$ Super Economy 0 kWh @ -$0.030616 -$ Economy 0 kWh @ -$0.037529 -$ Economy 0 kWh @ -$0.037529 -$
Normal 382 kWh @ -$0.042449 (16.20)$ Normal 382 kWh @ -$0.042449 (16.20)$ Peak 19 kWh @ -$0.045680 (0.86)$ Peak 19 kWh @ -$0.045680 (0.86)$
TCOS Charge 542 kWh @ $0.013560 7.35$ TCOS Charge/Credit 1.00 kW @ $5.35 5.35$ $ 68.68 77.64$ 75.64$ TOTAL AMOUNT DUE TOTAL AMOUNT DUE TOTAL AMOUNT DUE
Current: Interconnect Net Metering Rate Interim: Interconnect Net Billing Rate (TCOS/kWh) New: Interconnect Net Billing Rate Bill Sample - 2021 Bill Sample - 2022 Bill Sample - 2023

Interconnected Generation Proposed Rate Changes
20
Flat rate refers to the existing Net Energy Rate, using rates as of today.
Time of Use sections refers to the proposed Net Billing Rate.
Interconnected Generation Proposed Rate Changes
21
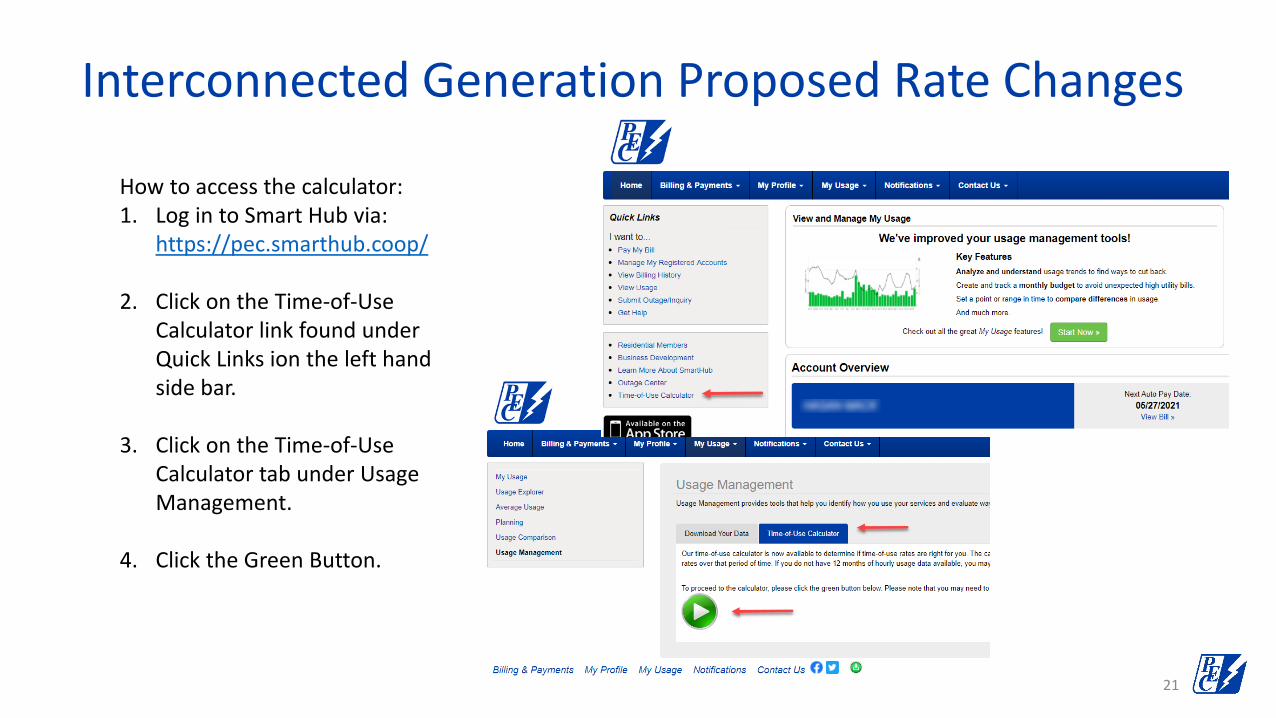
How to access the calculator:1. Log in to Smart Hub via:
https://pec.smarthub.coop/
2. Click on the Time-of-Use Calculator link found under Quick Links ion the left hand side bar.
3. Click on the Time-of-Use Calculator tab under Usage Management.
4. Click the Green Button.

Natalia Mack Rates [email protected]
David L. ThompsonVP of [email protected]
22
Please visit PEC’s webpage for Distributed Generation Rates
If you have any Questions please email [email protected]

pec.coop
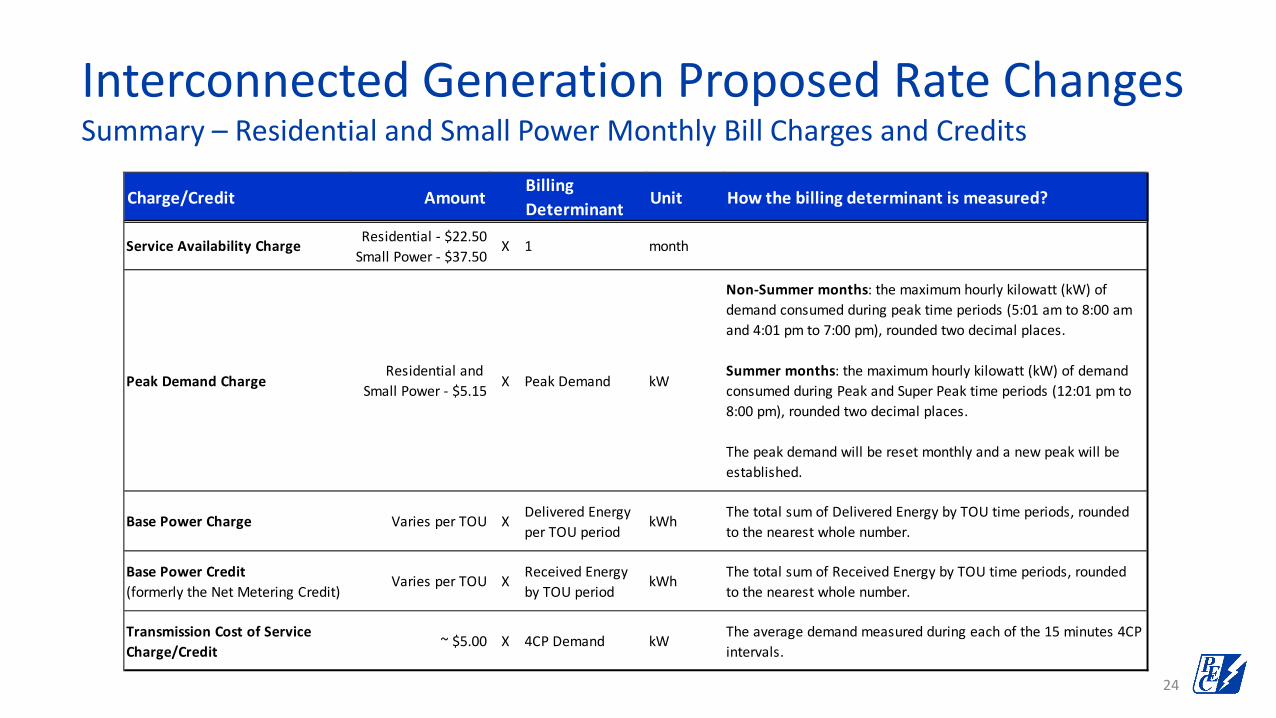
Interconnected Generation Proposed Rate ChangesSummary – Residential and Small Power Monthly Bill Charges and Credits
24
Charge/Credit AmountBilling Determinant Unit How the billing determinant is measured?
Service Availability Charge Residential - $22.50Small Power - $37.50
X 1 month
Peak Demand ChargeResidential and
Small Power - $5.15 X Peak Demand kW
Non-Summer months: the maximum hourly kilowatt (kW) of demand consumed during peak time periods (5:01 am to 8:00 am and 4:01 pm to 7:00 pm), rounded two decimal places.
Summer months: the maximum hourly kilowatt (kW) of demand consumed during Peak and Super Peak time periods (12:01 pm to 8:00 pm), rounded two decimal places.
The peak demand will be reset monthly and a new peak will be established.
Base Power Charge Varies per TOU X Delivered Energy per TOU period
kWh The total sum of Delivered Energy by TOU time periods, rounded to the nearest whole number.
Base Power Credit (formerly the Net Metering Credit)
Varies per TOU X Received Energy by TOU period
kWh The total sum of Received Energy by TOU time periods, rounded to the nearest whole number.
Transmission Cost of Service Charge/Credit
~ $5.00 X 4CP Demand kW The average demand measured during each of the 15 minutes 4CP intervals.


