Download - Interactions between metal oxides and species of nitrogen and iodine in bioturbated marine sediments
PII S0016-7037(00)00400-2
Interactions between metal oxides and species of nitrogen and iodine in bioturbatedmarine sediments
PIERRE ANSCHUTZ,1,* BJØRN SUNDBY,2 LUCIE LEFRANCOIS,2 GEORGE W. LUTHER III, 3 and ALFONSO MUCCI4
1Departement de Ge´ologie et Oce´anographie, UMR 5805 EPOC, Universite´ Bordeaux I, Talence 33405, France2Institut des Sciences de la Mer de Rimouski, Universite´ du Quebec aRimouski, Rimouski, QC, Canada G5L 3A1
3College of Marine Studies, University of Delaware, Lewes, DE 19958, USA4Earth & Planetary Sciences, McGill University, Montreal, QC, Canada H3A 2A7
(Received September29, 1999;accepted in revised form March23, 2000)
Abstract—By using a gold amalgam (Au/Hg) voltammetric microelectrode, we have measured simulta-neously and with millimeter resolution the distributions of O2, Mn(II), Fe(II), I(2I), and HS(2I) inbioturbated sediment cores from the Laurentian Trough. We also measured nitrate and ammonia in the porewater, total I and ascorbate- and HCl-extractable Fe and Mn in the solid-phase sediment, and fluxes of O2,NO3
2, and NH41 across the sediment–water interface. The concentrations of O2 and Mn(II) were below their
respective detection limits of 3 and 5mM between 4 and 12 mm depth, but a sharp iodide maximum occurredat the depth where upward diffusing Mn(II) was being removed. We propose that the iodide peak is maintainedthrough the reduction of IO3
2 by Mn(II), reoxidation of I(2I) to IO32 in the oxic zone above the peak and
oxidation to I2 below where it is ultimately trapped by reaction with organic matter. The iodide production rateis sufficient to account for the oxidation of all of the upward diffusing Mn(II) by IO3
2.Nitrate plus nitrite (SNO3) decreased to a minimum within 10 mm of the sediment–water interface, in
agreement with flux measurements which showedSNO3 uptake by the sediment. Below the minimum,SNO3
rebounded, and reached a maximum at 40- to 50-mm depth. This rebound is attributed to the anaerobicoxidation of ammonia by manganese oxides. Fe(II) was always first detected below the anoxicSNO3
maximum, and was accompanied by colloidal or complexed Fe(III). A sharp upward-directed ammoniagradient was recorded near the sediment–water interface, but no ammonia was released during the first 48 hof the incubations. If the ammonia removal were due to coupled bacterial nitrification–denitrification, morethan one half of the total measured oxygen uptake (6.7 to 7.3 mmol/m2/d) would be required, and more organiccarbon would be oxidized by nitrate than by oxygen. This scenario is not supported by nitrate flux calculations.Alternatively, the oxidation of ammonia to N2 by manganese oxides is a potential removal mechanism. Itwould require one quarter of the total oxygen flux.
The high-resolution profiles of redox species support the conceptualization of bioturbated sediments as aspatially and temporally changing mosaic of redox reactions. They show evidence for a multitude of reactionswhose relative importance will vary over time, and for reaction pathways complementing those usuallyconsidered in diagenetic studies.Copyright © 2000 Elsevier Science Ltd
1. INTRODUCTION
The preferential use of the electron acceptor that yields thehighest amount of free energy in the terminal step of thebacterially mediated oxidation of organic matter constitutes along-standing paradigm in biogeochemistry (Froelich et al.,1979; Postma and Jakobsen, 1996). In undisturbed sediments,this paradigm is reflected in a well established depth zonationof redox reactions in which oxygen is reduced near the sedi-ment–water interface, followed by the reduction of nitrate,manganese oxides, iron oxides, sulfate, and carbon dioxide.However, in sediments where the relative positions of reducingand oxidizing sediment components keep shifting because ofbioturbation or other physical disturbances, the time sequenceof redox reactions does not always translate to a similarlyrecognizable depth sequence. Nor does the concept of a verticalchemical zonation necessarily apply under such conditions. As
pointed out by Aller (1994a), such disturbed systems could bebetter conceptualized as a spatially and temporally changingmosaic of redox reactions.
Among the many possible redox reactions, those involvingmanganese and iron oxides can be particularly important be-cause sediment particles located at or above the O2 penetrationdepth commonly accumulate these oxides through the oxidativeprecipitation of dissolved manganese and iron. For example,the concentration of manganese dioxide in a volume of sedi-ment of 0.9 porosity containing 1000 ppm Mn(IV) on a dryweight basis, common in coastal sediments (e.g., Sundby et al.,1993), would be 5mmol/cm3, assuming a particle density of2.65. This is more than one order of magnitude higher thantypical dissolved oxygen concentrations in sediment pore waternear the sediment–water interface. Near the sediment surfaceand in the vicinity of metal-rich particles biotransported intothe anoxic sediment, reduced sediment components can en-counter high concentrations of metal oxides with which theymay react (Aller, 1994b). Examples of reactions involvingmetal oxides are the oxidation of ammonia to dinitrogen bymanganese oxides in the presence of oxygen (Luther et al.,1997) and the oxidation of sulfide to sulfate and ammonia to
* Author to whom correspondence should be addressed([email protected]).
Pergamon
Geochimica et Cosmochimica Acta, Vol. 64, No. 16, pp. 2751–2763, 2000Copyright © 2000 Elsevier Science LtdPrinted in the USA. All rights reserved
0016-7037/00 $20.001 .00
2751
nitrate by manganese oxides in the absence of oxygen (Allerand Rude, 1988; Hulth et al., 1999).
If we approximate bioturbation as a succession of mixingevents, a bioturbated sediment can be thought of as an envi-ronment where the distributions of oxidants and reductantsevolve towards, without necessarily achieving, a steady statebefore the next event disrupts the process. The extent to whichmixing events affect the evolution towards a steady state de-pends on their frequency, for the higher the frequency, the lesstime is available for the concentration of a redox species toevolve towards the steady state before the next event occurs. Italso depends on the concentration gradient across the intervalbeing mixed, for the greater the concentration difference, thegreater is the net flux. Vertical profiles of redox species aretherefore likely to represent a transient state rather than a steadystate. Here we report new measurements of electroactive spe-cies in continental margin sediments, made with a voltammetricmicroelectrode that can measure simultaneously and with mil-limeter resolution the concentrations of O2, I(2I), Mn(II),Fe(II), and HS(2I) in sediment pore water (Brendel andLuther, 1995; Luther et al., 1998). We use these data, incombination with solid-phase analyses and concurrent mea-surements of nitrate and ammonia profiles and fluxes to illus-trate the dynamic nature of diagenesis in bioturbated sediments.
2. METHOD
2.1. Sample Collection
Undisturbed samples of fine-grained muddy sediments were col-lected by using a 203 30 cm box corer at 325 m (St. 23), 200 m (St.23A), and 100 m depth (St. 23B) on a section across the sloping bottom
of the Laurentian Trough in the lower St. Lawrence Estuary offRimouski in June 1997 (Fig. 1). The deepest station corresponds to St.23 in Silverberg and Sundby (1990) and Sundby et al. (1981). The boxcores were subsampled by pushing two 60 cm long, 10 cm diameter,Plexiglas tubes gently, to avoid compression, into each box core. Thesubcores, which were sealed with plastic caps, contained;15 cm ofoverlying bottom water. The subcores were left in the box core until theship reached the harbor (3 to 4 h) to take advantage of the thermalinertia of the mud and prevent warming. The six subcores were thusbrought to the laboratory with minimal disturbance. The cores werekept refrigerated at the in situ temperature of 4°C for the duration of theexperiment. One subcore from each station was used for flux measure-ments and a second core was used for sediment and pore–wateranalysis.
2.2. Pore–Water Profiling of O2, Mn(II), Fe(II), I( 2I),and S(2II)
The voltammetric gold amalgam microelectrodes used to measurethese redox species were made by sealing a 100mm gold wire in a glasscapillary and plating mercury onto the polished exposed gold surface.The construction of the microelectrode is described in Brendel andLuther (1995) and Luther et al. (1998). A standard three-electrodevoltammetric cell was used for all electrochemical measurements withthe microelectrode as working electrode, a 0.5 mm diameter platinumwire as counter electrode, and a saturated calomel electrode (SCE) asreference electrode. The counter and reference electrodes were insertedinto the surface of the core approximately 1 cm from the workingelectrode. An Analytical Instrument Systems, Inc. (AIS) model DLK-100 electrochemical analyzer was used for all measurements. TheDLK-100 has a picoammeter detection system with full computercontrol which allows for excellent detection limits because both signaland noise can be distinguished at lower currents; it also allows theforward and reverse currents of a square wave voltammagram (whichare opposite in sign) to be plotted along with the resultant current. Theprocedure for electrode calibration is described elsewhere (Brendel,1995; Brendel and Luther, 1995).
Fig. 1. Map of the study area showing the location of stations 23, 23A, and 23B.
2752 P. Anschutz et al.
Oxygen was determined with linear sweep voltammetry (LSV),scanning from20.1 V to 21.7 V at a rate of 200 mV/s after 10 sequilibration at20.1 V. I(2I), Mn(II), Fe(II), and HS(2I) were deter-mined with square wave voltammetry (SWV). Before each scan, theelectrode was conditioned for 30 s at20.1 V to restore the electrodesurface. This step removes any previously deposited reduced elementsfrom the amalgam. The conditioning was followed by a scan from20.1V to 21.7 V in the square wave mode. In this mode the parametervalues were: pulse height 15 mV, step increment 2 mV, frequency 100Hz, and scan rate 200 mV/s. When HS(2I) was detected, we ran asecond scan after a conditioning step at20.85 V. Detection limits atthe 99% confidence limit for O2, Mn(II), Fe(II), I(2I), and HS(2I) are3, 5, 15,,0.2, and,0.2 mM, respectively. Precision for replicates ofall species at a given depth is typically 2 to 5%. I(2I) could not bedetermined below the depth where Fe(II) first appeared in the profilebecause the signal was masked by a broad peak, attributed to colloidalFe(III) species (Taillefert et al., 2000), that occurred at the reductionpotential for I(2I).
The microelectrode profiling was carried out at the in situ tempera-ture immediately upon the arrival of the subcores in the laboratory.Each vertical profile consisted of;100 measurements, taking;2 mineach. Core 23B was analyzed first, followed immediately by core 23and core 23A. Thus, all microelectrode measurements were completedwithin 15 h of sampling.
A recent in situ deployment comparing oxygen measurement withClark-type and voltammetric micro-electrodes showed excellent agree-ment (Luther et al., 1999). Likewise, agreement within 5% was ob-tained between direct pore–water measurements of Fe(II) and measure-ment of pore water recovered by slicing and centrifuging sedimentsamples (Brendel and Luther, 1995).
2.3. Pore–Water Extraction and Porosity Determination
As soon as the micro-profiling was completed, the cores from St. 23and St. 23B were sectioned in 0.5, 1, or 2 cm vertical intervals in aglove bag under a stream of nitrogen. An aliquot of the wet sedimentof known volume and weight was freeze-dried and the weight loss wasused to calculate porosity (Berner, 1980). The dried solid was homog-enized and kept for solid-phase analysis. The remainder of the sedimentwas transferred to resealable polyethylene tubes and centrifuged 20 minunder nitrogen at 3000 rpm to extract the pore water. The pore–watersamples were filtered (0.4mm) and an aliquot was immediately ana-lyzed for ammonia. The remaining sample was frozen and processedwithin a few days for nitrate1 nitrite (SNO3). The cores from St. 23and 23B were processed rapidly, but the processing of the core from St.23A was postponed by two days because of time constraints. Althoughthe core was kept at the in situ temperature during this time, it ispossible that the delay led to changes in the distributions of ammoniaand nitrate. This is taken into consideration in the discussion of thedata.
2.4. Solid-phase Analysis
The freeze-dried solid from the porosity determination was homog-enized in preparation for analysis. The water content and the salinitywere used to correct the analyses for the presence of sea salt. Samplesfrom the top 10 cm of the cores and a sample from the bottom of eachcore were subjected to two different extraction techniques. The mostreactive iron oxide fraction (amorphous oxides) was extracted with anascorbate reagent (Anschutz et al., 1998; Ferdelman, 1988; Kostka andLuther, 1994). This reagent consisted of a deaerated solution of 10 g ofsodium citrate and 10 g of sodium bicarbonate in 200 mL of deionizedwater to which 4 g ofascorbic acid was slowly added to a final pH of8. About 100 mg of dry sediment was extracted at room temperaturewith 13 mL of this reagent while shaking continuously for 24 h. Asecond extraction on a separate 200 mg aliquot was carried out with 35mL of 1 N HCl for 6 h to determine acid soluble Mn and Fe. Thecentrifuged solutions were then diluted in 1 N HCl and analyzed.
Unlike Fe, similar amounts of Mn were extracted from the freeze-dried solids by the two reagents. The ascorbate reagent extracts selec-tively amorphous iron and manganese oxides and associated elements(Kostka and Luther, 1994). The reactive phases extracted by 1 N HClrepresented the operationally defined fraction that comprises amor-
phous and crystalline Fe and Mn oxides, carbonates and hydrousaluminum silicates (Huerta–Diaz and Morse, 1990; 1992) but may notinclude the oxidation products of Fe monosulfides (goethite and hema-tite; Raiswell et al., 1994). Consequently, FeASC is expected to besmaller than FeHCl. There are flaws inherent in any extraction proce-dure but even critics of these techniques concede that they are usefultools when used and interpreted with caution. We are aware that thesolid-phase speciation of metals may change upon oxidation andfreeze-drying of the sediments (Rapin et al., 1986). The most signifi-cant change is the oxidation of acid volatile sulfides (AVS) to oxidesthat are not readily extracted by the 1 N HCl reagent (Raiswell et al.,1994).
Total iodine was determined by X-ray fluorescence (XRF) using aPhilips model PW2400 spectrometer equipped with a rhodium 60 kVend-window X-ray tube. The analysis was carried out on 40-mmdiameter pressed pellets prepared by mixing the freeze-dried sedimentwith Hoechst Wax C Micropowder (5:1). The instrument was cali-brated by using IS-40 Certified International Reference Materials. Thedetection limit, based on three times the background sigma value, was1mg/kg.
2.5. Flux Measurements
Immediately upon arrival in the laboratory, subcores from each ofthe three stations were incubated at 4°C in the dark to measure thefluxes of oxygen, nitrate, and ammonia across the sediment–waterinterface, by using the procedures described in Hulth et al. (1994). APlexiglas lid, equipped with a magnetic stirring bar rotating at 30 rpmand Teflon valves for sampling, capped the core barrel containing thesediment and;12 cm (1 L) of supernatant water. Care was taken toavoid trapping air bubbles under the lid. Water samples were collectedfrom each core eleven times during the 110 h of incubation. A 50 mLsample was drawn into a glass syringe for oxygen analysis by theWinkler method and another 15 mL was collected with a plastic syringeand immediately filtered through a 0.45mm filter for ammonia andnitrate measurements. As the samples were drawn, they were replacedby an equal volume of St. 23B bottom water of known oxygen, nitrate,and ammonia concentrations. The measured concentrations in the sam-ples were corrected for the amount added with the replacement water.Within the range of concentrations measured, the precision (one stan-dard deviation) of the oxygen, nitrate and ammonia analyses wasapproximately 5mM, 1 mM, and 1mM, respectively. The error aftercorrecting for the addition of replacement water is estimated to be twicethe analytical precision.
2.6. Analytical Procedures
Fe and Mn extracted from the sediment were measured by flame–atomic absorption spectroscopy, using aqueous standards. Ammoniawas measured by using the flow injection method described by Hall andAller (1992), and nitrate plus nitrite (SNO3) were measured by the flowinjection method of Anderson (1979). The analytical precision of thesemethods is better than 5%.
3. RESULT
3.1. Sediment Composition
The sediment cores consisted of fine-grained olive greenmuds with a thin (,1 cm) brown surface layer. The sedimentsin the Laurentian Trough are bioturbated (Silverberg et al.,1986), and we found one or two living polychaete worms ineach core. The porosity at St. 23 decreased exponentially from88% in the surface layer to 75% at 35 cm. The porosity profilesat St. 23A and St. 23B were similar to St. 23, but at corre-sponding depths the porosities were shifted towards lowervalues by 2 and 5%, respectively.
2753Bioturbated marine sediments
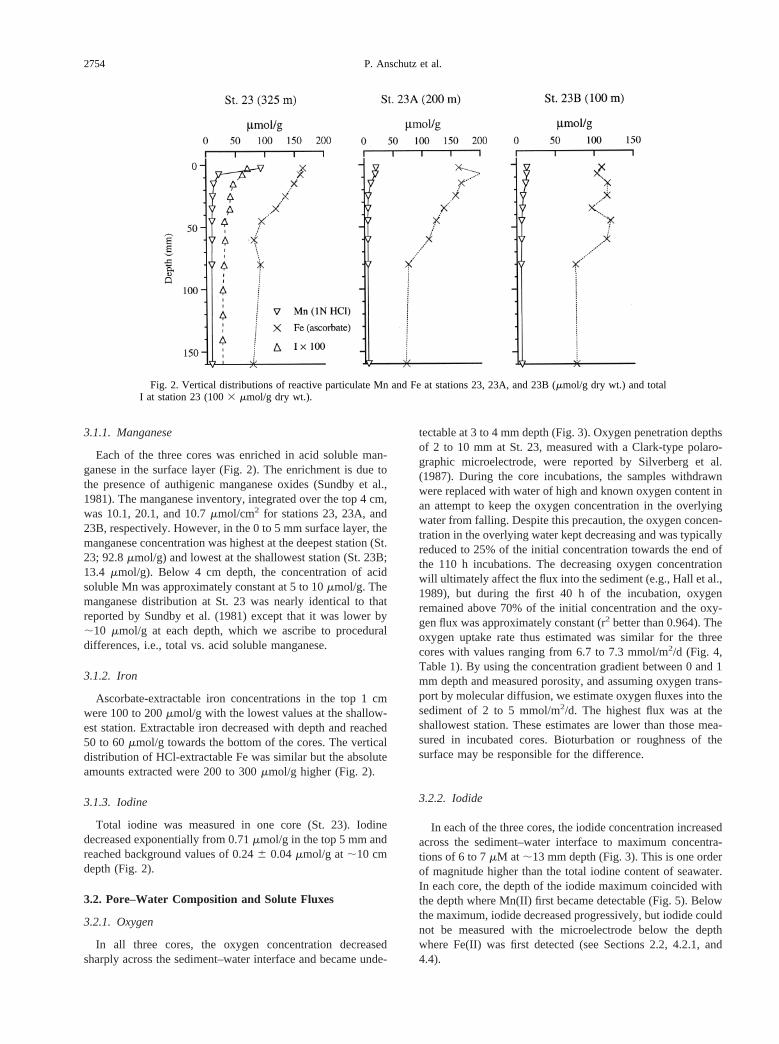
3.1.1. Manganese
Each of the three cores was enriched in acid soluble man-ganese in the surface layer (Fig. 2). The enrichment is due tothe presence of authigenic manganese oxides (Sundby et al.,1981). The manganese inventory, integrated over the top 4 cm,was 10.1, 20.1, and 10.7mmol/cm2 for stations 23, 23A, and23B, respectively. However, in the 0 to 5 mm surface layer, themanganese concentration was highest at the deepest station (St.23; 92.8mmol/g) and lowest at the shallowest station (St. 23B;13.4 mmol/g). Below 4 cm depth, the concentration of acidsoluble Mn was approximately constant at 5 to 10mmol/g. Themanganese distribution at St. 23 was nearly identical to thatreported by Sundby et al. (1981) except that it was lower by;10 mmol/g at each depth, which we ascribe to proceduraldifferences, i.e., total vs. acid soluble manganese.
3.1.2. Iron
Ascorbate-extractable iron concentrations in the top 1 cmwere 100 to 200mmol/g with the lowest values at the shallow-est station. Extractable iron decreased with depth and reached50 to 60mmol/g towards the bottom of the cores. The verticaldistribution of HCl-extractable Fe was similar but the absoluteamounts extracted were 200 to 300mmol/g higher (Fig. 2).
3.1.3. Iodine
Total iodine was measured in one core (St. 23). Iodinedecreased exponentially from 0.71mmol/g in the top 5 mm andreached background values of 0.246 0.04mmol/g at;10 cmdepth (Fig. 2).
3.2. Pore–Water Composition and Solute Fluxes
3.2.1. Oxygen
In all three cores, the oxygen concentration decreasedsharply across the sediment–water interface and became unde-
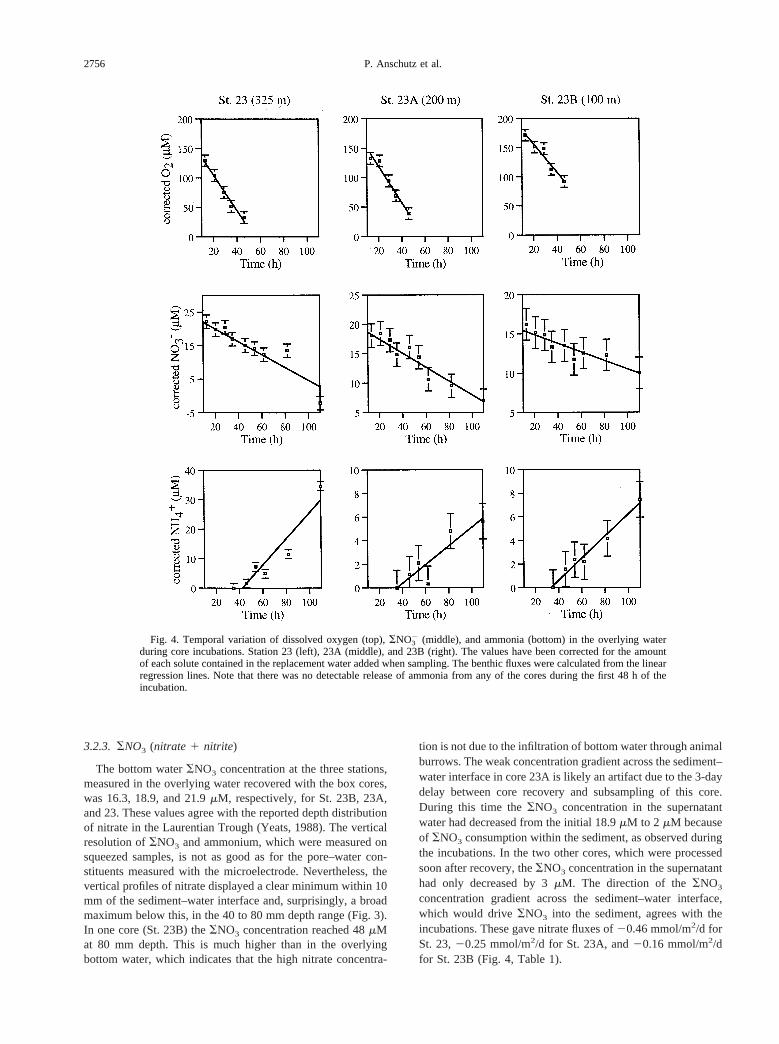
tectable at 3 to 4 mm depth (Fig. 3). Oxygen penetration depthsof 2 to 10 mm at St. 23, measured with a Clark-type polaro-graphic microelectrode, were reported by Silverberg et al.(1987). During the core incubations, the samples withdrawnwere replaced with water of high and known oxygen content inan attempt to keep the oxygen concentration in the overlyingwater from falling. Despite this precaution, the oxygen concen-tration in the overlying water kept decreasing and was typicallyreduced to 25% of the initial concentration towards the end ofthe 110 h incubations. The decreasing oxygen concentrationwill ultimately affect the flux into the sediment (e.g., Hall et al.,1989), but during the first 40 h of the incubation, oxygenremained above 70% of the initial concentration and the oxy-gen flux was approximately constant (r2 better than 0.964). Theoxygen uptake rate thus estimated was similar for the threecores with values ranging from 6.7 to 7.3 mmol/m2/d (Fig. 4,Table 1). By using the concentration gradient between 0 and 1mm depth and measured porosity, and assuming oxygen trans-port by molecular diffusion, we estimate oxygen fluxes into thesediment of 2 to 5 mmol/m2/d. The highest flux was at theshallowest station. These estimates are lower than those mea-sured in incubated cores. Bioturbation or roughness of thesurface may be responsible for the difference.
3.2.2. Iodide
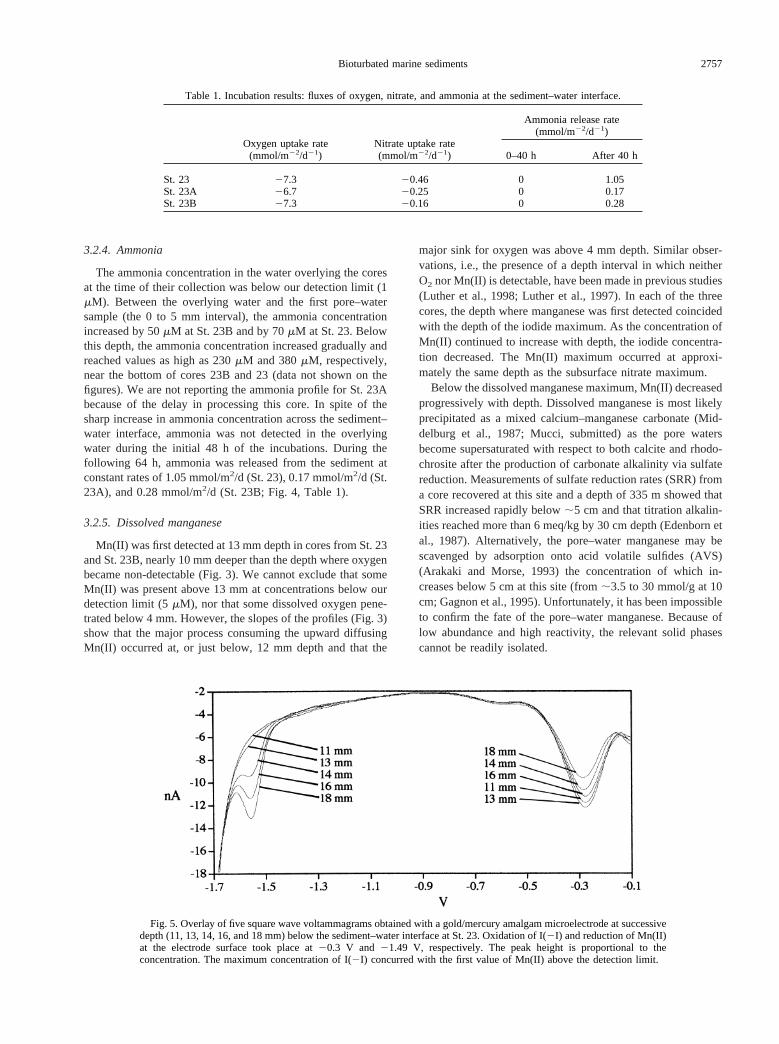
In each of the three cores, the iodide concentration increasedacross the sediment–water interface to maximum concentra-tions of 6 to 7mM at ;13 mm depth (Fig. 3). This is one orderof magnitude higher than the total iodine content of seawater.In each core, the depth of the iodide maximum coincided withthe depth where Mn(II) first became detectable (Fig. 5). Belowthe maximum, iodide decreased progressively, but iodide couldnot be measured with the microelectrode below the depthwhere Fe(II) was first detected (see Sections 2.2, 4.2.1, and4.4).
Fig. 2. Vertical distributions of reactive particulate Mn and Fe at stations 23, 23A, and 23B (mmol/g dry wt.) and totalI at station 23 (1003 mmol/g dry wt.).
2754 P. Anschutz et al.
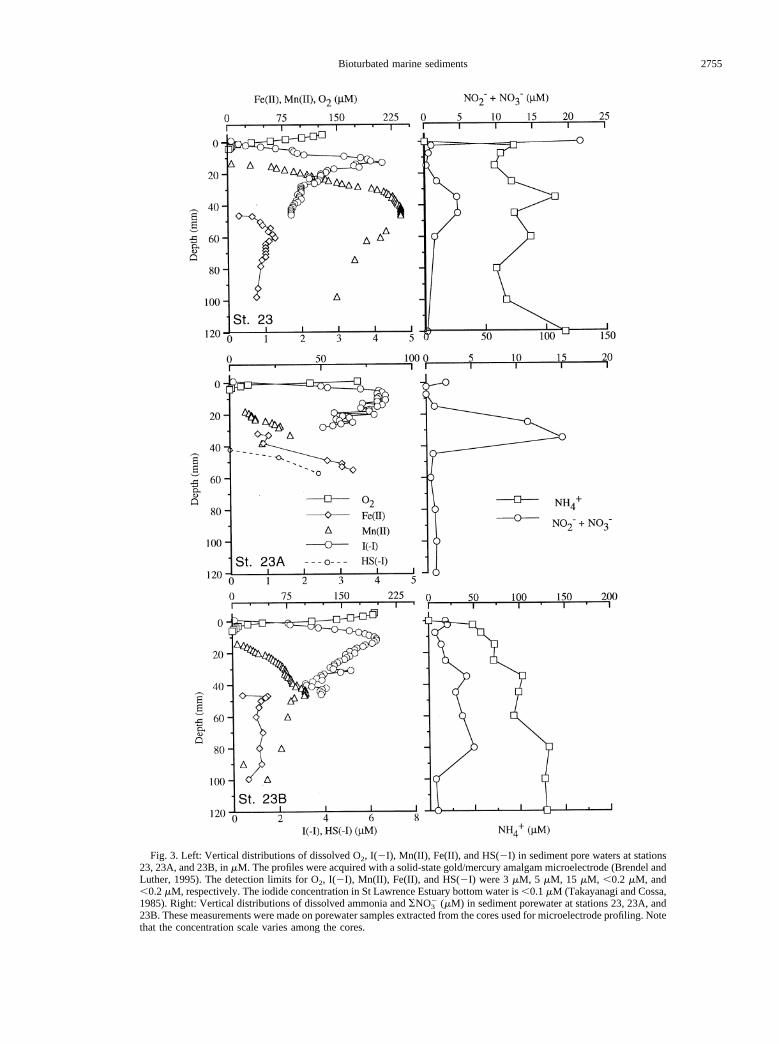
Fig. 3. Left: Vertical distributions of dissolved O2, I(2I), Mn(II), Fe(II), and HS(2I) in sediment pore waters at stations23, 23A, and 23B, inmM. The profiles were acquired with a solid-state gold/mercury amalgam microelectrode (Brendel andLuther, 1995). The detection limits for O2, I(2I), Mn(II), Fe(II), and HS(2I) were 3mM, 5 mM, 15 mM, ,0.2 mM, and,0.2mM, respectively. The iodide concentration in St Lawrence Estuary bottom water is,0.1mM (Takayanagi and Cossa,1985). Right: Vertical distributions of dissolved ammonia andSNO3
2 (mM) in sediment porewater at stations 23, 23A, and23B. These measurements were made on porewater samples extracted from the cores used for microelectrode profiling. Notethat the concentration scale varies among the cores.
2755Bioturbated marine sediments
3.2.3. SNO3 (nitrate 1 nitrite)
The bottom waterSNO3 concentration at the three stations,measured in the overlying water recovered with the box cores,was 16.3, 18.9, and 21.9mM, respectively, for St. 23B, 23A,and 23. These values agree with the reported depth distributionof nitrate in the Laurentian Trough (Yeats, 1988). The verticalresolution ofSNO3 and ammonium, which were measured onsqueezed samples, is not as good as for the pore–water con-stituents measured with the microelectrode. Nevertheless, thevertical profiles of nitrate displayed a clear minimum within 10mm of the sediment–water interface and, surprisingly, a broadmaximum below this, in the 40 to 80 mm depth range (Fig. 3).In one core (St. 23B) theSNO3 concentration reached 48mMat 80 mm depth. This is much higher than in the overlyingbottom water, which indicates that the high nitrate concentra-
tion is not due to the infiltration of bottom water through animalburrows. The weak concentration gradient across the sediment–water interface in core 23A is likely an artifact due to the 3-daydelay between core recovery and subsampling of this core.During this time theSNO3 concentration in the supernatantwater had decreased from the initial 18.9mM to 2 mM becauseof SNO3 consumption within the sediment, as observed duringthe incubations. In the two other cores, which were processedsoon after recovery, theSNO3 concentration in the supernatanthad only decreased by 3mM. The direction of theSNO3
concentration gradient across the sediment–water interface,which would driveSNO3 into the sediment, agrees with theincubations. These gave nitrate fluxes of20.46 mmol/m2/d forSt. 23,20.25 mmol/m2/d for St. 23A, and20.16 mmol/m2/dfor St. 23B (Fig. 4, Table 1).
Fig. 4. Temporal variation of dissolved oxygen (top),SNO32 (middle), and ammonia (bottom) in the overlying water
during core incubations. Station 23 (left), 23A (middle), and 23B (right). The values have been corrected for the amountof each solute contained in the replacement water added when sampling. The benthic fluxes were calculated from the linearregression lines. Note that there was no detectable release of ammonia from any of the cores during the first 48 h of theincubation.
2756 P. Anschutz et al.
3.2.4. Ammonia
The ammonia concentration in the water overlying the coresat the time of their collection was below our detection limit (1mM). Between the overlying water and the first pore–watersample (the 0 to 5 mm interval), the ammonia concentrationincreased by 50mM at St. 23B and by 70mM at St. 23. Belowthis depth, the ammonia concentration increased gradually andreached values as high as 230mM and 380mM, respectively,near the bottom of cores 23B and 23 (data not shown on thefigures). We are not reporting the ammonia profile for St. 23Abecause of the delay in processing this core. In spite of thesharp increase in ammonia concentration across the sediment–water interface, ammonia was not detected in the overlyingwater during the initial 48 h of the incubations. During thefollowing 64 h, ammonia was released from the sediment atconstant rates of 1.05 mmol/m2/d (St. 23), 0.17 mmol/m2/d (St.23A), and 0.28 mmol/m2/d (St. 23B; Fig. 4, Table 1).
3.2.5. Dissolved manganese
Mn(II) was first detected at 13 mm depth in cores from St. 23and St. 23B, nearly 10 mm deeper than the depth where oxygenbecame non-detectable (Fig. 3). We cannot exclude that someMn(II) was present above 13 mm at concentrations below ourdetection limit (5mM), nor that some dissolved oxygen pene-trated below 4 mm. However, the slopes of the profiles (Fig. 3)show that the major process consuming the upward diffusingMn(II) occurred at, or just below, 12 mm depth and that the
major sink for oxygen was above 4 mm depth. Similar obser-vations, i.e., the presence of a depth interval in which neitherO2 nor Mn(II) is detectable, have been made in previous studies(Luther et al., 1998; Luther et al., 1997). In each of the threecores, the depth where manganese was first detected coincidedwith the depth of the iodide maximum. As the concentration ofMn(II) continued to increase with depth, the iodide concentra-tion decreased. The Mn(II) maximum occurred at approxi-mately the same depth as the subsurface nitrate maximum.
Below the dissolved manganese maximum, Mn(II) decreasedprogressively with depth. Dissolved manganese is most likelyprecipitated as a mixed calcium–manganese carbonate (Mid-delburg et al., 1987; Mucci, submitted) as the pore watersbecome supersaturated with respect to both calcite and rhodo-chrosite after the production of carbonate alkalinity via sulfatereduction. Measurements of sulfate reduction rates (SRR) froma core recovered at this site and a depth of 335 m showed thatSRR increased rapidly below;5 cm and that titration alkalin-ities reached more than 6 meq/kg by 30 cm depth (Edenborn etal., 1987). Alternatively, the pore–water manganese may bescavenged by adsorption onto acid volatile sulfides (AVS)(Arakaki and Morse, 1993) the concentration of which in-creases below 5 cm at this site (from;3.5 to 30 mmol/g at 10cm; Gagnon et al., 1995). Unfortunately, it has been impossibleto confirm the fate of the pore–water manganese. Because oflow abundance and high reactivity, the relevant solid phasescannot be readily isolated.
Fig. 5. Overlay of five square wave voltammagrams obtained with a gold/mercury amalgam microelectrode at successivedepth (11, 13, 14, 16, and 18 mm) below the sediment–water interface at St. 23. Oxidation of I(2I) and reduction of Mn(II)at the electrode surface took place at20.3 V and 21.49 V, respectively. The peak height is proportional to theconcentration. The maximum concentration of I(2I) concurred with the first value of Mn(II) above the detection limit.
Table 1. Incubation results: fluxes of oxygen, nitrate, and ammonia at the sediment–water interface.
Oxygen uptake rate(mmol/m22/d21)
Nitrate uptake rate(mmol/m22/d21)
Ammonia release rate(mmol/m22/d21)
0–40 h After 40 h
St. 23 27.3 20.46 0 1.05St. 23A 26.7 20.25 0 0.17St. 23B 27.3 20.16 0 0.28
2757Bioturbated marine sediments
3.2.6. Dissolved iron
Fe(II), measured as a peak at21.43 V, was first observed at35 to 46 mm depth, depending on the core. The concentrationof Fe(II) when it first occurred, was well above the detectionlimit for Fe(II) (15 mM), indicative of a sharp concentrationgradient and suggesting the presence in this layer of the majorsink of upward diffusing Fe(II). The depth of the first Fe(II)occurrence corresponds to the Mn(II) and nitrate maxima. Theappearance of Fe(II) was accompanied by a broad peak at20.4V in the voltammagram, consistent with the presence of col-loidal or dissolved Fe(III) complexes (Brendel and Luther,1995; Huettel et al., 1998). Some of the Fe(II) measured at21.43 V probably arose from the reduction of colloidal Fe(III)at the electrode, and the values of Fe(II) given in the pore–water profiles must therefore be considered as maximal. How-ever, there was no relationship between the height of the20.4V and the21.43 V peaks in the voltammograms, indicatingthat both Fe(II) and Fe(III) were present in the pore water.
3.2.7. Dissolved sulfide
No dissolved sulfide could be detected in cores 23 and 23Bover the depth interval examined with the microelectrode (0 to100 mm) although the smell of sulfide was noted deeper in thecores. In core St. 23A, sulfide was detected below 45 mmdepth.
4. DISCUSSION
4.1. Non-steady State Diagenesis
By definition, the distribution of a sediment property is atsteady-state if, at a fixed depth relative to the sediment–waterinterface, the property remains constant (Berner, 1980). Thesteady state is a useful idealization, but real sediment propertiesvary on various spatial and temporal scales. According to thedefinition, the distribution of solid-phase manganese in thesesediments is at steady state over a time scale of years becausethe distributions we observe (St. 23) are virtually identical toobservations made nearly 20 yr previously (Sundby et al.,1981) in spite of a sedimentation rate of;2 mm per year(Silverberg et al., 1986). However, the shape of the dissolvedMn(II) profile shows that the manganese system is not at steadystate. If it were, we should have observed a solid-phase man-ganese peak near the depth where dissolved Mn is beingremoved, i.e., at 13 mm depth (e.g., Burdige and Gieskes,1983). Strictly speaking, the solid-phase and pore–water pro-files may not be comparable because they were sampled ondifferent spatial scales, i.e., a 0.5 to 2 cm long, 10 cm diametersediment cylinder for the solid phase vs. a small volume nearthe surface of the 100mm diameter electrode surface forMn(II); yet, a similar offset between solid-phase and pore–water profiles was observed when both phases were sampled onthe same spatial scale (Gobeil et al., 1997). Given the non-steady state distribution of manganese species, we can assumethat the distributions of other redox species also are transient.The profiles, and the fluxes that can be deduced from them, arethus only representative of the time when the cores werecollected and do not represent an average or a steady state.These profiles provide an instantaneous picture of the many
reactions that take place in a sediment rather than an integratedview of dominant diagenetic reactions.
4.2. The Role of Manganese in Non-steady StateDiagenesis of Iodine and Nitrogen Species
Because of the ease with which it moves between the re-duced and oxidized states within the Eh–pH range commonlyencountered in marine sediments, manganese can participateboth as oxidant (electron acceptor) and reductant (electrondonor) in diagenetic reactions. Manganese oxide can serve asterminal electron acceptor in the bacterially mediated oxidationof organic matter (e.g., Froelich et al., 1979), as oxidant ofsulfides (Aller and Rude, 1988), and as oxidant of ammoniaproducing either N2 (Luther et al., 1997) or nitrate (Hulth et al.,1999). Other than the reaction with oxygen (Stumm and Mor-gan, 1996), redox reactions involving Mn(II) oxidation are notwell documented, but it has been proposed that Mn(II) mayreduce nitrate to N2 (Aller, 1990; Luther et al., 1997).
4.2.1. The oxidation of Mn(II) near the sediment–waterinterface
Conventionally, we would presume that the peak in solid-phase manganese located in the 0 to 5 mm surface layer iscreated by the oxidation of soluble Mn(II) to insoluble Mn(III/IV) oxides by oxygen, which is present in this layer. At the timeour cores were collected, however, this scenario did not seemoperative because Mn(II) was not detected above 13 mm depth.This suggests that manganese was being precipitated well be-low the depth of the solid-phase manganese maximum. Fur-thermore, because O2 was undetectable below 4 mm, the dataimply that O2 was not a major oxidant of Mn(II).
There are numerous reports of a layer of substantial thick-ness, both in sediments and in the water column, in which bothO2 and Mn(II) are below their respective detection limits, andit has been proposed that Mn(II) can be oxidized by NO3
2
(Aller, 1990; Schulz et al., 1994; Murray et al., 1995; Sørensenet al., 1987; Luther et al., 1997; 1998; Hulth et al., 1999).Consistent with this hypothesis, the nitrate distributions in ourcores go through a minimum located approximately at thedepth where Mn(II) is disappearing.
However, nitrate is not the only reactant other than oxygenthat may oxidize Mn(II). An alternate and perhaps competitiveoxidant is iodate, which occurs dissolved in seawater andadsorbed on sediment particles near the sediment–water inter-face (Ullman and Aller, 1985). The oxidation of Mn(II) byiodate (IO3
2) is thermodynamically favorable and the reactionyields free energy equivalent to the corresponding reactionbetween Mn(II) and nitrate (Luther et al., 1997). Ullman andAller (1985) proposed that a redox cycle for iodine exists nearthe sediment–water interface whereby iodide released duringthe decomposition of organic matter diffuses to the sediment–water interface where it is oxidized microbially to iodate, whichis then adsorbed onto metal oxides; upon burial and reductionof the carrying phases, the adsorbed iodate is released tosolution and may participate in redox reactions. Keeping inmind the transient nature of pore-water profiles in bioturbatedsediments, the iodide and total iodine distributions we observeare consistent with this mechanism. The sediment surface layer
2758 P. Anschutz et al.
is enriched in total iodine by a factor of three over the subsur-face sediment. Although the speciation was not determined, thesolid-phase iodine is probably a mixture of organic-I and iodateadsorbed onto iron(oxy)hydroxides. The pore–water iodide dis-tribution displays a sharp and well defined subsurface maxi-mum with concentrations (4.2mM at St. 23 and 23A and 6.3mM at St. 23B) one order of magnitude higher that the totalabundance of iodine in seawater (0.45mM, mostly as iodate;Luther et al., 1988). However, further work on the distributionof the various iodine species both in the solid phase and in thepore water will be needed to confirm this mechanism.
A remarkable aspect of the data set is that, at each of thethree sites, the iodide maximum coincided with the depth wherethe upward diffusing Mn(II) became undetectable. This sug-gests a coupling of the iodine and manganese cycles, i.e., thatupward diffusing Mn(II) is oxidized by an iodine species, mostlikely iodate. In order for iodate reduction to be quantitativelyimportant in a reaction with Mn(II), the production rate ofiodide should be stoichiometrically of the same order of mag-nitude as the upward flux of Mn(II). We can estimate a rate ofiodide production by assuming that it is balanced by the com-bined upward and downward fluxes of iodide from the iodidemaximum. The fluxes can be calculated, assuming transport bymolecular diffusion, from the two concentration gradients ac-cording to Fick’s first law:J 5 2fDsdC/dX, whereJ is flux, fis the porosity,dC/dX is the concentration gradient, andDs isthe bulk sediment diffusion coefficient corrected for tortuosity,i.e.,Ds 5 Do/u
2 whereu is the tortuosity andDo is the diffusioncoefficient in water (Berner, 1980).Do values were obtainedfrom Li and Gregory (1974) and the value ofu2 is assumed toequal 12 ln(f2) (Boudreau, 1996). For the data set of St. 23,the upward directed iodide gradient between 13 mm and thesediment–water interface is 3.23 nmol/cm4. The mean porosityover that interval is 0.86 andDs is 9.31.1026/cm2/s, giving anupward flux of 0.026 pmol/cm2/s. The downward concentrationgradient is 2.4 nmol/cm4, and with a porosity of 0.85 thedownward flux of iodide is estimated at 0.019 pmol/cm2/s. Thecombined flux of iodide away from the peak is thus 0.045pmol/cm2/s, or 0.39 mmol/m2/d. This is nearly one tenth of theoxygen flux into the sediment. These calculations assumesteady state and the results only apply to the time when thecores were collected.
Before comparing the iodide production rate with the man-ganese flux we need to consider the possibility that the iodideproduction is a result of the remineralization of organic matter,the ultimate source of iodine, which is known to release dis-solved iodide to the pore water (Kennedy and Elderfield, 1987;Ullman and Aller, 1983, 1985; Ullman and Sandstrom, 1987).The average molar I/Corg ratio is ;4 3 1024 in settlingparticulate matter (Shimmield and Pedersen, 1990). If we as-sume that iodide is released in this proportion and at the samerate as the remineralization of organic carbon, and further thatthis rate is approximated by the oxygen uptake rate, we obtaina release rate of iodide of approximately 0.0028 mmol/m2/d.This is more than two orders of magnitude less than the iodideproduction rate we estimated above, and, therefore, an unlikelysource for the observed subsurface iodide maximum. We pro-pose that the latter originates mostly from the reduction ofiodate by Mn(II). The possible reactions involved depend onwhether the oxidation product is MnO2 or MnOOH, but both
reactions are thermodynamically favorable (Luther et al.,1997).
1/2 Mn21 1 1/6 IO32 1 1/2 H2O7 1/2 MnO2
1 1/6 I2 1 H1 (1)
Mn21 1 1/6 IO32 1 3/2 H2O7 MnOOH
1 1/6 I2 1 2H1 (2)
We can now compare the iodide production rate with theupward flux of Mn(II). At St. 23, the Mn(II) gradient, which isapproximately linear across the 13 to 31 mm depth interval, isestimated as 118 nmol/cm4. The average porosity is 0.83 andDs is 2.773 1026 cm2/s, which gives a Mn(II) flux of 0.271pmol/cm2/s. This is six times the iodide production rate. Con-sidering the stoichiometry of Reactions 1 and 2, each mole ofIO3
2 oxidizes 3 or 6 mol of Mn(II), depending on the end-product. Assuming that the production rate of iodide can beequated with the reduction rate of iodate, the reduction ofiodate may thus account for 50 to 100% of the oxidation of theupward diffusing manganese. At St. 23A and 23B the respec-tive concentration gradients give higher values for the iodideproduction rate and lower values for the Mn(II) flux. At thesestations the estimated reduction rate of iodate is more thansufficient to account for the oxidation of all the Mn(II), irre-spective of the oxidation end-product.
The above conclusions apply only to the conditions at thetime of sampling. Because of the location of the solid-phasemanganese near the oxic sediment–water interface, oxygenreduction is probably the ultimate process that oxidizes andprecipitates dissolved manganese. The data do suggest, how-ever, that reactions between the iodine and manganese speciescan be important during the diagenesis of marine sediments.Moreover, they show that the relative importance of the manypossible diagenetic reactions involving manganese may bechanging over time, re-enforcing the view of diagenesis as atemporally and spatially variable web of redox reactions.
4.2.2. The fate of downward-diffusing iodide
To maintain the sharp pore–water iodide maximum observedin these cores, iodide must be removed both above and belowthe peak. Oxidation to iodate by oxygen may explain theremoval above (e.g., Kennedy and Elderfield, 1987) but notbelow the maximum. The direct loss of iodide from anaerobicpore waters has not been reported previously. A series ofexperiments conducted by Franc¸ois (1987) showed that I(2I)was not sequestered by the solid sediment whereas the oxidizediodine species (IO3
2, I2, and HIO) were. The removal of iodidethat we observe in our cores is, therefore, likely due to theproduction of an oxidized iodine species, which in turn reactswith the solid phase. An examination of the profiles shows thatthe downward-diffusing iodide encounters upward diffusingnitrate. One possibility is therefore that iodide is oxidized bynitrate in a reaction that yields N2 and I2. This reaction, whichis thermodynamically favorable at all pH encountered in ma-rine sediments (Fig. 6), is intriguing not only because it wouldpromote denitrification, but also because I2 is highly reactiveand could react further with organic matter to produce iodin-
2759Bioturbated marine sediments
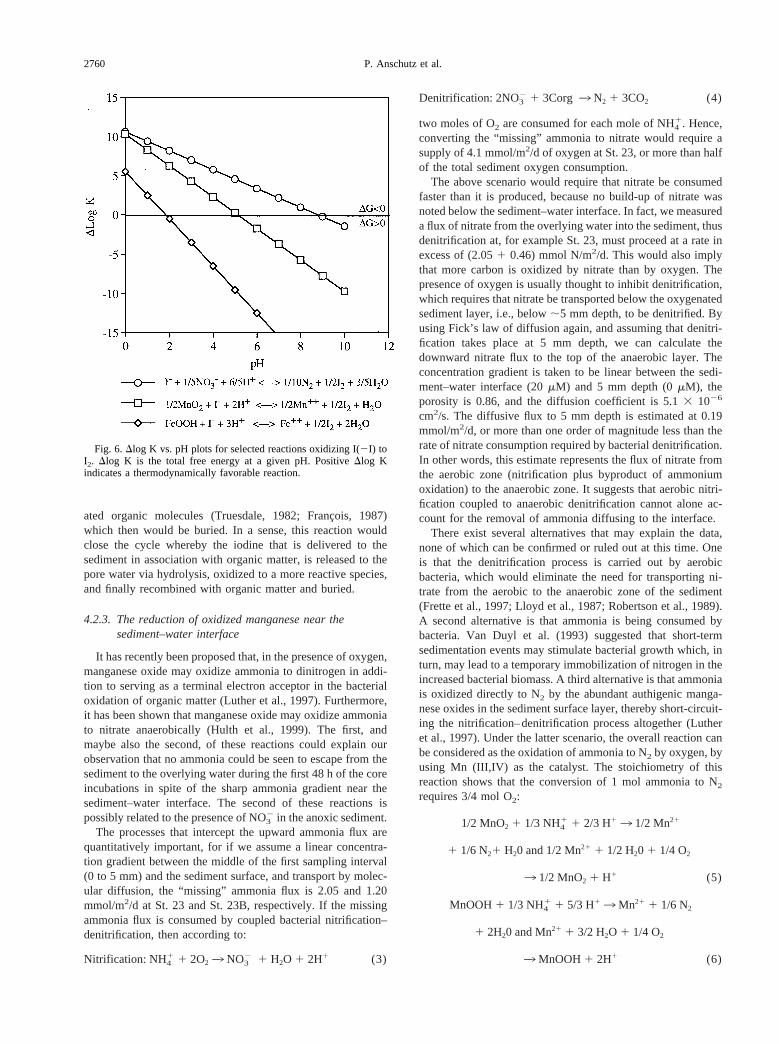
ated organic molecules (Truesdale, 1982; Franc¸ois, 1987)which then would be buried. In a sense, this reaction wouldclose the cycle whereby the iodine that is delivered to thesediment in association with organic matter, is released to thepore water via hydrolysis, oxidized to a more reactive species,and finally recombined with organic matter and buried.
4.2.3. The reduction of oxidized manganese near thesediment–water interface
It has recently been proposed that, in the presence of oxygen,manganese oxide may oxidize ammonia to dinitrogen in addi-tion to serving as a terminal electron acceptor in the bacterialoxidation of organic matter (Luther et al., 1997). Furthermore,it has been shown that manganese oxide may oxidize ammoniato nitrate anaerobically (Hulth et al., 1999). The first, andmaybe also the second, of these reactions could explain ourobservation that no ammonia could be seen to escape from thesediment to the overlying water during the first 48 h of the coreincubations in spite of the sharp ammonia gradient near thesediment–water interface. The second of these reactions ispossibly related to the presence of NO3
2 in the anoxic sediment.The processes that intercept the upward ammonia flux are
quantitatively important, for if we assume a linear concentra-tion gradient between the middle of the first sampling interval(0 to 5 mm) and the sediment surface, and transport by molec-ular diffusion, the “missing” ammonia flux is 2.05 and 1.20mmol/m2/d at St. 23 and St. 23B, respectively. If the missingammonia flux is consumed by coupled bacterial nitrification–denitrification, then according to:
Nitrification: NH41 1 2O23 NO3
2 1 H2O 1 2H1 (3)
Denitrification: 2NO32 1 3Corg3 N2 1 3CO2 (4)
two moles of O2 are consumed for each mole of NH41. Hence,
converting the “missing” ammonia to nitrate would require asupply of 4.1 mmol/m2/d of oxygen at St. 23, or more than halfof the total sediment oxygen consumption.
The above scenario would require that nitrate be consumedfaster than it is produced, because no build-up of nitrate wasnoted below the sediment–water interface. In fact, we measureda flux of nitrate from the overlying water into the sediment, thusdenitrification at, for example St. 23, must proceed at a rate inexcess of (2.051 0.46) mmol N/m2/d. This would also implythat more carbon is oxidized by nitrate than by oxygen. Thepresence of oxygen is usually thought to inhibit denitrification,which requires that nitrate be transported below the oxygenatedsediment layer, i.e., below;5 mm depth, to be denitrified. Byusing Fick’s law of diffusion again, and assuming that denitri-fication takes place at 5 mm depth, we can calculate thedownward nitrate flux to the top of the anaerobic layer. Theconcentration gradient is taken to be linear between the sedi-ment–water interface (20mM) and 5 mm depth (0mM), theporosity is 0.86, and the diffusion coefficient is 5.13 1026
cm2/s. The diffusive flux to 5 mm depth is estimated at 0.19mmol/m2/d, or more than one order of magnitude less than therate of nitrate consumption required by bacterial denitrification.In other words, this estimate represents the flux of nitrate fromthe aerobic zone (nitrification plus byproduct of ammoniumoxidation) to the anaerobic zone. It suggests that aerobic nitri-fication coupled to anaerobic denitrification cannot alone ac-count for the removal of ammonia diffusing to the interface.
There exist several alternatives that may explain the data,none of which can be confirmed or ruled out at this time. Oneis that the denitrification process is carried out by aerobicbacteria, which would eliminate the need for transporting ni-trate from the aerobic to the anaerobic zone of the sediment(Frette et al., 1997; Lloyd et al., 1987; Robertson et al., 1989).A second alternative is that ammonia is being consumed bybacteria. Van Duyl et al. (1993) suggested that short-termsedimentation events may stimulate bacterial growth which, inturn, may lead to a temporary immobilization of nitrogen in theincreased bacterial biomass. A third alternative is that ammoniais oxidized directly to N2 by the abundant authigenic manga-nese oxides in the sediment surface layer, thereby short-circuit-ing the nitrification–denitrification process altogether (Lutheret al., 1997). Under the latter scenario, the overall reaction canbe considered as the oxidation of ammonia to N2 by oxygen, byusing Mn (III,IV) as the catalyst. The stoichiometry of thisreaction shows that the conversion of 1 mol ammonia to N2
requires 3/4 mol O2:
1/2 MnO2 1 1/3 NH41 1 2/3 H13 1/2 Mn21
1 1/6 N21 H20 and 1/2 Mn21 1 1/2 H20 1 1/4 O2
3 1/2 MnO2 1 H1 (5)
MnOOH1 1/3 NH41 1 5/3 H13 Mn21 1 1/6 N2
1 2H20 and Mn21 1 3/2 H2O 1 1/4 O2
3 MnOOH1 2H1 (6)
Fig. 6.Dlog K vs. pH plots for selected reactions oxidizing I(2I) toI2. Dlog K is the total free energy at a given pH. PositiveDlog Kindicates a thermodynamically favorable reaction.
2760 P. Anschutz et al.
This is less than half the oxygen requirement for the con-version of ammonia to nitrate, and would leave more oxygenavailable for other reactions. Finally, it has recently been dem-onstrated that ammonia can be oxidized by MnO2 to nitrate aswell (Hulth et al., 1999). Thus, there are several processes thatcan potentially intercept the ammonia flux from the sediment.Their relative importance remains to be worked out.
4.2.4. The reduction of manganese oxides within the anoxicsediment
In each of the three cores we observed a layer with highconcentrations of nitrate deep within the anaerobic sediment.At St. 23B the nitrate concentration at 8 cm depth reached 50mM. These concentrations are much higher than in the overly-ing bottom water, and we can therefore exclude the possibilitythat the high nitrate values are due to the infiltration of bottomwater through animal burrows. It is conceivable that the nitratemaximum was caused by the oxidation of ammonia with oxy-gen, diffusing into the sediment through the walls of irrigatedburrows (Aller, 1980), but the presence of high concentrationsof Mn(II) at the same depth would argue against it. An inter-esting alternative, which does not require bioirrigation, is theoxidation of ammonia or organic-N by Mn(III) or Mn(IV).Hulth et al. (1999) have recently provided experimental evi-dence for anaerobic nitrate production through the oxidation ofammonia by MnO2, and Aller et al., (1998) invoked the fol-lowing pathways to explain the persistence of NO3
2 at depth inPanama Basin sediments:
1/2 MnO2 1 1/8 NH41 1 3/4 H1N 1/2 Mn21
1 1/8 NO32 1 5/8 H20 (7)
MnOOH1 1/8 NH41 1 7/4 H1N Mn21 1 1/8 NO3
2
1 13/8 H20 (8)
The coincidence of the nitrate maximum with the Mn(II)maximum observed in our cores is consistent with this mech-anism.
Hulth et al. (1999) estimated that Reaction 7 was energeti-cally possible under typical sedimentary conditions. We cancalculate the reaction quotients or ionic activity products (IAP)of Reactions 7: (Mn21)1/2(NO3
2)1/8/(H1)3/4(NH41)1/8, where (i)
refer to activities, and 8: (Mn21)(NO32)1/8/(H1)7/4(NH4
1)1/8 byusing the measured pore–water concentrations at the depth ofthe subsurface nitrate maximum and estimates of the activitycoefficients of Mn(II), NO3
2, and NH41 in seawater (Johnson,
1982; Klinkhammer, 1980; Millero and Pierrot, 1998). For St.23, 23A, and 23B the calculated IAP(7) values are close to103.0 at pH 7 and 103.7 at pH 8, and IAP(8) values are close to107.8 at pH 7 and 109.5 at pH 8. These values are far below theequilibrium constant (K°) for Reactions 7 and 8, which arederived by using, respectively, pyrolusite (b-MnO2, K°(7) 5105.84) and manganite (g-MnOOH, K°(8) 5 1010.39) or feit-knechtite (b-MnOOH, K°(8)5 1012.84) as possible Mn(IV andIII) oxide minerals in St. Lawrence Estuary sediments (Hemand Lind, 1983). The large difference between K° values andIAPs means that NH4
1 is metastable in the presence of manga-nese oxides whereas Mn(II) and NO3
2 can accumulate in pore
water at the concentration levels we measured and beyond.Therefore, the anaerobic production of nitrate through Reac-tions 7 or 8 is highly favored in the studied sediments wheneverMn(III,IV) enriched particles are biotransported into the anaer-obic ammonia-rich zone.
4.3. The Role of Iron in the Diagenesis of Iodine andNitrogen Species
4.3.1. Reactions involving Fe(III)
The sediment surface layer is also enriched in oxidized ironas inferred from the ascorbate leachable fraction. The oxidationof ammonia to N2 by amorphous Fe(III) is only thermodynam-ically feasible at pH, 6.8 (Luther et al., 1997) and is thereforenot likely to be involved in the removal of ammonia in theaerobic zone near the sediment–water interface. Oxidized ironcan of course be transported downward into the anoxic sedi-ment by advection and mixing but, as we will now show, theanaerobic oxidation of ammonia to nitrate by Fe(III) is un-likely. Applying the same reasoning as we did for manganeseoxides above, ammonia would be oxidized by Fe(III) accordingto:
Fe(OH)3 1 1/8 NH41 1 7/4 H1N Fe21 1 1/8 NO3
2
1 21/8 H20 (9)
The equilibrium constant for this reaction, K°(9), is 103.09at25°C by using ferrihydrite as Fe(III) phase. Reaction 9 onlybecomes favorable when IAP(9), K°(9), i.e., when (Fe21) isbelow 10210.7 at pH 8 or below 1029 at pH 7. The activitycoefficient for Fe21 used here is that given by Millero (1982).Thus, nitrate production and accumulation in pore waters viaReaction 9 can only occur under conditions where dissolvedFe(II) remains at very low concentrations. In anaerobic non-sulfidic pore waters where Fe(II) is abundant, Reaction 9 is,therefore, less likely than Reactions 7 or 8.
4.3.2. Reactions involving Fe(II)
The upward flux of dissolved Fe(II) is intercepted at depthswhere nitrate is abundant and oxygen is absent. The oxidationof Fe(II) by nitrate is possible, and the reduction of nitrate to N2
by Fe(II) is thermodynamically favorable at all pH (Luther etal., 1997). The oxidation of Fe(II) by nitrate has been observedto take place (Hansen et al., 1994; Postma, 1990) and thereaction can be mediated by nitrate-reducing bacteria (Straub etal., 1996). The most favorable product is green rust (Fe(II)–Fe(III) hydroxide–sulfate). Green rust can be oxidized furtherby nitrate to goethite (Hansen and Bender Koch, 1998). In ourcores, the appearance of Fe(II) was accompanied by a broadpeak at20.4 V in the voltammagram, consistent with thepresence of colloidal Fe(III) or dissolved Fe(III) complexes(Brendel, 1995; Huettel et al., 1998).
5. CONCLUSION
A multitude of redox reactions are possible during the earlydiagenesis of sediment, but their relative importance varies intime and space. For example, oxygen was not the major oxidantfor the upward diffusing Mn(II) at the time our cores were
2761Bioturbated marine sediments
collected, yet the location of the solid-phase manganese peaknear the oxic sediment–water interface points to oxygen as theultimate oxidant for Mn(II). Vertical distributions of redoxspecies in bioturbated sediments are often transient and not atsteady state.
High-resolution profiles of redox species suggest the exis-tence of reactions not usually considered in diagenetic studies.The many possibilities include the production of N2 in reac-tions between ammonia and manganese oxides in the presenceof oxygen, and between nitrate and iodide or Fe(II). Thesereactions would contribute to the observed high rates of N2
production in continental margin sediments, complementingbacterial nitrification/denitrification. The possible reactionsalso include the anaerobic production of nitrate from ammoniaand manganese oxides and the production of iodine via nitrateoxidation of iodide.
The high-resolution data show that iodine species can bequantitatively important in the diagenesis of manganese, de-spite the large concentration ratio between total Mn and total Iin surface sediment. The data also show that significant re-moval of iodine is taking place below the iodide maximum.This is most likely due to the production of an oxidized iodinespecies, which in turn can react with the solid phase. Nitrate isan interesting candidate as the oxidant, because the reactionwith I(2I) could yield N2 and I2. This possibility is intriguingnot only because it would promote denitrification, but alsobecause I2 is highly reactive and could react further withorganic matter. This reaction would close the cycle whereby theiodine that is delivered to the sediment in association withorganic matter is released to the pore water via hydrolysis,oxidized to a more reactive species, and finally recombinedwith organic matter and buried.
Many of the reactions and pathways discussed here needexperimental confirmation and further field observation, but theimportant point is that a multitude of reactions are possible andthat their relative importance will vary over time. The paradigmthat the electron acceptor that yields the highest amount of freeenergy is used preferentially in the terminal step of the bacte-rially mediated oxidation of organic matter is not violated inbioturbated sediments, but the time sequence of redox reactionsthat follows from the paradigm does not always translate to asimilarly recognizable depth sequence. Diagenesis in sedimentsaffected by bioturbation and other physical disturbances shouldbe thought of as a process that, through a mosaic of redoxreactions, tends to but not always reaches a steady state.
Acknowledgments—Financial support from the Natural Science andEngineering Council of Canada to B.S. and A.M., and from the U.S.National Oceanic and Atmospheric Administration, Office of Sea Grant(NA16RG0162 to 03) to G.W.L. are gratefully acknowledged. Wethank the editorial reviewers whose comments inspired us to improveour manuscript.
REFERENCES
Aller R. C. (1980) Quantifying solute distributions in the bioturbatedzone of marine sediments by defining an average microenvironment.Geochim. Cosmochim. Acta44, 1955–1965.
Aller R. C. (1990) Bioturbation and manganese cycling in hemipelagicsediments.Phil. Trans. R. Soc. Lond.A 331, 51–68.
Aller R. C. (1994a) Bioturbation and remineralization of sedimentaryorganic matter: Effects of redox oscillation.Chem. Geol.114,331–345.
Aller R. C. (1994b) The sedimentary Mn cycle in Long Island Sound:Its role as intermediate oxidant and the influence of bioturbation, O2,and Corg flux on diagenetic reaction balances.J. Mar. Res.52,259–295.
Aller R. C., Hall P. O. J., Rude P. D., and Aller J. Y. (1998) Biogeo-chemical heterogeneity and suboxic diagenesis in hemipelagic sed-iments of the Panama Basin.Deep-Sea Res. I45, 133–165.
Aller R. C. and Rude P. D. (1988) Complete oxidation of solid phasesulfides by manganese and bacteria in anoxic marine sediments.Geochim. Cosmochim. Acta52, 751–765.
Anderson L. (1979) Simultaneous spectrophotometric determination ofnitrite and nitrate by flow injection analysis.Anal. Chim. Acta110,123–128.
Anschutz P., Zhong S., Sundby B., Mucci A., and Gobeil C. (1998)Burial efficiency of phosphorus and the geochemistry of iron incontinental margin sediments.Limnol. Oceanogr.43, 53–64.
Arakaki T. and Morse J. W. (1993) Coprecipitation and adsorption ofMn21 with mackinawite (FeS) under conditions similar to thosefound in anoxic sediments.Geochim. Cosmochim. Acta57, 1–15.
Berner R. A. (1980)Early Diagenesis. A Theoretical Approach.Prince-ton Univ. Press.
Boudreau B. P. (1996) The diffusive tortuosity of fine-grained unlithi-fied sediments.Geochim. Cosmochim. Acta60, 3139–3142.
Brendel P. J. (1995) Development of a mercury thin film voltammetricmicroelectrode for the determination of biogeochemically importantredox species in porewaters of marine and freshwater sediments.Ph.D. Thesis, Univ. Delaware.
Brendel P. J. and Luther G. W. III. (1995) Development of a goldamalgam voltammetric microelectrode for the determination of dis-solved Fe, Mn, O2, and S(2II) in porewaters of marine and fresh-water sediments.Environ. Sci. Technol.29, 751–761.
Burdige D. J. and Gieskes J. M. (1983) A porewater/solid phasediagenetic model for manganese in marine sediments.Am. J. Sci.283,29–47.
Edenborn H. M., Mucci A., Silverberg N., and Sundby B. (1987)Sulfate reduction in deep coastal marine sediments.Mar. Chem.21,329–345.
Ferdelman T. G. (1988) The distribution of sulfur, iron, manganese,copper and uranium in salt marsh sediment cores as determined bysequential extraction methods. M.Sc. Thesis, Univ. Delaware.
Francois R. (1987) The influence of humic substances on the geochem-istry of iodine in nearshore and hemipelagic marine sediments.Geochim. Cosmochim. Acta51, 2417–2427.
Frette L., Gejlsbjerg B., and Westermann P. (1997) Aerobic denitrifiersisolated from an alternating activated sludge system.FEMS Micro-biol. Ecol. 24, 363–370.
Froelich P. N., Klinkhammer G. P., Bender M. L., Luedtke N. A.,Heath G. R., Cullen D., Dauphin P., Hammond D., Hartman B., andMaynard V. (1979) Early oxidation of organic matter in pelagicsediments of the eastern equatorial Atlantic: Suboxic diagenesis.Geochim. Cosmochim. Acta43, 1075–1090.
Gagnon C., Mucci A., and Pelletier E. (1995) Anomalous accumulationof acid–volatile sulphides (AVS) in a coastal marine sediment,Saguenay Fjord, Canada.Geochim. Cosmochim. Acta59, 2663–2675.
Gobeil C., Macdonald R. W., and Sundby B. (1997) Diagenetic sepa-ration of cadmium and manganese in suboxic continental marginsediments.Geochim. Cosmochim. Acta61, 4647–4645.
Hall P. O. J. and Aller R. C. (1992) Rapid, small-volume flow injectionanalysis forSCO2 and NH4
1 in marine and freshwaters.Limnol.Oceanogr.37, 1113–1119.
Hall P., Anderson L., Rutgers van der Loeff M., Sundby B., andWesterlund S. (1989) Oxygen uptake kinetics at the sediment–waterinterface.Limnol. Oceanogr.34, 734–746.
Hansen H. C. B. and Bender Koch C. (1998) Reduction of nitrate toammonium by suphate green rust: Activation energy and reactionmechanism.Clay Miner.33, 87–101.
Hansen H. C. B., Borggaard O. K, and Sorensen J. (1994) Evaluationof the free energy of formation of Fe(II)–Fe(III) hydroxide–sulphate(green rust) and its reduction of nitrite.Geochim. Cosmochim. Acta58, 2599–2608.
Hem J. D., and Lind C. J. (1983) Nonequilibrium models for predicting
2762 P. Anschutz et al.
forms of precipitated manganese oxides.Geochim. Cosmochim. Acta47, 2037–2046.
Huerta–Diaz M. A. and Morse J. W. (1990) A quantitative method fordetermination of trace metal concentrations in sedimentary pyrite.Mar. Chem.29, 119–144.
Huerta–Diaz M. A. and Morse J. W. (1992) Pyritization of trace metalsin anoxic marine sediments.Geochim. Cosmochim. Acta56, 2681–2702.
Huettel M., Ziebis W., Forster S., and Luther G. W. III (1998) Advec-tive transport affecting metal and nutrient distributions and interfa-cial fluxes in permeable sediments.Geochim. Cosmochim. Acta62,613–631.
Hulth S., Blackburn T. H., and Hall P. O. J. (1994) Arctic sediments(Svalbard): consumption and microdistribution of oxygen.Mar.Chem.46, 293–316.
Hulth S., Aller R. C., and Gilbert F. (1999) Coupled anoxic nitrifica-tion/manganese reduction in marine sediments.Geochim. Cosmo-chim. Acta63, 49–66.
Johnson K. S. (1982) Solubility of rhodochrosite (MnCO3) in water andseawater.Geochim. Cosmochim. Acta46, 1805–1809.
Kennedy H. A. and Elderfield H. (1987) Iodine diagenesis in pelagicdeep-sea sediments.Geochim. Cosmochim. Acta51, 2489–2504.
Klinkhammer G. P. (1980) Early diagenesis in sediments from theeastern equatorial Pacific. II. Pore water metal results.Earth Planet.Sci. Lett.7, 265–270.
Kostka J. E. and Luther G. W. III (1994) Partitioning and speciation ofsolid phase iron in saltmarsh sediments.Geochim. Cosmochim. Acta58, 1701–1710.
Li Y. H. and Gregory S. (1974) Diffusion of ions in sea water and indeep-sea sediments.Geochim. Cosmochim. Acta38, 703–714.
Lloyd D., Boddy L., and Davies K. J. P. (1987) Persistence of bacterialdenitrification capacity under aerobic conditions: The rule ratherthan the exception.FEMS Microbiol. Ecol.45, 185–190.
Luther G. W. III, Branson Swartz C., and Ullman W. J. (1988) Directdetermination of iodide in seawater by cathodic stripping squarewave voltametry.Anal. Chem.60, 1721–1724.
Luther G. W. III, Brendel P. J., Lewis B. L., Sundby B., Lefrancois L.,Silverberg N., and Nuzzio D. (1998) Oxygen, manganese, iron,iodide, and sulfide distributions in pore waters of marine sedimentsmeasured simultaneously with a solid state voltammetric microelec-trode.Limnol. Oceanogr.43, 325–333.
Luther G. W. III, Sundby B., Lewis G. L., Brendel P. J., and SilverbergN. (1997) Interactions of manganese with the nitrogen cycle: Alter-native pathways for dinitrogen formation.Geochim. Cosmochim.Acta 61, 4043–4052.
Luther G. W. III, Reimers C. E., Nuzzio D. B., and Lovalvo D. (1999)In situ deployment of voltammetric, potentiometric, and amperomet-ric microelectrodes from ROV to determine dissolved O2, Mn, Fe,S(22), and pH in porewaters.Environ. Sci. Technol.33,4352–4356.
Middelburg J. J., De Lange G. J., and Van der Weijden C. H. (1987)Manganese solubility control in marine pore waters.Geochim. Cos-mochim. Acta51, 759–763.
Millero F. J. (1982) Use of models to determine ionic interactions innatural waters.Thallasia Jugoslavia18, 253–291.
Millero F. J. and Pierrot D. (1998) A chemical equilibrium model fornatural waters.Aquatic Geochem4, 153–199.
Mucci A. (submitted) The solubility of pseudokutnahorite, Mn-Ca(CO3)2, in water and seawater: Control of manganese concentra-tion in marine porewaters.Geochim. Cosmochim. Acta.
Murray J. W., Codispoti L. A., and Friederich G. E. (1995) Oxidation–reduction environments: The suboxic zone of the Black Sea. InAquatic Chemistry: Interfacial and Interspecies Processes(ed. C. P.Huang et al.), Vol. 244, pp. 157–176. Am. Chem. Soc.
Postma D. (1990) Kinetics of nitrate reduction by detrital Fe(II)-silicates.Geochim. Cosmochim. Acta54, 903–908.
Postma D. and Jakobsen R. (1996) Redox zonation: Equilibrium con-
strains on the Fe(III)/SO4-reduction interface.Geochim. Cosmochim.Acta 60, 3169–3175.
Raiswell R., Canfield D. E., and Berner R. A. (1994) A comparison ofiron extraction methods for the determination of degree of pyritisa-tion and the recognition of iron-limited pyrite formation.Chem.Geol.111,101–110.
Rapin F., Tessier A., Campbell P. G. C., and Richard R. (1986)Potential artifacts in the determination of metal partitioning in sed-iments by a sequential extraction procedure.Environ. Sci. Technol.20, 836–840.
Robertson L. A., Cornelisse R., de Vos P., Hadioetomo R., and KuenenJ. G. (1989) Aerobic denitrification in various heterotrophic nitrifi-ers.Antonie van Leeuwenhoek56, 289–299.
Schulz H. D., Dahmke A., Schnizel U., Wallmann K., and Zabel M.(1994) Early diagenetic processes, fluxes, and reaction rates insediments of the South Atlantic.Geochim. Cosmochim. Acta58,2041–2060.
Shimmield G. B. and Pedersen T. F. (1990) The geochemistry ofreactive trace metals and halogens in hemipelagic continental marginsediments.Aquat. Sci.3, 255–279.
Silverberg N., Bakker J., Edenborn H., and Sundby B. (1987) Oxygenprofiles and organic carbon fluxes in Laurentian Trough sediments.Neth. J. Sea Res.21, 95–105.
Silverberg N., Nguyen H. V., Delibrias G., Koide M., Sundby B.,Yokoyama Y., and Chesselet R. (1986) Radionuclide profiles, sed-imentation rates, and bioturbation in modern sediments of the Lau-rentian Trough, Gulf of St.Lawrence. Oceanol. Acta9, 285–290.
Silverberg N. and Sundby B. (1990) Early diagenesis and sediment–water interaction in the Laurentian Trough. InOceanography of aLarge-Scale Estuarine System: The St. Lawrence(eds. M. I. El-Sabhand N. Silverberg), Vol. 39, pp. 202–238. Springer–Verlag.
Sørensen J., Jørgensen K. S., Colley S., Hydes D. J., Thomson J., andWilson T. R. S. (1987) Depth localization of denitrification in adeep-sea sediment from the Madeira Abyssal Plain.Limnol. Ocean-ogr. 32, 758–762.
Straub K. L., Benz M., Schink B., and Widdel F. (1996) Anaerobic,nitrate-dependant microbial oxidation of ferrous iron.Appl. Environ.Microbiol. 62, 1458–1460.
Stumm W. and Morgan J. J. (1996)Aquatic Chemistry, 3rd ed.JohnWiley & Sons.
Sundby B., Silverberg N., and Chesselet R. (1981) Pathways of man-ganese in an open estuarine system.Geochim. Cosmochim. Acta45,293–307.
Taillefert M., Bono A., and Luther G. W. III (2000) Reactivity offreshly formed Fe(III) in synthetic solutions and porewaters: Voltam-metric evidence of an aging process.Environ. Sci. Technol.(inpress).
Takayanagi K. and Cossa D. (1985) Behaviour of dissolved iodine inthe upper St. Lawrence Estuary.Can. J. Earth Sci.22, 644–646.
Truesdale V. W. (1982) The fate of molecular iodine added to seawater.Mar. Chem.11, 87.
Ullman W. J. and Aller R. C. (1983) Rates of iodine remineralizationin terrigeneous near-shore sediments.Geochim. Cosmochim. Acta47, 1423–1432.
Ullman W. J. and Aller R. C. (1985) The geochemistry of iodine innear-shore carbonate sediments.Geochim. Cosmochim. Acta49,967–978.
Ullman W. J. and Sandstrom M. W. (1987) Dissolved nutrient fluxesfrom the nearshore sediments of Bowling Green Bay, Central GreatBarrier Reef Lagoon (Australia).Estuar. Coast. Shelf Sci.24, 289–303.
Van Duyl F. C., Van Raaphorst W., and Kop A. J. (1993) Benthicbacterial production and nutrient sediment–water exchange in sandyNorth Sea sediments.Mar. Ecol. Progr. Ser.100,85–95.
Yeats P. A. (1988) Nutrients. InChem. Oceanography in the Gulf of St.Lawrence(ed. P. M. Strain),Can. Bull. Fish. Aquat. Sci.220, l.
2763Bioturbated marine sediments


