
Instantaneous Project Controls:
Current Status, State of the Art, Benefits, and Strategies
by
Amin Abbaszadegan
A Dissertation Presented in Partial Fulfillment
of the Requirements for the Degree
Doctor of Philosophy
Approved April 2016 by the
Graduate Supervisory Committee:
David Grau Torrent, Chair
Mounir El Asmar
G. Edward Gibson, Jr.
ARIZONA STATE UNIVERSITY
May 2016
i
ABSTRACT
Despite advancements in construction and construction-related technology, capital
project performance deviations, typically overruns, remain endemic within the capital
projects industry. Currently, management is generally unaware of the current status of
their projects, and thus monitoring and control of projects are not achieved effectively. In
an ever-increasing competitive industry landscape, the need to deliver projects within
technical, budgetary, and schedule requirements becomes imperative to sustain a healthy
return on investment for the project stakeholders. The fact that information lags within
the capital projects industry has motivated this research to find practices and solutions
that facilitate Instantaneous Project Controls (IPC).
The author hypothesized that there are specific practices that, if properly
implemented, can lead to instantaneous controls of capital projects. It is also
hypothesized that instantaneous project controls pose benefits to project performance.
This research aims to find practices and identify benefits and barriers to achieving a real-
time mode of control. To achieve these objectives, several lines of inquiry had to be
pursued. A panel of 13 industry professionals and three academics collaborated on this
research project. Two surveys were completed to map the current state of project control
practices and to identify state-of-the-art or ideal processes. Ten case studies were
conducted within and outside of the capital projects industry to identify practices for
achieving real-time project controls. Also, statistical analyses were completed on
retrospective data for completed capital projects in order to quantify the benefits of IPC.
In conclusion, this research presents a framework for implementing IPC across the capital

ii
projects industry. The ultimate output from this research is procedures and
recommendations that improve project controls processes.

iii
ACKNOWLEDGMENTS
I would like to thank my parents who have inspired me to get to where I am today.
Their moral support has provided strength along the way.
I would like to thank Dr. David Grau for his guidance, advice, and encouragement
throughout the period of this research study. His support throughout the highs and lows
of the research period has been inspiring. Without his vision this research would not have
been possible.
Also, I would like to thank the research team participants for their expert input and
continuing support during this research project—specifically Doug Weaver and Robert
Lobron among many others.
Finally, I would also like to thank my advisor, the Construction Industry Institute,
and my parents for their financial support. Together they have made this a painless
experience financially.
iv
TABLE OF CONTENTS
Page
LIST OF TABLES .............................................................................................................. x
LIST OF FIGURES ......................................................................................................... xvi
CHAPTER
1: INTRODUCTION .......................................................................................................... 1
1.1 Lack of Adequate Reporting Capabilities ........................................................ 7
1.2 Information and Sensing Technologies ............................................................ 9
1.2.1 Data Collection .......................................................................................... 9
1.2.2 Information Integration ........................................................................... 10
1.2.3 Automated Analytics and Reporting ....................................................... 11
1.3 Proposed Departure / Gap Of Knowledge ..................................................... 12
1.4 Structure of Dissertation ................................................................................ 14
2: HYPOTHESES AND RESEARCH OBJECTIVES ..................................................... 16
3: BACKGROUND .......................................................................................................... 18
3.1 Endemic Cost and Schedule Deviations ........................................................ 19
3.2 Lack of Predictability ..................................................................................... 20
3.3 Lack of Timely and Informed Decision-Making Support ............................. 22
3.4 State of Knowledge ........................................................................................ 25
3.4.1 Limited Approach to Controls ................................................................. 27
3.4.2 Availability of Sensing and Information Technologies for Instantaneous
x Controls ................................................................................................... 29
3.5 Advanced Technologies and Project Performance ........................................ 32
v
CHAPTER Page
4: RESEARCH METHODOLOGY. ................................................................................ 38
4.1 Overview ........................................................................................................ 38
4.2 Literature Review ........................................................................................... 40
4.3 Research Charrettes ........................................................................................ 40
4.4 Surveys ........................................................................................................... 41
4.5 Multiple Case Study Research ....................................................................... 42
4.6 Statisitcal Analysis ......................................................................................... 43
5: CURRENT STATE OF KNOWLEDGE ...................................................................... 45
5.1 Survey 1—Batch Mode Survey ..................................................................... 45
5.2 Design ............................................................................................................ 45
5.3 Data Collection .............................................................................................. 51
5.4 Project Information Systems .......................................................................... 56
5.4.1 Building Information Modeling (BIM) ................................................... 61
5.4.2 Enterprise Resource Planning (ERP) ...................................................... 62
5.4.3 Scheduling ............................................................................................... 63
5.4.4 Cost Estimation ....................................................................................... 64
5.4.5 Accounting .............................................................................................. 65
5.4.6 Change Management ............................................................................... 66
5.4.7 Progress Tracking .................................................................................... 67
5.4.8 Procurement ............................................................................................. 68
5.4.9 Document Management........................................................................... 70
5.4.10 Integration of Information Systems ....................................................... 71
vi
CHAPTER Page
5.5 Reporting Frequencies .................................................................................... 72
6: IMPLEMENTATION STRATEGIES FOR INSTANTANEOUS PROJECT
CONTROLS ..................................................................................................................... 91
6.1 Design/Prequalification .................................................................................. 91
6.2 Interviews/Data Collection............................................................................. 93
6.3 Insights ........................................................................................................... 95
6.3.1 A Lean Perspective .................................................................................. 95
6.3.2 Monitoring Construction Versus Controlling Projects ............................ 96
6.3.3 Proportional Scope and Implementation Effort ....................................... 97
6.4 Case Studies ................................................................................................... 98
6.4.1 Case Study 1: Daily Reporting of Project Cost, Procurement, and Change
xx Management/Updated Portfolio Financials ............................................. 99
6.4.2 Case Study 2: Daily Project Cost and Schedule Updates ........................ 99
6.4.3 Case Study 3: Automated Payment Tranactions ................................... 100
6.4.4 Case Study 4: Seamless Integration and Instantaneous Sharing of Project
xx Information ............................................................................................ 101
6.4.5 Case Study 5: Real-Time Manufacturing Monitoring and Status ......... 102
6.4.6 Case Study 6: Daily Craft Labor Progress Monitoring for Workflow
xxxx Stabilization ........................................................................................... 103
6.4.7 Case Study 7: Daily Cost and Schedule Report for Pipeline Infrastructure
xx Projects .................................................................................................. 103
6.4.8 Case Study 8: Seamless Integration of Project Information .................. 104
vii
CHAPTER Page
6.4.9 Case Study 9: Advanced Model-Based Analytics for Capacity Decisions
xxxxxxxxx ............................................................................................................... 105
6.4.10 Case Study 10 (i): Daily Cost and Schedule Progress Report ............. 106
6.4.11 Case Study 10 (ii): Instantaneous Design Engineering Progress Report
xxxxxxxxxx ............................................................................................................. 106
6.5 Instantaneous Controls Practices ................................................................. 107
6.5.1 Culture ................................................................................................... 108
6.5.2 Leadership ............................................................................................. 109
6.5.3 Contracting ............................................................................................ 109
6.5.4 Work Planning ....................................................................................... 110
6.5.5 Data Collection ...................................................................................... 111
6.5.6 Reporting ............................................................................................... 111
6.5.7 Information Integration ......................................................................... 112
6.5.8 Workflow Management ......................................................................... 112
6.5.9 Business Intelligence ............................................................................. 113
6.6 Validation ..................................................................................................... 113
6.6.1 Implementation Study A—Consolidated Organizational Behavior ...... 114
6.6.2 Implementation Study B—A Sequential Adoption of Strategies .......... 115
6.6.3 Implementation Study C—Software Alone Was Not the Solution: Two
xxxxxxxx Failed Efforts ......................................................................................... 116
viii
CHAPTER Page
7: BENEFITS OF INSTANTANEOUS PROJECT CONTROLS ................................ 118
7.1 Survey 2—Instantaneous Control Survey .................................................... 119
7.1.1 Design .................................................................................................... 119
7.1.2 Data Collection ...................................................................................... 119
7.1.3 Barriers And Catalysts ........................................................................... 123
7.2 CII BM&M Questionnaire ........................................................................... 128
7.3 Automation and Integration Use Level ........................................................ 132
7.4 Automation and Integration (A/I) Index ...................................................... 134
7.5 IT Use ........................................................................................................... 135
7.6 Impact of Information Integration and Automated Analytics on Project
xxxxPerformance Outcomes ............................................................................... 138
7.7 Impact Of Information Integration And Automated Analytics On
xxxConstruction Performance Outcome ............................................................ 144
7.8 Benchmarking of Mature Projects in Terms of Information Integration and
xx Automated Analytics .................................................................................... 146
7.9 IT Use Over Time ........................................................................................ 147
7.10 Discussion of Results ................................................................................. 149
8: INTELLECTUAL MERIT AND IMPACT ............................................................... 152
9: CONCLUSIONS ........................................................................................................ 154
9.1 Future Studies .............................................................................................. 156
9.2 Contributors ................................................................................................. 157
REFERENCES ............................................................................................................... 158

ix
APPENDIX Page
I: SURVEY 1—BATCH MODE SURVEY ................................................................... 169
II: SURVEY 2—INSTANTANEOUS PROJECT CONTROLS SURVEY .................. 200
III: PRE-INTERVIEW EMAIL TO COMPANIES ....................................................... 209
x
LIST OF TABLES
Table Page
1: Project Control Functions—Engineering Design Phase ............................................... 47
2: Project Control Functions—Procurement Phase .......................................................... 48
3: Project Control Functions—Construction Phase .......................................................... 49
4: Project Control Functions—Commissioning and Startup Phase .................................. 50
5: Projects’ Distribution by Public and Private Sectors (%) (Question 8). ....................... 51
6: Projects’ Distribution by Nature of the Project (%) (Question 16). ............................. 52
7: Projects’ Distribution by General Industrial Sectors (%) (Question 11). ..................... 52
8: Projects’ Distribution by Third-Party Finance Sources (%) (Question 9). ................... 52
9: Projects’ Distribution by Project Delivery Method (%) (Question 26). ....................... 52
10: Projects’ Distribution by Type of Contract Used in Projects (%) (Question 27). ...... 53
11: Projects’ Distribution by New Geographic Location or Region? (%) (Question 10). 53
12: Projects’ Distribution by Geographic Region/Location (%) (Question 25). .............. 53
13: Projects’ Distribution by Structure of Project Control Offices (%) (Question 35). ... 53
14: Distribution of Functions Procured During Execution of Projects (%) xxxx
xxx(Question 28). ............................................................................................................. 54
15: Distribution of New Technology Use in Projects (%) (Question 30). ........................ 54
16: Distribution of Level of Familiarity with the New Technology or Process Used
xxxDuring Design and Execution Phases of the Project (%) (Question 31). ................... 54
17: Organization of Teams Involved in the Project Controls (%) (Question 32). ............ 54
18: Statistics on the Hierarchy Levels of Controllers Involved in Controlling the Projects
xx (Question 33). ............................................................................................................. 55
xi
Table Page
19: Statistics on Various Internal or External Sequential Reporting Functions Reporting
xx Lines for Project Controllers (Question 34)................................................................ 55
20: Projects’ Distribution by Weekly Workload (%) (Question 29). ............................... 56
21: Projects’ Distribution by Number of Equivalent Full-Time Employees (FTE)
xxxInvolved in Project Control (%) (Question 36)........................................................... 56
22: Projects’ Distribution by Number of Equivalent Full-Time Employees (FTE)
xxxInvolved in Project Control (%) (Question 36) (Continued) ...................................... 56
23: Composition of Information Technology Tools (Question 38) .................................. 58
24: Response Rate for Software Utilization (Count and Percentage of Responses)......... 59
25: Level of Customization for Software Packages (% of Responses) for All Projects,
Owner and Contractor Submitted Projects (Question 38). ............................................... 60
26: Building Information Modeling Software Used by Survey Respondents (n=7) ........ 62
27: Respondents’ Opinions on BIM Software Customization (by % of Responses)
xxx(n=6) ............................................................................................................................ 62
28: Enterprise Resource Planning Software Used by Survey Respondents (n=10) ......... 63
29: Respondents’ Opinions on ERP Software Customization (by % of Responses)
xxx(n=9) ............................................................................................................................ 63
30: Scheduling Software Used by Survey Respondents (n=33) ....................................... 64
31: Respondents’ Opinions on Scheduling Software Customization (by % of Responses)
xxx(n=29) .......................................................................................................................... 64
32: Cost Estimation Software Used by Survey Respondents (n=23) ............................... 65
xii
Table Page
33: Respondents’ Opinions on Cost Estimating Software Customization (by % of
xxxResponses) (n=21) ...................................................................................................... 65
34: Accounting Software Used by Survey Respondents (n=34). ..................................... 66
35: Respondents’ Opinions on Accounting Software Customization (by % of Responses)
xxx(n=32) .......................................................................................................................... 66
36: Change Management Software Used by Survey Respondents (n=25). ...................... 67
37: Respondents’ Opinions on Change Management Software Customization (by % of
xxxResponses) (n=23). ..................................................................................................... 67
38: Progress Tracking Software Used by Survey Respondents (n=22). ........................... 68
39: Respondents’ Opinions on Progress Tracking Software Customization (by % of
Responses) (n=21). ........................................................................................................... 68
40: Procurement Management Software Used by Survey Respondents (n=20). .............. 69
41: Respondents’ Opinions on Procurement Management Software Customization (by %
x of Responses) (n=20). ................................................................................................. 69
42: Document Management Software Used by Survey Respondents (n=25)................... 70
43: Respondents’ Opinions on Document Management Software Customization (by % of
xxxResponses) (n=25). ..................................................................................................... 70
44: Median Reporting Frequencies for the Engineering Phase in Days (All Projects)
xxx(Questions 47 to 55) .................................................................................................... 75
45: Median Reporting Frequencies for the Procurement Phase in Days (All Projects)
xxx(Questions 57 to 68) .................................................................................................... 79
xiii
Table Page
46: Median Reporting Frequencies for the Construction Phase in Days (All Projects)
xxx(Questions 70 to 81) .................................................................................................... 83
47: Median Reporting Frequencies for the Commissioning and Startup Phase in Days (All
xxxProjects) (Questions 83 to 94)..................................................................................... 87
48: Interview Protocol....................................................................................................... 92
49: Summary of Case Studies ........................................................................................... 94
50: Categories and Strategies for Instantaneous Project Control Implementation ......... 108
51: General Industry Sector (Question 8). ...................................................................... 120
52: Project Contracting Methods (Question 14). ............................................................ 120
53: Project Delivery Methods (Question 15). ................................................................. 121
54: Project Geographic Location (Question 18). ............................................................ 121
55: Project Range of Installed Cost (Question 19). ........................................................ 121
56: Number of Full-Time Employees that Control the Project (question 20). .............. 122
57: Project Controls Office Structure (Question 21). ..................................................... 122
58: Any Functions with Instantaneous Data Collection? (Question 26)*....................... 122
59: Any Functions with Instantaneous Reporting? (Question 27)* ................................ 123
60: Phases with Instantaneous Function (Question 29). ................................................. 123
61: Barriers to Instantaneous Project Controls (Question 47). ....................................... 124
62: Project-Related Benefits of Instantaneous Project Controls (Question 48). ............. 125
63: Potential Positive Impact on Cost Performance from IPC Functions (Question 49).126
64: Potential Positive Impact on Schedule Performance from IPC Functions
xxxx(Question 50). ......................................................................................................... 126
xiv
Table Page
65: Potential Positive Impact on Quality Performance from IPC Functions x
xxx(Question 51). ........................................................................................................... 127
66: Potential Positive Impact on Scope Performance from IPC Functions xx
xxx(Question 52). ........................................................................................................... 128
67: Project Mix ............................................................................................................... 130
68: Projects’ Distribution by Project Country (%) ......................................................... 130
69: Project’ Distribution by Project Industry Group (%)................................................ 131
70: Projects’ Distribution by Project Nature (%) ............................................................ 131
71: Projects’ Distribution by Project Business Driver (%) ............................................. 131
72: Projects’ Distribution by Project Priority (%) .......................................................... 131
73: Projects’ Distribution by Project Cost Category (%)................................................ 131
74: Projects’ Distribution by Project Delivery Method (%) ........................................... 132
75: Contract Type for Engineering Design (%) .............................................................. 132
76: Contract Type for Procurement (%) ......................................................................... 132
77: Contract Type for Construction (%) ......................................................................... 132
78: Contract Type for Commissioning and Startup (%) ................................................. 132
79: Automation Use Level Scores .................................................................................. 133
80: Integration Use Level Scores .................................................................................... 133
81: Phases Used to Measure the Degree of Integration and Automation Technology
xxxUse ............................................................................................................................ 135
82: Percentile Ranking of A/I Index Scores for Project Nature ...................................... 136
83: Percentile Ranking of A/I Index Scores for Industry Sector .................................... 137
xv
Table Page
84: Percentile Ranking of A/I index Scores for Cost Category ...................................... 137
85: Percentile ranking of A/I index scores by Project Phase .......................................... 138
86: Mean Project Performance Outcomes by Project Nature ......................................... 140
87: Mean Project Performance Outcomes by Industry Sector ........................................ 140
88: Mean Project Performance Outcomes by Cost Category ......................................... 141
89: A/I Index Scores Correlation with Mean Project Performance—Owners and
xxxContractors ................................................................................................................ 142
90: A/I Index Scores Correlation with Mean Project Performance—Owners ................ 143
91: Impact of Information Integration and Automated Analytics on Project Performance
xxx................................................................................................................................... 144
92: Distribution of Project Cost Across Phases .............................................................. 145
93: Impact of Information Integration and Automated Analytics on Construction
xxxPerformance .............................................................................................................. 145
94: Benchmark Projects Versus Projects with a High A/I Index—Cost performance ... 146
95: Benchmark Projects Versus Projects with a High A/I Index—Schedule
xxxPerformance .............................................................................................................. 146
96: IT Use Over Time—Owners..................................................................................... 148
97: IT Use with Time—Contractors ............................................................................... 149
xvi
LIST OF FIGURES
Figure Page
1: Project Controls Cycle and Influencing Factors ............................................................. 3
2: Research Methodology ................................................................................................ 39
3: Survey 1 Question 38 on Use of Information Systems ................................................. 57
4: Composition of Information Technology Tools, Numbers Above Each Column
xxRepresent the Number of Systems Used, The Length of Each Colored Box Represents
xxthe Pervasiveness of a Particular Software (Question 38) ............................................ 58
5: Response Rate for Software Utilization (Count and Percentage of Responses) (N=38)
........................................................................................................................................... 59
6: Reporting Lag Across Organizational Functions.......................................................... 73
7: Median Reporting Frequencies for the Engineering Phase In Days (All Projects)
Xx(Questions 47 to 55) ..................................................................................................... 76
8: Median Reporting Frequencies for the Engineering Phase In Days (Owner Projects)
Xx(Questions 47 to 55) ..................................................................................................... 77
9: Median Reporting Frequencies for the Engineering Phase In Days (Contractor
xxProjects) (Questions 47 to 55)....................................................................................... 78
10: Median Reporting Frequencies for the Procurement Phase In Days (All Projects)
Xxx(Questions 57 to 68) ................................................................................................... 80
11: Median Reporting Frequencies for the Procurement Phase In Days (Owner Projects)
Xxx(Questions 57 to 68) ................................................................................................... 81
12: Median Reporting Frequencies for the Procurement Phase In Days (Contractor
Xxxprojects) (Questions 57 to 68) .................................................................................... 82
xvii
Figure Page
13: Median Reporting Frequencies for the Construction Phase In Days (All Projects)
Xxx(Questions 70 to 81) ................................................................................................... 84
14: Median Reporting Frequencies for the Construction Phase In Days (Owner Projects)
Xxx(Questions 70 to 81) ................................................................................................... 85
15: Median Reporting Frequencies for the Construction Phase In Days (Contractor
Xxxprojects) (Questions 70 to 81) .................................................................................... 86
16: Median Reporting Frequencies for the Commissioning and Startup Phase In Days
xxx(All projects) (Questions 83 to 94) ............................................................................. 88
17: Median Reporting Frequencies for the Commissioning and Startup Phase In Days
Xxx(Owner Projects) (Questions 83 to 94) ...................................................................... 89
18: Median Reporting Frequencies for the Commissioning and Startup Phase In Days
Xxx(Contractor Projects) (Questions 83 to 94) ................................................................ 90
19: Potential Positive Impact on Cost Performance from IPC Functions (Question 49).126
20: Potential Positive Impact on Schedule Performance from IPC Functions Xx
Xxx(Question 50)............................................................................................................ 127
21: Potential Positive Impact on Quality Performance from IPC Functions (Question 51).
......................................................................................................................................... 127
22: Potential Positive Impact on Scope Performance from IPC Functions (Question 52).
......................................................................................................................................... 128
1
CHAPTER 1: INTRODUCTION
The monitoring and controlling management process is used to status the work
during project execution and is an integral function within owner and contractor
organizations’ management processes. A reliable and timely reporting of project
information is necessary to ensure informed and effective decisions are made on
individual projects, the portfolio of projects, and the organization. Most of the time,
performance of project metrics such as cost and time are contractually enforced, failing to
meet such contractual requirements may result in negative consequences for all involved
stakeholders.
Even though frequently overlooked for a successful delivery of a project, project
controls is a key function in capital project management. There is no unified definition as
to what project controls is (Michalak, 1992), but usually planning, measuring,
monitoring, analyzing, decision-making, and corrective actions are all part of project
controls (Rozenes, Vitner, & Spraggett, 2006). Various organizations and people have
adopted different definitions and elements for project controls. For instance, the
Department of Defense (2006) suggests that key attributes of effective project controls
are not only the integration of cost, schedule, and progress, but also visible and apparent
management, support timeliness of analysis, focus on significant variances and
developing trends, forecasts based on past performance, multi-functional team approach
to analysis of results, and management focus on developing credible corrective actions.
Although cost and schedule metrics have been historically the main focus of project
controls, the Project Management Institute (PMI) (2008) lists several management
functions as part of the monitoring and controlling process group, which includes project
2
time management, project cost management, project quality management, project
communication management, project risk management, project procurement
management, and project scope management. Furthermore, Hazir (2015) states that an
effective monitoring and controls system should clearly define the following policies:
“monitoring policy—what, how, when, and by whom to monitor” and also “intervention
and control policy—what, how, where, when, and by whom to prevent, intervene, and
correct.”
For the purpose of this research effort, Project Controls (PC) is defined as “a
practice that encompasses the resources, procedures and tools for the planning,
monitoring and controlling of all phases of a capital project’s lifecycle, and includes the
functions or practices of estimating, risk management, cost and schedule management,
change management, earned value progressing and forecasting” (Grau & Back, 2015a).
Complementarily, an Instantaneous Project Controls (IPC) function is defined as “a
function with continuous data collection and on-demand, accurate reporting” (Grau &
Back, 2015a).
In reality, there is a lack of comprehensive understanding of project controls,
whether information is instantaneously reported or not. The fundamental functions of
project controls beyond the study of estimating and scheduling techniques and data
collection technologies has not yet been investigated, i.e., with a holistic and multi-
faceted perspective. The reality is that much of the previous research has focused on
isolated analysis techniques and even more specifically data collection technologies
alone, but little effort has been focused on reporting, decision-making, and corrective
action stages of the controls process. For instance, much research has been conducted on
3
automated data acquisition techniques without consideration of how the collected data
will be analyzed into meaningful information or reported to the appropriate authority for
decision-making purposes, i.e., Ibrahim, Boles, & Fry (2009) and Taneja et al. (2010).
Another example is that most forecasting studies (e.g., Back, Boles, & Fry, 2000;
Barraza, Back, & Mata, 2004; Kim & Reinschmidt, 2009, 2010, 2011) assume the
availability of timely, accurate, and reliable information for analysis purposes without the
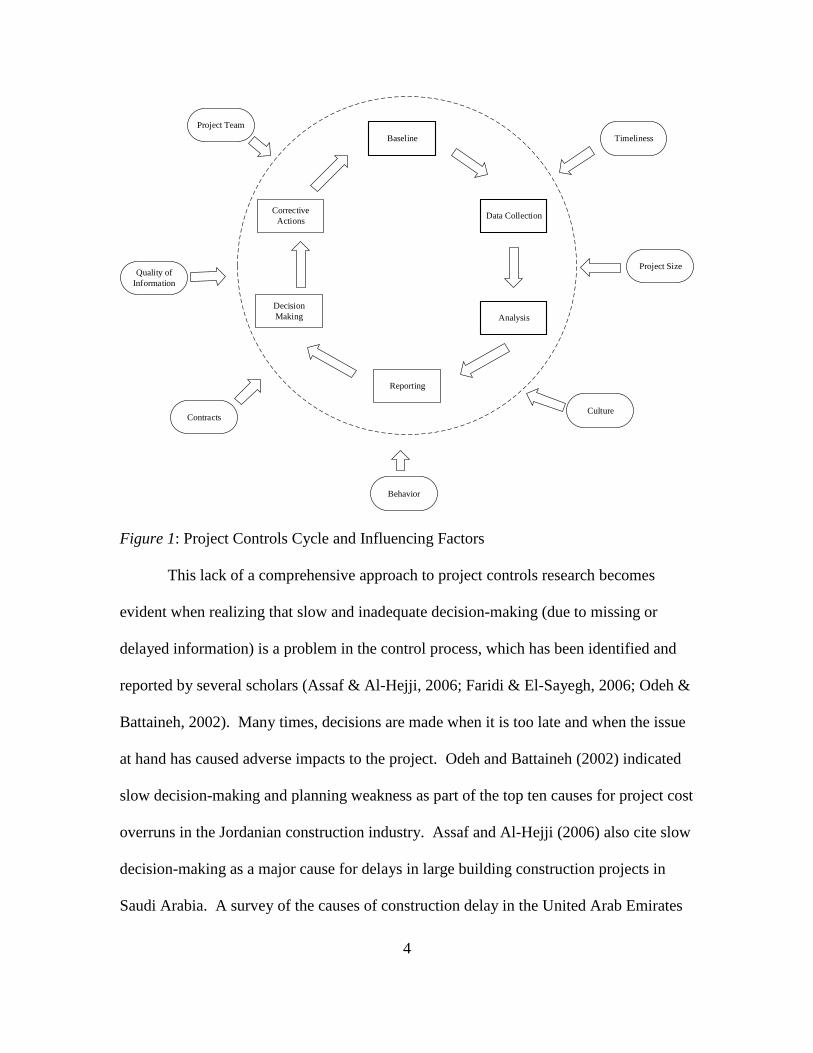
consideration of the data collection phase. Monitoring and control processes encompass
several stages, including planning and creating a baseline for control, gathering of project
data to establish current project status, analysis of the raw data into meaningful
information, reporting to the decision-making authority, decision making, and finally the
act of corrective actions (Figure 1). There are many factors influencing project controls
that need to be considered when talking about the subject. These may include project
team culture and composition, quality and timeliness of information, and the type of
construction contracts utilized. Figure 1 illustrates the control process and project
controls influencing factors.
4
Baseline
Data Collection
Analysis
Reporting
Decision
Making
Corrective
Actions
Project Team
Quality of
Information
Contracts
Behavior
Culture
Timeliness
Project Size
Figure 1: Project Controls Cycle and Influencing Factors
This lack of a comprehensive approach to project controls research becomes
evident when realizing that slow and inadequate decision-making (due to missing or
delayed information) is a problem in the control process, which has been identified and
reported by several scholars (Assaf & Al-Hejji, 2006; Faridi & El-Sayegh, 2006; Odeh &
Battaineh, 2002). Many times, decisions are made when it is too late and when the issue
at hand has caused adverse impacts to the project. Odeh and Battaineh (2002) indicated
slow decision-making and planning weakness as part of the top ten causes for project cost
overruns in the Jordanian construction industry. Assaf and Al-Hejji (2006) also cite slow
decision-making as a major cause for delays in large building construction projects in
Saudi Arabia. A survey of the causes of construction delay in the United Arab Emirates
5
capital projects industry revealed slowness of the owners’ decision-making process as the
top cause of delay (Faridi & El-Sayegh, 2006). Similar findings were reported as causes
of time overruns in Hong Kong construction projects (Chan & Kumaraswamy, 1997).
Knowing the status of a project in a timely manner will help management gain
greater insight of their projects, make purposeful decisions, and exercise effective
corrective or preventative actions. Without clear, correct, complete, consistent, and
recent information, management will not have the ability to take informed actions. In
order to mitigate negative variability factors on capital projects, it is crucial for the
decision-making authority to have accurate, complete, and reliable information available
in a timely manner. Monitoring of project progress should be supported with adequate
data collection, analysis, and reporting functions in such a way as to provide a clear and
up-to-date status of the project.
The delivery of accurate and timely information for project control purposes is
essential to effective management of projects. Around 50‒80 percent of the problems on
construction sites are attributed to missing and delayed information access (Howell &
Ballard, 1997). Timely delivery of information plays a crucial role in achieving project
objectives (Abudayyeh, Temel, Al-Tabtabai, & Hurley, 2001; Rojas & Songer, 1999)
because it allows appropriate decision-making. The more delay in identification of
discrepancies in project objectives the more challenging and costly it is to apply
corrective actions. It is estimated that 12.4%of resources are depleted due to late delivery
6
of information to the decision authority, defective materials, and rework late in the
construction phase (Burati, Farrington, & Ledbetter, 1992).
Despite the continuous evolution in the project management field, it appears
evident that the traditional approaches still show a lack of appropriate methodologies for
project control (De Falco & Macchiaroli, 1998). Furthermore, continuous monitoring of
the project provides insight into the health of the project and identifies areas needing
attention (PMI, 2008).
Research has shown that greater control from project management results in better
project performance (Henderson & Lee, 1992; Liu, Chen, Jiang, & Klein, 2010). The
quality and timeliness of information flow throughout construction projects has been
widely recognized as critical to project management success (Abuddayeh, 2001), thus, it
is necessary for all stakeholders and decision makers to have the correct, appropriate
information in a timely manner. Different levels of management have distinct
responsibilities and have to make unique decisions; the information and presentation that
each decision maker needs is different. Thus information presented to management
should be clear and good at showing any divergence from planned performance (Al-
Jibouri, 2003). Project controls should provide reports unique to each level of
management (e.g., control account managers, field office, project managers, owners,
corporate managers) with timeliness of information and appropriate level of detail, charts,
presentation, and information (Kostelyk, 2012).
In an ever-increasing competitive industry landscape, companies need to be more
efficient. As Grau and Back (2015b) point out predictability (timely forecast) of final
project cost and time outcome is an important measure of project success. Unfortunately,
7
forecasts of actual project outcomes are unreliable, and actual information is divulged
late in the project, which undermines the profitability of the organization (Mulva & Dai,
2012). The research found that project teams lack the ability to make accurate forecasts
of at-completion cost and time, which results in inability or reluctance to take corrective
actions until additional metrics and indicators are available. Such late availability of
information hinders proactive adoption of corrective actions and controls on projects.
Currently, project success is assessed based on the deviation of the initial project outcome
estimate with the actual outcome at completion. In this kind of outcome-centric
performance assessment, when the positive deviations (i.e., overruns) occur, this creates
mistrust, concern, and scrutiny. Alternatively, in the case of negative deviations (i.e.,
underruns), this results in attitudes of trust and satisfaction and, thus, loose mechanism of
control (Back & Grau, 2013a). Currently, such project assessments do not encourage the
early disclosure of project cost and schedule information, thus the ability to make
reliable, timely, and well-informed decisions to effectively support projects is
undermined. Such issues warrant a need for more research in the field of project
controls.
1.1 Lack of Adequate Reporting Capabilities
Despite advancements in technology, methods and means, and project
management procedures, endemic project performance deviations such as cost and
schedule overruns still remain pervasive in the capital projects industry (Assaf & Al-
Hejji, 2006; Back & Grau, 2013a, 2013b; Flyvbjerg, Holm, & Buhl, 2002; Mott
MacDonald, 2002; Mulva & Dai, 2012; Odeh & Battaineh, 2002). Scheduling methods
such as Critical Path Method, Program Evaluation and Review Technique, Earned Value
8
Management, Location Based Planning, Last Planner System and others have been
around as early as five decades ago; many variations and extensions to these methods
have been proposed ever since. These methods all strive to accomplish a better managed
project, a project that meets its performance metrics and objectives. Unfortunately,
academia and industry report of an endemic issue in projects meeting their performance
targets. One reason for this can be that the development of these scheduling, costing,
planning, or project management methods in general have focused specifically on silos of
research and have failed to consider project planning, monitoring, and controls as a
comprehensive process that encompasses several unique factors and steps. For instance,
in many forecasting, scheduling, or cost estimating methods it is assumed that the data
being acted upon or analyzed is complete and correct without the consideration of where
and how the data is being collected. Another example of how these silos of research fail
to construct a comprehensive management method is that they fail to identify how the
results of forecasts and estimates are going to be reported to decision authority, who
those decision authority are, and how they will take effective corrective actions when the
need arises.
Despite the development of the aforementioned scheduling, cost estimating, and
planning techniques, these methods fail to take into account a comprehensive view of the
process, such as where the data for the analysis is coming from and/or how the results of
these procedures or tools should be transmitted to the appropriate authority. In other
words, there is no reporting policy, needed frequency, identification of authority, or work
breakdown structure that is specified in these plans and procedures.
9
1.2 Information and Sensing Technologies
Right now, advanced information and sensing technologies may, for the first time
in history, enable the improvement of project control processes beyond analysis
techniques alone, such as data collection and reporting. Currently, there is unprecedented
innovation and availability of commercial technologies to support the improvement of
controls. These technologies have shown to improve project performance outcomes
(O’Connor & Yang, 2004; Thomas, Macken, & Lee, 2001). Technologies that were not
available only decades ago, such as the internet, cloud technologies, and numerous
sensing technologies like RFIDs, GPS, and Lidar, pose potential for improvement in the
field of project controls and can be used to provide timely data collection and reporting of
project information.
In the following sections, these technology improvements will be outlined for data
collection, information integration, advanced analytics, and reporting.
1.2.1 Data Collection
Unfortunately, manual collection of data is a common practice in the capital
projects industry (Cheun, Suen, & Chueng, 2004; Davidson & Skibniewski, 1995; Saidi,
Lyte, & Stone, 2003). The manual data collection process is labor-intensive, time-
consuming, and expensive and, as a result, it is performed infrequently (Golparvar-Fard,
Peña-Mora, & Savarese, 2009).
Many data capture technologies have been developed in the last three decades.
By beginning of 1990s as one of the earliest Automated Data Collection (ADC)
technologies (Goodrum et al., 2006), barcodes had been introduced on construction sites
as material tracking tools and have since been successfully used in the industry (Navon &
10
Goldschmidt, 2003). Following successful implementation in other industries, by the
mid-1990s, Radio Frequency Identification (RFID) systems were introduced to the
construction industry (Ghanem & AbdelRazig, 2006; Jaselskis, Anderson, Jahren,
Rodriguez, & Njos, 1995). The Global Positioning System (GPS) is a widely studied tool
for the automaton of construction data collection. Laser scanners are able to capture
high-resolution 3D data in a short amount of time and due to this capability they have
found applications in the construction industry (Kiziltas, Akinci, Ergen, & Tang, 2008).
Specifically, laser scanners have found application in quality control (Akinci et al., 2006;
Jaselskis, Cackler, Walters, Zhang, & Kaewmoracharoen, 2006), condition assessment
(Fuchs, Washer, Chase, & Moore, 2004; Gordon, Lichti, Stewart, & Franke, 2004; Tang,
Huber, Akinci, Lipman, & Lytle, 2010), equipment and component tracking (Bosche et
al., 2006; Gilsinn, Cheok, Witzgall, Lytle, 2005; Teizer, Kim, Haas, Liapi, & Caldas,
2005), and productivity monitoring (Su, Hashash, & Liu, 2006). A body of research
exists on the use of site imagery for continuous and automated data collection purposes.
Mobile technology, such as the use of smart phones and tablets for logging project
information and reporting, has now become a reality on capital projects.
1.2.2 Information Integration
Key decision-making needs visibility of information and hence information
integration (Evgeniou, 2002). Project controls is information intensive; there is a need to
retrieve information from different sources, organizations, and software systems.
Technology can alleviate the problem of information fragmentation especially when
reporting in real-time. Integration of information systems is a crucial component of
instantaneous project controls. Integrated and real-time project control systems could
11
have a significantly positive impact in the construction industry (Ghanem & AbdelRazig,
2006; Johnson & Clayton, 1998; Navon, 2005; Navon & Goldschmidt, 2003; Navon &
Sacks, 2007). A difficult aspect in implementing the plan for a complex project is the
coordination and integration of the various project elements in a way that the project
meets its cost, schedule, and performance requirements (Meredith & Mantel, 2003).
Integration and automation in construction have been developed and influenced by
manufacturing processes (Koskela, 1992). Lack of integration of project monitoring and
controls across stakeholders has resulted in isolated decision-making and has caused
adversarial relations (Sacks & Harel, 2006).
Non-integrated systems require manual or semi-manual tasks in order to combine
project data. Separate information systems require the handling of repetitive data several
times, which results in redundant processes. The National Institute of Standards and
Technology (NIST) performed a study in 2004 that placed the cost for lack of data
integration to the architecture, engineering, and construction (AEC) industry at $15.8
billion (Gallaher, 2004) of which $490 million is due to manually re-entering information
in the design and construction phase (Lipman, 2009).
Advancement in computing, such as the development of high capacity and
complex data bases inclusive of those with XML syntax and Building Information
Modeling (BIM), can enable the storage, update, and retrieval of the immense capital
projects data throughout its lifecycle.
1.2.3 Automated Analytics and Reporting
Currently, there is an exceptional amount of data being created by organizations
involved on capital projects; the use of technologies can alleviate the management and
12
analysis of these data especially if we want to report in real-time. There is an
unprecedented availability of commercial technology products, and technology has
evolved tremendously. In the past, to send a man to the moon required a room full of
computers; now, a smart phone has more computing power than those early computers.
In many industries, analytics and reporting is being done instantaneously and in real-time.
For instance, in the financial industry and in stock markets, it is now possible to see
market perturbations in real-time on a mobile device. In the manufacturing industry and
automobile sector, it is possible to see inventory and sales information in real-time.
Advanced technologies also pose potential benefits to construction data
integration and reporting mechanisms. Building information modeling is not only a
design tool but also a resourceful tool for consolidating construction project data (Hwang
& Liu, 2010; Kang, O’Brien, & O’Connor, 2012). Modern relational databases, such as
various forms of XML syntaxes, have found applications in the capital projects domain
(Winch, 2002; Zhiliang, Heng, Shen, & Jun, 2004; Zhiliang, Wong, Heng, & Jun et al.,
2005). Business intelligence algorithms now enable automatic formatting of reports and
reporting to appropriate decision-making authority (Navon & Haskaya, 2006).
1.3 Proposed Departure / Gap of Knowledge
There is a gap of knowledge when it comes to project controls. For instance, the
Construction Industry Institute (CII) conducted a research study on project control for
design engineering in the 1980s but has not commissioned any other research in the
project controls realm until only recently in 2013 (CII, 1987; Grau & Back, 2015a)—a
gap of almost 30 years. Research on project controls as a comprehensive process
spanning all phases of a capital project is non-existent. The most extensive research to
13
date has only focused on one phase of the project, such as engineering design (CII, 1987;
Kostelyk, 2012) or literature reviews that try to summarize the fragmented subjects
relating to the topic (Hazir, 2015; Rozenes et al., 2006). The importance of the subject is
slowly getting traction in professional societies. For instance CII has recently established
a project controls community of practice that is responsible for exchange of project
controls knowledge in the capital projects industry (CII, 2016).
In response to these latent shortcomings, this study approaches, for the first time,
the project controls process from a holistic perspective, inclusive of data collection,
analysis, and reporting functions that are necessary for the project and organizational
practices to enable an instantaneous reporting capability. Thus, this novel study
addresses several questions that arise, such as:
What are the adequate reporting frequencies for different project functions and
performance metrics?
For a given control function, does the frequency of reporting vary by project
management function?
How should the reporting frequency of distinct project control functions be
prioritized?
What are the potential benefits of real-time project control technologies on project
outcomes?
What business scenarios can justify the implementation of instantaneous project
controls?
What are the resource requirements (time, cost, labor, etc.) for achieving real-time
project controls and timely decision-making?
14
What technologies or software tools are being utilized to achieve instantaneous
project controls, and what is their commercial availability?
How is the construction industry currently reporting project performance
information?
1.4 Structure of Dissertation
The rest of the discussion in this dissertation is sequentially addressed as follows.
Chapter 1 gives an overview of the research problem and provides motivation
and challenges to the topic.
Chapter 2 presents the research hypotheses and objectives.
Chapter 3 provides a comprehensive literature review covering subjects
pertaining to project controls.
Chapter 4 elaborates on the research methodology undertaken in this research
study.
Chapter 5 describes the surveys regarding current and instantaneous project
control practices and illustrates the findings from the survey analysis.
Chapter 6 presents the findings and results of 10 case studies to identify
strategies for implementing instantaneous project controls. The interviews protocol,
structure, and constructs from the cases study analysis are presented.
Chapter 7 presents statistical analyses of retrospective data from the CII
benchmarking and metrics database regarding automation and integration level effect on
project performance.
Chapter 8 presents the research intellectual merit and impact.

15
Finally, Chapter 9 discusses the findings, conclusions, contribution, and
recommendation for future research efforts.
16
CHAPTER 2: HYPOTHESES AND RESEARCH OBJECTIVES
The research herein strives to overcome the gap in knowledge by investigating
project control methods and procedures in a comprehensive manner, which starts from
design to commissioning and encompasses functions such as data collection, analytics,
and reporting.
The research hypotheses were initially defined and redefined many times during
the study to accommodate findings from literature reviews, case studies, and insights
gained during the research study. The two hypotheses below represent this final wording,
and the research study is constructed around the premise of these two hypotheses.
Hypothesis 1: Specific strategies or practices that, when properly implemented
and supported with the right tools and techniques, can result in an instantaneous, or near
real-time, project controls function through which current and future cost and schedule
status is reported in a precise, reliable, and timely manner.
Hypothesis 2: The impact of instantaneous or near real-time practices expedites
project team decision-making, optimizes adjustments in execution strategies, and
maximizes the probability for project success and, as such, can be identified and
measured.
Specifically, there are three objectives that define this study:
Research Objective 1: the determination of current information and process
requirements, by project phase, typically required for supporting project control
functions.
Research Objective 2: the development of high-impact strategies to facilitate
innovation and to provide instantaneous project control capability. Such strategies should
17
address both the origination (“feed”) and accessibility (“read”) of project controls
information such that real-time, or near real-time, capability is provided.
Research Objective 3: quantify and/or define the benefit and investment costs
for instantaneous project control.
The scope of this research is limited to cost, schedule, scope, and quality
functions of control and does not include safety functions.
18
CHAPTER 3: BACKGROUND
No literature on project controls regarded as a comprehensive data collection,
analysis, and reporting function to accurately and timely inform on the project
condition exists. There is inadequate research and understanding of project controls,
irrespective of whether it is instantaneously reported or not, and what appropriate
practices are required to support it. The majority of past efforts regarding project
controls have been in the realm of estimating and scheduling (e.g., Barraza et al., 2004;
Isidore & Back, 2002; Kim & Reinschmidt, 2010, 2011). Additionally, contemporary
research has focused on the use of advanced technologies to automatically collect data
and generate project-related information. However, these studies have focused on the
generation of knowledge around the capability of a specific technology or approach as
opposed to providing an understanding of how such technologies and methods can
realistically support and inform on the project condition.
Loose monitoring and control of projects may cause adversarial relations and
litigation. These adversarial relations are costly; a study indicated that fees paid to
lawyers and professionals during the litigation process increased 425% between 1979 to
1990, while an increase of only 309%was seen in settlement and verdicts in the same
period (Marcotte, 1990). Thus, litigation costs more to get less in return (Callahan,
Bramble, & Lurie, 1990).
The rest of this chapter discusses the importance of project controls in the pretext
of endemic cost and schedule deviations, lack of predictability, and lack of timely and
informed decision-making support.
19
3.1 Endemic Cost and Schedule Deviations
Throughout recent years, there have been numerous reports globally on pervasive
cost and schedule deviations (oftentimes overruns) on capital projects (e.g., Assaf & Al-
Hejji, 2006; Back & Grau, 2013a; Flyvbjerg et al., 2002; Jaseleskis & Ashley, 1991; Mott
MacDonald, 2002; Mulva & Dai, 2012). The construction industry maybe more than
others has been plagued with various risks that result in cost and time overruns, poor
project performance, and even project failures (An, Baker, & Zeng, 2005). These
deviations are not limited to one industry sector but have been evident in residential,
office, industrial, infrastructure, and other project sectors (e.g., Flyvbjerg et al., 2002).
Such deviations show that a more effective mechanism needs to be in place to ascertain
appropriate project progress according to plans and objectives. The lack of satisfactory
project performance itself indicates a need for better monitoring and control.
The importance of project controls becomes evident after examining construction
project deviations (Rozenes et al., 2006). There is a plethora of reports on project
overruns. Flyvbjerg et al. (2002) investigated 258 transportation infrastructure projects
from 20 different countries and across a 70-year time span. The study reported an
average cost escalation of 44.7% for rail, 33.8% for bridge and tunnel, and 20.4% for
highway projects. Flyvbjerg, Skamris, Holm, & Buhl (2005) also found that 90% of
infrastructure projects experience cost overrun. Assaf and Al-Hejji (2006) conducted a
survey in Saudi Arabia among contractors, consultants, and owners and concluded that
only 30% of projects were completed within the scheduled completion dates, and also
56% of consultants and 76% of contractors stated that the average cost overrun on
projects is 30%. In 2002, the UK treasury reviewed large public projects (inclusive of
20
offices, hospitals, prisons, highways, roads, rails, airport terminals, and information and
communication technology facilities) procured in a 20-year span (Mott MacDonald,
2002). Average overruns of 17% on time, 47% on capital expenditures, and 41% on
operating expenditures were reported. Recently, Mulva and Dai (2012) indicated that,
based on the statistical analysis of 975 owner-completed projects, 70% of the projects
experienced a ±10% or larger deviation from planned cost and time. In another recent
study, Back and Grau (2013a) reported a 10% median schedule deviation and a 14%
median cost deviation at completion for 135 recently completed projects. These
perturbations are a major source of uncertainty and risk for the organizations in charge of
delivering a project. Jaselskis and Ashley (1991) studied 75 projects mostly in the US
and with a majority of projects being process-plant related, manufacturing, office, and
infrastructure projects. The investigators found that approximately 58% of projects
perform worse than planned in at least one or both cost and schedule. Two thirds of the
projects surveyed were from contractor companies while one third was from owner
companies. The historic inability to reduce cost and schedule deviations denotes an
endemic problem that the industry has yet been unable to tackle and resolve.
3.2 Lack of Predictability
Forecasting is a major and important project controls function. Project managers go
beyond finding the status of the project, and look at the possible future outcomes of the
project. Such forecasting efforts are made to support timely and effective decision
making.
As indicated by recent research (Grau & Back, 2015b), currently projects are not
predictable as to what their performance outcome will be in terms of cost and time.
21
These deviations, whether positive or negative, are frequently “not only by a few percent
but by several factors” (Flyvbjerg, 2006). These deviations highlight the importance of
early and accurate predictions. The lack of project predictability has many negative
implications such that organizations can’t proactively optimize resources (i.e., money)
across projects to maximize profitability (Mulva & Dai, 2012). Contrary to intuition,
Mulva and Dai (2012) quantitatively showed how both cost underruns and overruns
contribute to profitability losses. Their study was based on a statistical analysis of
historical data from a 16-year time span. The effects of net present value (NPV) on
actual cash-flow balances was investigated for an average project and also for two
scenarios. For instance, if project stakeholders know earlier that a project cost will be
under what was originally estimated they can reallocate the extra funds to other profitable
endeavors. Otherwise, their capital will be allocated to the current project, and potential
profitability losses will ensue due to the unused spare budget. On the other hand, early
disclosure of project cost overruns doesn’t warranty that these overruns will be reduced
or eliminated; however, the disclosure of such overruns ensures increase in monitoring,
controls, and scrutiny of the project to suppress further overruns (Back & Grau, 2013a;
Callahan, Stetz, & Brooks, 2007). Closer monitoring of project status is needed for better
insight into the projects and better predictability of resource utilization and final project
performance.
Currently, projects performance is assessed based on a single point deviation
between actual outcome and the estimated or baseline outcome. For instance, cost
deviations are assessed based on the deviation between baseline cost and total installed
cost, while time performance is assessed based on the deviation between baseline
22
schedule and total installed time. This type of outcome-centric performance assessment
results in negative assessment when overruns are reported at completion and positive
reactions when underruns are reported at completion. Due to this behavior, outcome-
centric assessment of project performance harms transparency and hinders the early
disclosure of final project outcome; this will negatively affect project controls as there is
less information available late into the project lifecycle. Currently, project team members
are awarded or punished based on final project performance against the baseline plan.
This type of incentives does not award or punish project stakeholders based on early
revelation of critical project information. This trend and lack of timely information
delivery prevents well-informed decisions and effective control of projects.
3.3 Lack of Timely and Informed Decision-Making Support
One reason for ineffective monitoring and control mechanisms is the
unavailability of real-time or at least timely information for decision-making support.
Many times project managers have to make critical decisions while in the dark as to the
true status of their projects. Oftentimes, information lags within the reporting cycle and
the data received by the decision maker may be several months old. In addition to
timeliness of information, the information has to be correct, complete, and
comprehensive. There have been several studies that attribute subpar capital project
performance with the lack of timely information (Back & Grau, 2013a). First, we will
discuss lack of timely information and the effects it has on organizational performance
from a business point of view and ultimately look at examples of slow decision-making
and capital project performance and how this relates with the reviewed business
literature.
23
Business literature indicates that fast decision-making is associated with better
project performance as it allows firms to keep up with change (Baum & Wally, 2003;
Bourgeois & Eisenhardt, 1988; Jones, 1993). The interest in correlation of decision-
making speed with firm performance initially emerged when Bourgeois and Eisenhardt
(1988) identified a positive association between fast strategic decision-making and firm
performance in “high-velocity” environments, such as microcomputer manufacturing
sector. Management advisors have repeatedly prescribed fast decision-making as a
source of competitive advantage (Jones, 1993), such as faster time to market, higher
profit margins, or higher client satisfaction.
The data from the research indicated that the information used by fast decision
makers was not forecasted information but rather real-time information. In the study
real-time information is indicated as “information about a firm’s operations or
environment for which there is little or no time lag between occurrence and reporting.”
Following these findings Eisenhardt (1989a) developed the following proposition: “The
greater the use of real-time information, the greater the speed of strategic decision
process” (p. 549).
Rapid decision-making in the wake of real-time information may be for the
following reasons (Eisenhardt, 1989a):
(1) Such real-time information may speed up problem or opportunity identification
(Dutton & Jackson, 1988).
(2) A more subtle reason is derived from artificial intelligence (AI) research
literature. AI literature indicates that “intuition relies on patterns developed
through continual exposure to actual situations (Hayes, 1981; Simon, 1987)”
24
(Eisenhardt, 1989a). The more information available the easier it will become to
make inferences and find patterns and trends.
(3) Real-time information might allow teams, managers, and decision makers to gain
more experience in responding to problems as a group. More information allows
project stakeholders to get more exposure to different scenarios and issues that
may occur, thus accruing experience faster.
Also, fast decision makers develop not fewer but more alternatives. It was found
that slower decision makers and teams considered less alternatives and only looked for
new alternatives when the previous alternatives were no longer viable options. Formally
Eisenhardt (1989a) stipulates this as: “The greater the number of alternatives considered
simultaneously, the greater the speed of strategic decision process” (p. 556).
It has been shown specifically in the capital projects industry that slow decision-
making has adverse effects on project performance. As consistent with business
literature, it has been shown that decision-making speed is correlated with performance
(Assaf, Al-Khalil, & Al-Hazmi, 1995; Odeh & Battaineh, 2002; Odeyina & Yusif, 1997).
A survey of 82 respondents from large public and private buildings, roads, and water and
sewer projects in Jordan, with both contractors and consultants surveyed inquired about
the most critical reasons for construction delays in their respective projects (Odeh &
Battaineh, 2002). Both owners and contractors indicated owner’s slow decision-making
as one of the 10 top most critical factors causing construction delay in the Jordanian
capital projects industry. An older study by Assaf et al. (1995) set out to identify main
causes of delay in Saudi large building construction projects. A survey of 24 contractors,
15 architectural/engineering firms, and nine owners was conducted. A major source of
25
delays was identified as owner slow decision-making. Similarly, Odeyinka and Yusif
(1997) analyzed causes of delay in the Nigerian building sector and stated slow decision-
making as a major source of delay.
3.4 State of Knowledge
Previous project control efforts have focused on scheduling and estimating
techniques. Project scheduling began as a research track within the mathematical field of
Operations Research with the objective of determining start and finish times of project
activities subject to resource and precedence constraints while simultaneously optimizing
for certain project objectives (such as cash flow optimization, minimizing project
schedule, etc.) (Vanhoucke, 2012). Initial research was done in the late 1950s and mainly
focused on network based techniques of Critical Path Method (CPM) and Program
Evaluation and Review Technique (PERT) scheduling (Vanhoucke, 2012). Despite their
age, CPM/PERT techniques are still widely used and are considered important
components of the scheduling function for organizations (Ahuja & Thiruvengadam,
2004; Barraza et al., 2004; Vanhoucke, 2012). However, these tools have some
limitations, which is why project scheduling research continues to grow in a variety of
directions, theoretical models, and applications, such as linear scheduling techniques,
simulation techniques, genetic algorithms, time scheduling, resource scheduling, cost
scheduling, and more. Scheduling techniques and the determination of final schedules
can be grouped using two different approaches: deterministic and probabilistic (Barraza
et al., 2004). The deterministic approach estimates final schedule values and outcomes
based on point estimates of most likely values, while, probabilistic methods consider
variability in duration values when estimating project schedule. As an example of a
26
probabilistic method, Kim and Reinschmidt (2009) use Bayesian inference and the beta
distribution to provide confidence bounds on predictions and determine the range of
potential outcomes and the probability of success. Furthermore, Kim and Reinschmidt
(2010) use Kalman filters and the EVM to make probabilistic forecasts of project
duration. In spite of the superiority of probabilistic methods in depicting the variable
behavior of projects (Crandall & Woolery, 1982), deterministic methods are more
frequently used because they more simple to apply (Barraza et al., 2004). Line-of-
balance (LOB) scheduling technique is one of several distinctly important scheduling
techniques. LOB scheduling is well suited to linear and repetitive projects, as it is a
visual technique where inefficiencies, production rates, and clashes can be found quickly
from charts and diagrams.
The Earned Value Method (EVM) is a cost estimating and scheduling technique
that is widely used for periodic monitoring of actual expenditures and physical scope
accomplishment and, accordingly, for generating period-by-period progress reports (El-
Omari & Moselhi, 2011). The Project Management Institute (PMI, 2005) claims that
when correctly applied, EVM provides an early warning of performance anomalies.
EVM originally coined “Cost/Schedule Control Systems Criteria (C/SCSC),” was
developed by the Department of Defense in the 1960s to monitor and control large
flexible-priced defense projects (DoD, 1967; Christensen, 1998; Kim, Wells, & Duffey,
2003; Moselhi, Li, & Alkass, 2004; Rozenes et al., 2006). Its appeal is owed to its
simplicity, integration of time and cost performance measures, and ability to provide
early warning signs on cost performance (overrun or underrun) and schedule performance
(ahead or behind) (Vanhoucke, 2009). EVM indicators have been found to be reliable as
27
early as 15% into a project (Fleming & Koppelman, 2000). Better planning and
allocation of resources early in the project may be part of this reliability. Succinctly,
EVM is based on the representation of three measures: first, the budgeted cost for work
scheduled (BCWS)—also called planned value (PV); second, the actual cost for work
performed (ACWP)—also called actual cost (AC); and finally, the budgeted cost for
work performed (BCWP) or earned value (EV). EVM integrates cost, schedule, scope,
and technical performance under the same framework, and it provides metrics that allow
managers to detect cost or schedule deviations (Fleming & Koppleman, 2000; Kerzner,
2003; Kim et al., 2003; Naeni, Shadrokh, & Salehipour, 2011; Plaza & Turetken, 2009;
Warhoe, 2004).
The Last Planner System™ (LPS) is an implementation mechanism of Lean
Construction (Ballard, 1997, 2000). It aims at enhancing the reliability of the weekly
work plan. According to Ballard, LPS is a production planning approach that integrates
pull planning, look-ahead planning with constraint analysis, weekly work planning based
upon reliable promises, and learning based upon analysis of Plan Percent Complete
(PPC) and reasons for variance to improve workflow (Ballard, Kim, Jang, & Liu, 2007).
In the LPS, the last planner is the ultimate individual responsible for planning the actual
execution of the work. This approach introduces a transfer of accountability from
management to the workforce.
3.4.1 Limited Approach to Controls
More information is needed by managers to make decisions (Chau, Cao, Anson,
& Zhang, 2003); project information is derived from different sources that need to be
integrated (Ahmad, Azhar, & Lukauskis, 2004). Current research has focused on silo
28
thinking and segregated techniques and has not considered the overall process. Data
collection efforts do not consider analysis or reporting and only focus on obtaining the
data. In spate efforts, analytics only focuses on methods and techniques with disregard
for where and how the data that is fed into its algorithms is collected. In many academic
papers, complex analytic techniques are explained, but they oftentimes do not explain
how they will be implemented in the project management system of an organization.
Examples include where the data is coming from, who it is to be reported to, and with
what frequency. As an example of analytics, Kim and Reinschmidt (2009, 2010, 2011)
propose several elaborate in-depth various probabilistic forecasting methods. Kim and
Reinschmidt (2009, 2010) use Bayesian inference, the beta distribution, and Kalman
Filters, to more accurately forecast project cost and time at completion as compared with
classical CPM/PERT methods. Although these propositions have strong intellectual
merit, they lack much practicality.
There have been instances where the process of data collection, analysis, and
reporting has been streamlined for a specific function. For instance, Navon and
Shpatnitsky (2005) propose a model that automatically collects earthwork information
and processes the monitored data into useful information to the construction manager in
real-time. Their model was used for road construction. It uses GPS technology to
automatically collect earthmoving equipment locations and uses proprietary algorithms to
convert these location data to control information, such as productivity, duration (or
progress), and actual consumption of materials. Specifically, El-Omari and Moselhi
(2011) investigated the practicality of several automated data acquisition technologies,
which includes bar coding, RFID, 3D laser scanning, photogrammetry, multimedia, and
29
pen-based computers. Their cost/schedule model integrates these automated data
acquisition technologies with relational databases, planning and scheduling softwares,
and AutoCAD to produce progress reports that can be used in the decision-making
process by project management.
3.4.2 Availability of Sensing and Information Technologies for Instantaneous
Controls
Project controls is a function that has traditionally required manual collection,
aggregation, and analysis of a large volume of multiple data sets from distinct sources,
e.g., with different formats and supported by different tools. Thus, the inability to
automatically collect and process large volumes of defragmented data has been
preventing the consideration of an instantaneous controls capability. But now, with the
availability of new technologies, it is possible to instantaneously report project
information to the appropriate authority. With advancements in field data capture,
analytics, and computing, it is now possible to have access to accurate, reliable, and
complete data on demand and instantaneously.
Unfortunately, manual collection of data is a common practice in the capital
projects industry (Cheung et al., 2004; Davidson & Skibniewski, 1995; Saidi et al.,
2003). Manual data collection process is labor-intensive, time-consuming, and
expensive; as a result, it is performed infrequently (Golparvar-Fard et al., 2009).
Furthermore, manual processes pose data inconsistency, redundancy, and data entry error
problems (Abudayyeh & Rasdorf, 1993). Accuracy of the collected data depends on the
skill level and judgment of the individual collecting the data (Liu, 1995).
30
Automated data collection is the use of electronics or computers with minimal
human interface for the collection of project data. Automated data collection permits the
continuous and instantaneous feed of data for analysis and reporting function purposes,
thus contributing to successful execution of projects (Russell, 1993). Traditionally, field
data collection has been difficult (Hwang & Liu, 2010). As a solution, the industry has
looked for answers within the technology realm (Hwang & Liu, 2010). Various real-time
data collection systems have been developed with the aim of automating control of
construction projects (Hwang & Liu, 2010). There has been extensive work on
automated sensing technology that has helped in bypassing manual collection of data
(Taneja et al., 2010). Such modern technologies are becoming more available and less
expensive (Navon & Sacks, 2007) and help in the timeliness, accuracy, and integrity of
data collection (Rasdorf, 1990). Many automated data acquisition and control techniques
have been investigated in the past two decades (Isaac & Navon, 2014). Fortunately with
the advancements in field data capture technologies such as smart tags, laser scanners,
embedded sensors, GPS devices, RFID scanners and more, it is now possible to collect,
store, and reuse accurate, complete, and reliable field data (Kiziltas et al., 2008).
Key decision-making needs visibility of information and, hence, information
integration (Evgeniou, 2002). In many industries, including the capital projects industry,
the problem is that information is spread across organizations and stakeholders, disparate
information systems exist, and information is presented in different modes and standards
across the enterprise (Evgeniou, 2002). A difficult aspect in implementing the plan for a
complex project is the coordination and integration of the various project elements, in a
way that the project meets its cost, schedule, and performance requirements (Meredith &
31
Mantel, 2003). For instance, in construction projects there is typically one general
contractor and many subcontractors that may work in different information systems and
present information in different formats. Lack of integration of project monitoring and
controls across stakeholders has resulted in isolated decision-making and has caused
adversarial relations (Sacks & Harel, 2006). In order for the project manager to make
effective decisions, this information should be integrated and visible to the manager.
Integrated and real-time project control systems could have a significantly
positive impact in the construction industry (Ghanem & AbdelRazig, 2006; Johnson &
Clayton, 1998; Navon, 2005; Navon & Goldschmidt, 2003; Navon & Sacks, 2007).
Integration and automation in construction have been developed and influenced by
manufacturing processes (Koskela, 1992). The advent of the internet opened up myriad
possibilities for all industries, including construction projects; the potential implications
of the web positively increased as it has matured (i.e., cloud computing). During the late
’90s and early 2000s, the internet came to be recognized as a tool for the integration of
historical and current project data and the remote entry of data into data management
systems (Abudayyeh et al., 2001; Rojas & Songer, 1999). Web-enabling technologies
have been used as a tool for the integration of information systems (Cheung et al., 2004;
Moselhi et al., 2004; Rojas & Songer, 1999). In 1997, Walker and Betts (1997)
forecasted that the internet and the World Wide Web would revolutionize construction
business structure. Some researchers (Chan & Leung, 2004; Chou & Chong, 2008; Li,
Moselhi, & Alkass, 2006; Moselhi et al., 2004) have applied web-based systems for
convenient data collection and data sharing over the internet. BIM can facilitate the
integration of real-time field data collection technology into the project management
32
framework (Hwang & Liu, 2010). For example, a system developed by Golparvar-Fard
et al. (2009) can assist with automatic update of building information models while its
primary purpose is to monitor progress.
3.5 Advanced Technologies and Project Performance
Automated data-collection, analysis, and reporting methods have been devised as
a partial solution to the stagnant project controls capability (Rebolj, Babič, Magdič,
Podbreznik, & Pšunder, 2008). It has already been documented that the ability to share
and analyze information can have a positive impact on project performance. A NIST-
sponsored study carried out by Thomas (2000) and Thomas et al. (2001) evaluated the
impact of design/information technology (D/IT) adoption on project performance metrics
such as cost, schedule, and safety. Specifically, they looked at four technologies: (1)
integrated database, (2) electronic data interchange (EDI), (3) three-dimensional (3D),
and (4) computer-aided design (CAD) modeling and bar coding. The authors determined
that such technologies can improve project cost and schedule performance. Furthermore,
Thomas, Lee, Spencer, Tucker, and Chapman (2004) conclude that an increase of D/IT
will result in cost savings of approximately four percent.
In another detailed study, O’Connor and Yang (2004) conducted a survey on
more than 200 capital facility projects and quantified the benefits of information
technology adoption on project cost and schedule performance. Their analyses includes
those at the project level and phase level for high-tech and low-tech work functions and
specifically their relationship with information integration and automation levels. Their
study measures IT use across six project phases (front-end planning, design, procurement,
construction management, construction execution, and startup/operations/maintenance);
33
each phase includes several work functions. O’Connor and Yang’s (2004) statistical
analysis indicated that technology advancements improve both project cost and schedule
at the project level but are more prominent in reducing schedule growth. Also, project
schedule success is found to be correlated with the following levels: (1) project level, (2)
integration level, (3) front-end phase, and (4) construction execution phase. Additionally,
project cost success is correlated with technology usage for industry-wide, high-tech
work functions, but the correlation is relatively weak.
The studies noted were conducted more than a decade ago. It could be expected
that with the technologies available today the impact of integration and automated
analytics could be larger. Too often the Return on Investment (ROI) of information
technology is not evaluated pre- or post-implementation due to the perceived difficulty of
the evaluation (Johnson & Clayton, 1998). As with most competitive industries, the
capital projects industry needs to quantify the costs, benefits, and business implications of
information technology usage. For this reason, several scholars have attempted to
identify and quantify the benefits from the adoption of these technologies. Through a
simulation technique, Back and Bell (1994) showed that internal information integration
in industrial capital projects decreased both project cost and time. A study by Johnson
and Clayton (1998) suggests that team productivity and management procedures may
improve by adopting information technology in AEC firms. Back and Moreau (2000)
suggest that information integration within and across organizational boundaries reduces
project time and cost. One of the first efforts to quantify the benefits of information
technology adoption was by Thomas (2000) who evaluated the impact of information
34
technology adoption on project performance metrics such as cost, schedule, and safety
and contended that such technologies can reduce project cost and schedule growth.
The adoption of new technologies in the capital projects industry has been slower
than other industries, such as manufacturing. Such a lack of investment may be due to
lack of statistical studies to support the utilization of such technologies. Too often the
ROI of information technologies is not evaluated due to the perceived difficulty of such
evaluation (Johnson & Clayton, 1998). As such, the capital projects industry needs to
quantify the costs, benefits, and business implications of real-time project controls with
the support of information technologies. For this reason, several scholars have attempted
to identify and quantify the benefits from the adoption of these technologies.
There are relatively few research studies that have attempted to show the impact
of technology usage on construction project performance. Of the extant studies, an early
study by Griffis, Hogan, & Li (1995) studied the effects of 3D CAD models on project
cost (actual cost/estimated cost), schedule (actual schedule/estimated schedule), and
rework (additional labor expenditure due to rework/total labor expenditure of the project)
in industrial projects and found improvement in these three key project parameters.
Specifically compared to projects that use traditional design and construction methods,
they report a five percent reduction in cost growth, four percent reduction in schedule
slip, and 65% reduction in rework. These reported results are based on a survey of 55 CII
companies. To validate their survey results, Griffis et al. (1995) conducted a case study
of a project that used 3D CAD. The project staff were asked to identify problems that
35
were avoided due to use of these models. Furthermore, based on conservative estimates a
cost reduction of 12% was shown validating the survey results.
De Lapp, Ford, Bryant, & Horlen (2004) studied the impact of CAD on design
realization. Johnson and Clayton (1998) studied the impact of information technology on
facility design and construction from the owner’s perspective and suggested that team
productivity and management procedures may improve by adopting information
technologies.
Back and Bell (1994) attempted to identify the impact of electronic data
interchange (EDI) in bulk materials management and showed through a simulation
technique that internal information integration in industrial capital projects could improve
both project cost and time outcomes. Back, Moreau, & Toon (1996) investigated the
effect of information management on project cost and schedule performance. The
researchers modeled a single information technology solution using Visual Basic
program and concluded that such a single approach may not result in a significant
project-level impact. Back and Moreau (2000) investigated the cost and schedule
impacts of information management systems on EPC projects in order to quantify the
business impact of information management strategies and the associated investment in
information technology. They concluded that implementation of information integration
strategies for design related and material management activities may reduce the project
schedule by 14% and project cost by eight percent.
Using a similar methodology to study IT use, El-Mashaleh, O’Brien, & Kang
(2006), through quantitative analysis, found that higher technology usage correlates to
better schedule, cost, and some composite metrics. Additionally, they concluded that
36
schedule performance experiences higher improvement by use of technology than does
cost performance; also, no positive impact was found on safety. They developed an IT
rating index similar to that of O’Connor and Yang (2004). Their analysis specifically
showed that one unit of technology improvement will increase schedule performance by
five percent and cost performance by three percent. Yang, O’Connor, & Chen (2007)
explored the links between technology usage and project outcomes through assessment of
technology usage at the work function level for 98 capital facility projects and concluded
that information and data-intensive work functions may contribute to better cost, time,
and quality performance.
Yang, O’Connor, & Wang (2006) studied the level of technology employed
across 68 project work functions across 209 completed projects across the US. The
primary objective of their study was to investigate the success-technology relationship
across different project sizes and conclude that such a relationship is more prominent for
medium and small projects as opposed to large projects.
Kang, O’Brien, Thomas, & Chapman (2008) studied CII benchmarking data and
concluded that CII owner companies experience two percent improvement in cost growth
and 17% improvement in schedule growth from technology use. Zhai, Goodrum, Haas,
& Caldas (2009) showed that construction labor productivity is positively related to the
use of automation and integration technologies. Froese (2010) investigated the impact of
emerging information technology on project management for construction projects.
37
Kang et al. (2012) present an analysis of benefits and hindrances for specific information
integration implementations in the industrial construction sector.
The studies presented above indicate the importance of technology usage in
construction projects and suggest improvements in project and firm performance from the
implementation of such technologies.
The research herein contributes to the body of knowledge by providing a practical
understanding of the effect of information integration and automated analytics on project
cost and schedule performance. The understanding of past technology improvement on
project performance allows management as well as developers of new technologies to
realize the benefits of such technology utilization and helps them in making prudent
decisions by providing economic value of using information technologies.
38
CHAPTER 4: RESEARCH METHODOLOGY
In this chapter, the research methodology will be outlined. Each research tool
used will be described, including the survey tools, statistical analysis, and multiple
case study method, in the following paragraphs.
4.1 Overview
The lack of knowledge in the subject area instigated the pursuit of this problem
from a practical perspective—problem-centered and pluralistic—using a mixed-method
form on inquiry. Thus, several lines of inquiry were sought in this research project to
achieve the research objectives (stated in Chapter 2). The research methodology includes
hypothesis development, literature reviews, two online surveys, research charrettes,
statistical analyses of retrospective capital project databases (quantitative), and an
exploratory multiple case study (qualitative). Figure 2 diagrammatically explains the
research method.
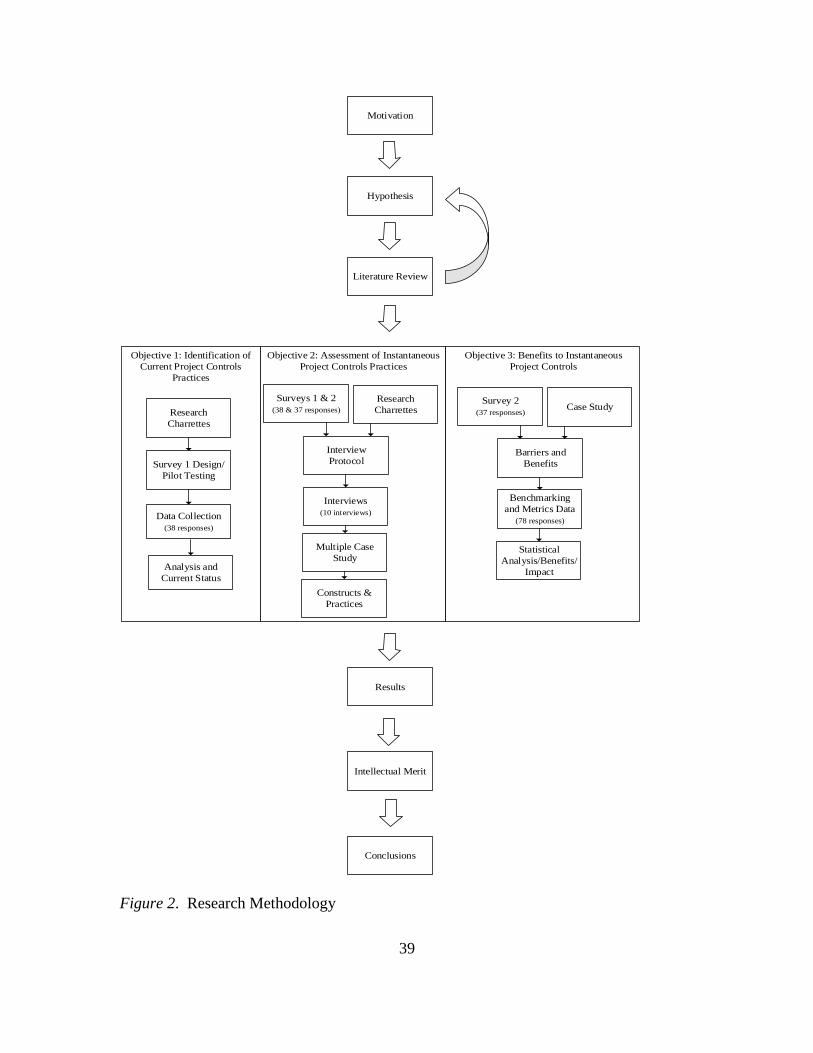
39
Objective 2: Assessment of Instantaneous
Project Controls Practices
Hypothesis
Literature Review
Objective 1: Identification of
Current Project Controls
Practices
Results
Data Collection
(38 responses)
Intellectual Merit
Objective 3: Benefits to Instantaneous
Project Controls
Survey 1 Design/
Pilot Testing
Research
Charrettes
Interview
Protocol
Surveys 1 & 2
(38 & 37 responses)
Interviews
(10 interviews)
Multiple Case
Study
Constructs &
Practices
Research
Charrettes
Barriers and
Benefits
Survey 2
(37 responses)
Benchmarking
and Metrics Data
(78 responses)
Statistical
Analysis/Benefits/
Impact
Case Study
Motivation
Analysis and
Current Status
Conclusions
Figure 2. Research Methodology
40
4.2 Literature Review
First, an extensive literature review of technical journals and industry publications
was undertaken. The literature evidences a noticeable lack of research on the subject
matter and especially of research pertaining to project controls as a comprehensive
method that encompasses many processes; thus, the objective of the literature review was
to find key topics, trends, and research statuses pertaining to project control subject areas,
such as forecasting, integration methods, data collection, and more. The research
hypothesis was redefined and refined several times using the insights gained from the
literature review.
4.3 Research Charrettes
Using structured workshops or research charrettes, it is possible to elicit ideas and
industry experience in a short amount of time for the purpose of gaining innovative and
useful research findings (Gibson & Whittington, 2009). According to Grau and Back
(2014), “Research charrettes encompass a dynamic, creative generation and sharing of a
large amount of information in a short amount of time” (p. 18). A steering committee of
a number of senior project controls specialists from top contractor and owner companies
provided their experience and valuable insights into the subject matter (members
mentioned in acknowledgements section of this dissertation). During a two-year period,
monthly tele and web conference calls were held, and bi-monthly face-to-face meetings
were held across North America for two to three days at a time. Before each assembly, a
meeting agenda was developed and sent to participants to facilitate the planning and
execution of the structured and unstructured exercises. Also, several subcommittees were
41
established that held remote conference calls to coordinate specific project objectives that
were later reported to the entire team for further discussion.
4.4 Surveys
Two surveys were developed and distributed among CII member companies. The
survey respondents were a diverse set of owner and contractor companies within the
public and private sector. Survey 1 investigated the current or batch conditions of project
controls within the construction industry, which is in line with objective 1 of the research
study. Survey 1 quantified current data collection and reporting frequencies for various
control functions across different project phases. A major contribution of the batch
conditions survey or Survey 1 was the definition of project control functions for the
design, procurement, construction, and commissioning phases of the project, which is
something that has not been addressed in literature prior to this effort.
Survey 2 was intended to discover instantaneous project control elements,
barriers, benefits, characteristics, and requirements. Survey 2 investigated barriers and
benefits to the implementation of instantaneous project controls, which are functions that
are being monitored and controlled instantaneously, and also the perceived benefits of
IPC on cost, schedule, quality, and scope across project phases. This survey contributed
to objectives 2 and 3 of the research study—identification of IPC practices and
quantification of benefits of IPC. Surveys 1 and 2, along with research charrettes, were
used to construct the interview protocol that later supported the case studies and objective
2. Also, Survey 2 indicated top barriers to implementation of IPC, which subsequently
related to CII Benchmarking and Metrics Data, as shown earlier in Figure 2.
42
4.5 Multiple Case Study Research
To fulfill research objective 2—the development of high impact strategies and
practices that facilitate the implementation of IPC—an exploratory case study research
methodology was adopted (Eisenhardt, 1989b; Glaser & Strauss, 1967; Yin, 1994). Yin
(1994) describes case study research as an “empirical inquiry that investigates
contemporary phenomenon within its real-life context, especially when the boundaries
between phenomenon and context are not clearly evident”.
As part of the preparatory phase of the case studies and prior to the interviews, an
interview protocol was designed to collect data from companies within and outside CII
membership. During preliminary interviews and discussions (not part of the main case
studies), we followed an opportunistic approach (Eisenhardt, 1989b), meaning we
identified emerging issues and modified our questions accordingly to better reach our
objective. This approach resulted in a standardized open-ended interview protocol used
in the subsequent case studies. Companies with at least one instantaneous controls
function were identified by research panel members, and, ultimately, 10 companies not
only in the construction domain but also in the technology, manufacturing, and aerospace
industries were contacted. The interviews were held either by phone or face to face with
interviewees within the higher managerial positions and experts affiliated with companies
regarded as leaders within their respective industries. The case studies fulfilled the need
for an external cross-validation since it enabled the identification of common
characteristics, traits, and trends from multiple industry, management, and technical
perspectives. The strategic selection of cases and the carefully selected questions
produced complementing and replicating evidence, which increased the internal validity
43
of our constructs (De Vaus, 2004; Eisenhardt, 1989b; Yin, 1994). The data collection or
case studies were stopped when we reached theoretical saturation (Auerbach &
Silverstein, 2003), meaning we stopped interviewing new companies when the insights
became repetitive, and at this point, we started analyzing the collected data.
Most interviews were recorded and transcribed in order to perform a careful
within-case analysis (Eisenhardt, 1989b) to shortlist relevant information. These case
studies were analyzed through triangulation of evidence to develop constructs that were
used to identify high-impact practices and strategies that help companies achieve IPC
solutions. In total, 88 issues were shortlisted, referred to as “incidents,” and grouped into
similar themes referred to as “categories” or “codes” (Glaser & Strauss, 1967). Emerging
incidents were compared with themes to identify important emerging themes to form key
constructs. In this way, nine key constructs emerged.
The strength of this research lies in the inclusion of multiple case studies to
examine the same relationships across organizations and project types and to reach a
level of generalization. The inclusion of multiple case studies allowed for triangulation
in data collection, which subsequently enabled verification of emergent issues from
multiple sources to achieve convergence.
4.6 Statistical Analysis
In Survey 2, analysis of the 37 subject matter responses from 18 distinct
organizations revealed that information integration was cited as the top barrier and
process automation as one of the top barriers to IPC implementation. These two
functions were considered as proxies of IPC. Incidentally, CII Benchmarking and
Metrics (BM&M) survey version 11.0 had investigated the maturity of internal and

44
external integration as well as process automation within construction organizations. We
utilized the useful portion (78 responses) of this retrospective benchmarking database to
quantify the benefits of IPC on project performance. We categorized best and worst in
class projects based on their integration and automation maturity and statistically
compared the schedule and cost performance of these two groups to achieve objective 3
or the objective to determine the impact of IPC on project performance.
45
CHAPTER 5: CURRENT STATE OF KNOWLEDGE
Survey 1, or the batch mode survey, was designed to satisfy objective 1 of this
research project. As previously mentioned, objective 1 of this research project is the
determination of current information and process requirements, by project phase,
typically required for supporting project control functions. In this chapter, the survey
design, project characteristics, and results, such as information systems used during the
project and frequency of monitoring and controls for specific functions during different
phases of the projects, are outlined. Survey 1 or the batch mode survey is presented in
Appendix I.
In order to avoid biased findings and conclusions, the data collection included a
representation from a broad range of industry organizations and projects, such as both
public and private sectors, and a balance between owner and contractor perspectives.
5.1 Survey 1—Batch Mode Survey
In this section, the design, data collection, respondent and project characteristics,
descriptive statistics, and findings regarding project information technology utilization
and reporting frequency for project management functions are reported.
5.2 Design
The first survey was administered online through an online survey tool named
Select Survey; access to this website was provided by CII. The online survey was
initially beta tested internally among research team members before sending to the
surveyed for final responses. The targeted respondents were project control managers
and specialists as well as project managers. The survey was open for three months and
was extended several times to allow more responses to be returned.
46
Current project controls issues addressed in the survey included, but were not
limited to, reporting frequencies for project control functions per phase to both project
manager and client or ultimate authority or the characterization of computing tools and
systems to satisfy controls and management processes. Also, a fundamental aspect of the
survey design was the accurate definition of the different project control functions
required during the design, procurement, construction, and commissioning and startup
phases. The project control functions were defined by a subcommittee of subject matter
experts involved in the research project (Grau & Back, 2016). The meetings were
administered online by the author in four separate hour-long sessions. Table 1 to Table 4
illustrate the concluding project control functions for the engineering, procurement,
construction, and commissioning and startup phases.
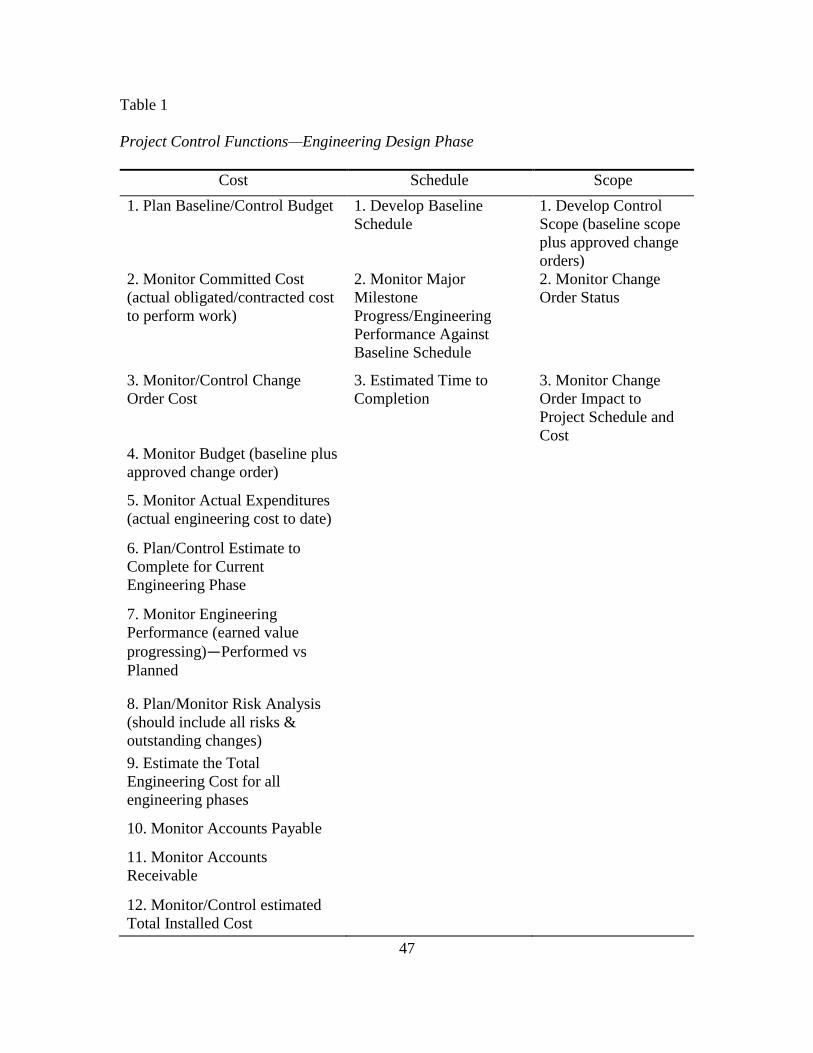
47
Table 1
Project Control Functions—Engineering Design Phase
Cost Schedule Scope
1. Plan Baseline/Control Budget 1. Develop Baseline
Schedule
1. Develop Control
Scope (baseline scope
plus approved change
orders)
2. Monitor Committed Cost
(actual obligated/contracted cost
to perform work)
2. Monitor Major
Milestone
Progress/Engineering
Performance Against
Baseline Schedule
2. Monitor Change
Order Status
3. Monitor/Control Change
Order Cost
3. Estimated Time to
Completion
3. Monitor Change
Order Impact to
Project Schedule and
Cost
4. Monitor Budget (baseline plus
approved change order)
5. Monitor Actual Expenditures
(actual engineering cost to date)
6. Plan/Control Estimate to
Complete for Current
Engineering Phase
7. Monitor Engineering
Performance (earned value
progressing)—Performed vs
Planned
8. Plan/Monitor Risk Analysis
(should include all risks &
outstanding changes)
9. Estimate the Total
Engineering Cost for all
engineering phases
10. Monitor Accounts Payable
11. Monitor Accounts
Receivable
12. Monitor/Control estimated
Total Installed Cost
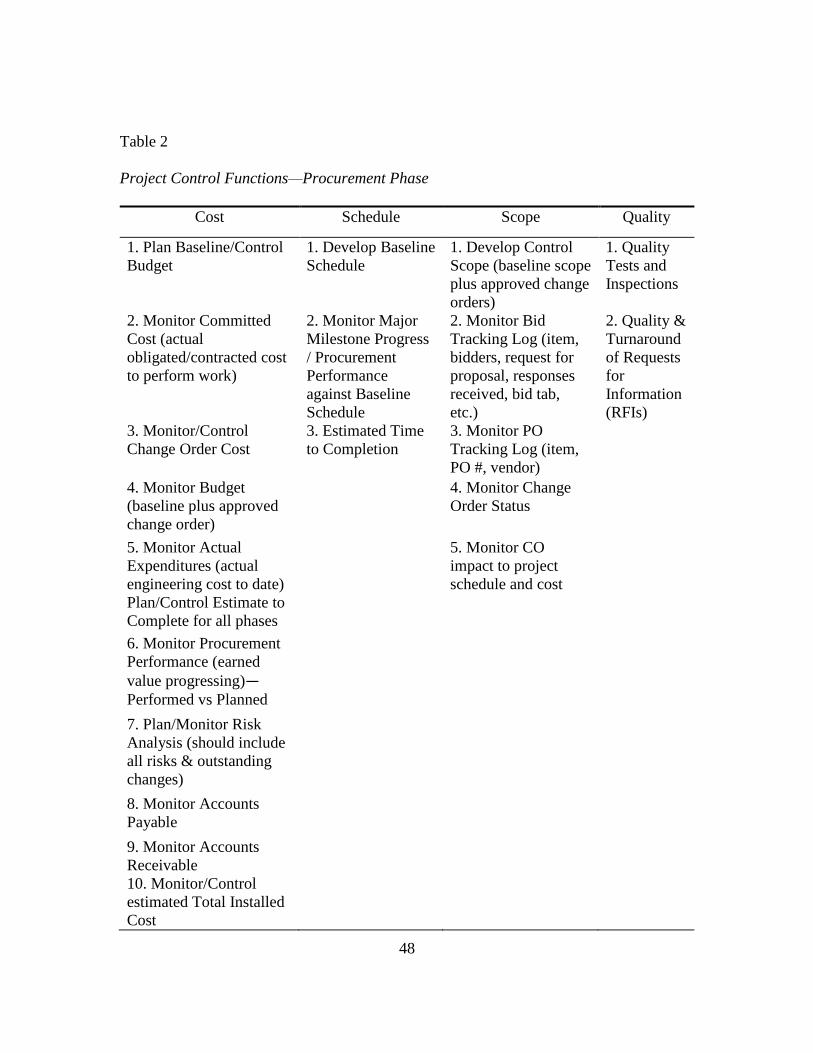
48
Table 2
Project Control Functions—Procurement Phase
Cost Schedule Scope Quality
1. Plan Baseline/Control
Budget
1. Develop Baseline
Schedule
1. Develop Control
Scope (baseline scope
plus approved change
orders)
1. Quality
Tests and
Inspections
2. Monitor Committed
Cost (actual
obligated/contracted cost
to perform work)
2. Monitor Major
Milestone Progress
/ Procurement
Performance
against Baseline
Schedule
2. Monitor Bid
Tracking Log (item,
bidders, request for
proposal, responses
received, bid tab,
etc.)
2. Quality &
Turnaround
of Requests
for
Information
(RFIs)
3. Monitor/Control
Change Order Cost
3. Estimated Time
to Completion
3. Monitor PO
Tracking Log (item,
PO #, vendor)
4. Monitor Budget
(baseline plus approved
change order)
4. Monitor Change
Order Status
5. Monitor Actual
Expenditures (actual
engineering cost to date)
5. Monitor CO
impact to project
schedule and cost
Plan/Control Estimate to
Complete for all phases
6. Monitor Procurement
Performance (earned
value progressing)—Performed vs Planned
7. Plan/Monitor Risk
Analysis (should include
all risks & outstanding
changes)
8. Monitor Accounts
Payable
9. Monitor Accounts
Receivable
10. Monitor/Control
estimated Total Installed
Cost
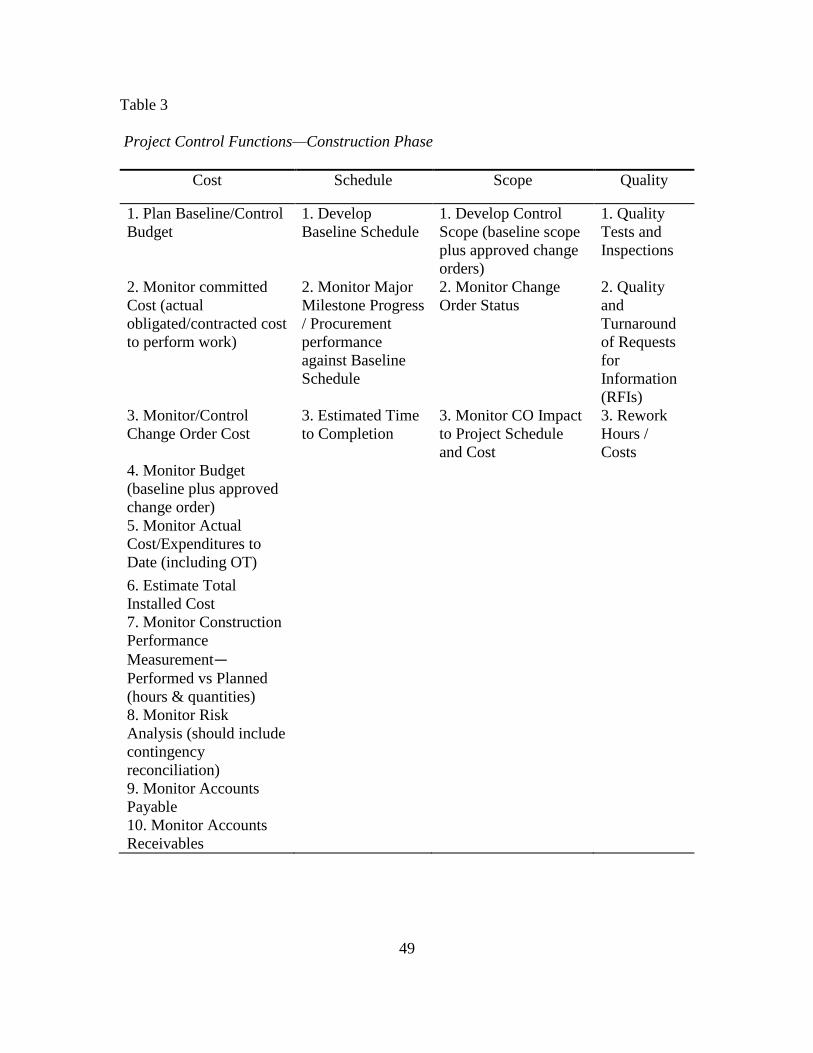
49
Table 3
Project Control Functions—Construction Phase
Cost Schedule Scope Quality
1. Plan Baseline/Control
Budget
1. Develop
Baseline Schedule
1. Develop Control
Scope (baseline scope
plus approved change
orders)
1. Quality
Tests and
Inspections
2. Monitor committed
Cost (actual
obligated/contracted cost
to perform work)
2. Monitor Major
Milestone Progress
/ Procurement
performance
against Baseline
Schedule
2. Monitor Change
Order Status
2. Quality
and
Turnaround
of Requests
for
Information
(RFIs)
3. Monitor/Control
Change Order Cost
3. Estimated Time
to Completion
3. Monitor CO Impact
to Project Schedule
and Cost
3. Rework
Hours /
Costs
4. Monitor Budget
(baseline plus approved
change order)
5. Monitor Actual
Cost/Expenditures to
Date (including OT)
6. Estimate Total
Installed Cost
7. Monitor Construction
Performance
Measurement—Performed vs Planned
(hours & quantities)
8. Monitor Risk
Analysis (should include
contingency
reconciliation)
9. Monitor Accounts
Payable
10. Monitor Accounts
Receivables
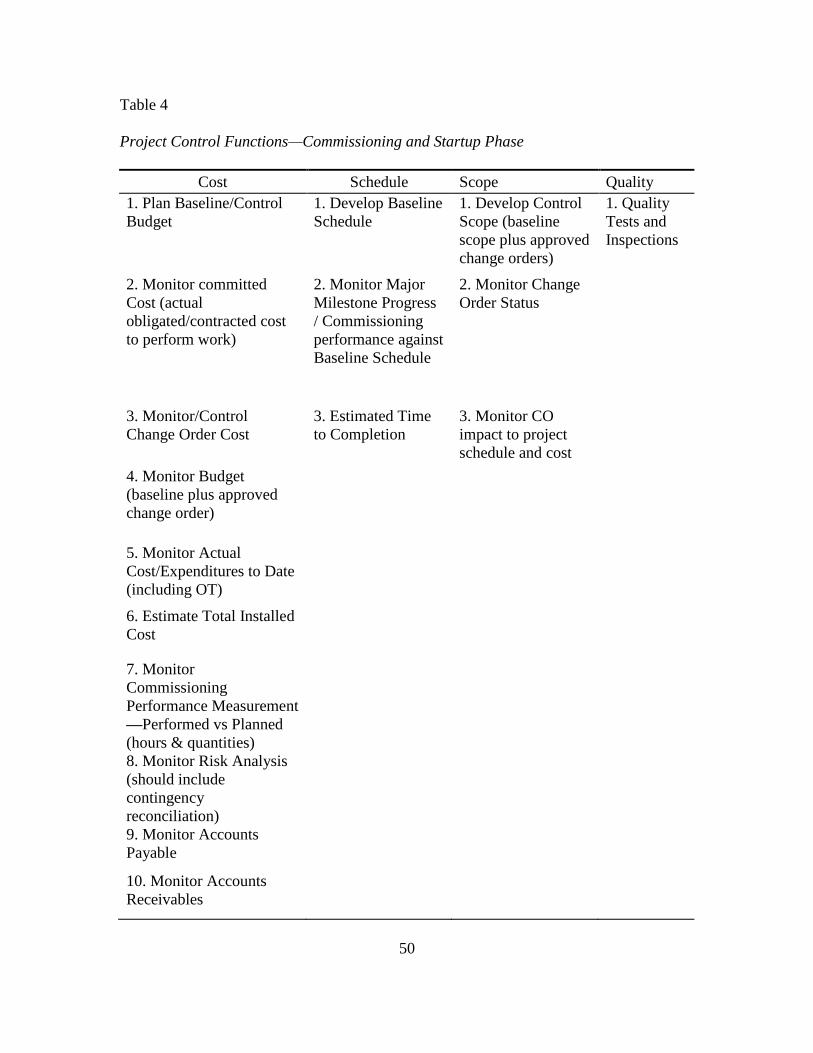
50
Table 4
Project Control Functions—Commissioning and Startup Phase
Cost Schedule Scope Quality
1. Plan Baseline/Control
Budget
1. Develop Baseline
Schedule
1. Develop Control
Scope (baseline
scope plus approved
change orders)
1. Quality
Tests and
Inspections
2. Monitor committed
Cost (actual
obligated/contracted cost
to perform work)
2. Monitor Major
Milestone Progress
/ Commissioning
performance against
Baseline Schedule
2. Monitor Change
Order Status
3. Monitor/Control
Change Order Cost
3. Estimated Time
to Completion
3. Monitor CO
impact to project
schedule and cost
4. Monitor Budget
(baseline plus approved
change order)
5. Monitor Actual
Cost/Expenditures to Date
(including OT)
6. Estimate Total Installed
Cost
7. Monitor
Commissioning
Performance Measurement
—Performed vs Planned
(hours & quantities)
8. Monitor Risk Analysis
(should include
contingency
reconciliation)
9. Monitor Accounts
Payable
10. Monitor Accounts
Receivables
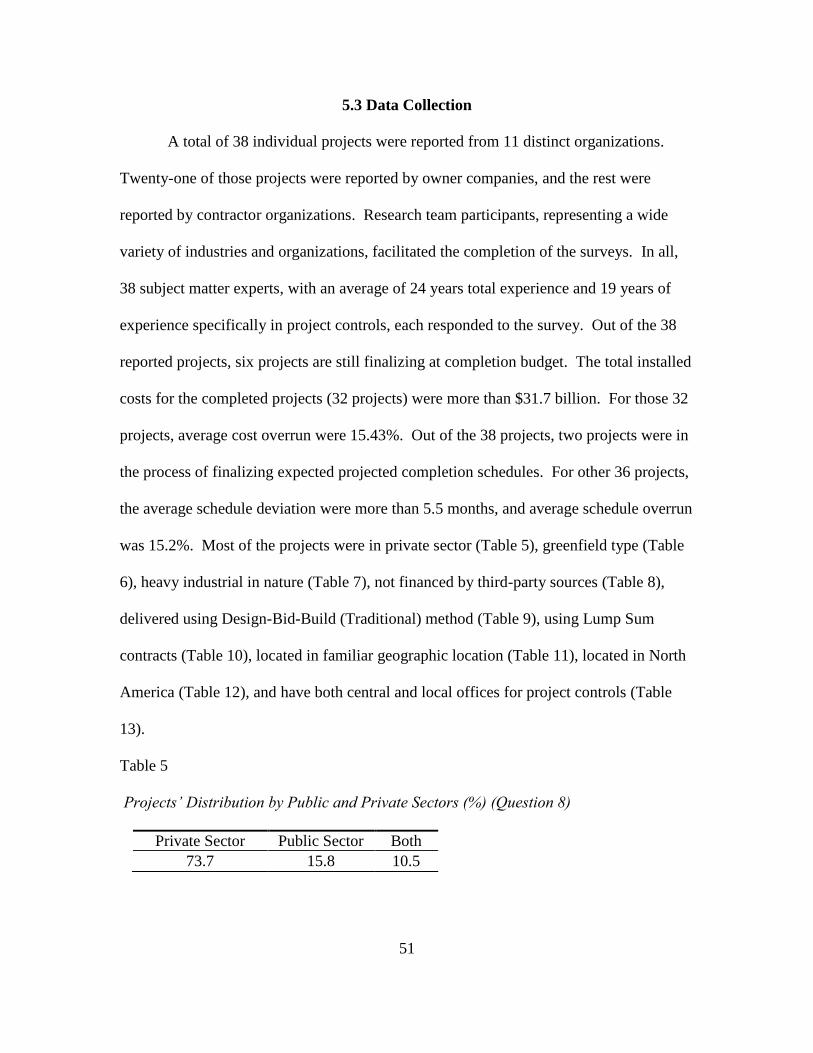
51
5.3 Data Collection
A total of 38 individual projects were reported from 11 distinct organizations.
Twenty-one of those projects were reported by owner companies, and the rest were
reported by contractor organizations. Research team participants, representing a wide
variety of industries and organizations, facilitated the completion of the surveys. In all,
38 subject matter experts, with an average of 24 years total experience and 19 years of
experience specifically in project controls, each responded to the survey. Out of the 38
reported projects, six projects are still finalizing at completion budget. The total installed
costs for the completed projects (32 projects) were more than $31.7 billion. For those 32
projects, average cost overrun were 15.43%. Out of the 38 projects, two projects were in
the process of finalizing expected projected completion schedules. For other 36 projects,
the average schedule deviation were more than 5.5 months, and average schedule overrun
was 15.2%. Most of the projects were in private sector (Table 5), greenfield type (Table
6), heavy industrial in nature (Table 7), not financed by third-party sources (Table 8),
delivered using Design-Bid-Build (Traditional) method (Table 9), using Lump Sum
contracts (Table 10), located in familiar geographic location (Table 11), located in North
America (Table 12), and have both central and local offices for project controls (Table
13).
Table 5
Projects’ Distribution by Public and Private Sectors (%) (Question 8)
Private Sector Public Sector Both
73.7 15.8 10.5
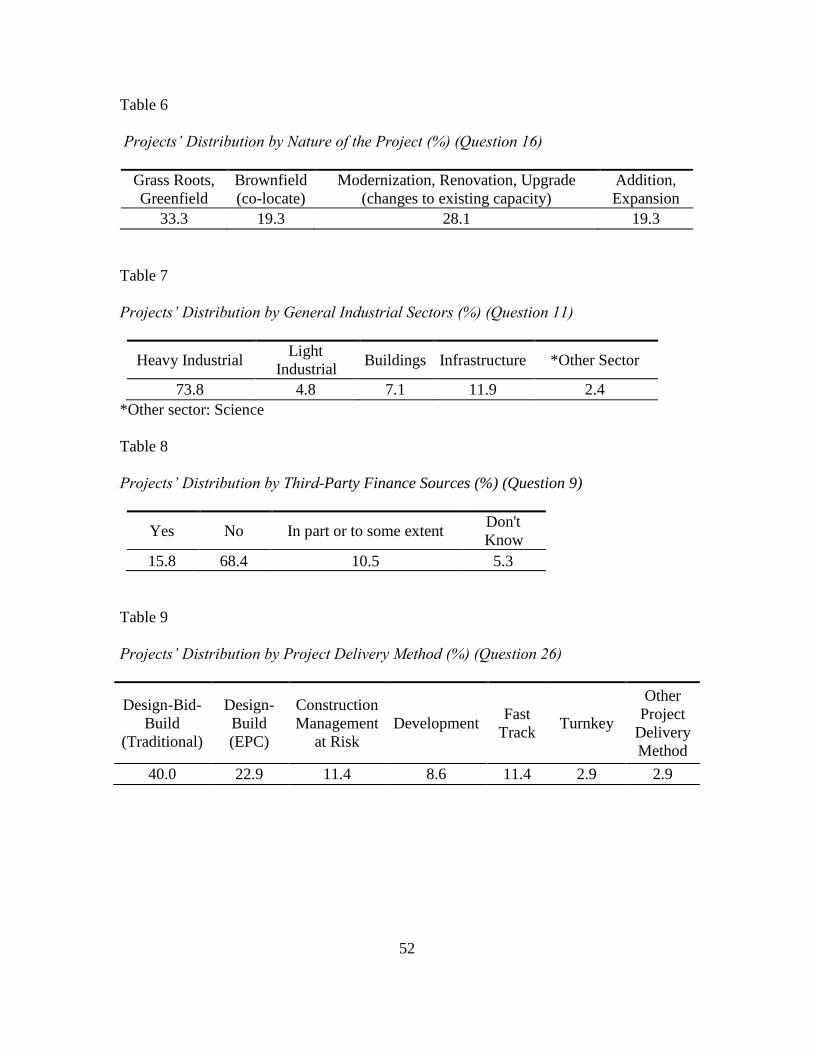
52
Table 6
Projects’ Distribution by Nature of the Project (%) (Question 16)
Grass Roots,
Greenfield
Brownfield
(co-locate)
Modernization, Renovation, Upgrade
(changes to existing capacity)
Addition,
Expansion
33.3 19.3 28.1 19.3
Table 7
Projects’ Distribution by General Industrial Sectors (%) (Question 11)
Heavy Industrial Light
Industrial Buildings Infrastructure *Other Sector
73.8 4.8 7.1 11.9 2.4
*Other sector: Science
Table 8
Projects’ Distribution by Third-Party Finance Sources (%) (Question 9)
Yes No In part or to some extent Don't
Know
15.8 68.4 10.5 5.3
Table 9
Projects’ Distribution by Project Delivery Method (%) (Question 26)
Design-Bid-
Build
(Traditional)
Design-
Build
(EPC)
Construction
Management
at Risk
Development Fast
Track Turnkey
Other
Project
Delivery
Method
40.0 22.9 11.4 8.6 11.4 2.9 2.9
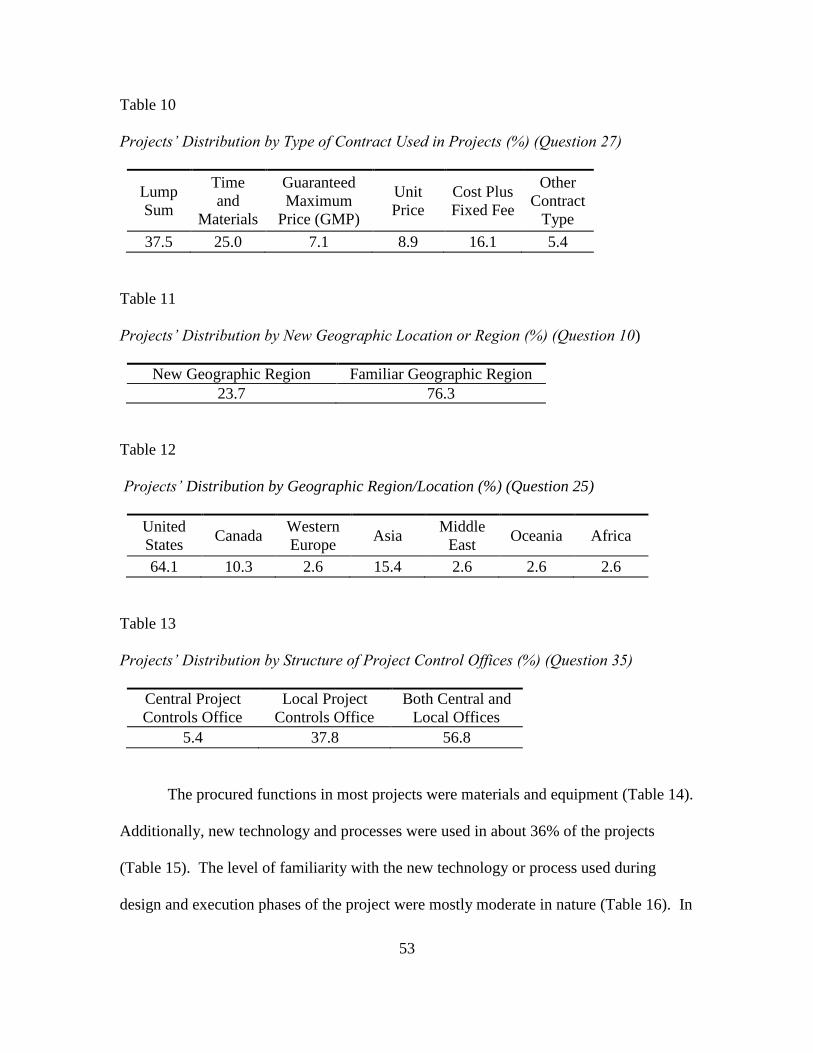
53
Table 10
Projects’ Distribution by Type of Contract Used in Projects (%) (Question 27)
Lump
Sum
Time
and
Materials
Guaranteed
Maximum
Price (GMP)
Unit
Price
Cost Plus
Fixed Fee
Other
Contract
Type
37.5 25.0 7.1 8.9 16.1 5.4
Table 11
Projects’ Distribution by New Geographic Location or Region (%) (Question 10)
New Geographic Region Familiar Geographic Region
23.7 76.3
Table 12
Projects’ Distribution by Geographic Region/Location (%) (Question 25)
United
States Canada
Western
Europe Asia
Middle
East Oceania Africa
64.1 10.3 2.6 15.4 2.6 2.6 2.6
Table 13
Projects’ Distribution by Structure of Project Control Offices (%) (Question 35)
Central Project
Controls Office
Local Project
Controls Office
Both Central and
Local Offices
5.4 37.8 56.8
The procured functions in most projects were materials and equipment (Table 14).
Additionally, new technology and processes were used in about 36% of the projects
(Table 15). The level of familiarity with the new technology or process used during
design and execution phases of the project were mostly moderate in nature (Table 16). In
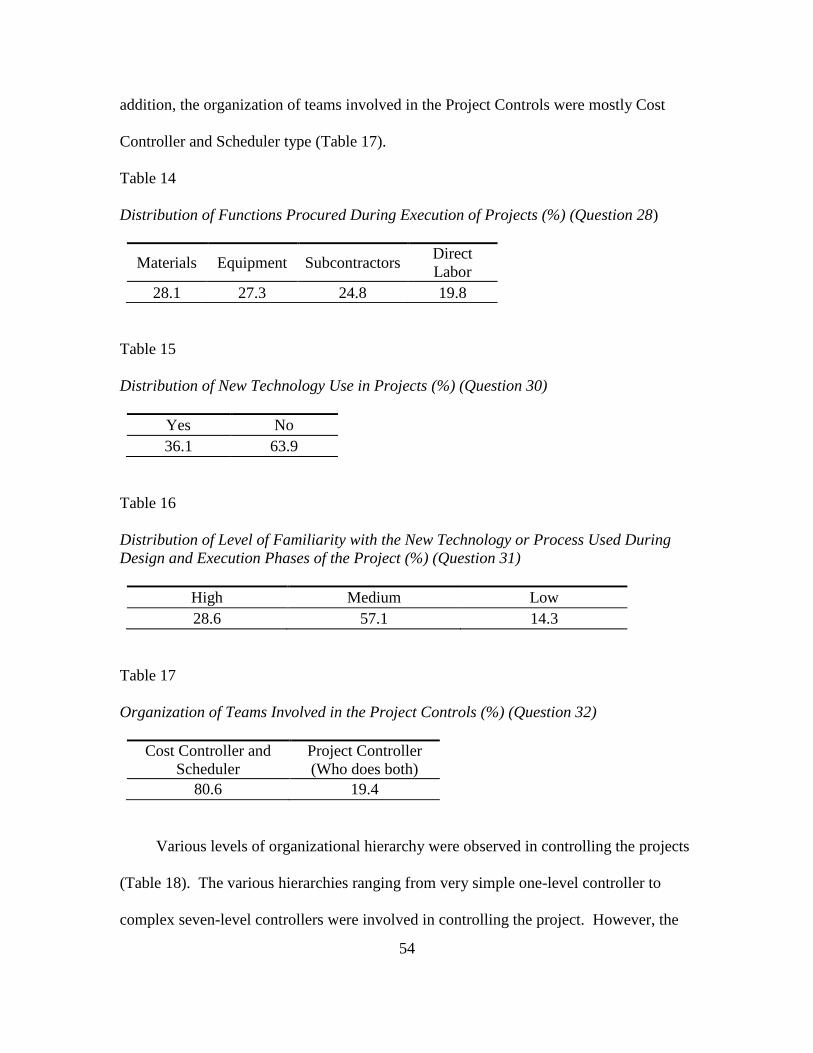
54
addition, the organization of teams involved in the Project Controls were mostly Cost
Controller and Scheduler type (Table 17).
Table 14
Distribution of Functions Procured During Execution of Projects (%) (Question 28)
Materials Equipment Subcontractors Direct
Labor
28.1 27.3 24.8 19.8
Table 15
Distribution of New Technology Use in Projects (%) (Question 30)
Yes No
36.1 63.9
Table 16
Distribution of Level of Familiarity with the New Technology or Process Used During
Design and Execution Phases of the Project (%) (Question 31)
High Medium Low
28.6 57.1 14.3
Table 17
Organization of Teams Involved in the Project Controls (%) (Question 32)
Cost Controller and
Scheduler
Project Controller
(Who does both)
80.6 19.4
Various levels of organizational hierarchy were observed in controlling the projects
(Table 18). The various hierarchies ranging from very simple one-level controller to
complex seven-level controllers were involved in controlling the project. However, the
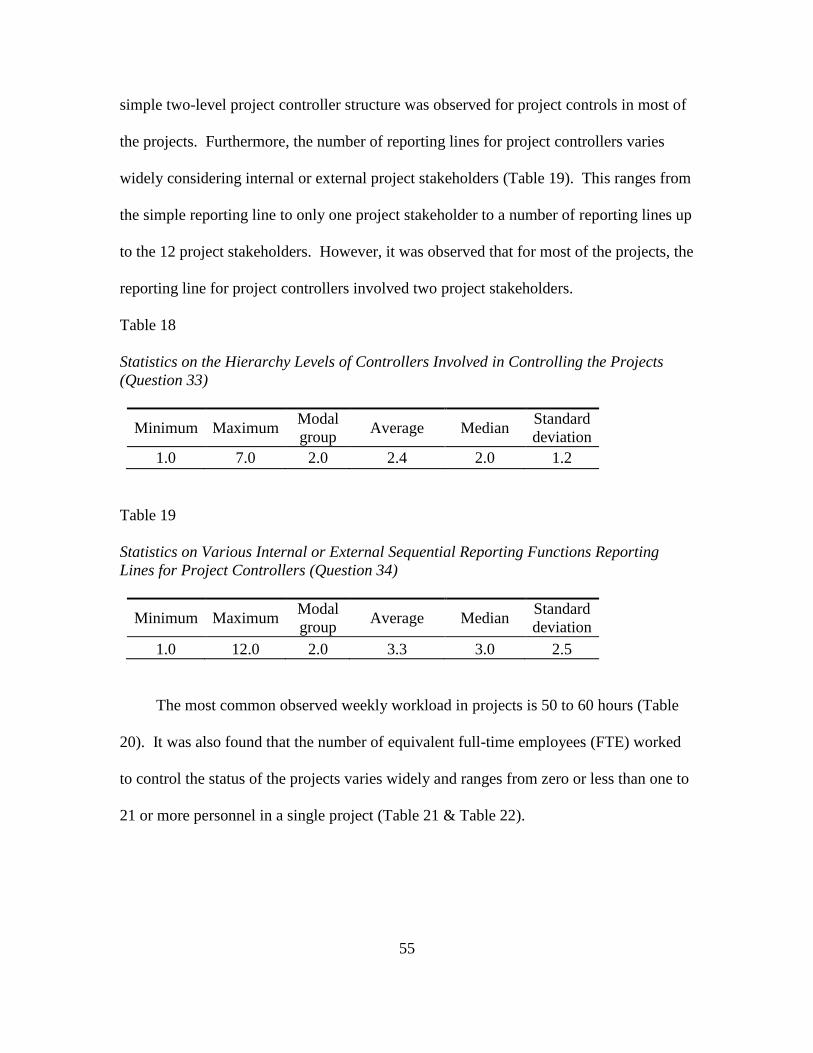
55
simple two-level project controller structure was observed for project controls in most of
the projects. Furthermore, the number of reporting lines for project controllers varies
widely considering internal or external project stakeholders (Table 19). This ranges from
the simple reporting line to only one project stakeholder to a number of reporting lines up
to the 12 project stakeholders. However, it was observed that for most of the projects, the
reporting line for project controllers involved two project stakeholders.
Table 18
Statistics on the Hierarchy Levels of Controllers Involved in Controlling the Projects
(Question 33)
Minimum Maximum Modal
group Average Median
Standard
deviation
1.0 7.0 2.0 2.4 2.0 1.2
Table 19
Statistics on Various Internal or External Sequential Reporting Functions Reporting
Lines for Project Controllers (Question 34)
Minimum Maximum Modal
group Average Median
Standard
deviation
1.0 12.0 2.0 3.3 3.0 2.5
The most common observed weekly workload in projects is 50 to 60 hours (Table
20). It was also found that the number of equivalent full-time employees (FTE) worked
to control the status of the projects varies widely and ranges from zero or less than one to
21 or more personnel in a single project (Table 21 & Table 22).
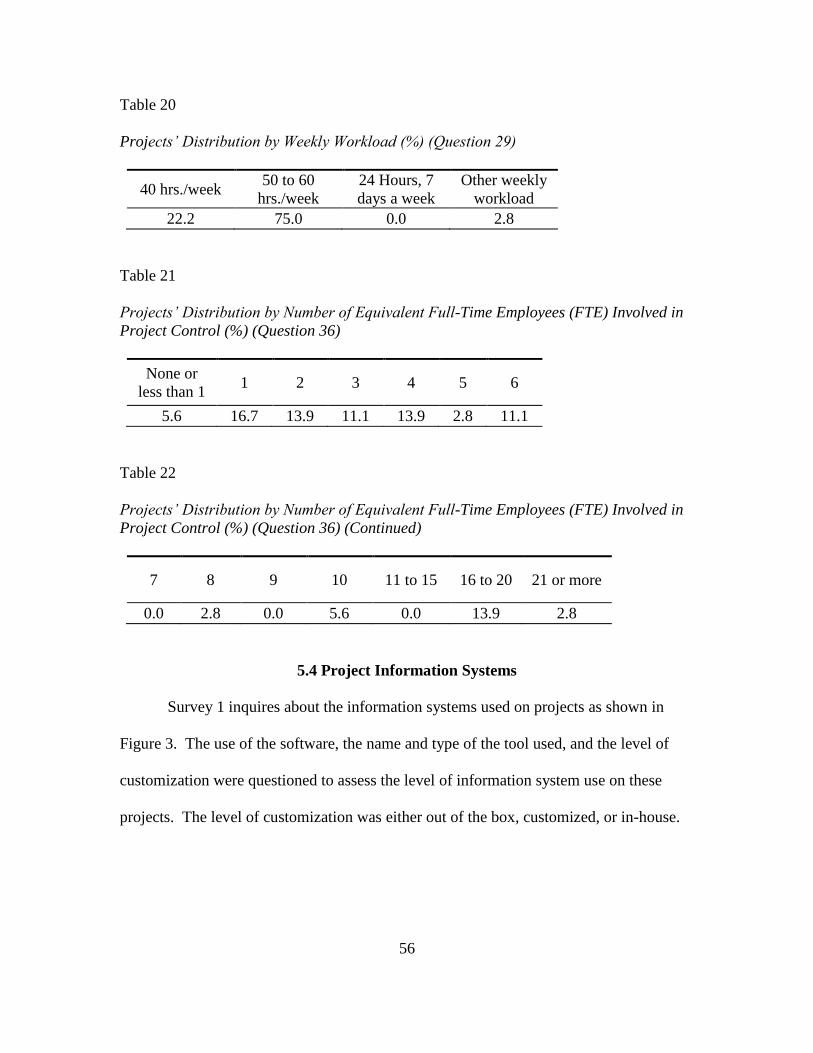
56
Table 20
Projects’ Distribution by Weekly Workload (%) (Question 29)
40 hrs./week 50 to 60
hrs./week
24 Hours, 7
days a week
Other weekly
workload
22.2 75.0 0.0 2.8
Table 21
Projects’ Distribution by Number of Equivalent Full-Time Employees (FTE) Involved in
Project Control (%) (Question 36)
None or
less than 1 1 2 3 4 5 6
5.6 16.7 13.9 11.1 13.9 2.8 11.1
Table 22
Projects’ Distribution by Number of Equivalent Full-Time Employees (FTE) Involved in
Project Control (%) (Question 36) (Continued)
7 8 9 10 11 to 15 16 to 20 21 or more
0.0 2.8 0.0 5.6 0.0 13.9 2.8
5.4 Project Information Systems
Survey 1 inquires about the information systems used on projects as shown in
Figure 3. The use of the software, the name and type of the tool used, and the level of
customization were questioned to assess the level of information system use on these
projects. The level of customization was either out of the box, customized, or in-house.
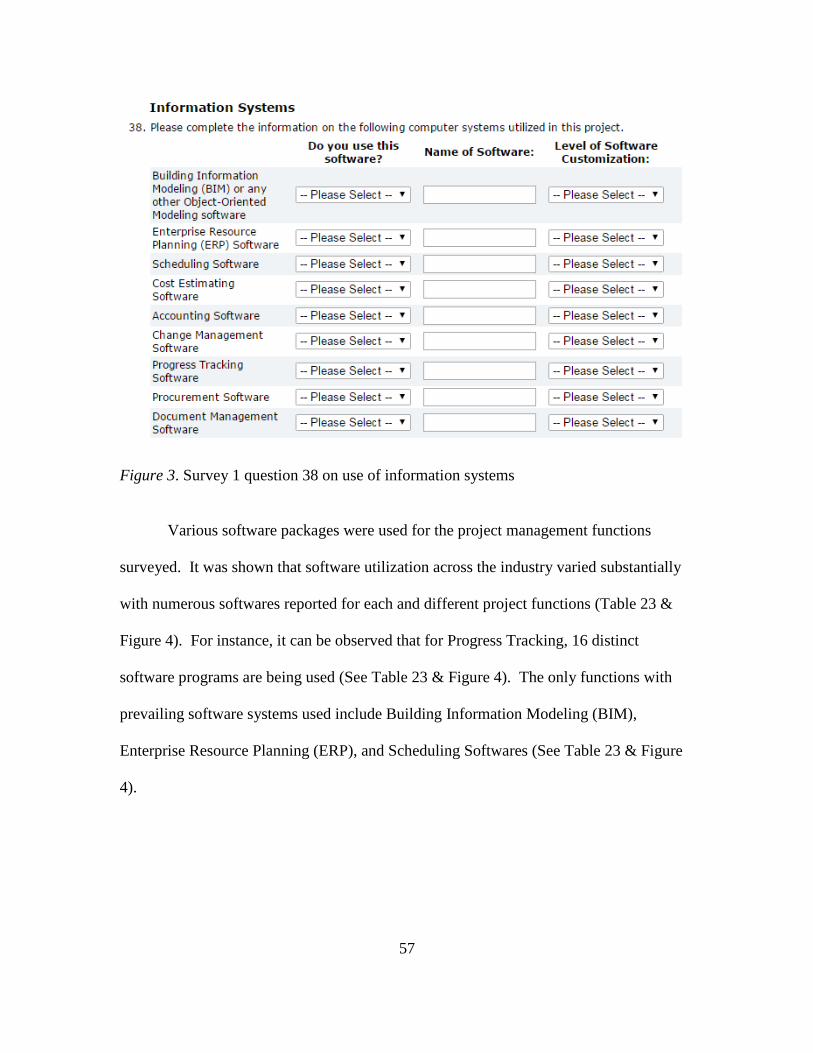
57
Figure 3. Survey 1 question 38 on use of information systems
Various software packages were used for the project management functions
surveyed. It was shown that software utilization across the industry varied substantially
with numerous softwares reported for each and different project functions (Table 23 &
Figure 4). For instance, it can be observed that for Progress Tracking, 16 distinct
software programs are being used (See Table 23 & Figure 4). The only functions with
prevailing software systems used include Building Information Modeling (BIM),
Enterprise Resource Planning (ERP), and Scheduling Softwares (See Table 23 & Figure
4).
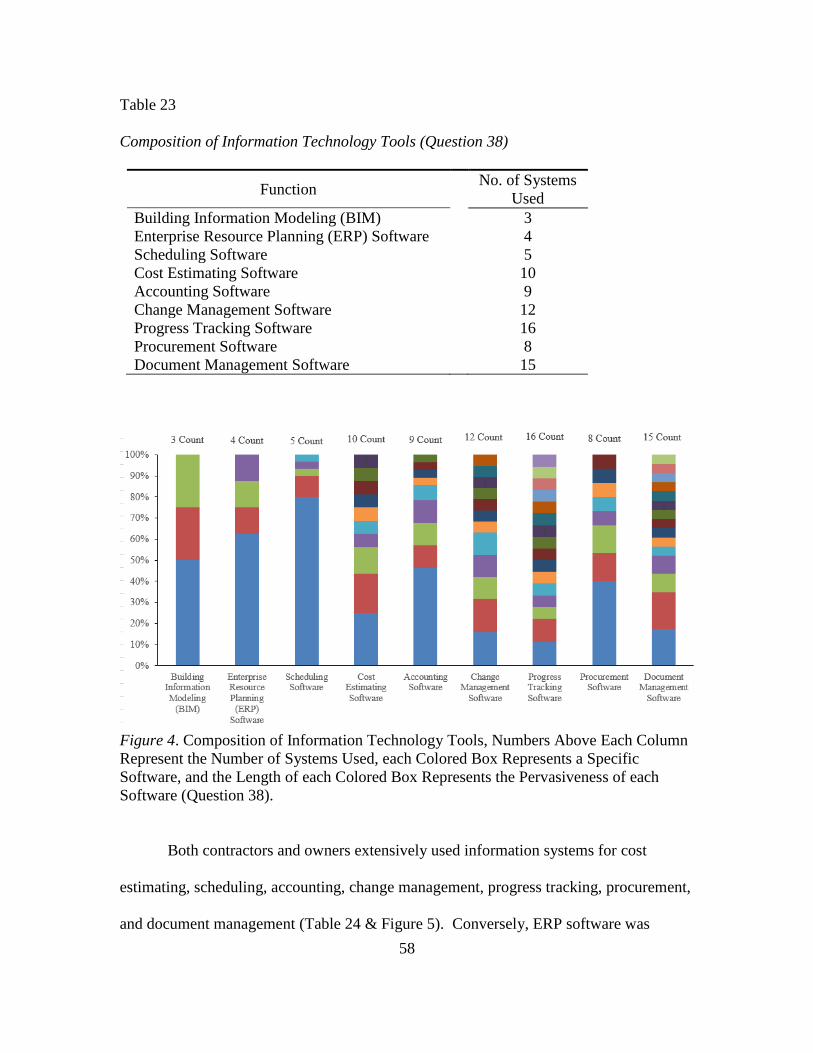
58
Table 23
Composition of Information Technology Tools (Question 38)
Function No. of Systems
Used
Building Information Modeling (BIM) 3
Enterprise Resource Planning (ERP) Software 4
Scheduling Software 5
Cost Estimating Software 10
Accounting Software 9
Change Management Software 12
Progress Tracking Software 16
Procurement Software 8
Document Management Software 15
Figure 4. Composition of Information Technology Tools, Numbers Above Each Column
Represent the Number of Systems Used, each Colored Box Represents a Specific
Software, and the Length of each Colored Box Represents the Pervasiveness of each
Software (Question 38).
Both contractors and owners extensively used information systems for cost
estimating, scheduling, accounting, change management, progress tracking, procurement,
and document management (Table 24 & Figure 5). Conversely, ERP software was
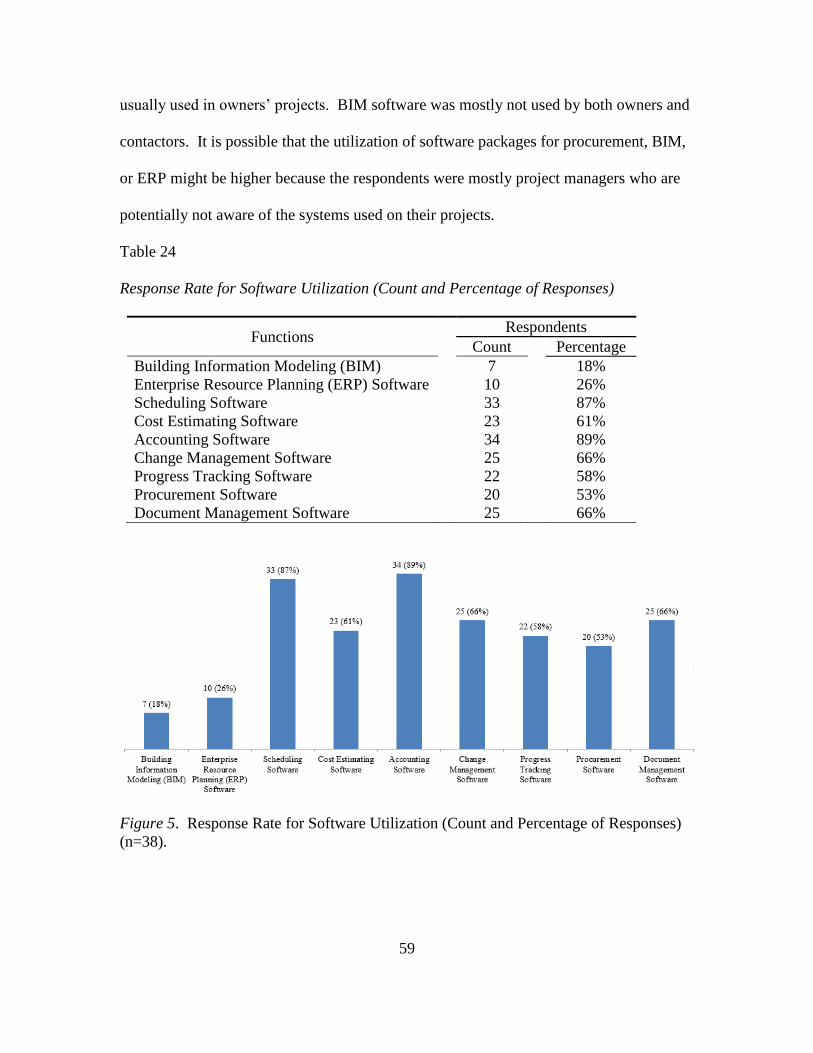
59
usually used in owners’ projects. BIM software was mostly not used by both owners and
contactors. It is possible that the utilization of software packages for procurement, BIM,
or ERP might be higher because the respondents were mostly project managers who are
potentially not aware of the systems used on their projects.
Table 24
Response Rate for Software Utilization (Count and Percentage of Responses)
Functions Respondents
Count Percentage
Building Information Modeling (BIM) 7 18%
Enterprise Resource Planning (ERP) Software 10 26%
Scheduling Software 33 87%
Cost Estimating Software 23 61%
Accounting Software 34 89%
Change Management Software 25 66%
Progress Tracking Software 22 58%
Procurement Software 20 53%
Document Management Software 25 66%
Figure 5. Response Rate for Software Utilization (Count and Percentage of Responses)
(n=38).
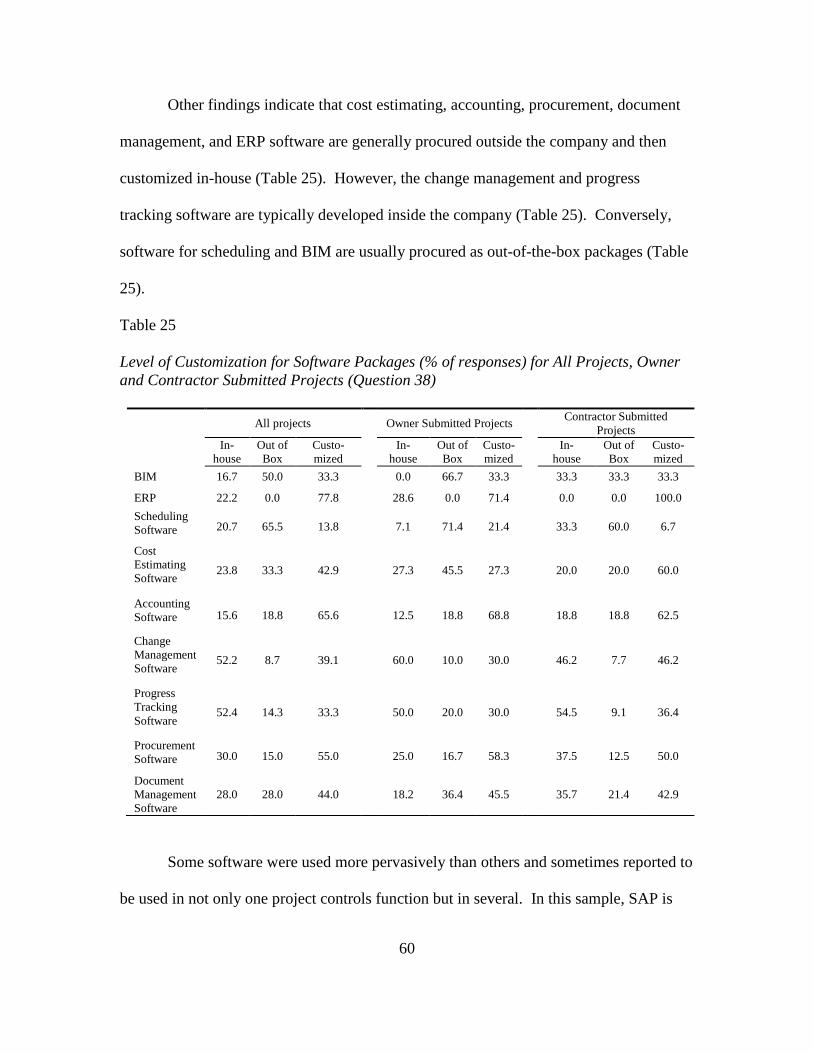
60
Other findings indicate that cost estimating, accounting, procurement, document
management, and ERP software are generally procured outside the company and then
customized in-house (Table 25). However, the change management and progress
tracking software are typically developed inside the company (Table 25). Conversely,
software for scheduling and BIM are usually procured as out-of-the-box packages (Table
25).
Table 25
Level of Customization for Software Packages (% of responses) for All Projects, Owner
and Contractor Submitted Projects (Question 38)
All projects
Owner Submitted Projects Contractor Submitted
Projects
In-
house
Out of
Box
Custo-
mized In-
house
Out of
Box
Custo-
mized In-
house
Out of
Box
Custo-
mized
BIM 16.7 50.0 33.3 0.0 66.7 33.3 33.3 33.3 33.3
ERP 22.2 0.0 77.8 28.6 0.0 71.4 0.0 0.0 100.0
Scheduling
Software 20.7 65.5 13.8
7.1 71.4 21.4
33.3 60.0 6.7
Cost
Estimating
Software 23.8 33.3 42.9
27.3 45.5 27.3
20.0 20.0 60.0
Accounting
Software 15.6 18.8 65.6
12.5 18.8 68.8
18.8 18.8 62.5
Change
Management
Software 52.2 8.7 39.1
60.0 10.0 30.0
46.2 7.7 46.2
Progress
Tracking
Software 52.4 14.3 33.3
50.0 20.0 30.0
54.5 9.1 36.4
Procurement
Software 30.0 15.0 55.0
25.0 16.7 58.3
37.5 12.5 50.0
Document
Management
Software
28.0 28.0 44.0
18.2 36.4 45.5
35.7 21.4 42.9
Some software were used more pervasively than others and sometimes reported to
be used in not only one project controls function but in several. In this sample, SAP is
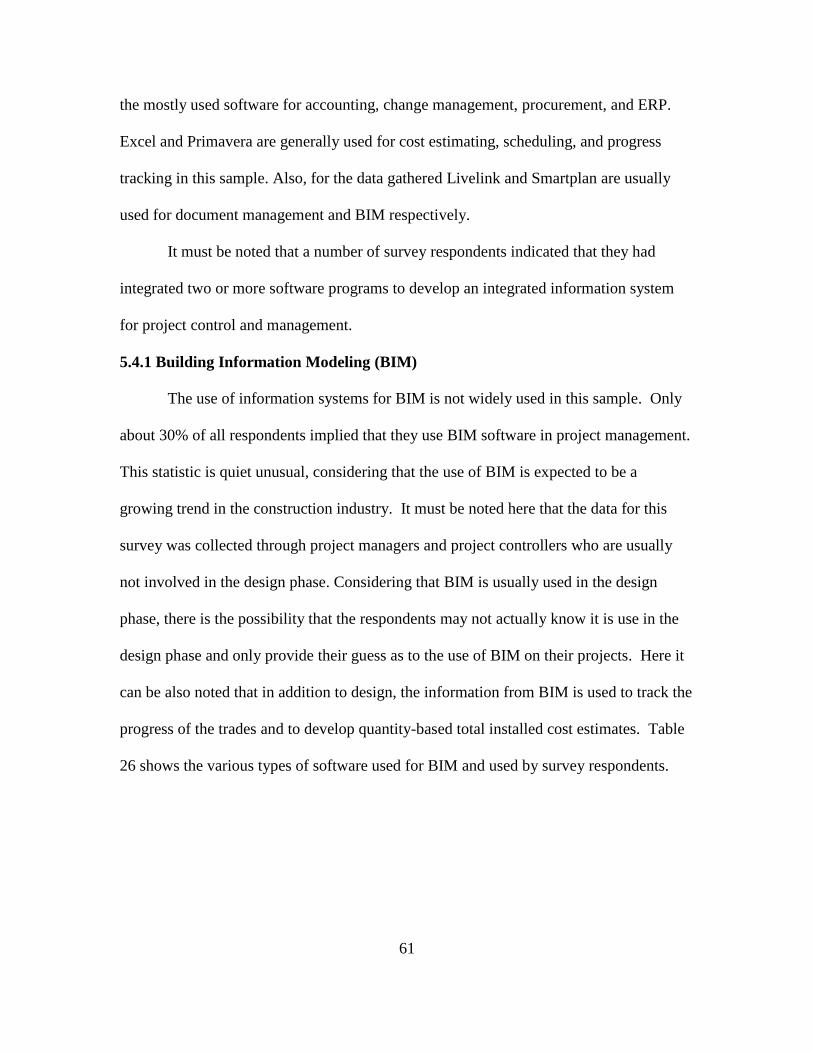
61
the mostly used software for accounting, change management, procurement, and ERP.
Excel and Primavera are generally used for cost estimating, scheduling, and progress
tracking in this sample. Also, for the data gathered Livelink and Smartplan are usually
used for document management and BIM respectively.
It must be noted that a number of survey respondents indicated that they had
integrated two or more software programs to develop an integrated information system
for project control and management.
5.4.1 Building Information Modeling (BIM)
The use of information systems for BIM is not widely used in this sample. Only
about 30% of all respondents implied that they use BIM software in project management.
This statistic is quiet unusual, considering that the use of BIM is expected to be a
growing trend in the construction industry. It must be noted here that the data for this
survey was collected through project managers and project controllers who are usually
not involved in the design phase. Considering that BIM is usually used in the design
phase, there is the possibility that the respondents may not actually know it is use in the
design phase and only provide their guess as to the use of BIM on their projects. Here it
can be also noted that in addition to design, the information from BIM is used to track the
progress of the trades and to develop quantity-based total installed cost estimates. Table
26 shows the various types of software used for BIM and used by survey respondents.

62
Table 26
Building Information Modeling Software Used by Survey Respondents (n=7)
Software Technology Count
Smartplan 2
Revit 1
Microstation 1
Currently, most of the BIM software is purchased from the professional software
developing companies for in-house use by construction firms (Table 27).
Table 27
Respondents’ Opinions on BIM Software Customization (by % of Responses) (n=6)
In House Out of Box Customized
16.7 50.0 33.3
5.4.2 Enterprise Resource Planning (ERP)
ERP is a suite of integrated business management packages, and the analysis of
the survey results reveal that only 26% of all respondents use some sort of ERP software.
The construction industry is fragmented; thus, the use of ERP software for construction
business management and corresponding integration of various information systems is
uncommon in this sample. Table 28 shows the various types of software used for ERP by
the survey respondents.
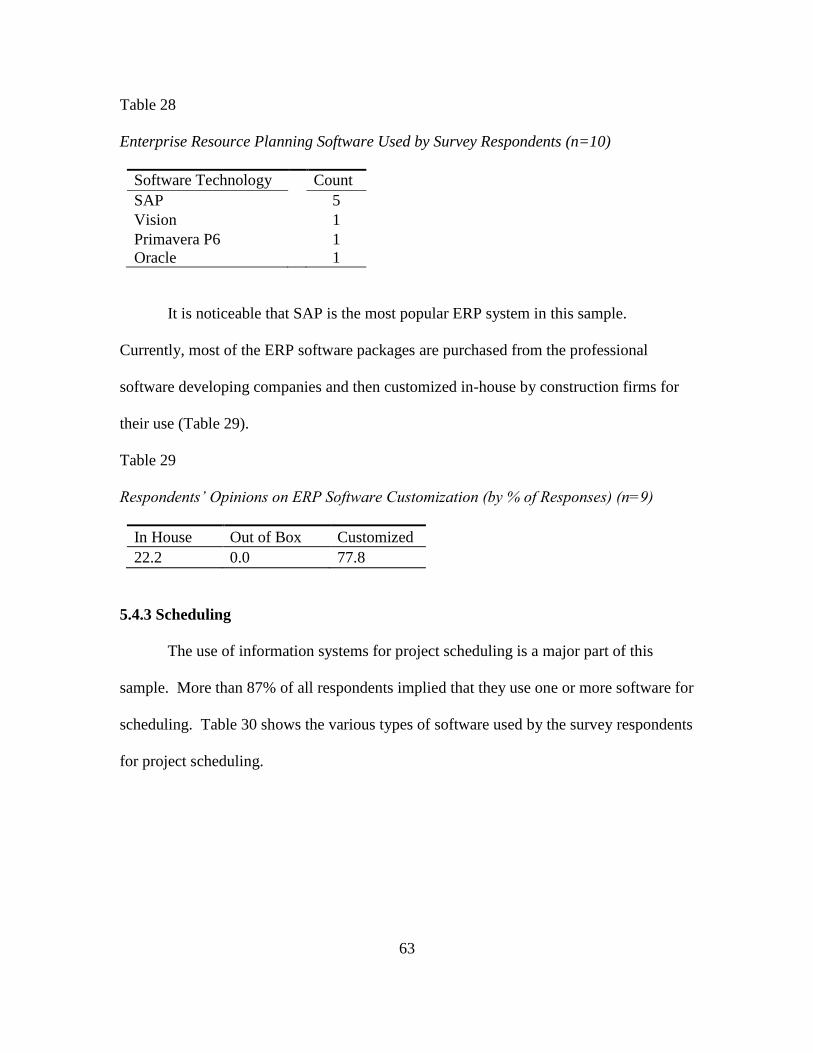
63
Table 28
Enterprise Resource Planning Software Used by Survey Respondents (n=10)
Software Technology Count
SAP 5
Vision 1
Primavera P6 1
Oracle 1
It is noticeable that SAP is the most popular ERP system in this sample.
Currently, most of the ERP software packages are purchased from the professional
software developing companies and then customized in-house by construction firms for
their use (Table 29).
Table 29
Respondents’ Opinions on ERP Software Customization (by % of Responses) (n=9)
In House Out of Box Customized
22.2 0.0 77.8
5.4.3 Scheduling
The use of information systems for project scheduling is a major part of this
sample. More than 87% of all respondents implied that they use one or more software for
scheduling. Table 30 shows the various types of software used by the survey respondents
for project scheduling.
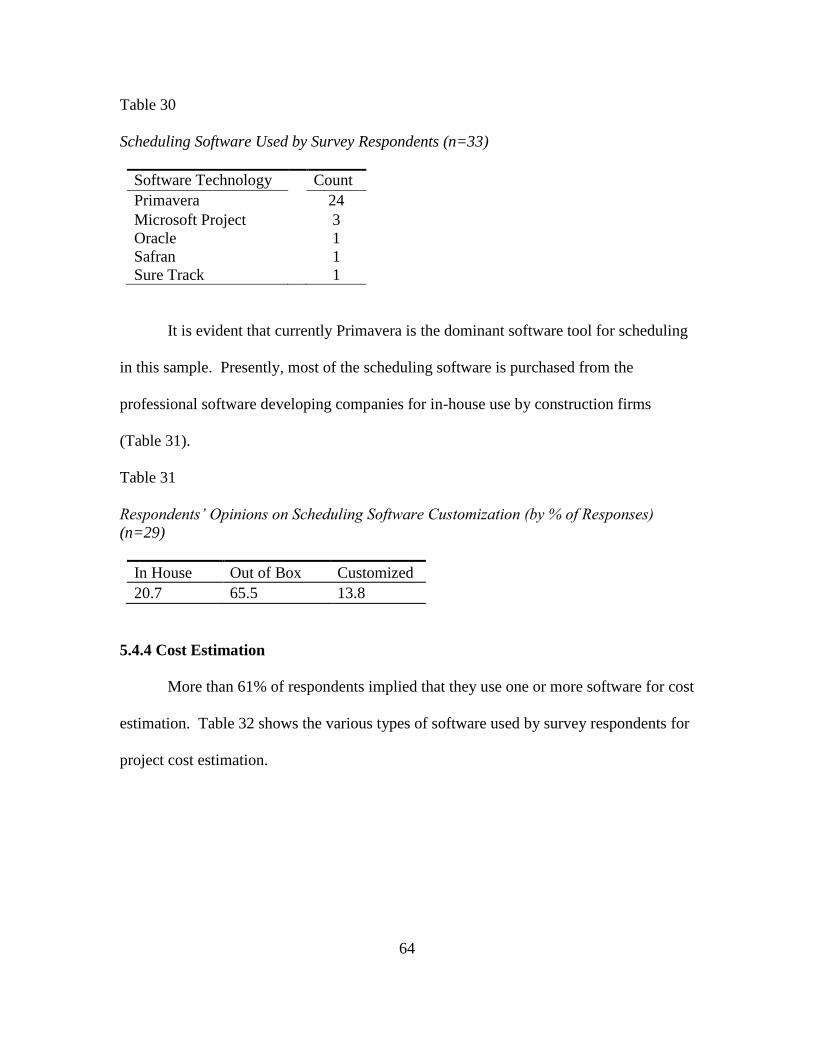
64
Table 30
Scheduling Software Used by Survey Respondents (n=33)
Software Technology Count
Primavera 24
Microsoft Project 3
Oracle 1
Safran 1
Sure Track 1
It is evident that currently Primavera is the dominant software tool for scheduling
in this sample. Presently, most of the scheduling software is purchased from the
professional software developing companies for in-house use by construction firms
(Table 31).
Table 31
Respondents’ Opinions on Scheduling Software Customization (by % of Responses)
(n=29)
In House Out of Box Customized
20.7 65.5 13.8
5.4.4 Cost Estimation
More than 61% of respondents implied that they use one or more software for cost
estimation. Table 32 shows the various types of software used by survey respondents for
project cost estimation.
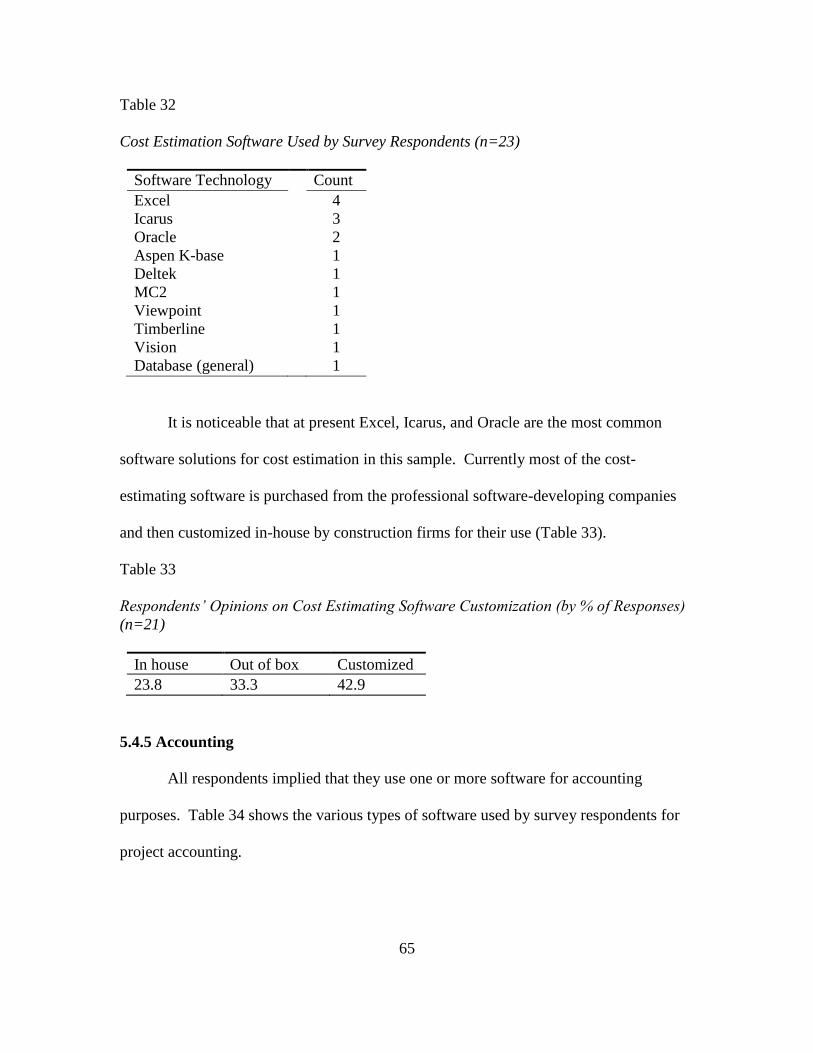
65
Table 32
Cost Estimation Software Used by Survey Respondents (n=23)
Software Technology Count
Excel 4
Icarus 3
Oracle 2
Aspen K-base 1
Deltek 1
MC2 1
Viewpoint 1
Timberline 1
Vision 1
Database (general) 1
It is noticeable that at present Excel, Icarus, and Oracle are the most common
software solutions for cost estimation in this sample. Currently most of the cost-
estimating software is purchased from the professional software-developing companies
and then customized in-house by construction firms for their use (Table 33).
Table 33
Respondents’ Opinions on Cost Estimating Software Customization (by % of Responses)
(n=21)
In house Out of box Customized
23.8 33.3 42.9
5.4.5 Accounting
All respondents implied that they use one or more software for accounting
purposes. Table 34 shows the various types of software used by survey respondents for
project accounting.
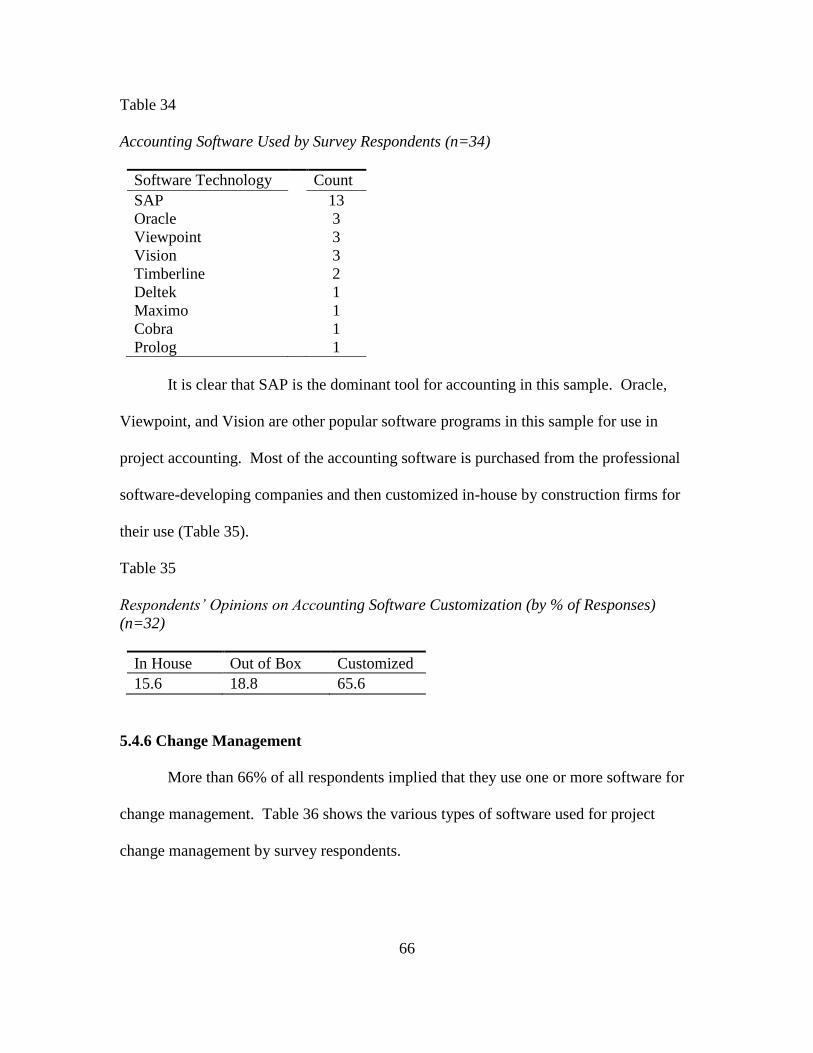
66
Table 34
Accounting Software Used by Survey Respondents (n=34)
Software Technology Count
SAP 13
Oracle 3
Viewpoint 3
Vision 3
Timberline 2
Deltek 1
Maximo 1
Cobra 1
Prolog 1
It is clear that SAP is the dominant tool for accounting in this sample. Oracle,
Viewpoint, and Vision are other popular software programs in this sample for use in
project accounting. Most of the accounting software is purchased from the professional
software-developing companies and then customized in-house by construction firms for
their use (Table 35).
Table 35
Respondents’ Opinions on Accounting Software Customization (by % of Responses)
(n=32)
In House Out of Box Customized
15.6 18.8 65.6
5.4.6 Change Management
More than 66% of all respondents implied that they use one or more software for
change management. Table 36 shows the various types of software used for project
change management by survey respondents.
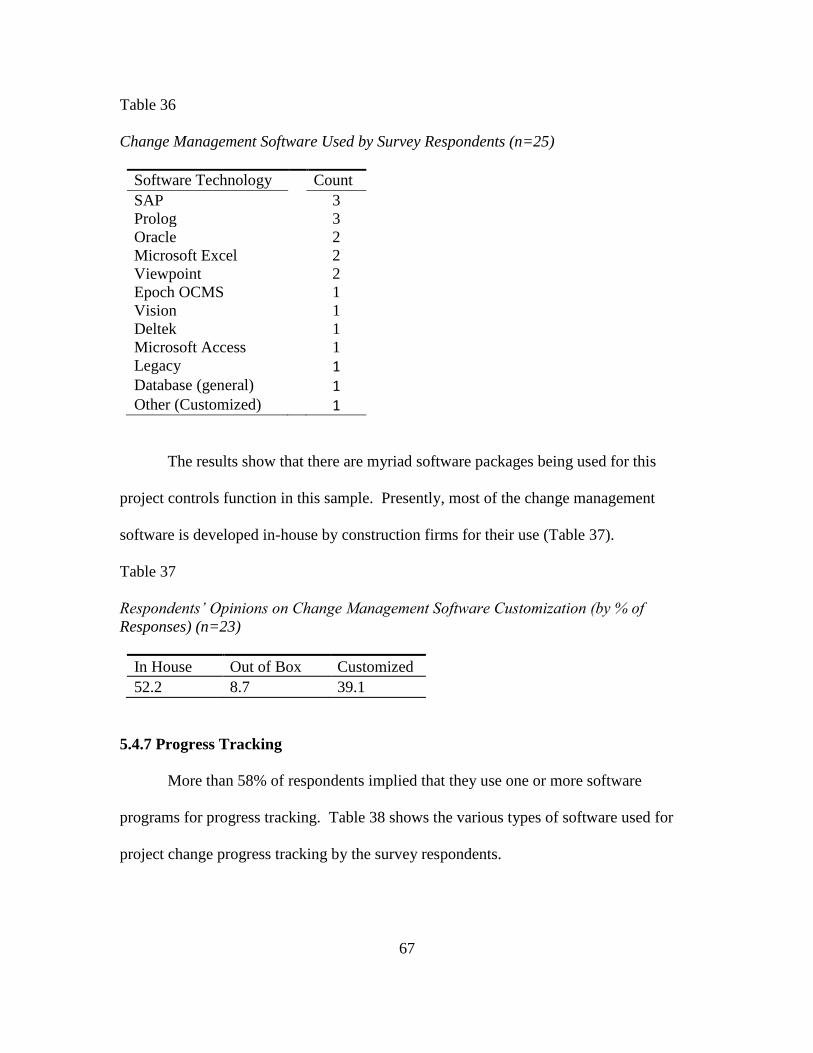
67
Table 36
Change Management Software Used by Survey Respondents (n=25)
Software Technology Count
SAP 3
Prolog 3
Oracle 2
Microsoft Excel 2
Viewpoint 2
Epoch OCMS 1
Vision 1
Deltek 1
Microsoft Access 1
Legacy 1 Database (general) 1 Other (Customized) 1
The results show that there are myriad software packages being used for this
project controls function in this sample. Presently, most of the change management
software is developed in-house by construction firms for their use (Table 37).
Table 37
Respondents’ Opinions on Change Management Software Customization (by % of
Responses) (n=23)
In House Out of Box Customized
52.2 8.7 39.1
5.4.7 Progress Tracking
More than 58% of respondents implied that they use one or more software
programs for progress tracking. Table 38 shows the various types of software used for
project change progress tracking by the survey respondents.
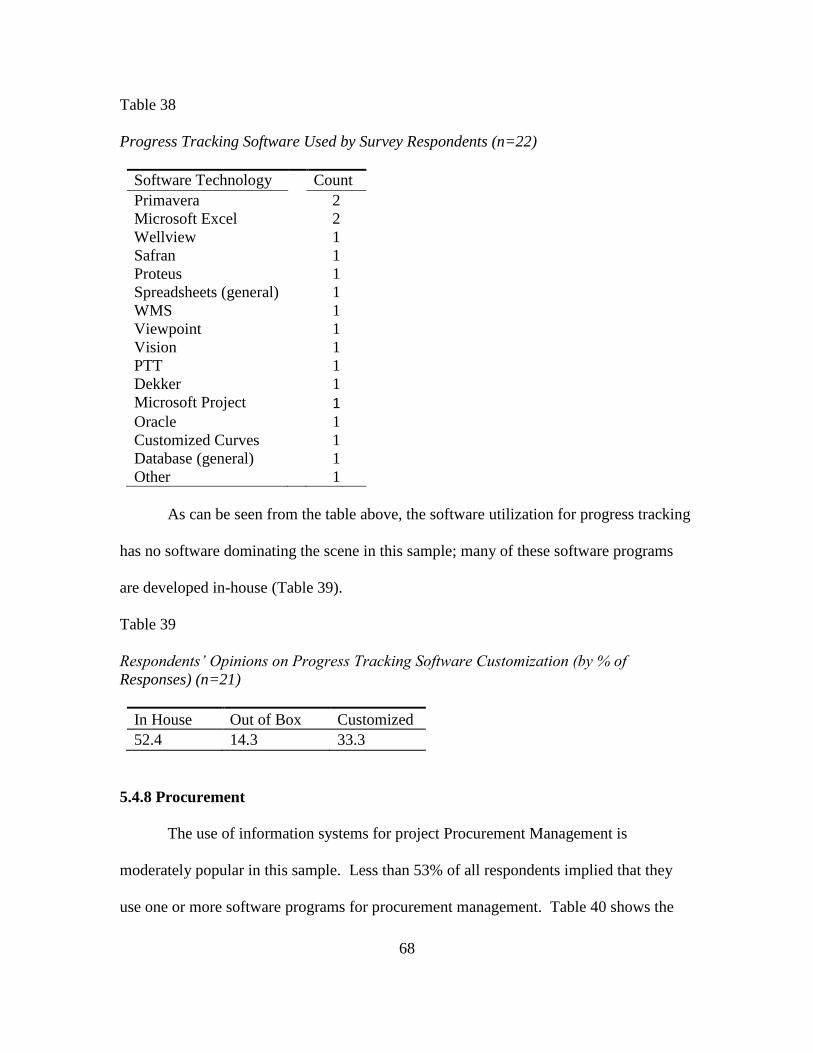
68
Table 38
Progress Tracking Software Used by Survey Respondents (n=22)
Software Technology Count
Primavera 2
Microsoft Excel 2
Wellview 1
Safran 1
Proteus 1
Spreadsheets (general) 1
WMS 1
Viewpoint 1
Vision 1
PTT 1
Dekker 1
Microsoft Project 1 Oracle 1
Customized Curves 1
Database (general) 1
Other 1
As can be seen from the table above, the software utilization for progress tracking
has no software dominating the scene in this sample; many of these software programs
are developed in-house (Table 39).
Table 39
Respondents’ Opinions on Progress Tracking Software Customization (by % of
Responses) (n=21)
In House Out of Box Customized
52.4 14.3 33.3
5.4.8 Procurement
The use of information systems for project Procurement Management is
moderately popular in this sample. Less than 53% of all respondents implied that they
use one or more software programs for procurement management. Table 40 shows the
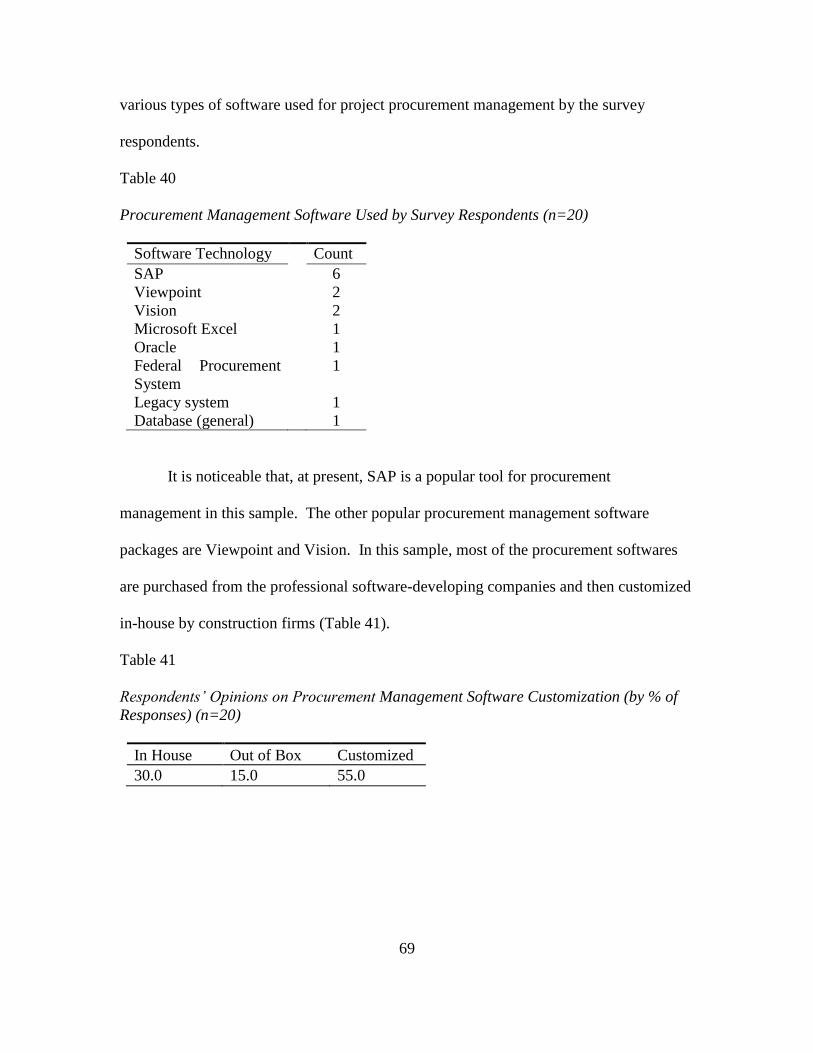
69
various types of software used for project procurement management by the survey
respondents.
Table 40
Procurement Management Software Used by Survey Respondents (n=20)
Software Technology Count
SAP 6
Viewpoint 2
Vision 2
Microsoft Excel 1
Oracle 1
Federal Procurement
System
1
Legacy system 1
Database (general) 1
It is noticeable that, at present, SAP is a popular tool for procurement
management in this sample. The other popular procurement management software
packages are Viewpoint and Vision. In this sample, most of the procurement softwares
are purchased from the professional software-developing companies and then customized
in-house by construction firms (Table 41).
Table 41
Respondents’ Opinions on Procurement Management Software Customization (by % of
Responses) (n=20)
In House Out of Box Customized
30.0 15.0 55.0
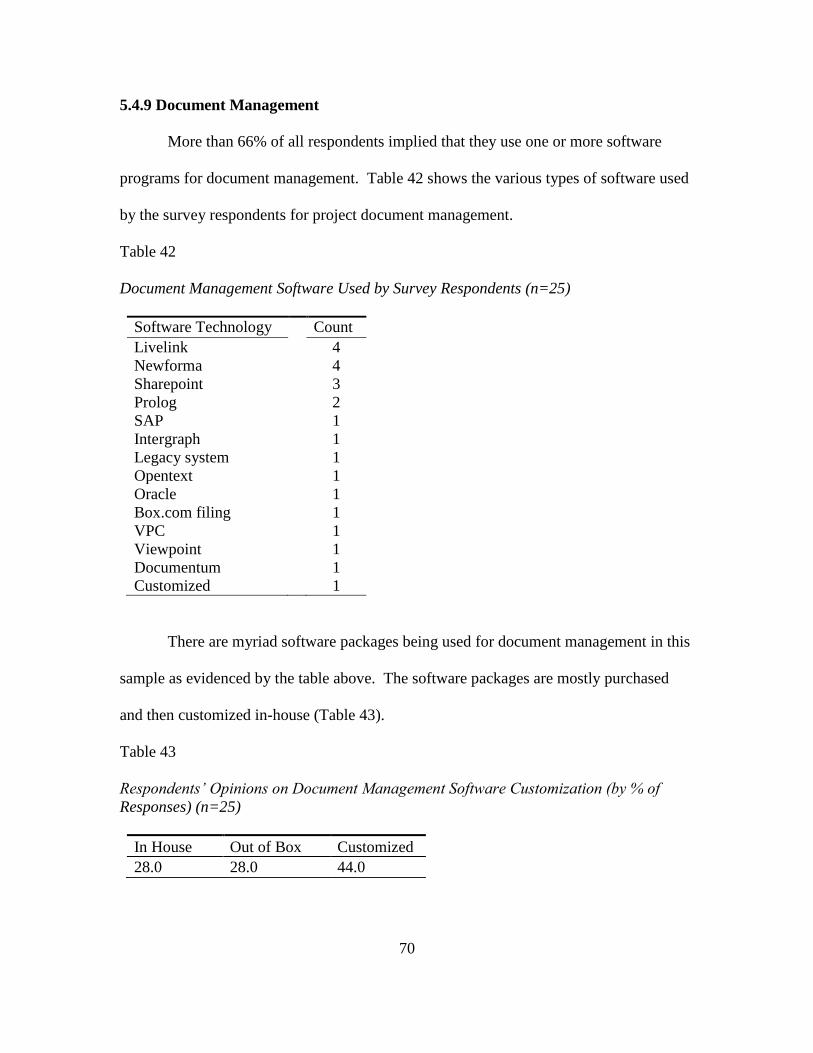
70
5.4.9 Document Management
More than 66% of all respondents implied that they use one or more software
programs for document management. Table 42 shows the various types of software used
by the survey respondents for project document management.
Table 42
Document Management Software Used by Survey Respondents (n=25)
Software Technology Count
Livelink 4
Newforma 4
Sharepoint 3
Prolog 2
SAP 1
Intergraph 1
Legacy system 1
Opentext 1
Oracle 1
Box.com filing 1
VPC 1
Viewpoint 1
Documentum 1
Customized 1
There are myriad software packages being used for document management in this
sample as evidenced by the table above. The software packages are mostly purchased
and then customized in-house (Table 43).
Table 43
Respondents’ Opinions on Document Management Software Customization (by % of
Responses) (n=25)
In House Out of Box Customized
28.0 28.0 44.0
71
5.4.10 Integration of Information Systems
In Survey 1 or the batch mode survey, an open-ended question (question 39)
asked about the integration of the aforementioned information systems. Only 40% of
respondents implied that they have connected two or more information systems in their
array of software packages and information systems. A reason for this could be the
fragmented nature of the capital projects industry and the inability of the project
manager/controller to identify each system individually and track whether various
information systems are connected or not.
The current practice of information system integration varies widely.
Organizations in this survey usually customize and integrate their systems at very
rudimentary levels. The most common practice is the integration of two types of
information systems, such as a cost estimation system connected to the accounting
system, an accounting system connected to the change management system, a progress
tracking system connected to the scheduling system, a scheduling system connected to
the cost estimation system, and so on. Some organizations in this survey purchase one
business information system suite and customize it for multiple purposes. The one such
example is the use of SAP for enterprise resource planning, accounting, change
management, procurement, and document management; those various modules of SAP
are interconnected. The other example is the customization of the viewpoint information
system suite for document management, procurement, progress tracking, accounting, cost
estimation, and change management purposes. Sometimes information system
integration is accomplished in a way that data from one information system is used to
feed into several other information systems. In this case, a number of information
72
systems are connected to one master information system. Thus, if there is a new input or
update of information in the master information system, there will be corresponding
updates in other information systems. In addition, information systems are customized
and interconnected to access via one interface. Also, it is perceived from this survey that
at this time the integration of BIM and project control information is not popular and is
still at its infancy stage for this sample (question 40).
5.5 Reporting Frequencies
The analysis of the collected data revealed that today’s industry practices can best be
described as utilizing a “batch mode” operation for both the data collection and reporting
of project controls data and documentation. A consequence of this practice is that the
ultimate decision maker is often referencing information that is not truly reflective of
current project status. False conclusions may be reached and corrective actions often
come too late. One of the key findings of this research is that the research team was able
to identify the median a) age of data reported to the project manager and b) the age of the
data reported to the ultimate client or project authority for each of the project controls
functions previously described. In order to do so and as previously stated, the project
controls functions were comprehensively defined by the research team.
The research found that the time lag, due to common process encumbrances, is
often as long as two months or greater between when data is collected until the
corresponding information is reviewed by the ultimate decision maker. The across-the-
board batch reporting mode results in a poor controls capability and negative
consequences with respect to the ability to make timely and informed decisions.
Reporting frequencies are not designed to satisfy the decision makers at the different
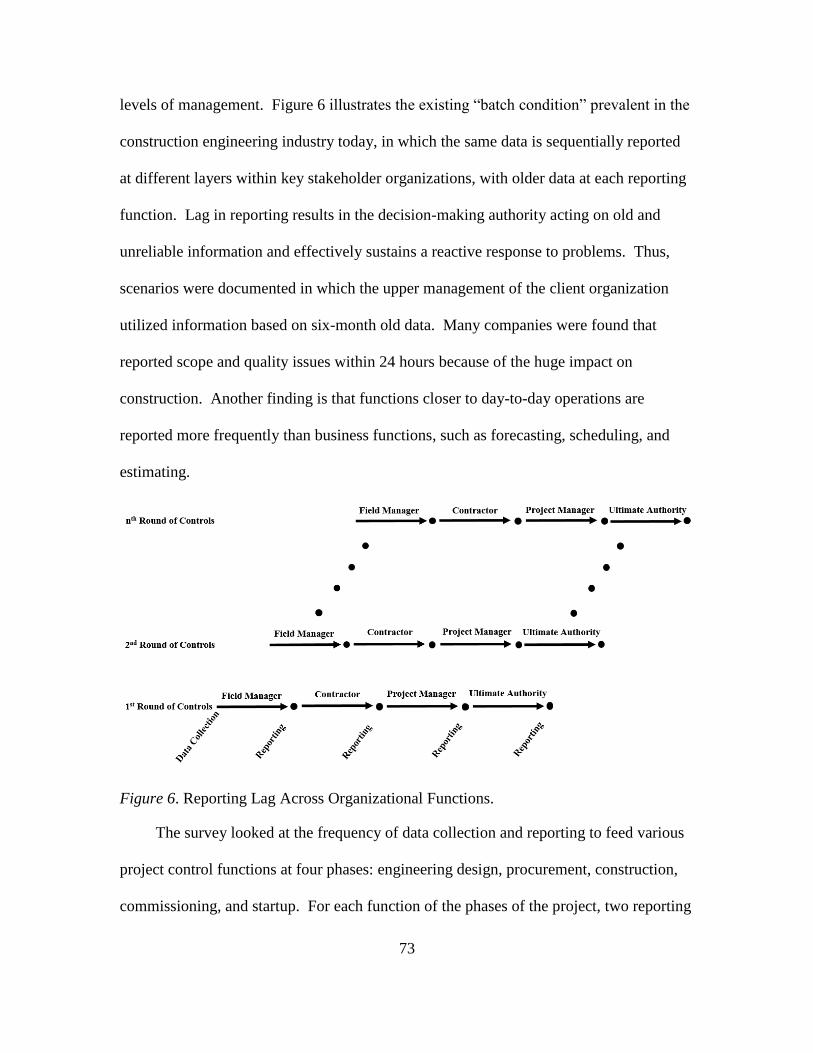
73
levels of management. Figure 6 illustrates the existing “batch condition” prevalent in the
construction engineering industry today, in which the same data is sequentially reported
at different layers within key stakeholder organizations, with older data at each reporting
function. Lag in reporting results in the decision-making authority acting on old and
unreliable information and effectively sustains a reactive response to problems. Thus,
scenarios were documented in which the upper management of the client organization
utilized information based on six-month old data. Many companies were found that
reported scope and quality issues within 24 hours because of the huge impact on
construction. Another finding is that functions closer to day-to-day operations are
reported more frequently than business functions, such as forecasting, scheduling, and
estimating.
Figure 6. Reporting Lag Across Organizational Functions.
The survey looked at the frequency of data collection and reporting to feed various
project control functions at four phases: engineering design, procurement, construction,
commissioning, and startup. For each function of the phases of the project, two reporting
74
frequencies have been reported—one for the Project Manager (PM) and the other for the
Ultimate Authority (UA) or the stakeholder. The blue arrows in Figures 7 to 18
represent the median time it takes for raw data to be reported as information to the PM,
and the red arrows represent the time it takes to report to the project UA. Figures 7 to 18
and Tables 44 to 47 present the median time lag that data is reported to the PM and UA
for all projects, owner submitted projects, and contractor submitted projects.
For each of the four project phases, it was desired to know how data on various
control functions are collected and reported in terms of cost, schedule, scope, and quality.
Age of data reporting was checked at two levels: reporting to Project Manager (PM) and
reporting to Ultimate Authority (UA) at the client organization. The data on use of
control functions at various phases of the project were collected from projects by both
owners and contractors. Here, it may be noted that not all the owners and contractors
from the 38 projects provide feedback on all the control functions they used.
It was observed that there is variation from owners’ and contractors’ perspective in
age of data reporting. This fact was considered in reporting various project control
functions in this section. Therefore, in addition to analytical results on various control
functions for all projects, the analytical results for projects by owners and contractors
were also reported in Tables 44 to 47. This will help the reader understand the magnitude
in which the practice of data collection and reporting for various cost control functions in
owners’ projects differs from contractors’ projects.
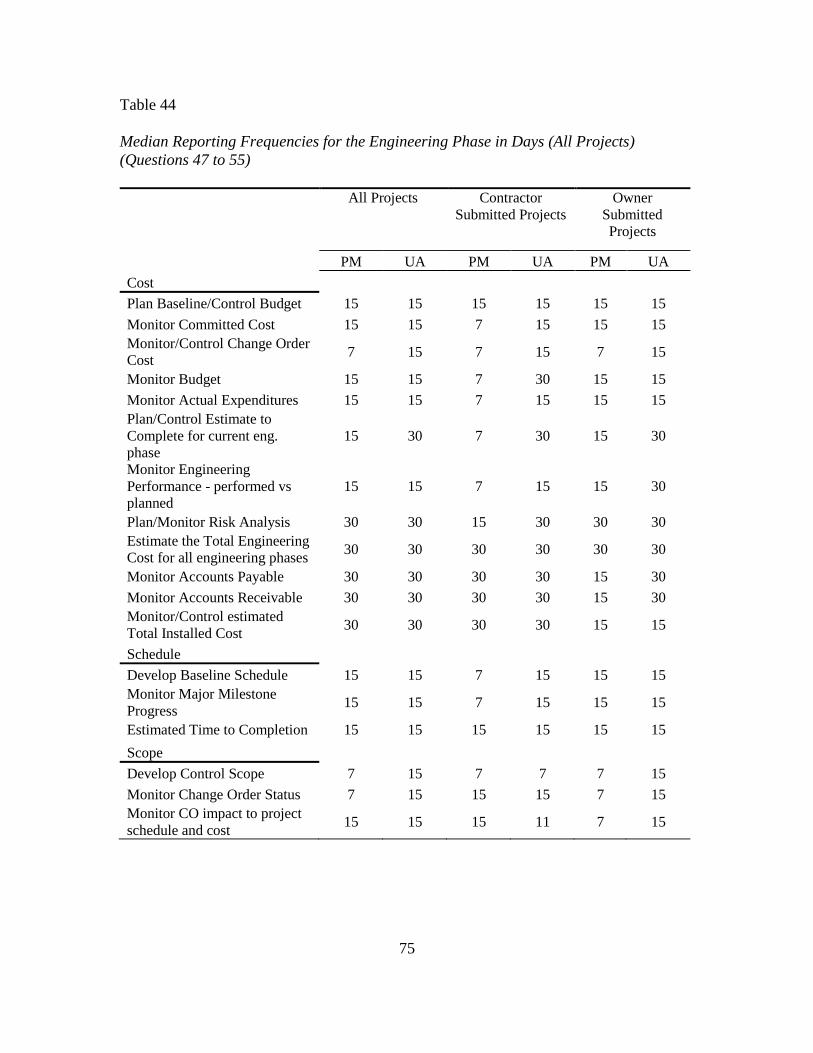
75
Table 44
Median Reporting Frequencies for the Engineering Phase in Days (All Projects)
(Questions 47 to 55)
All Projects Contractor
Submitted Projects
Owner
Submitted
Projects
PM UA PM UA PM UA
Cost
Plan Baseline/Control Budget 15 15 15 15 15 15
Monitor Committed Cost 15 15 7 15 15 15
Monitor/Control Change Order
Cost 7 15 7 15 7 15
Monitor Budget 15 15 7 30 15 15
Monitor Actual Expenditures 15 15 7 15 15 15
Plan/Control Estimate to
Complete for current eng.
phase
15 30 7 30 15 30
Monitor Engineering
Performance - performed vs
planned
15 15 7 15 15 30
Plan/Monitor Risk Analysis 30 30 15 30 30 30
Estimate the Total Engineering
Cost for all engineering phases 30 30 30 30 30 30
Monitor Accounts Payable 30 30 30 30 15 30
Monitor Accounts Receivable 30 30 30 30 15 30
Monitor/Control estimated
Total Installed Cost 30 30 30 30 15 15
Schedule
Develop Baseline Schedule 15 15 7 15 15 15
Monitor Major Milestone
Progress 15 15 7 15 15 15
Estimated Time to Completion 15 15 15 15 15 15
Scope
Develop Control Scope 7 15 7 7 7 15
Monitor Change Order Status 7 15 15 15 7 15
Monitor CO impact to project
schedule and cost 15 15 15 11 7 15
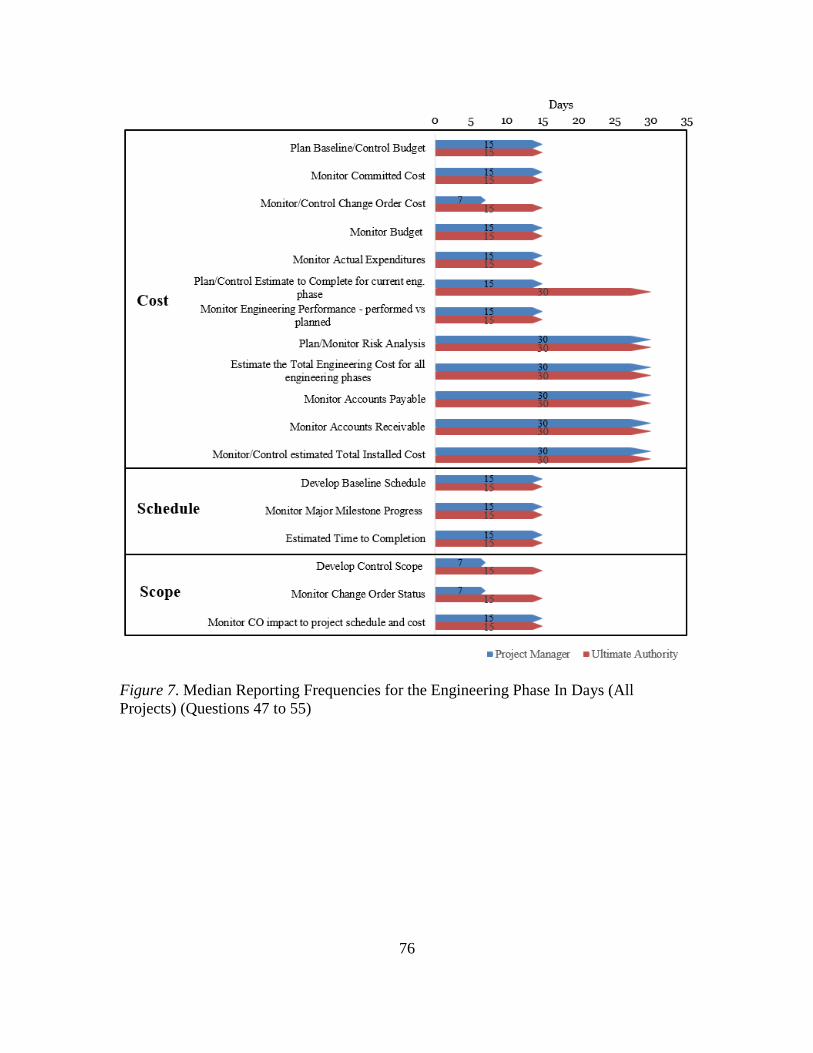
76
Figure 7. Median Reporting Frequencies for the Engineering Phase In Days (All
Projects) (Questions 47 to 55)
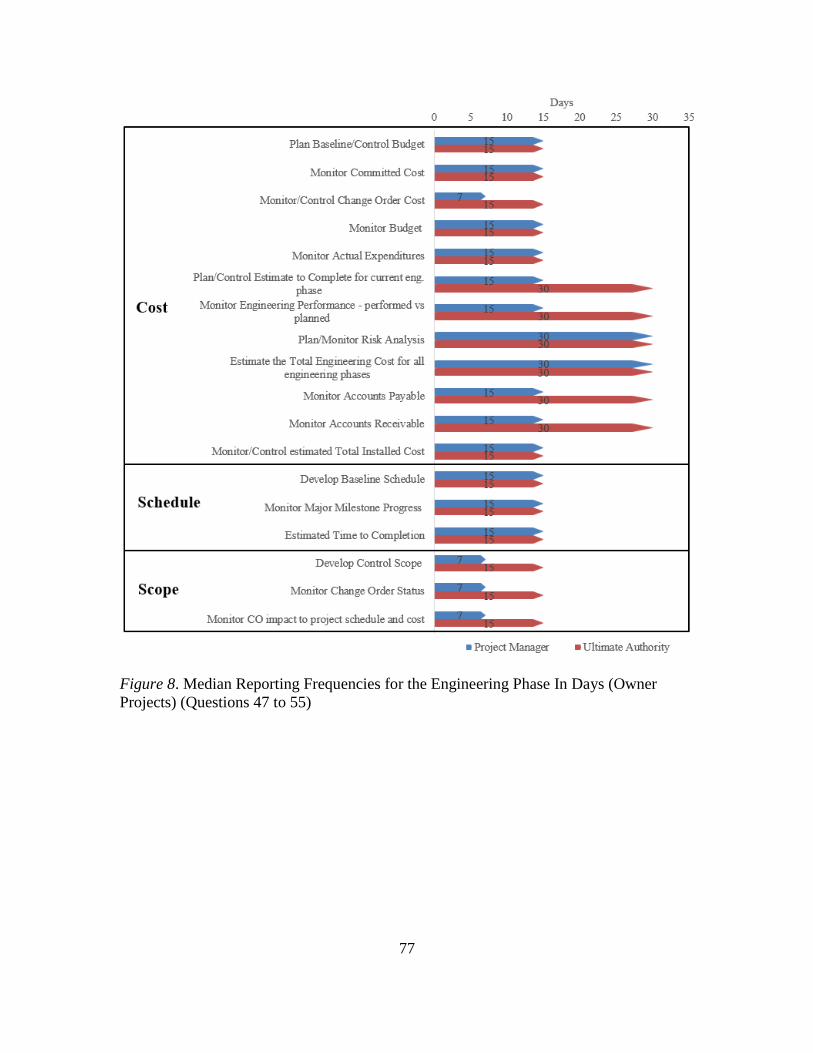
77
Figure 8. Median Reporting Frequencies for the Engineering Phase In Days (Owner
Projects) (Questions 47 to 55)
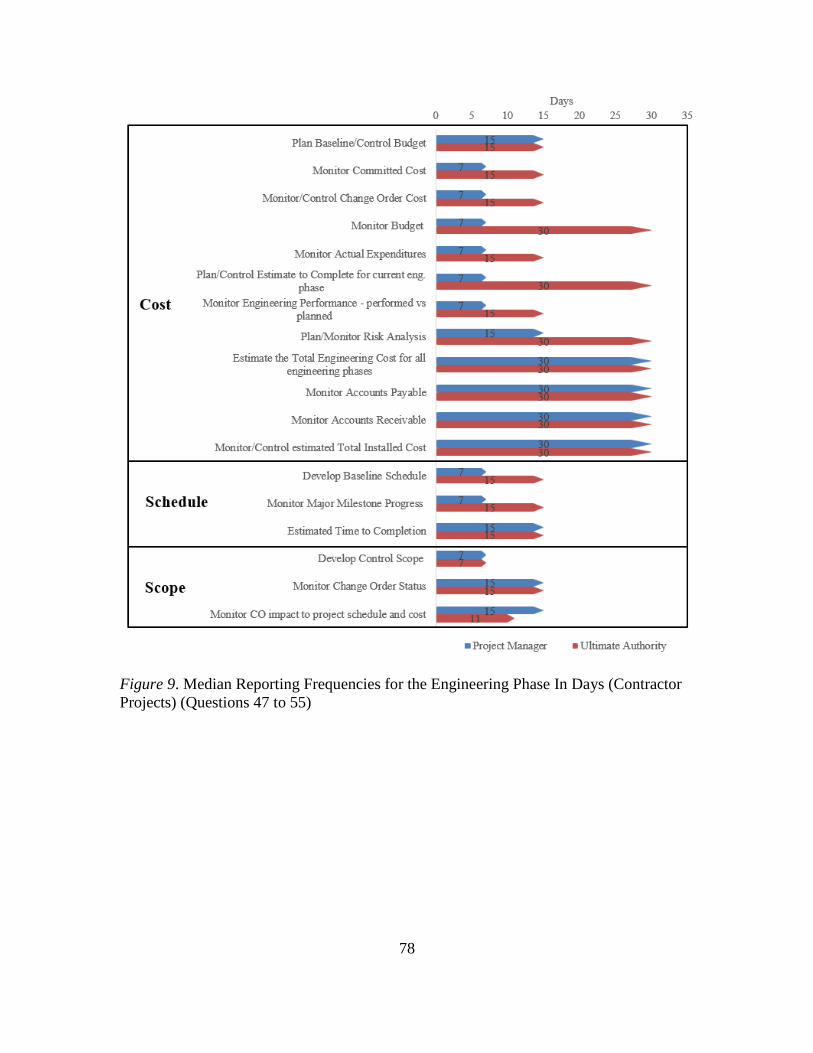
78
Figure 9. Median Reporting Frequencies for the Engineering Phase In Days (Contractor
Projects) (Questions 47 to 55)
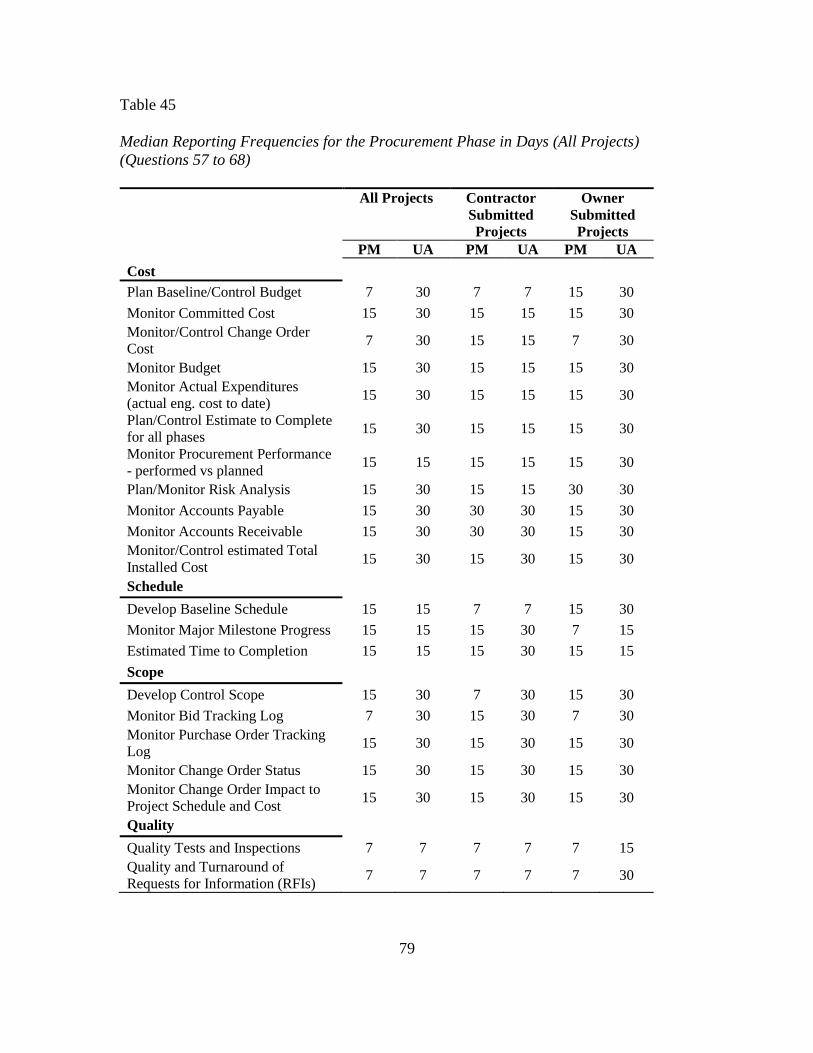
79
Table 45
Median Reporting Frequencies for the Procurement Phase in Days (All Projects)
(Questions 57 to 68)
All Projects Contractor
Submitted
Projects
Owner
Submitted
Projects
PM UA PM UA PM UA
Cost
Plan Baseline/Control Budget 7 30 7 7 15 30
Monitor Committed Cost 15 30 15 15 15 30
Monitor/Control Change Order
Cost 7 30 15 15 7 30
Monitor Budget 15 30 15 15 15 30
Monitor Actual Expenditures
(actual eng. cost to date) 15 30 15 15 15 30
Plan/Control Estimate to Complete
for all phases 15 30 15 15 15 30
Monitor Procurement Performance
- performed vs planned 15 15 15 15 15 30
Plan/Monitor Risk Analysis 15 30 15 15 30 30
Monitor Accounts Payable 15 30 30 30 15 30
Monitor Accounts Receivable 15 30 30 30 15 30
Monitor/Control estimated Total
Installed Cost 15 30 15 30 15 30
Schedule
Develop Baseline Schedule 15 15 7 7 15 30
Monitor Major Milestone Progress 15 15 15 30 7 15
Estimated Time to Completion 15 15 15 30 15 15
Scope
Develop Control Scope 15 30 7 30 15 30
Monitor Bid Tracking Log 7 30 15 30 7 30
Monitor Purchase Order Tracking
Log 15 30 15 30 15 30
Monitor Change Order Status 15 30 15 30 15 30
Monitor Change Order Impact to
Project Schedule and Cost 15 30 15 30 15 30
Quality
Quality Tests and Inspections 7 7 7 7 7 15
Quality and Turnaround of
Requests for Information (RFIs) 7 7 7 7 7 30
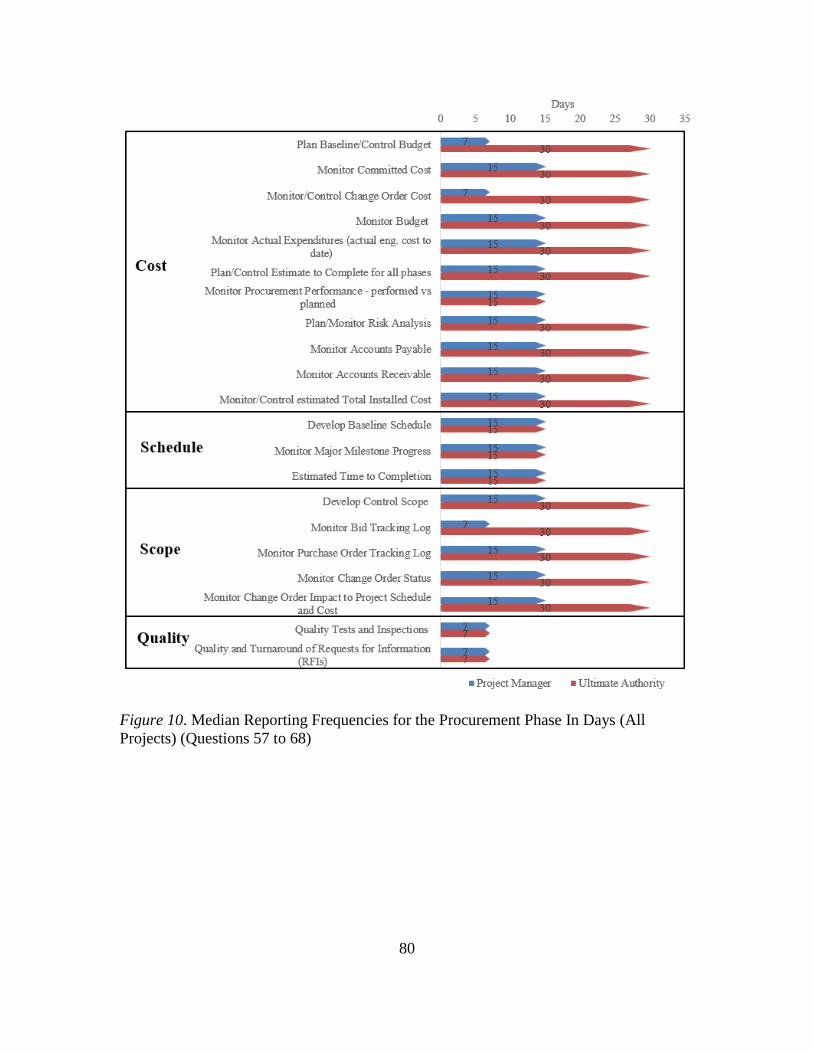
80
Figure 10. Median Reporting Frequencies for the Procurement Phase In Days (All
Projects) (Questions 57 to 68)
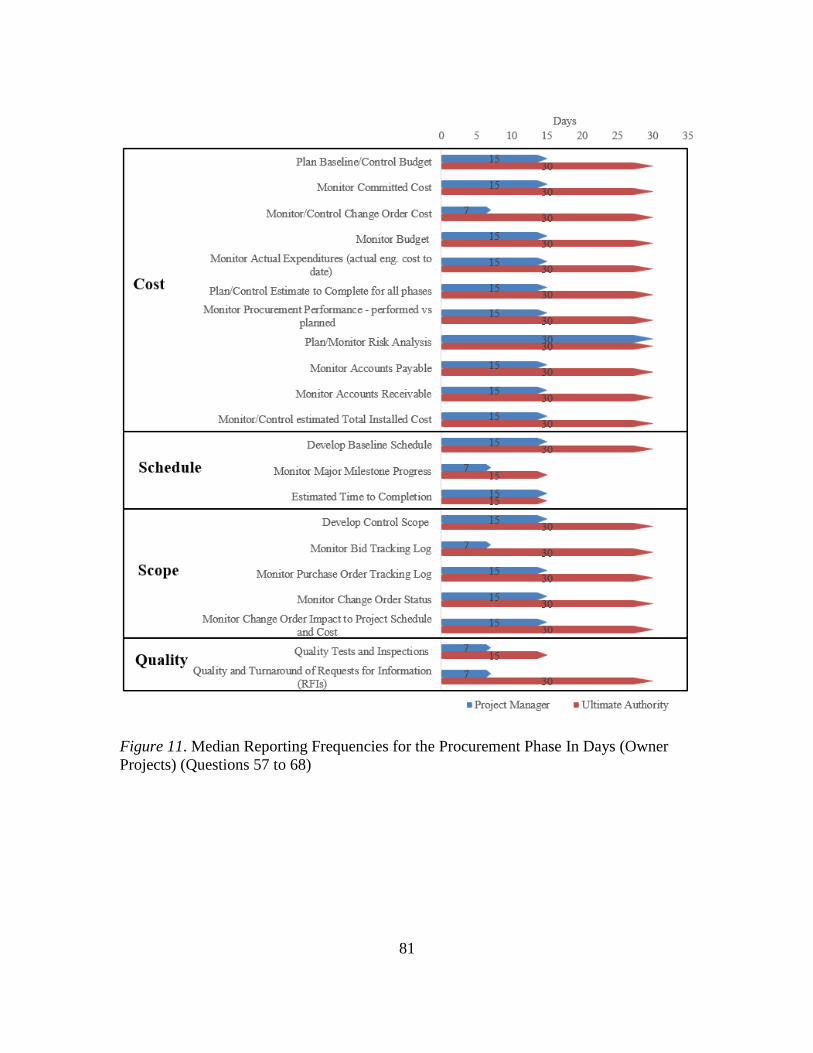
81
Figure 11. Median Reporting Frequencies for the Procurement Phase In Days (Owner
Projects) (Questions 57 to 68)
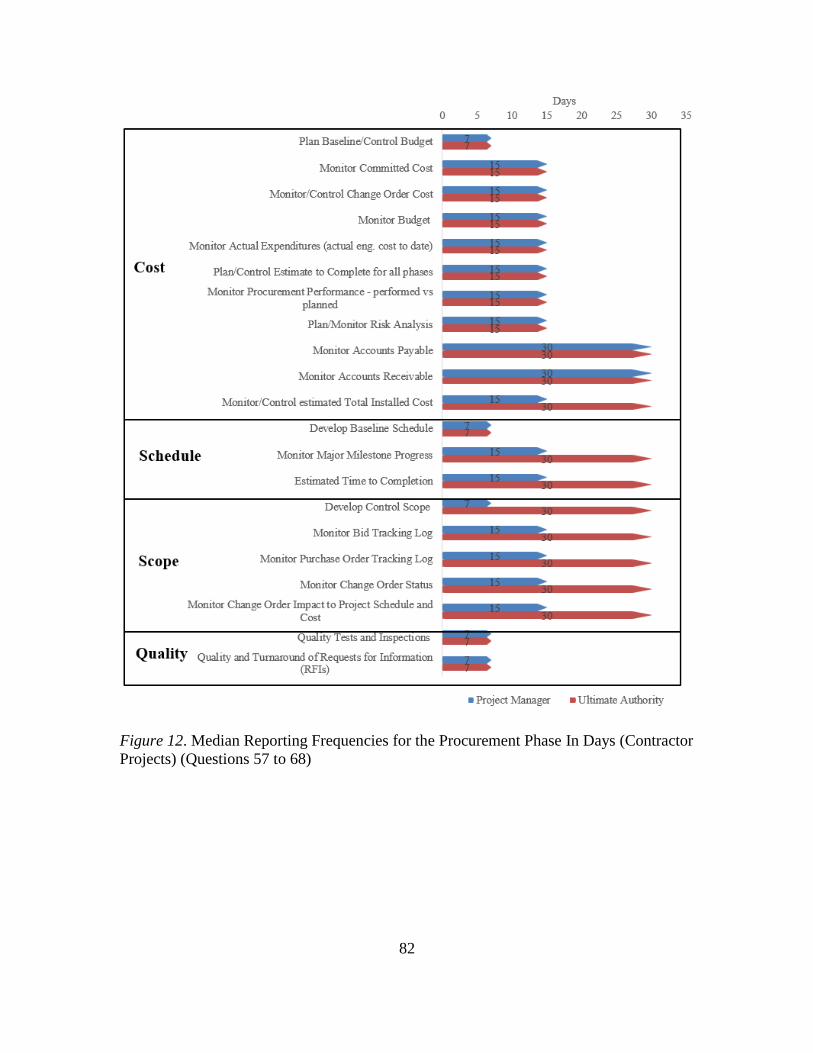
82
Figure 12. Median Reporting Frequencies for the Procurement Phase In Days (Contractor
Projects) (Questions 57 to 68)
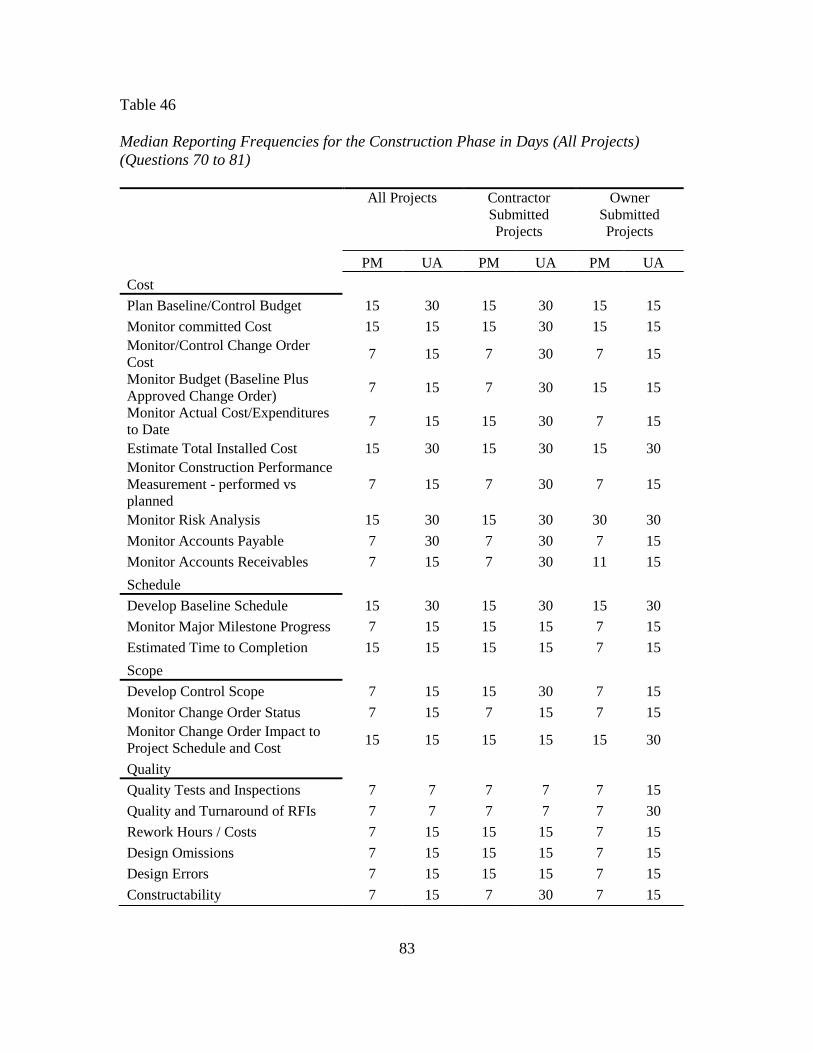
83
Table 46
Median Reporting Frequencies for the Construction Phase in Days (All Projects)
(Questions 70 to 81)
All Projects Contractor
Submitted
Projects
Owner
Submitted
Projects
PM UA PM UA PM UA
Cost
Plan Baseline/Control Budget 15 30 15 30 15 15
Monitor committed Cost 15 15 15 30 15 15
Monitor/Control Change Order
Cost 7 15 7 30 7 15
Monitor Budget (Baseline Plus
Approved Change Order) 7 15 7 30 15 15
Monitor Actual Cost/Expenditures
to Date 7 15 15 30 7 15
Estimate Total Installed Cost 15 30 15 30 15 30
Monitor Construction Performance
Measurement - performed vs
planned
7 15 7 30 7 15
Monitor Risk Analysis 15 30 15 30 30 30
Monitor Accounts Payable 7 30 7 30 7 15
Monitor Accounts Receivables 7 15 7 30 11 15
Schedule
Develop Baseline Schedule 15 30 15 30 15 30
Monitor Major Milestone Progress 7 15 15 15 7 15
Estimated Time to Completion 15 15 15 15 7 15
Scope
Develop Control Scope 7 15 15 30 7 15
Monitor Change Order Status 7 15 7 15 7 15
Monitor Change Order Impact to
Project Schedule and Cost 15 15 15 15 15 30
Quality
Quality Tests and Inspections 7 7 7 7 7 15
Quality and Turnaround of RFIs 7 7 7 7 7 30
Rework Hours / Costs 7 15 15 15 7 15
Design Omissions 7 15 15 15 7 15
Design Errors 7 15 15 15 7 15
Constructability 7 15 7 30 7 15
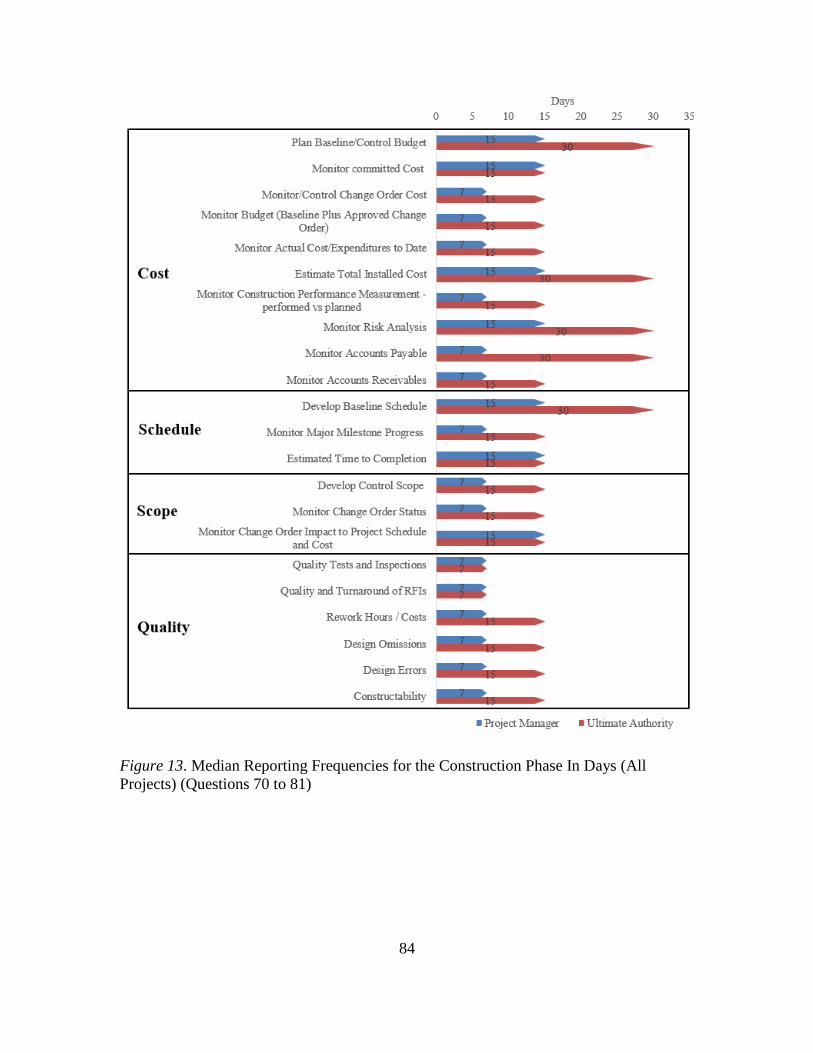
84
Figure 13. Median Reporting Frequencies for the Construction Phase In Days (All
Projects) (Questions 70 to 81)
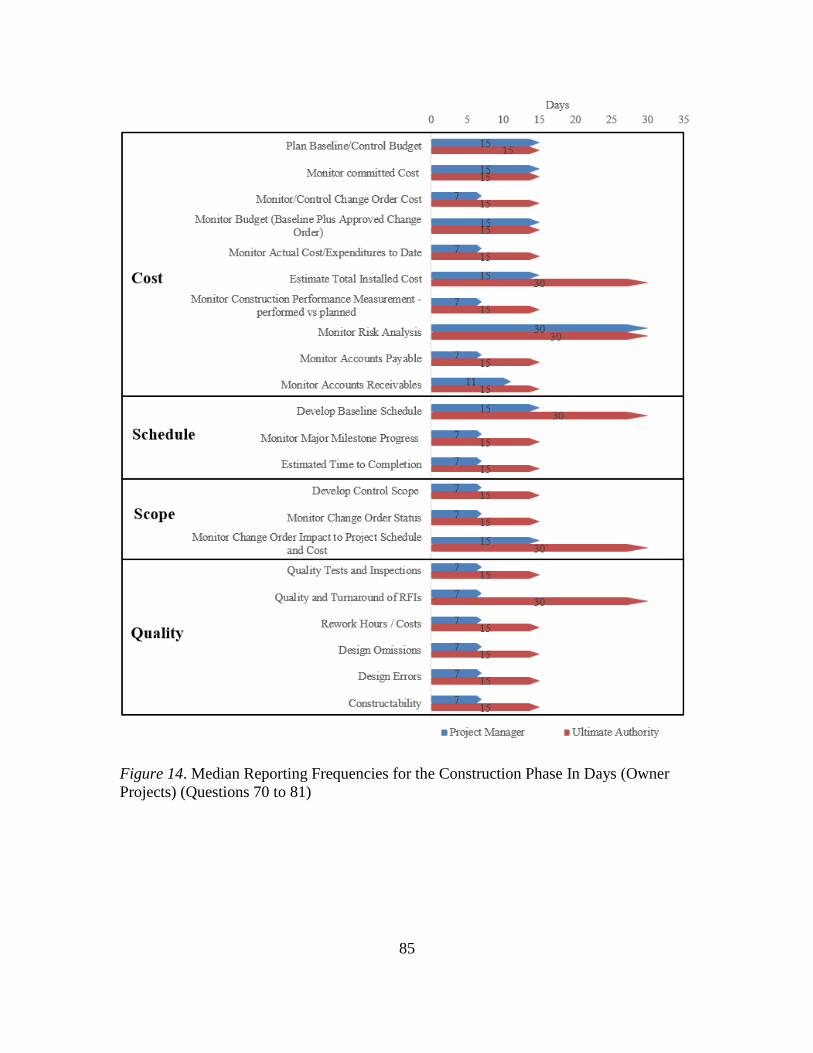
85
Figure 14. Median Reporting Frequencies for the Construction Phase In Days (Owner
Projects) (Questions 70 to 81)
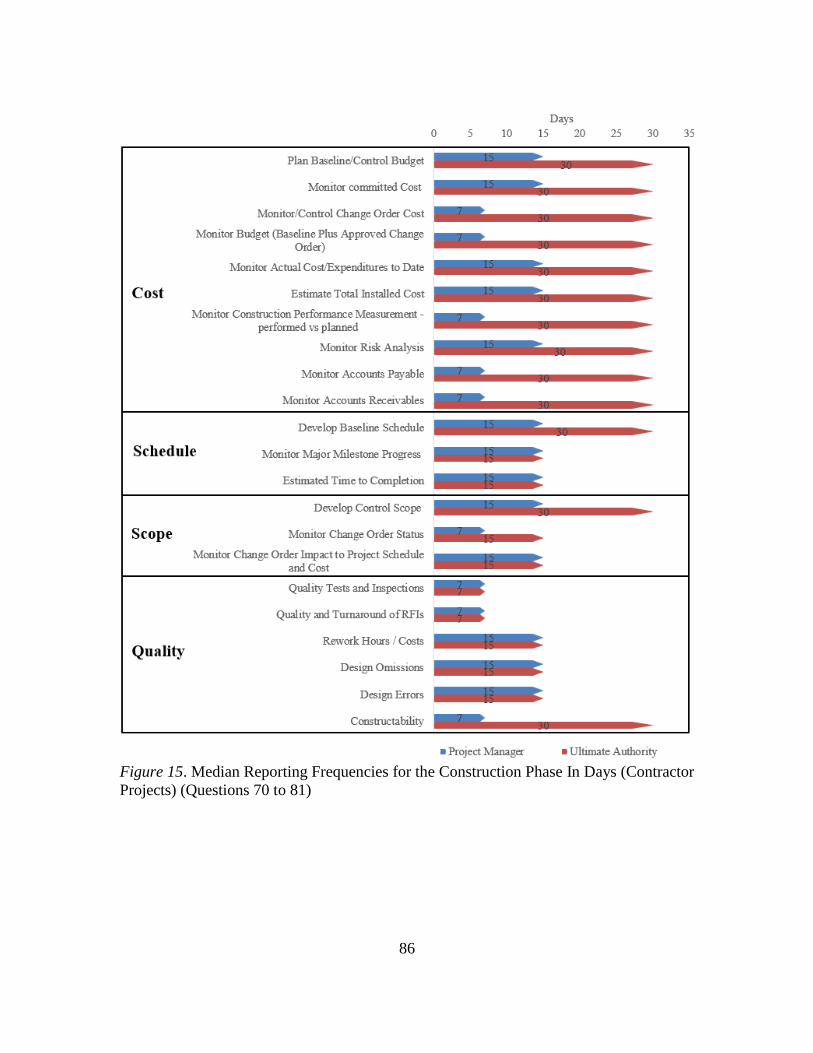
86
Figure 15. Median Reporting Frequencies for the Construction Phase In Days (Contractor
Projects) (Questions 70 to 81)
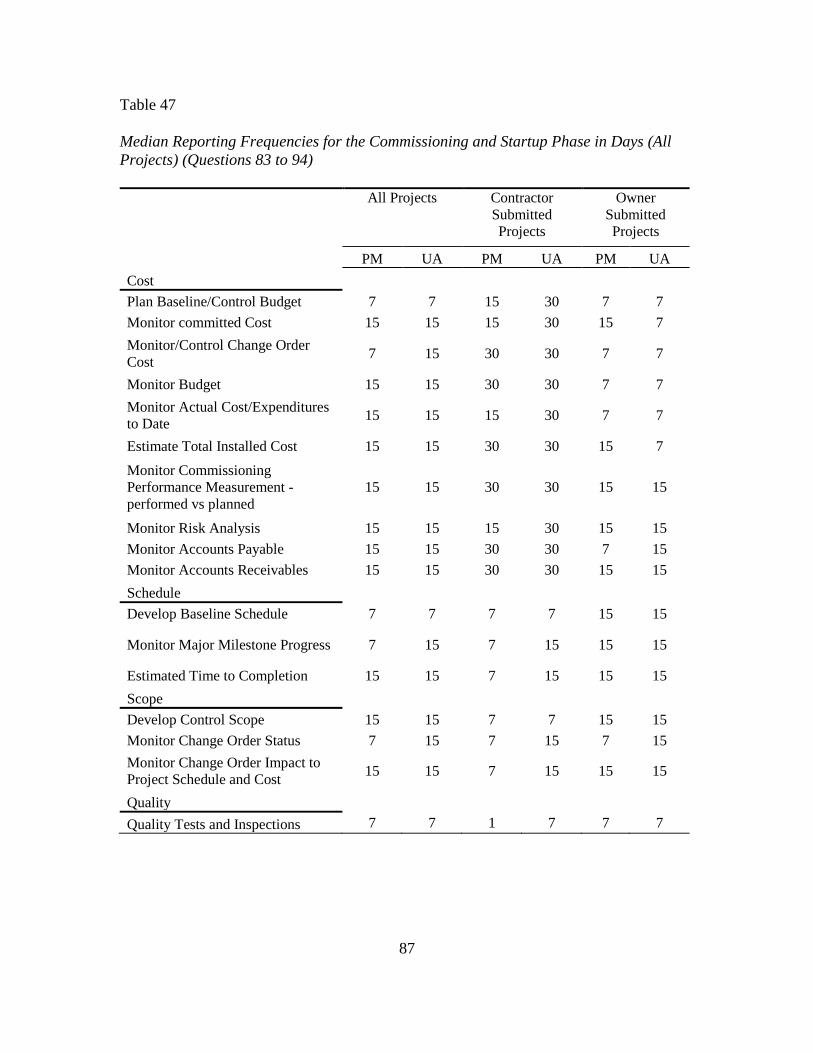
87
Table 47
Median Reporting Frequencies for the Commissioning and Startup Phase in Days (All
Projects) (Questions 83 to 94)
All Projects Contractor
Submitted
Projects
Owner
Submitted
Projects
PM UA PM UA PM UA
Cost
Plan Baseline/Control Budget 7 7 15 30 7 7
Monitor committed Cost 15 15 15 30 15 7
Monitor/Control Change Order
Cost 7 15 30 30 7 7
Monitor Budget 15 15 30 30 7 7
Monitor Actual Cost/Expenditures
to Date 15 15 15 30 7 7
Estimate Total Installed Cost 15 15 30 30 15 7
Monitor Commissioning
Performance Measurement -
performed vs planned
15 15 30 30 15 15
Monitor Risk Analysis 15 15 15 30 15 15
Monitor Accounts Payable 15 15 30 30 7 15
Monitor Accounts Receivables 15 15 30 30 15 15
Schedule
Develop Baseline Schedule 7 7 7 7 15 15
Monitor Major Milestone Progress 7 15 7 15 15 15
Estimated Time to Completion 15 15 7 15 15 15
Scope
Develop Control Scope 15 15 7 7 15 15
Monitor Change Order Status 7 15 7 15 7 15
Monitor Change Order Impact to
Project Schedule and Cost 15 15 7 15 15 15
Quality
Quality Tests and Inspections 7 7 1 7 7 7
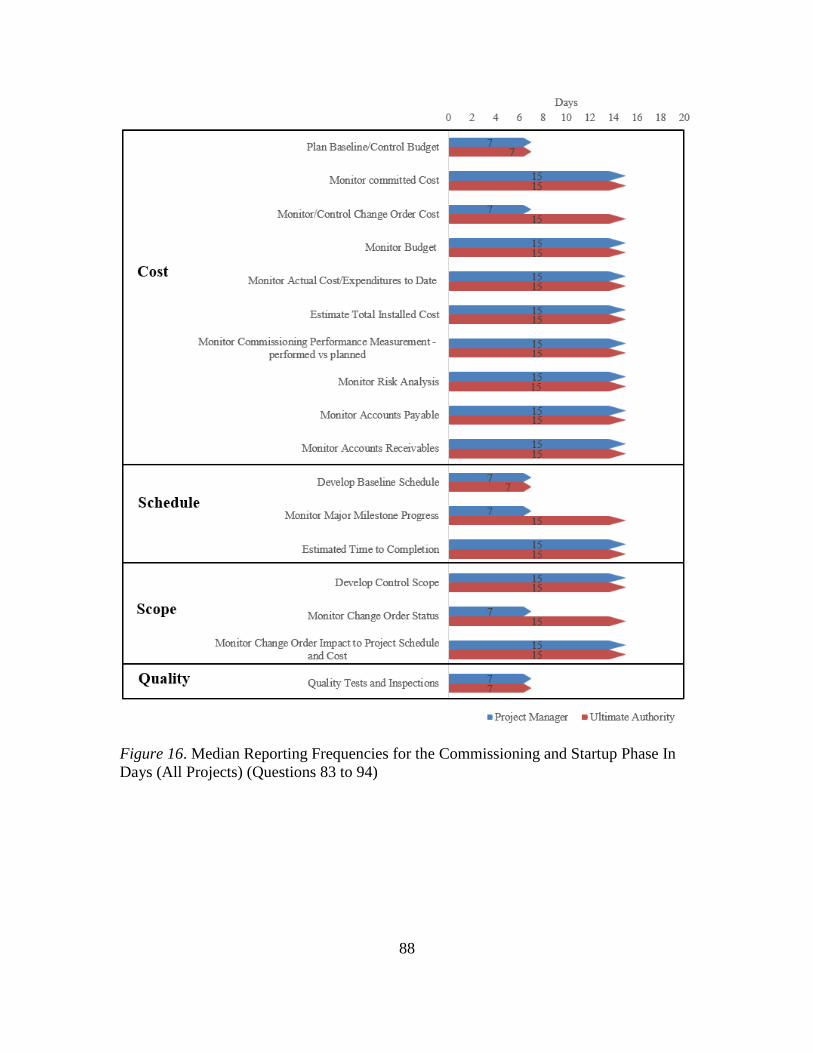
88
Figure 16. Median Reporting Frequencies for the Commissioning and Startup Phase In
Days (All Projects) (Questions 83 to 94)
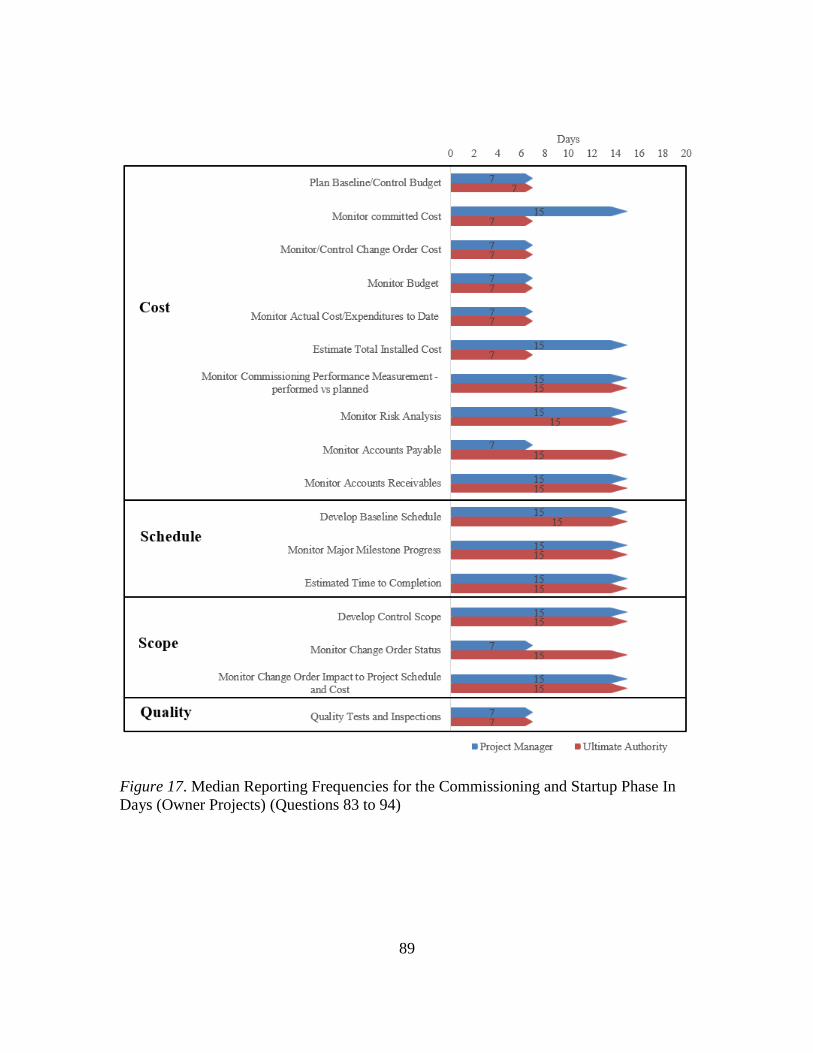
89
Figure 17. Median Reporting Frequencies for the Commissioning and Startup Phase In
Days (Owner Projects) (Questions 83 to 94)
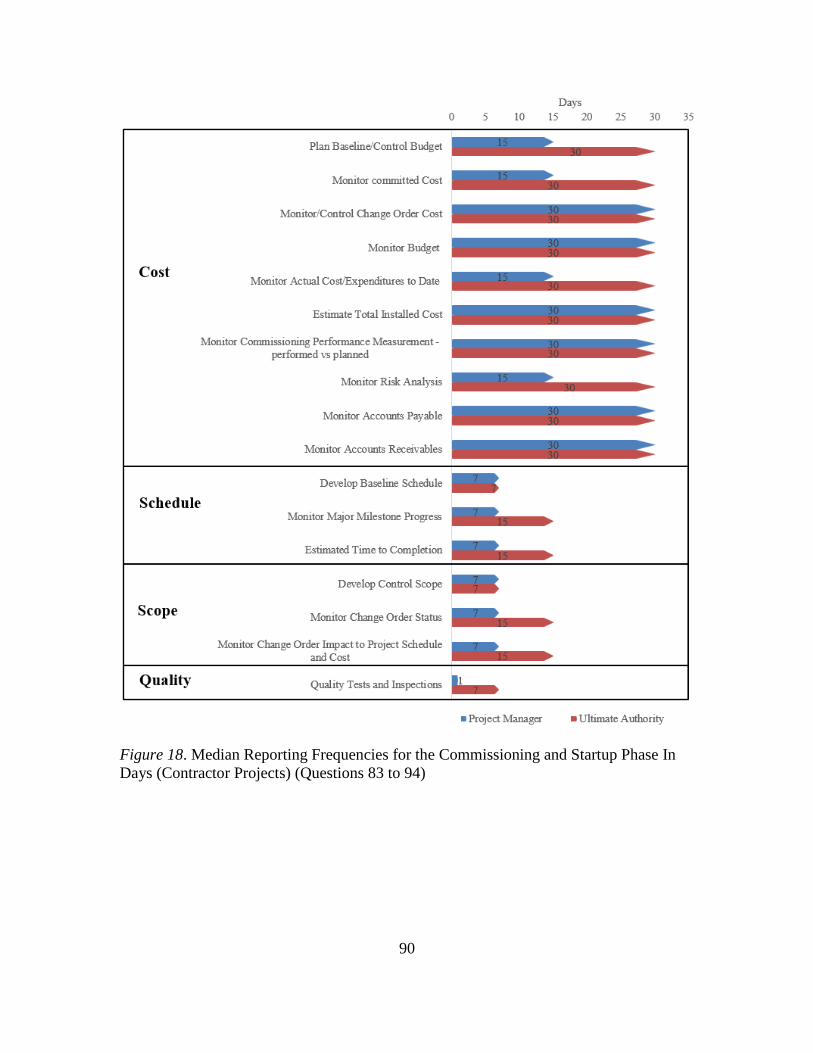
90
Figure 18. Median Reporting Frequencies for the Commissioning and Startup Phase In
Days (Contractor Projects) (Questions 83 to 94)
91
CHAPTER 6: IMPLEMENTATION STRATEGIES FOR INSTANTANEOUS
PROJECT CONTROLS
In order to satisfy objective 2 of this research study or the assessment of IPC
practices, a multiple case study research approach was adopted. In this chapter, the
interview design, case study data collection, and insights gained from the case studies are
presented; a brief description of each case study is written; also a detailed description of
the practices and constructs identified through the multiple case study is included, finally,
the validation of the case studies is explained. The primary contributor to the insights
and findings in this chapter was CII Research Team 316 members.
6.1 Design/Prequalification
To document current industry practices for instantaneous project controls, a
multiple case study with a holistic line of inquiry that incorporated a variety of
perspectives was conducted. The research team carefully selected cases to ensure they
would present a variety of trends, patterns, and clusters of data on instantaneous
communication of information.
Ninety minutes were allotted for each interview, which were facilitated by a
structured interview protocol consisting of 16 open-ended and structured questions. The
interview protocol addressed issues related to business rationale, data
collection/reporting, technologies, benefits and barriers, implementation cost and
schedule, and maintenance, among others. The open-ended design of the questions
allowed for the pursuit of specific threads of discussion or expanded the scope of a
conversation. The interview protocol questions are presented in Table 48. The interview
protocol was sent to these organizations ahead of time through email (see Appendix III).
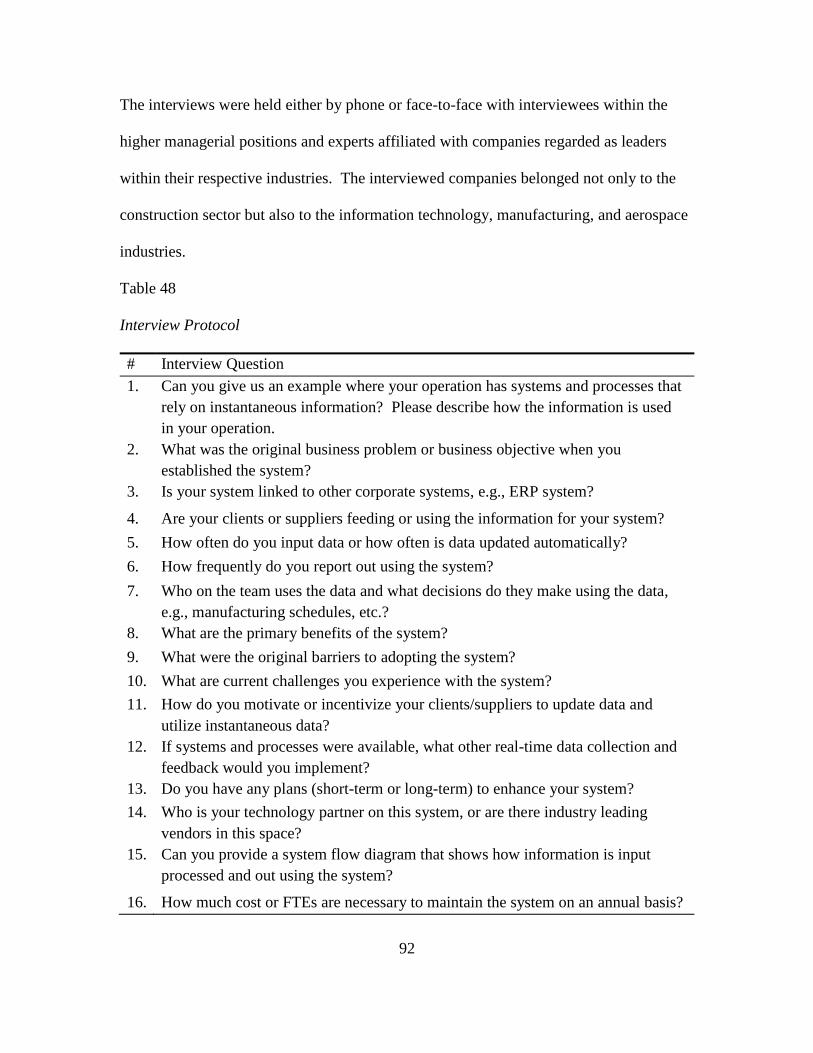
92
The interviews were held either by phone or face-to-face with interviewees within the
higher managerial positions and experts affiliated with companies regarded as leaders
within their respective industries. The interviewed companies belonged not only to the
construction sector but also to the information technology, manufacturing, and aerospace
industries.
Table 48
Interview Protocol
# Interview Question
1. Can you give us an example where your operation has systems and processes that
rely on instantaneous information? Please describe how the information is used
in your operation.
2. What was the original business problem or business objective when you
established the system?
3. Is your system linked to other corporate systems, e.g., ERP system?
4. Are your clients or suppliers feeding or using the information for your system?
5. How often do you input data or how often is data updated automatically?
6. How frequently do you report out using the system?
7. Who on the team uses the data and what decisions do they make using the data,
e.g., manufacturing schedules, etc.?
8. What are the primary benefits of the system?
9. What were the original barriers to adopting the system?
10. What are current challenges you experience with the system?
11. How do you motivate or incentivize your clients/suppliers to update data and
utilize instantaneous data?
12. If systems and processes were available, what other real-time data collection and
feedback would you implement?
13. Do you have any plans (short-term or long-term) to enhance your system?
14. Who is your technology partner on this system, or are there industry leading
vendors in this space?
15. Can you provide a system flow diagram that shows how information is input
processed and out using the system?
16. How much cost or FTEs are necessary to maintain the system on an annual basis?
93
The case studies fulfilled the need for an external cross-validation since it enabled
the identification of common characteristics, traits, and trends from multiple industry,
management, and technical perspectives. The research team used these case studies to
identify high-impact practices and strategies that help companies in the path to
implementation of IPC.
6.2 Interviews/Data Collection
Research team members identified 10 companies among CII member and non-CII
members that had at least one instantaneous controls function and invited these
companies for interviews. In all but one case, the interviewed organizations were
represented by at least two individuals, and the interviewees were always upper
management (with the exception of Case Study 2). This upper-management perspective
accounts for an organizational-based focus for the implementation of instantaneous
project controls (as opposed to a project-based focus). The only exception to this
organizational focus was Case Study 2 since the interviewees were project managers and
controllers. It stands alone in its project-centered focus on implementing instantaneous
controls. A summary of the case studies can be seen in Table 49.
Many of the interviews were recorded and transcribed, and key words were
identified and logged. A coding process was implemented to identify common nodes,
constructs, trends using key words, and clustering of data.
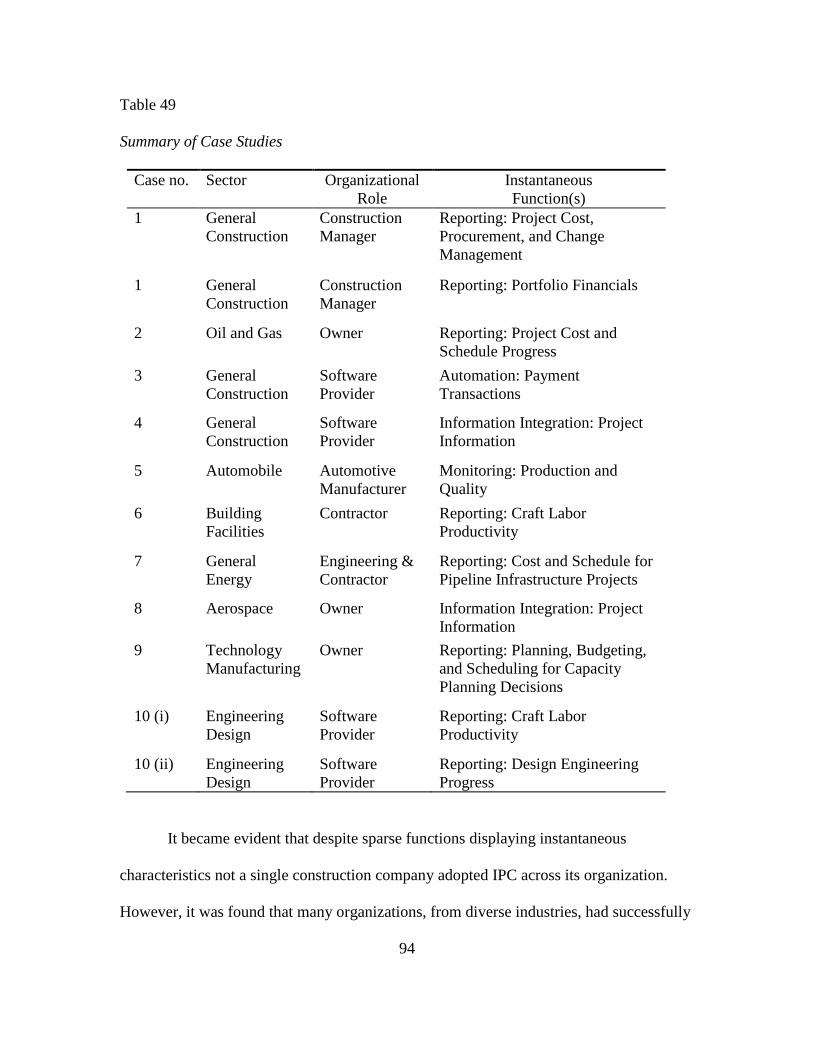
94
Table 49
Summary of Case Studies
Case no. Sector Organizational
Role
Instantaneous
Function(s)
1 General
Construction
Construction
Manager
Reporting: Project Cost,
Procurement, and Change
Management
1 General
Construction
Construction
Manager
Reporting: Portfolio Financials
2 Oil and Gas Owner Reporting: Project Cost and
Schedule Progress
3 General
Construction
Software
Provider
Automation: Payment
Transactions
4 General
Construction
Software
Provider
Information Integration: Project
Information
5 Automobile Automotive
Manufacturer
Monitoring: Production and
Quality
6 Building
Facilities
Contractor Reporting: Craft Labor
Productivity
7 General
Energy
Engineering &
Contractor
Reporting: Cost and Schedule for
Pipeline Infrastructure Projects
8 Aerospace Owner Information Integration: Project
Information
9 Technology
Manufacturing
Owner Reporting: Planning, Budgeting,
and Scheduling for Capacity
Planning Decisions
10 (i) Engineering
Design
Software
Provider
Reporting: Craft Labor
Productivity
10 (ii) Engineering
Design
Software
Provider
Reporting: Design Engineering
Progress
It became evident that despite sparse functions displaying instantaneous
characteristics not a single construction company adopted IPC across its organization.
However, it was found that many organizations, from diverse industries, had successfully
95
implemented certain process improvements or innovative strategies resulting in an
instantaneous capability in one or more aspects of project controls. The only company
that came close to the notion of instantaneous was an automotive manufacturing company
that implemented instantaneous monitoring of production systems, although reporting
was done at specific frequencies, typically monthly or more. However, the floor or
manufacturing line manager could see in real-time the manufacturing status. After
sorting, structuring, and analyzing the multiple case studies gathered, nine constructs
were identified that were categorized into three categories of organizational behavior,
control functions, and advanced systems and technologies.
6.3 Insights
The analysis of the case studies provided three important insights; first, the
relationship between implementation of instantaneous reporting with lean construction;
second, how monitoring is often implemented (rather than controls); and third, how the
scope of instantaneous reporting/controls can substantially vary, depending on the
monitored metric or function. These insights are further discussed in this section.
6.3.1 A Lean Perspective
Lean principles were originally developed and implemented in the manufacturing
sector; these principles aim to reduce variability during the production process. As is
discussed in Case Study 5, the manufacturing industry strives to instantaneously control
the assembly line in order to reduce variability in productivity and quality. In the
manufacturing industry, not all functions are monitored in real-time. Although the
assembly line functions are monitored in an instantaneous manner, business-related
metrics are reported in a batch mode. These business-related metrics might include the
96
number of manufactured products or work hours per unit of product, which are usually
reported in a batch mode at specific reporting intervals and usually range from weekly to
monthly frequencies based on the specific metric being monitored.
Controls on a production line is more of a real-time monitoring process, where
issues are quickly detected and instantly corrected. In this real-time monitoring process
no reporting of information occurs meaning that the assembly line is captured and
transmitted in real time without being analyzed. After issues are detected, in order for
immediate corrective actions to be taken, usually the worker at the assembly line is
responsible for making decisions and implementing any needed corrective actions, which
might include stopping the production line altogether until the issue is resolved.
Transmitting the authority to the worker allows issues that interrupt workflow stability
and affect quality to be addressed in a prioritized manner. Monitoring and decision-
making at the worker level allows issues to be addressed instantly and before they
accumulate into bigger problems. To further emphasize, the assembly line is monitored
in real-time but business-related metrics, such as schedule, cost, or forecasting functions,
are reported at specific frequencies, which may not be necessarily in an instantaneous
manner. This method of monitoring and controlling is to facilitate timely decision-
making and prevent negative impacts from late or uninformed decisions.
6.3.2 Monitoring Construction Versus Controlling Projects
After assessing the case studies in this research, it became clear that the
monitoring and controls policy as implemented by the manufacturing sector is slowly but
definitively being embraced by the capital projects industry. Instant monitoring and
prioritized control policies are being employed in the construction industry in order to
97
gain global competitive advantage. Capital projects are comprised of highly variable
processes; if issues during these processes are not addressed in a timely manner, they
could quickly compound and result in significant negative impacts.
As indicated previously, some of the case studies are from outside the
construction industry. It can be observed from these industries and their instantaneous
monitoring and prioritized reporting that the construction industry must also shift toward
such a policy of on-demand or timely project operations status monitoring. As will be
discussed in further detail, some of the case studies revealed that operating functions,
such as field operations, quality, craft labor productivity, and progress functions among
others, are being monitored in real-time while business functions and project performance
measures are not. Functions critical to project success, such as quality, should be
instantaneously monitored. The case studies revealed that both the manufacturing and
construction industries monitor similar metrics related to operations in real-time. These
operation functions include productivity, quality, and workflow which affect variability.
6.3.3 Proportional Scope and Implementation Effort
Another observation made during the case studies is that each controls function
has a different scope that affects the implementation effort needed for their instantaneous
monitoring or controls. For instance, some functions include project cost and schedule
status reporting, which are large in scope and require the implementation of relational
databases at the project or organizational levels or the development of integration
interfaces between software systems. Some functions that are limited in scope include
tracking payments, change management, and craft labor productivity, which require less
effort to instantaneously monitor or control. It is worthwhile to explore the relationship
98
between the scope of a real-time function and the resources needed and ease of its
implementation. Generally, it was observed that the broader the scope of the function,
the larger the amount of resources needed for its implementation—whether these
resources be time, money, or manpower. Long-term and extensive project control
functions require that leadership be on board and provide the resources necessary for the
implementation of such controls. While many smaller or less mature organizations can
benefit from implementing instantaneous monitoring or control functions due to the
limited resources they offer, more mature organizations can invest in more resources to
implement more extensive instantaneous control functions.
Case Study 3, which will be further described in detail, describes an automated
payment function as an example control function with limited scope that requires less
investment in terms of time, effort, and money. As explained in Case Study 3, this
payment function requires less than a month for implementation and minimal in-house
resources. All companies interviewed expressed an interest in implementing an
instantaneous controls function, but the suggestion to these companies is to consider the
resource requirements and payoff from implementing such real-time monitoring
functions.
6.4 Case Studies
In this section, each case study is briefly explained as to the industry context,
business driver for the instantaneous function being reported, the barriers and benefits to
its implementation, and resource requirements.
99
6.4.1 Case Study 1: Daily Reporting of Project Cost, Procurement, and Change
Management/Updated Portfolio Financials
The interviewed organization is a construction consulting and management
services organizations providing services to owner organizations throughout the project
life cycle. During the interview, the organization outlined their web-based enterprise
project portfolio management solution. This project portfolio management solution
enables the seamless sharing of document and information across key stakeholders. The
solution allowed for the transmittal of cost and procurement data at a daily reporting
frequency available to the owner, updates of owner’s financials by means of XML or
comma delimited type of file integration, and integration of vendor data, among others.
The web-based solution incorporates many business intelligence tools that enable
automatic checking for compliance with laws and regulations. Since everyone has access
to their needed data, everyone became accountable, and transparency became a norm.
The business intelligence rules needed workflow development, which was
resource-intensive to develop. Shifting toward this new system was met with some
resistance from accounting and financial personnel. The system is not yet integrated with
BIM and GIS information, something the company is diligently working toward. It was
mentioned that two full-time employees are needed to maintain the system.
6.4.2 Case Study 2: Daily Project Cost and Schedule Updates
The interviewed organization operates in the oil and gas sector. This case is the
only case where the unit of analysis is the project, since the interviewees were project
managers and project controllers. The reported is a schedule-driven shutdown project
that was plagued by uncertainty; the project had been carefully planned for eight months
100
and was successfully executed in 55 days against a hard startup production deadline. The
work was done intensely around the clock through two shifts by 5,500 workers. The data
collection was done manually through 200 field managers (100 per shift). The driver to
employ so many field managers was that the project was crucial to the business, and
every day lost meant loss of production. Also, time for corrective action was extremely
limited and the scope of work was so uncertain that the company wanted to decrease risk
and uncertainty and institute tight and timely controls on project progress and cost
performance.
The intensive manual data collection and reporting of project information resulted
in daily reporting on progress, productivity, earned hours versus planned hours, and costs.
This labor-intensive controls method decreased the uncertainty on the project and
resulted in the project being completed on time and on budget. Although, this controls
method might have been justified on this short-period and high-risk project, its
implementation will not likely be acceptable on low-risk or long-term projects due to its
resource intensive nature.
6.4.3 Case Study 3: Automated Payment Transactions
A software provider for the construction industry was interviewed. The software
company offers tools to support many processes and requirements, but the case study
focuses on a web-based construction payment management software solution for which
the company acts as a trusted third party.
Historically, subcontractors wait for payment by the owner or contractor before
they release the lien waivers since they have this right, and due to the lack of
transparency in the payment systems, owners and contractors would receive the lien
101
waivers up to 30 or 45 days after payment. The software system and software company
interviewed acts as a third party to whom payments are given and automatic lien waivers
are released. The software system has built-in custom business processes that inquire
approvers sequentially for their signatures.
This automated system has reduced disputes, caused companies to have
predictable cash flow forecasts, and improved relationship between the stakeholders.
Implementing such a system can take up to one month.
6.4.4 Case Study 4: Seamless Integration and Instantaneous Sharing of Project
Information
In this case study, a software provider was interviewed. The software company
addresses financial, project controls, and management, as well as enterprise resource
planning functions. The company provides an integrated project and enterprise cloud-
based solution. With the aid of a common data repository, the solution achieves seamless
sharing of data to stakeholders.
A unique coding structure is developed for the use with the software solution that
allows the integration of owner, contractor, and subcontractor data. This cost coding
structure allows for customization of reports at different levels for various stakeholders,
such as field managers or upper management. A sense of transparency and accountability
is created when a common data repository is used and appropriate permissions are given
to stakeholders to access this data. The cloud solution also gives real-time access to
project management and controls data as soon as it is introduced in the system. The
system also allows for consolidated financial data from specific projects all the way up to
corporate accounts.
102
There are some barriers to implementation of this cloud-based system. There is a
need for a cultural shift that allows individuals to accountably and transparently introduce
data into the system. The upfront time and cost needed, which typically ranges from six
months to two years, is another major impediment to the implementation of the system.
6.4.5 Case Study 5: Real-Time Manufacturing Monitoring and Status
A global automotive manufacturing company was interviewed. The company
indicated that they are under market pressure to meet vehicle orders under stringent time
and quality constraints.
A major finding in the company’s monitoring and controls process is the real-time
controls of their material acquisition and production processes. It was revealed that
assembly line workers have the authority to make critical decisions, including stopping
the production line if any quality or workflow variations occurs. Stopping the assembly
line is to ensure any issues occurred are addressed before they amount to larger problems.
It was revealed that the production line is monitored instantaneously, while the
introduction of the material to the assembly line is updated every 15 minutes. While the
monitoring of these production functions are real-time, the reporting of these operations
are daily to weekly; business operation, such as cost, schedule, and forecasting, are
reported in a bi-weekly and monthly bases. The instant monitoring of the production line
ensures that quality issues are addressed as soon as they appear; since the worker is in
charge of making such decisions, they can immediately address issues through corrective
actions.

103
6.4.6 Case Study 6: Daily Craft Labor Progress Monitoring for Workflow
Stabilization
A progressive contractor company specializing in complex technology and
system-intensive building projects was interviewed. The company has a strong emphasis
on stable execution of work and has indicated that bi-weekly or monthly progress reports
do not suffice toward this objective. Their project controls plan is centered on
development and execution of reliable budget and schedules.
The adopted workflow stabilization process by the contractor revolves around the
definition of small work packages for controlling the work (typically less than 200 work
hours), standardized cost code structures, and daily craft labor progress monitoring. They
achieved daily reporting on work hours and quantities through manual collection of field
data. Foreman had to be trained and on board regarding this intensive data-collection
process. The analysis and reporting of the collected data was semi-automated using in-
house software tools, but the contractor was working on automating these functions. The
results from this frequent monitoring and controls process was improved project schedule
and cost performance, as well as stable workflow and productivity rates.
6.4.7 Case Study 7: Daily Cost and Schedule Report for Pipeline Infrastructure
Projects
The organization interviewed was an engineering/contracting company for the
oil/gas, electric power, refining, and petrochemical industries. The reported
instantaneous function for this contractor was the daily reporting of cost and schedule
progress. The daily reporting functions were supported by manual crew-level data
collection, manual data analysis, a common cost code structure among engineering and
104
construction functions, and upper-management support. The controls process needed two
FTEs per project to maintain and update cost and schedules.
The contractor mentioned project cost savings as a benefit from implementation
of this daily controls process. The daily availability of cost and schedule information
allows for internal benchmarking of projects through analysis of historical data.
Similar to previous case studies, there was a resistance to change by foreman who
were required to report the field data. The workers and contractors needed to be trained
in the collection of cost and schedule data using the correct codes and quantities.
6.4.8 Case Study 8: Seamless Integration of Project Information
The interviewed organization was an aerospace agency managing construction-
related projects through its facilities and engineering department. The instantaneous
aspect the organization described pertained to a new project controls system with an in-
house web-accessible SQL database replacing an older legacy MS Access-based controls
system. The new system and its data repository enables continuous data input, data
access, and automated reporting. One FTE is required to maintain the system.
In order to ensure compliance with internal requirement and regulation workflow,
logic was built into the project repository. The data is entered by lower-level managers
and engineers, while the reports are reviewed by senior- or general-level management.
Benefits from implementing this new controls system are cited as: consistent
project performance, improved capital allocation across the portfolio of projects, and a
shift toward early disclosure of project information due to the seamless sharing of
information. The barriers to implementing this new system are the resistance by the
project manager to share project data due to fear of scrutiny and that there are no
105
contractual requirements for continuous input of data, which results in some reports
reporting on old data.
6.4.9 Case Study 9: Advanced Model-Based Analytics for Capacity Decisions
The interviewed company is a designer and manufacturer of technology
components, such as semiconductor chips. The issue this company had was with the
rapid market needs and the requirements it placed on capital project processes. For
instance, historically it took five months to respond to increased manufacturing
requirements in the form of a reliable work plan. An advanced model-based analytics
system was developed to expedite the response placed by market needs to one month.
This system is not an example of an instantaneous function but is rather presented as an
example of how legacy systems can be improved substantially. The advanced model-
based approach has quantities and costs built into it and supports changes in
manufacturing capacity by providing a “what-if” scenario kind of analysis.
The benefits from this system are that it allows the project team to see potential
requirements due to manufacturing capacity changes before any commitments are made.
The what-if scenario analysis allows for comparison of options and informed decision-
making. The system requires that a unique and standardized cost-coding structure be
developed. There are no foreseen FTE requirements for the maintenance of the system
after its development.
106
6.4.10 Case Study 10 (i): Daily Cost and Schedule Progress Report
The interviewed organization in this case is a provider of software solutions for
capital industry organizations. This software company is research focused and reinvests
20% of its revenue back into research and development. A remote and cloud-enabled
application is discussed for the data collection and field reporting on craft labor
productivity and progress. The real-time data collection can be leveraged in the system
to obtain earned value, progress, and productivity in real-time. The cost code structure is
customizable and allows the foreman to introduce crew-level data in the system and, with
the availability of wireless connection data, automatically store the data from the jobsite.
The software provider claims that one to five percent cost savings can be achieved
by implementing their system. The availability of real-time data organizations can
perform internal benchmarking of their projects. There is a change resistance from
people who report field data, such as foreman, due to a lack of alignment and
accountability; there is a need to train and realign the focus of these personnel.
6.4.11 Case Study 10 (ii): Instantaneous Design Engineering Progress Report
This case is drawn from the same organization and interview as Case Study 10 (i).
In this case, an instantaneous assessment and reporting on the design engineering
progress is discussed. The progress of design engineering is assessed through metrics
related to transmittals and document management. A dashboard provides information
regarding the following; overdue transmittals, top overdue transmittals, deliverable
documents, rejected documents, and more. In addition to the quantifying progress, the
system uses neural network algorithms to predict the completion time for the engineering
documents.
107
This system allows for the easy identification of design bottlenecks and allows for
better alignment between engineering and construction. In order for the system to be
used effectively, it should be contractually required.
6.5 Instantaneous Controls Practices
Analysis of the case studies revealed that not one organization was found within
the construction industry that controlled its projects in a completely instantaneous
manner. However, many instances were found within and outside the construction
industry where instantaneous control functions had been implemented in one or more
facets of their projects. The objective of implementing instantaneous functions has been
to increase efficiency, minimize costs, reduce risk, and ultimately compete globally.
After collectively analyzing the case studies, it became evident that certain trends
exist and common strategies could be found for implementing instantaneous controls. In
total, nine key constructs were found that if sequentially and proactively addressed can
result in an improved instantaneous project controls capability. These nine strategies are
grouped into three categories of organizational behavior, project controls, and
technologies (see Table 50).
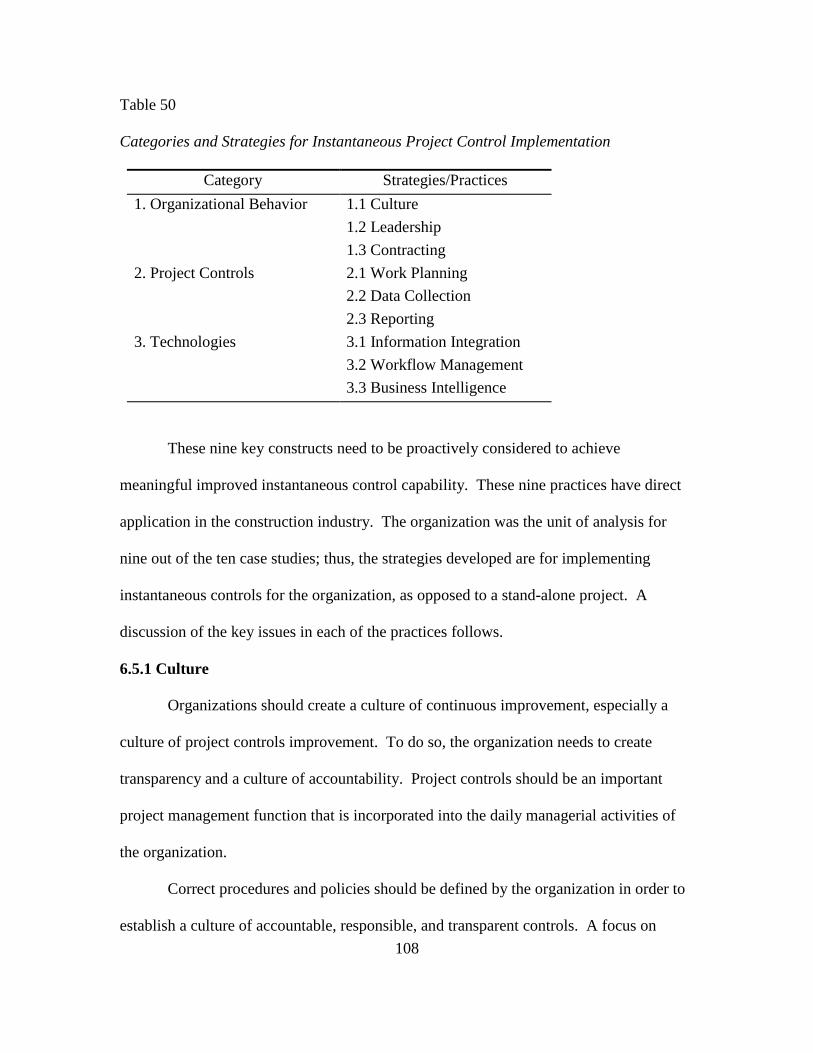
108
Table 50
Categories and Strategies for Instantaneous Project Control Implementation
Category Strategies/Practices
1. Organizational Behavior 1.1 Culture
1.2 Leadership
1.3 Contracting
2. Project Controls 2.1 Work Planning
2.2 Data Collection
2.3 Reporting
3. Technologies 3.1 Information Integration
3.2 Workflow Management
3.3 Business Intelligence
These nine key constructs need to be proactively considered to achieve
meaningful improved instantaneous control capability. These nine practices have direct
application in the construction industry. The organization was the unit of analysis for
nine out of the ten case studies; thus, the strategies developed are for implementing
instantaneous controls for the organization, as opposed to a stand-alone project. A
discussion of the key issues in each of the practices follows.
6.5.1 Culture
Organizations should create a culture of continuous improvement, especially a
culture of project controls improvement. To do so, the organization needs to create
transparency and a culture of accountability. Project controls should be an important
project management function that is incorporated into the daily managerial activities of
the organization.
Correct procedures and policies should be defined by the organization in order to
establish a culture of accountable, responsible, and transparent controls. A focus on
109
training personnel toward their specific responsibilities and behavior should be made. In
order to incentivize employees to better themselves in their project controls effort,
periodic evaluations, reviews, feedback, and recognition packages should be established.
In order to ensure continued improvement is made regarding project controls, periodic
internal audits should be made.
6.5.2 Leadership
Upper or senior management have a responsibility to provide the organization with
a sustained vision toward instantaneous project controls practices. This vision should be
clear and feasible in light of available resources. Establishing recognition programs will
create transparency in requirements and additionally will incentivize and motivate
personnel.
Management should support efforts to implement instantaneous functions and
acknowledge temporal problems or issues in establishing such control functions.
Management should commit needed resources and assets for the realization of enhanced
instantaneous controls. Resource allocation should be proportionate to the scope and
effort needed to implement a specific instantaneous controls functions. Resource
allocation should be followed by clear goal setting and expectations. Formal reviews,
feedback, and recognition should also be established for all levels of management.
6.5.3 Contracting
Stakeholder and personnel responsibilities, including data collection, reporting,
and communication requirements, should be clearly defined and put in writing. Such
written responsibilities should be contractually enforced. There is a need to contractually
110
include the required code structures, work breakdown structure, and other metrics in
order to align the stakeholders throughout the project.
The details of communication interfaces, reporting requirements, and data
collection efforts should be included in the contracts for all stakeholders of the project,
including the owner down to the subcontractor. Therefore, deliverables should be aligned
across organizations, communication interfaces should be defined, and milestones should
be established.
6.5.4 Work Planning
Work planning is an important aspect that should be recognized when trying to
support timely, informed, and proactive decision-making processes. Work planning
encompasses front-end planning, the definition of planning processes, and assessment of
work planning.
Work planning is achieved through work packages; work packages are defined
based on the size and complexity of the project and should be aligned with the data
collection, analysis, and reporting requirements of the project control functions.
Additionally, work packages need to be aligned with the project execution plan. The
success of the project should be assessed against these work packages, and the interfaces
between these work packages should be effectively managed.
The coding structure of the project should be carefully developed in order to
satisfy the project objectives and effectively support all aspects of project controls. The
coding structure should be aligned among all departments through effective
communication. For instance, the cost coding structure should be aligned with
111
accounting and financials. Work packaging should be promoted by project organizations
in order to promote continuous feed of data and on-demand reporting.
6.5.5 Data Collection
The requirements for data collection should be defined in well-drafted
instructions, procedures, checklists, and/or standards within the organization. The data
collection requirements should be aligned with key project performance metrics. Not all
data need to be collected instantaneously due to the resource intensive nature of such an
endeavor; rather, the frequency of data collection should be specified according to the
needs and project objectives.
A requirement for data collection is that the acquired data should be correct,
clean, consistent, and complete. Accuracy of data is important when making decisions;
thus, order of magnitude or estimates should be avoided as much as possible. In order to
ensure consistent data is acquired, data validation and audits should be established.
Ideally, project controls data should be automatically and continuously collected
with minimal human effort in a way that manual collection or re-entry of data is
eliminated. To ensure accuracy of the collected data, it should be captured at source. It
should be noted that remote technologies, such as wireless, mobile, or cloud solutions,
will help in bypassing or eliminating paper-based data collection efforts.
6.5.6 Reporting
Reporting frequency for each project controls function should be prioritized; this
prioritization may include real-time and continuous monitoring of specific control
functions. Reports should be automatically generated with the right metrics and level of
detail to satisfy the needs of the stakeholder being reported to. Reports should be
112
available anywhere and remotely using mobile, remote, and wireless technologies. When
prioritizing project control functions, consideration for the timelines and relevancy of
data should be taken.
6.5.7 Information Integration
Seamless exchange of project control data and information within and across
organization boundaries results in successful information integration. Inefficient flow of
information should be recognized and issues resolved so that cost and schedule functions
can be effectively controlled. Seamless flow of information should be facilitated by
automatic data transfer. Manual and semi-manual transfer of data may introduce
inefficiencies, error, and lag within the information exchange process.
Seamless information flow should not jeopardize confidentiality nor cause
redundancy or raise security flags. Information integration should guarantee appropriate
information access. Storing data in a central repository may enhance data sharing and
access with combined authorization protocols. Inhibiting factors across organizational
barriers should be identified and resolved.
6.5.8 Workflow Management
Project workflows should focus on communication and information management
technologies. Such workflows ensure that compliance is met with audit requirements and
regulations. Appropriate authority or privileges should be given when designing the
workflow based on project needs and project nature.
Workflows should streamline project control and management processes through
the use of appropriate mechanisms, such as warnings, reminders, and escalation rules.
Workflows should be designed to accommodate up-to-date information and
113
communication technologies. Workflows should enable instantaneous project controls
and management. Communication and information technologies should enforce
compliance with requirements, such as audits, regulations, and standards.
6.5.9 Business Intelligence
The construction sector produces and handles an enormous amount of data.
Analyzing this overwhelming amount of data by project managers is an impractical
endeavor. Business intelligence or automated data analytics can result in timely analysis
of this data.
Advanced analytics allow critical project questions to be answered instantly and
are set to support strategic project decisions. Business intelligence incorporates
intelligence functions that automatically and instantaneously inform, alert, and trigger
actions based on actual or potential events and issues.
6.6 Validation
The case studies conducted are based on contextual and real-world evidence.
This real-world evidence and contextual data provides a strong validation for the case
study analysis and the practices developed in this study. Furthermore, a validation
mechanism was implemented to generalize the practices outlined previously. This
mechanism is a workshop with subject-matter experts and implementation studies. The
workshop tried to gather the perceptions and opinions from subject-matter experts with
no prior knowledge of this research on the findings and strategies gained from the case
studies. Also, three distinct efforts to implement a prioritized reporting capability were
investigated. The three implementation studies show the different levels of success and
how they can be explained by the insights and practices gained from this research study.
114
The following three sections discuss three implementation efforts for
instantaneous controls. Each effort has varying levels of success. In studies A and B, the
organizations sequentially implemented the practices, while study C focused on
implementing advanced information technologies without first addressing organizational
behavior and project controls categories. Implementation studies A and B were
successful in implementing improved and more instantaneous control functions. Study
C. which only focused on technology-centric efforts. failed in its instantaneous controls
implementation. These three studies are presented in the following sections.
6.6.1 Implementation Study A—Consolidated Organizational Behavior
The first implementation study relates to an advanced and sophisticated
contractor. This contractor implements a field controls measure of daily data collection
and analysis, which allows almost instant corrective actions as necessary. The company
leadership promoted this daily endeavor, and the organization’s culture encouraged
continuous improvement, which allows individuals to contribute to the vision. The
organization hierarchy was horizontal; thus, middle and higher management also
contributed to continuous improvement and to the vision. The organization had a
sophisticated work coding system to enable communication between different control
functions. Its contracting methods included shared incentives and integrated project
delivery process, which ensured shared responsibilities and collaboration between
stakeholders. Additionally, the contractor employed advanced technologies, such as
RFID sensors, cameras, and laser scanners, to monitor work-in-place.
Since the contractor ensured a high level of maturity in terms of organizational
behavior and project controls strategies as defined in this research study, it was well
115
suited to adopt advanced information technologies. The contractor indicated the
company was using a commercial project repository tool to integrate project information,
including BIM information with estimating, construction, and control functions. For
instance, quantity takeoffs were taken from BIM. Also, productivity rates were retrieved
from historical data to estimate resource requirements, such as crew, material, and
equipment.
6.6.2 Implementation Study B—A Sequential Adoption of Strategies
This implementation study pertains to an owner organization in the health care
sector. This implementation study shows the strategies outlined in this research study
and how they should be leveraged sequentially. For more than 20 years, a legacy system
was used for managing projects. This system was effective at managing budgets and
schedules but not with detailed management of the projects. For instance, all contracts
were manually outlined, transactions were performed on paper, and data and reporting
were mostly shared through manual processes.
To enhance their project management practices, the owner organization set out to
find a new software vendor. Since the owner organization built 20% of its projects, the
vendor needed to meet both the needs of an owner and general contractor. Finally, a
software vendor was selected; this vendor had significant experience in proposing
integration tools that require minimal support.
Once the vendor was selected, leadership at the owner company assembled an
implementation team comprised of both field personnel and home office team members.
The vendor, in collaboration with the core group of experts, spent most of its time
developing and streamlining practices and processes. Also, project non-financial and
116
financial functions were reengineered in that order. Then, advanced information tools
were implemented to transmit information from these functions and processes.
Once the implementation was completed, a set of user acceptance tests were run
and only minor issues were detected. Finally, training manuals were developed to
accommodate the larger community at the owner organization to implement this new
system. In order to maintain the system, roles and responsibilities were assigned.
6.6.3 Implementation Study C—Software Alone Was Not the Solution: Two Failed
Efforts
A large oil and gas company was twice documented as expecting a commercial
software tool alone to improve its project control reporting capability. Without surprise
and due to bypassing the two categories of organizational behavior and project controls,
both instances failed.
The company procured software vendor services for a cost management tool for
its turnaround maintenance support with two major goals. First, it hoped to provide
forward-looking metrics to enable proactive decision-making. Second, it wanted to find
problem areas in a timely manner to effectively support planning and execution efforts.
The company existing systems used semi-automated spreadsheets to support cost
functions, but management’s vision was to provide a cost solution across all units. The
company focused only on acquiring and implementing a cost information integration tool
without considering the processes to be supported by the tool nor any clear business case
to design, capitalize, and lead such an implementation. The main plan of the company
was to implement the system on one refinery and assess if it could be used on all its
refineries.
117
The first pilot implementation commenced in the fall of one year, for a turnaround
project that was starting in January of the next year. Since the three-month lead time was
short, the team did not have enough time to validate the information tool. Also, the scope
of testing was unclear, as it was not focused on simple cost functions but rather trying to
uncover any potential issues. Additionally, the software vendor failed to generate timely
reports and address urgent issues as they occurred. It was also found that the database
and application servers were incorrectly sized, which needed more time and funding
during the pilot study.
A second pilot implementation effort commenced the following fall. To test the
vendor system, the team decided to implement it on a streamlined turnaround project in
tandem with the old spreadsheet management system. After the evaluation, it was
concluded that the software tool required more overhead and resources than the semi-
manual spreadsheets. Also, it took more time to generate reports and higher labor costs
for data entry than expected.
Due to the problems during the pilot implementation efforts, the company decided
to postpone the final acquisition of the software vendor services. It was determined that
more time is needed for the assessment of the software, an appropriate work code
structure should be developed beforehand, and a clear scope of implementation work
should also be determined.
118
CHAPTER 7: BENEFITS OF INSTANTANEOUS PROJECT CONTROLS
In this section, Survey 2 and statistical analysis of the CII Benchmarking and
Metrics Database (BM&M) is discussed in relation to how they fulfill objective 3—
quantifying the benefits of IPC—of this research project.
Survey 2 was intended to discover IPC elements, characteristics, and
requirements. As is discussed in this chapter, this survey investigated barriers and
benefits to the implementation of instantaneous project controls, functions that are being
monitored and controlled instantaneously, and also the perceived benefits of IPC on cost,
schedule, and quality across the four project phases of design, procurement, construction,
and commissioning and startup. Analysis of the 37 subject-matter responses revealed
that three of the top five barriers to IPC implementation related to information integration
and automated analytics (See Table 60), specifically, these barriers were lack of
information integration, lack of a standard data exchange protocol, and lack of automated
data analytics. As indicated by the findings from multiple lines of inquiry in this
research, the comparison with projects with a fully implemented instantaneous controls
capability is not yet possible. Thus, information integration and automated analytics
were taken as surrogates of instantaneous controls.
Incidentally, CII Benchmarking and Metrics survey version 11.0 had investigated
the maturity of internal and external information integration as well as automated
analytics within construction organizations. We utilized the useful portion (78 responses)
of this retrospective benchmarking database to quantify the benefits of IPC on project
performance. Furthermore, a second dataset from the BM&M database was retrieved
from CII containing summary statistics of cost data for 284 completed projects and
119
schedule data for 262 completed projects. This second dataset was used as a benchmark
to compare those high maturity projects—in terms of information integration and
automated analytics—within the first dataset of 78 projects.
7.1 Survey 2—Instantaneous Control Survey
In this section, Survey 2 design, respondent characteristics, and findings regarding
barriers and catalysts to IPC are delineated.
7.1.1 Design
In order to quantify and/or define the benefit and investment costs for
instantaneous project control (Research Objective 3) a second survey instrument was
created and distributed with a specific intent to establish the value proposition of
instantaneous controls capability. Respondents to Survey 2 included 37 subject-matter
experts affiliated with 18 separate organizations who responded to questions related to
barriers, benefits, project controls structures, or the existence of instantaneous control
functions within the organization. Survey 2 focuses questions at the organization level.
It was determined that data integration and data sharing are two critically important core
factors necessary to achieve instantaneous project controls.
7.1.2 Data Collection
The survey respondents on average had 24 years of experience (Question 6) in the
capital industry, of which 20 years pertained to project controls specifically. The
organizations involved in the survey provide a range of services and are mostly active in
the Industrial Industry sector (Table 51). The common contracting method was lump
sum (Table 52), and the most common project delivery was design-bid-build and design-
build (Table 53). Most projects were in the United States and Canada, although other
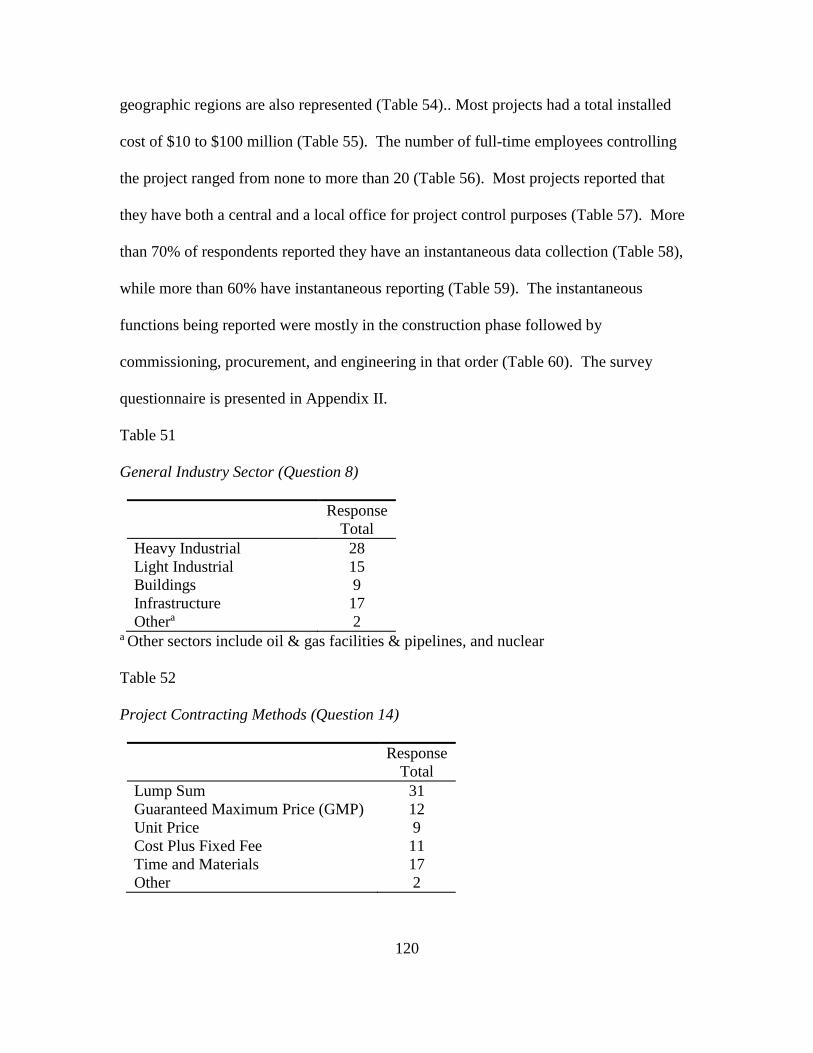
120
geographic regions are also represented (Table 54).. Most projects had a total installed
cost of $10 to $100 million (Table 55). The number of full-time employees controlling
the project ranged from none to more than 20 (Table 56). Most projects reported that
they have both a central and a local office for project control purposes (Table 57). More
than 70% of respondents reported they have an instantaneous data collection (Table 58),
while more than 60% have instantaneous reporting (Table 59). The instantaneous
functions being reported were mostly in the construction phase followed by
commissioning, procurement, and engineering in that order (Table 60). The survey
questionnaire is presented in Appendix II.
Table 51
General Industry Sector (Question 8)
Response
Total
Heavy Industrial 28
Light Industrial 15
Buildings 9
Infrastructure 17
Othera 2 a Other sectors include oil & gas facilities & pipelines, and nuclear
Table 52
Project Contracting Methods (Question 14)
Response
Total
Lump Sum 31
Guaranteed Maximum Price (GMP) 12
Unit Price 9
Cost Plus Fixed Fee 11
Time and Materials 17
Other 2
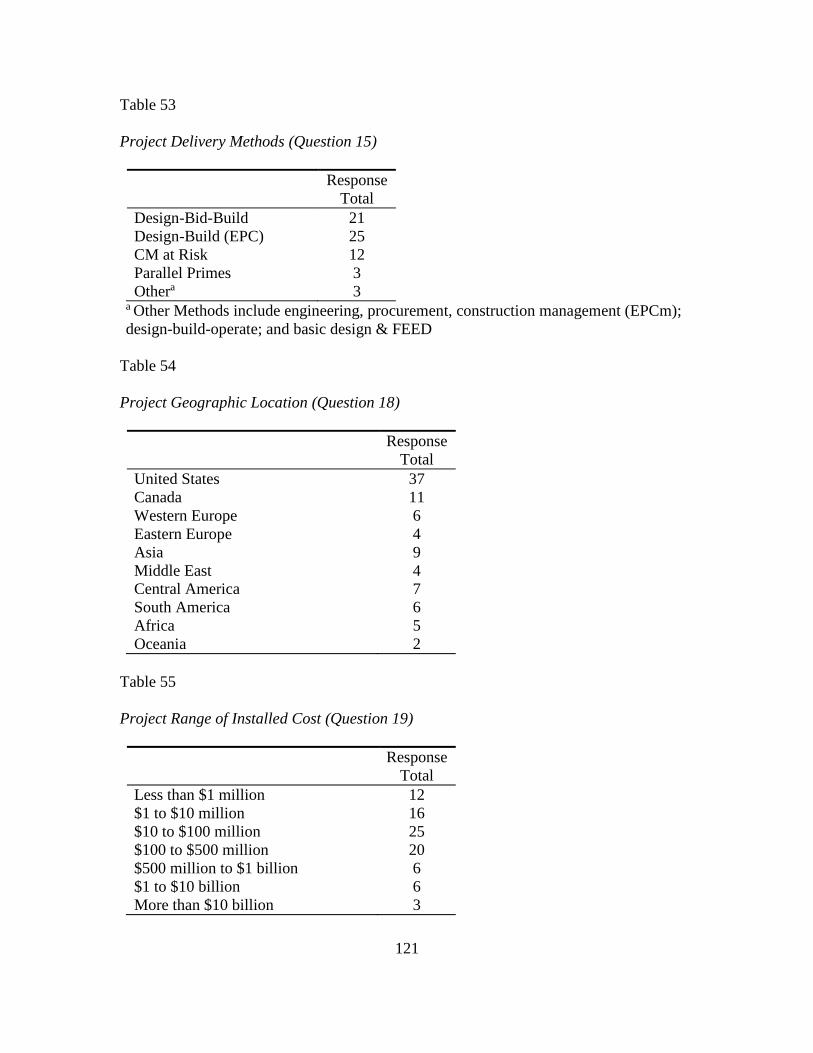
121
Table 53
Project Delivery Methods (Question 15)
Response
Total
Design-Bid-Build 21
Design-Build (EPC) 25
CM at Risk 12
Parallel Primes 3
Othera 3 a Other Methods include engineering, procurement, construction management (EPCm);
design-build-operate; and basic design & FEED
Table 54
Project Geographic Location (Question 18)
Response
Total
United States 37
Canada 11
Western Europe 6
Eastern Europe 4
Asia 9
Middle East 4
Central America 7
South America 6
Africa 5
Oceania 2
Table 55
Project Range of Installed Cost (Question 19)
Response
Total
Less than $1 million 12
$1 to $10 million 16
$10 to $100 million 25
$100 to $500 million 20
$500 million to $1 billion 6
$1 to $10 billion 6
More than $10 billion 3
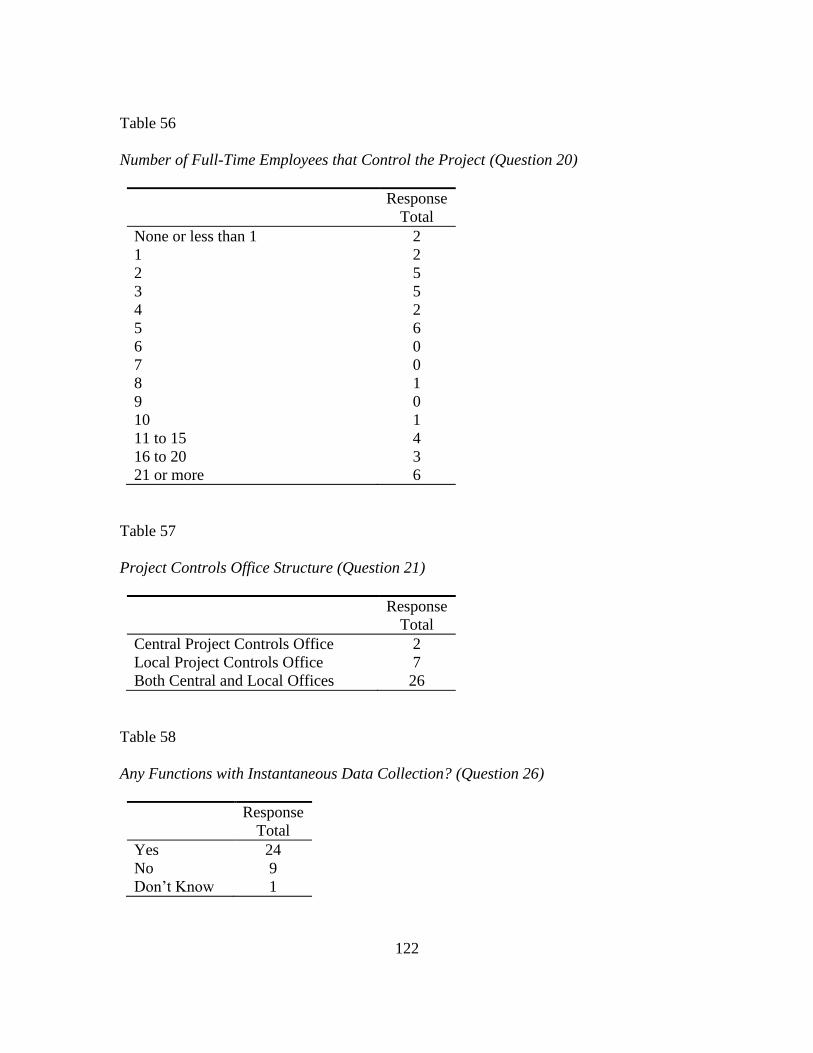
122
Table 56
Number of Full-Time Employees that Control the Project (Question 20)
Response
Total
None or less than 1 2
1 2
2 5
3 5
4 2
5 6
6 0
7 0
8 1
9 0
10 1
11 to 15 4
16 to 20 3
21 or more 6
Table 57
Project Controls Office Structure (Question 21)
Response
Total
Central Project Controls Office 2
Local Project Controls Office 7
Both Central and Local Offices 26
Table 58
Any Functions with Instantaneous Data Collection? (Question 26)
Response
Total
Yes 24
No 9
Don’t Know 1
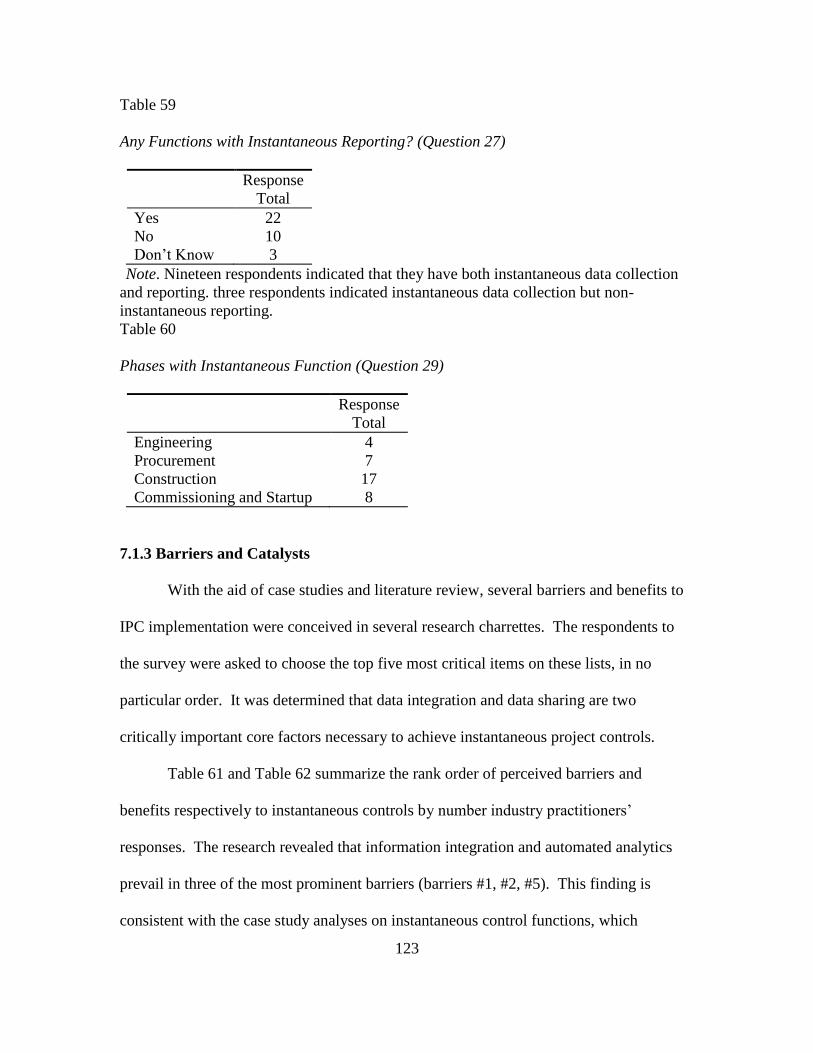
123
Table 59
Any Functions with Instantaneous Reporting? (Question 27)
Response
Total
Yes 22
No 10
Don’t Know 3
Note. Nineteen respondents indicated that they have both instantaneous data collection
and reporting. three respondents indicated instantaneous data collection but non-
instantaneous reporting.
Table 60
Phases with Instantaneous Function (Question 29)
Response
Total
Engineering 4
Procurement 7
Construction 17
Commissioning and Startup 8
7.1.3 Barriers and Catalysts
With the aid of case studies and literature review, several barriers and benefits to
IPC implementation were conceived in several research charrettes. The respondents to
the survey were asked to choose the top five most critical items on these lists, in no
particular order. It was determined that data integration and data sharing are two
critically important core factors necessary to achieve instantaneous project controls.
Table 61 and Table 62 summarize the rank order of perceived barriers and
benefits respectively to instantaneous controls by number industry practitioners’
responses. The research revealed that information integration and automated analytics
prevail in three of the most prominent barriers (barriers #1, #2, #5). This finding is
consistent with the case study analyses on instantaneous control functions, which
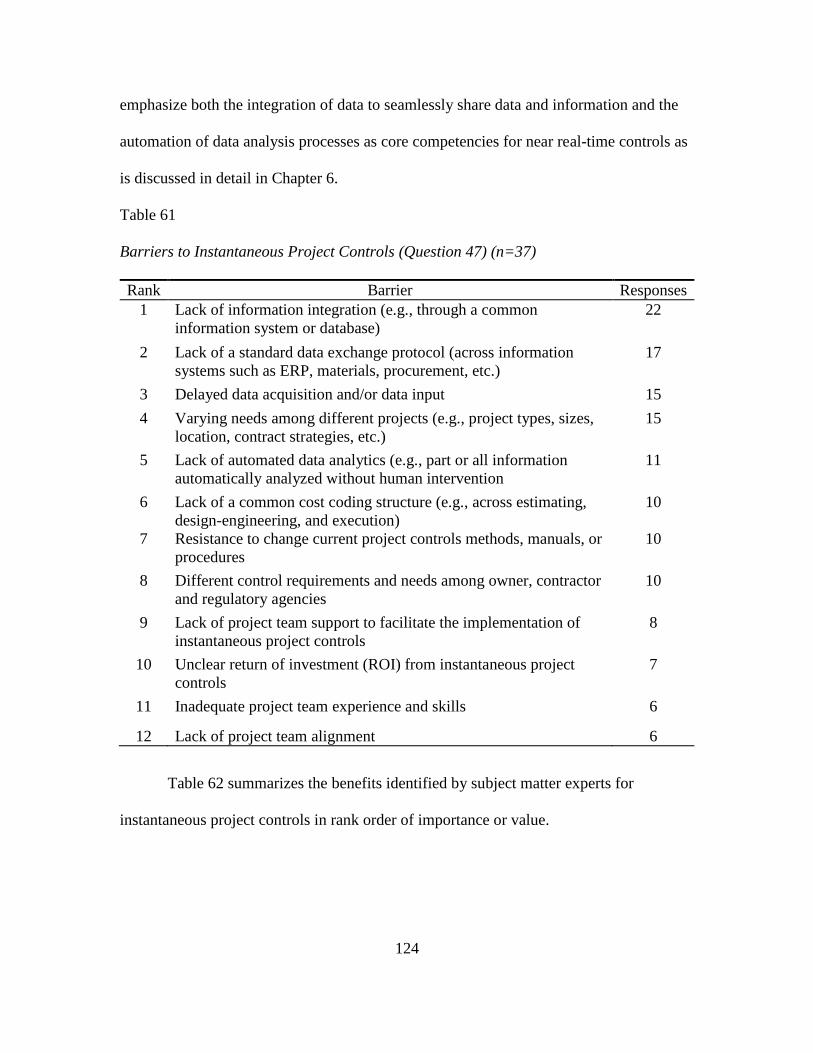
124
emphasize both the integration of data to seamlessly share data and information and the
automation of data analysis processes as core competencies for near real-time controls as
is discussed in detail in Chapter 6.
Table 61
Barriers to Instantaneous Project Controls (Question 47) (n=37)
Rank Barrier Responses
1 Lack of information integration (e.g., through a common
information system or database)
22
2 Lack of a standard data exchange protocol (across information
systems such as ERP, materials, procurement, etc.)
17
3 Delayed data acquisition and/or data input 15
4 Varying needs among different projects (e.g., project types, sizes,
location, contract strategies, etc.)
15
5 Lack of automated data analytics (e.g., part or all information
automatically analyzed without human intervention
11
6 Lack of a common cost coding structure (e.g., across estimating,
design-engineering, and execution)
10
7 Resistance to change current project controls methods, manuals, or
procedures
10
8 Different control requirements and needs among owner, contractor
and regulatory agencies
10
9 Lack of project team support to facilitate the implementation of
instantaneous project controls
8
10 Unclear return of investment (ROI) from instantaneous project
controls
7
11 Inadequate project team experience and skills 6
12 Lack of project team alignment 6
Table 62 summarizes the benefits identified by subject matter experts for
instantaneous project controls in rank order of importance or value.
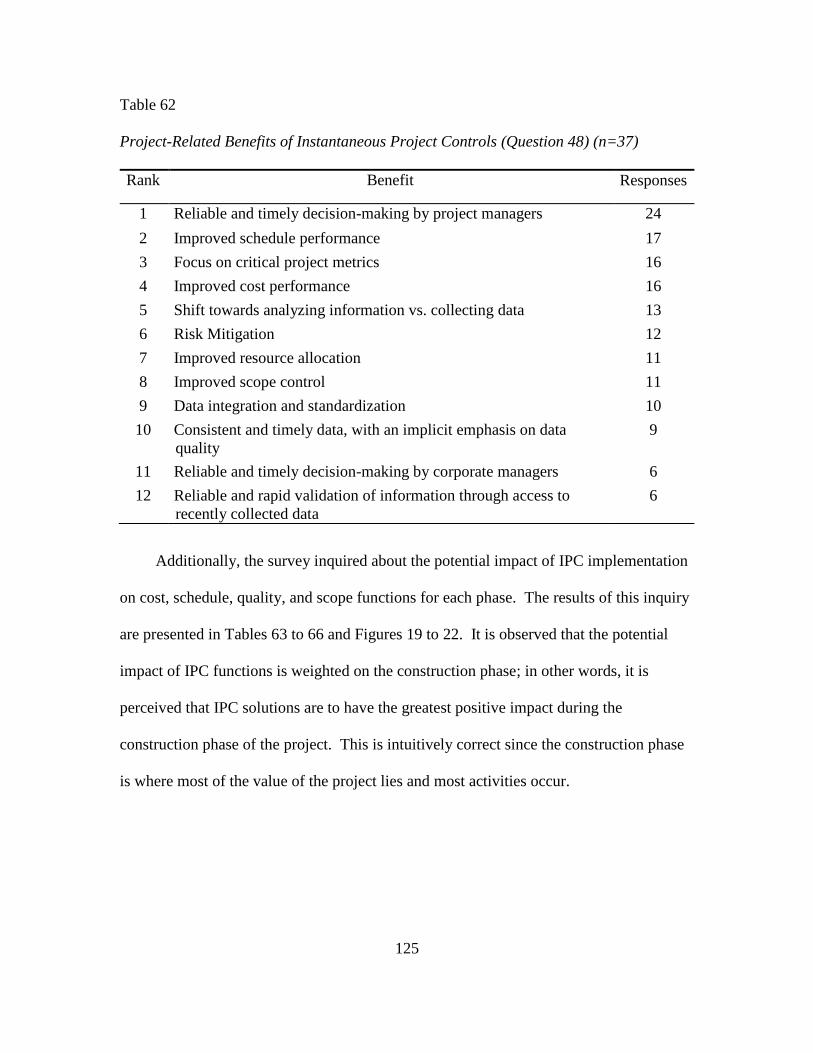
125
Table 62
Project-Related Benefits of Instantaneous Project Controls (Question 48) (n=37)
Rank Benefit Responses
1 Reliable and timely decision-making by project managers 24
2 Improved schedule performance 17
3 Focus on critical project metrics 16
4 Improved cost performance 16
5 Shift towards analyzing information vs. collecting data 13
6 Risk Mitigation 12
7 Improved resource allocation 11
8 Improved scope control 11
9 Data integration and standardization 10
10 Consistent and timely data, with an implicit emphasis on data
quality
9
11 Reliable and timely decision-making by corporate managers 6
12 Reliable and rapid validation of information through access to
recently collected data
6
Additionally, the survey inquired about the potential impact of IPC implementation
on cost, schedule, quality, and scope functions for each phase. The results of this inquiry
are presented in Tables 63 to 66 and Figures 19 to 22. It is observed that the potential
impact of IPC functions is weighted on the construction phase; in other words, it is
perceived that IPC solutions are to have the greatest positive impact during the
construction phase of the project. This is intuitively correct since the construction phase
is where most of the value of the project lies and most activities occur.
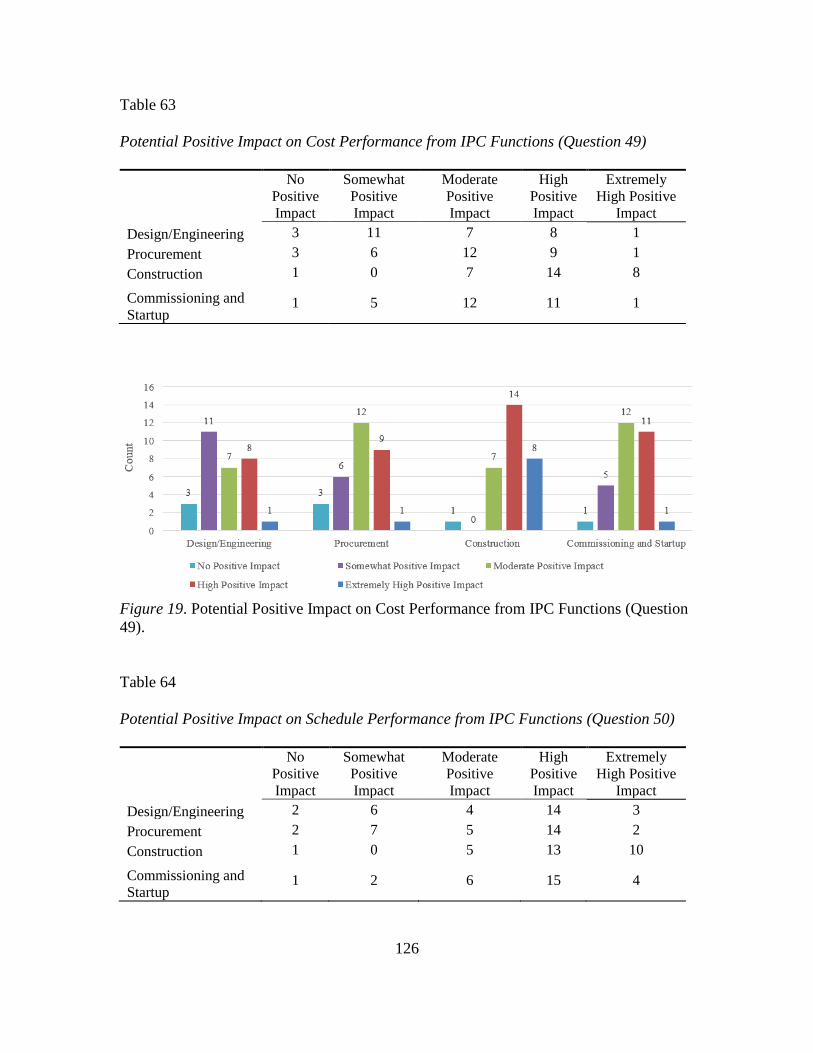
126
Table 63
Potential Positive Impact on Cost Performance from IPC Functions (Question 49)
No
Positive
Impact
Somewhat
Positive
Impact
Moderate
Positive
Impact
High
Positive
Impact
Extremely
High Positive
Impact
Design/Engineering 3 11 7 8 1
Procurement 3 6 12 9 1
Construction 1 0 7 14 8
Commissioning and
Startup 1 5 12 11 1
Figure 19. Potential Positive Impact on Cost Performance from IPC Functions (Question
49).
Table 64
Potential Positive Impact on Schedule Performance from IPC Functions (Question 50)
No
Positive
Impact
Somewhat
Positive
Impact
Moderate
Positive
Impact
High
Positive
Impact
Extremely
High Positive
Impact
Design/Engineering 2 6 4 14 3
Procurement 2 7 5 14 2
Construction 1 0 5 13 10
Commissioning and
Startup 1 2 6 15 4
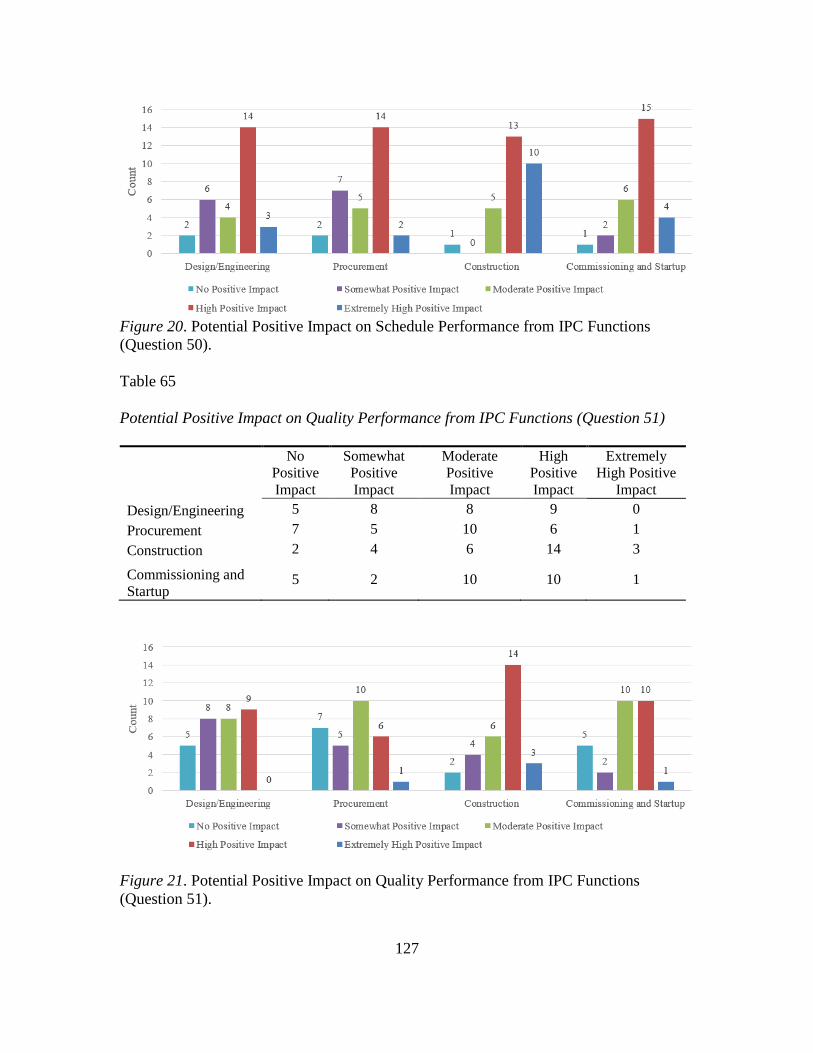
127
Figure 20. Potential Positive Impact on Schedule Performance from IPC Functions
(Question 50).
Table 65
Potential Positive Impact on Quality Performance from IPC Functions (Question 51)
No
Positive
Impact
Somewhat
Positive
Impact
Moderate
Positive
Impact
High
Positive
Impact
Extremely
High Positive
Impact
Design/Engineering 5 8 8 9 0
Procurement 7 5 10 6 1
Construction 2 4 6 14 3
Commissioning and
Startup 5 2 10 10 1
Figure 21. Potential Positive Impact on Quality Performance from IPC Functions
(Question 51).
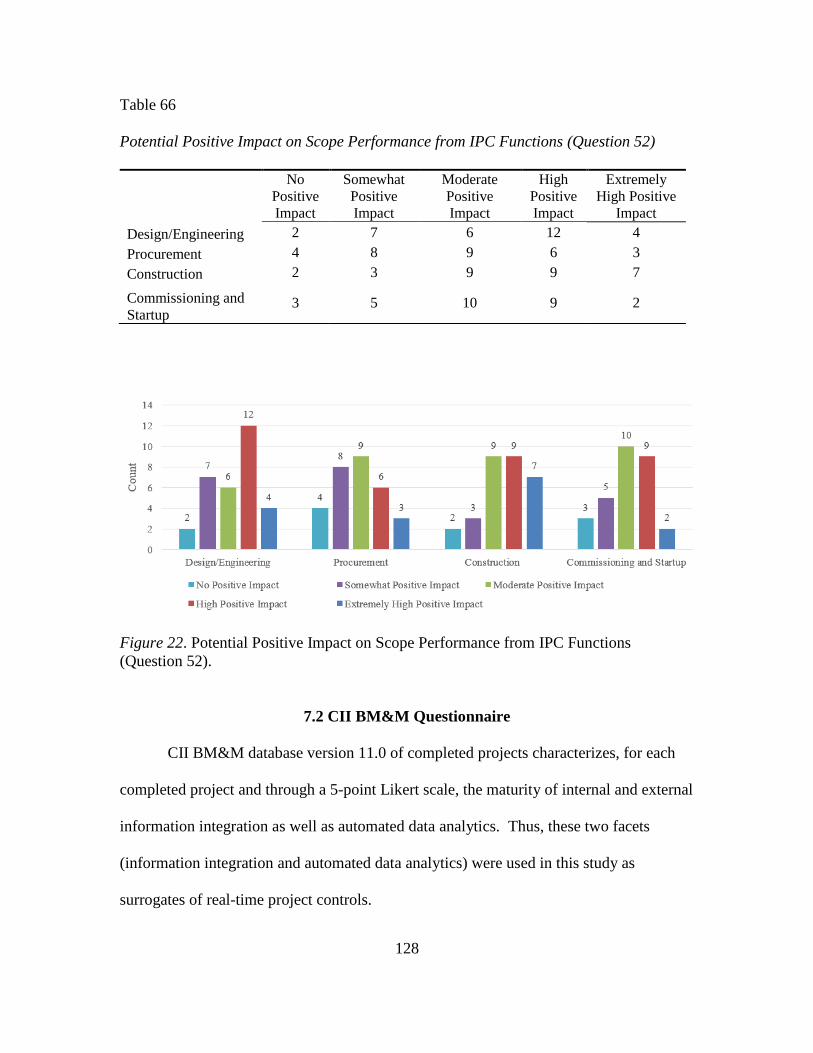
128
Table 66
Potential Positive Impact on Scope Performance from IPC Functions (Question 52)
No
Positive
Impact
Somewhat
Positive
Impact
Moderate
Positive
Impact
High
Positive
Impact
Extremely
High Positive
Impact
Design/Engineering 2 7 6 12 4
Procurement 4 8 9 6 3
Construction 2 3 9 9 7
Commissioning and
Startup 3 5 10 9 2
Figure 22. Potential Positive Impact on Scope Performance from IPC Functions
(Question 52).
7.2 CII BM&M Questionnaire
CII BM&M database version 11.0 of completed projects characterizes, for each
completed project and through a 5-point Likert scale, the maturity of internal and external
information integration as well as automated data analytics. Thus, these two facets
(information integration and automated data analytics) were used in this study as
surrogates of real-time project controls.
129
The newly reported dataset pertains to a sample of 78 projects with a total
installed cost of $8 billion, which was used for statistical analysis purposes. The projects
were completed between 2008 and 2013. The CII project data represents both owner and
contractor completed projects for U.S. domestic and international projects. Most projects
in the sample were performed in the heavy and light industrial sectors (Table 67). The
majority of the 78 projects had been delivered though DBB, DB (or EPC), and Parallel
Primes. The top project business drivers were operability and production capacity. The
project driver for half of the reported projects was both cost and schedule, while the
driver for the other projects was either cost or schedule. In terms of contract types, the
presence of cost reimbursable and lump sum contracts was prevalent across project
phases. Most projects were defined as either grassroots or modernization nature. Other
project characteristics can be viewed in Tables 68 to 78.

130
Table 67
Project Mix
Population
Characteristic Classes
Number of
Projects
Percent of
Projects
Company Type Owner 60 77
Contractor 18 23
Industry Sector
Heavy Industrial 37 47.3
Light Industrial 15 19.2
Building 19 24.5
Infrastructure 7 9
Total Installed
Cost
< $5 million 11 14.1
$5-$15 million 9 11.5
$15-$50 million 23 29.5
$50-$100 million 10 12.8
$100-$500 million 13 16.7
> $500 million 6 7.7
Project Nature
Grassroots 23 29.5
Brownfield 9 11.5
Modernization 30 38.5
Addition 15 19.2
Other 1 1.3
Project Locations Domestic (U.S.) 59 76
International 19 24
Delivery Method
Traditional DBB 40 51.3
Design Build 21 27
Parallel Primes 11 14
CM@Risk 5 6.4
Other 1 1.3
Table 68
Projects’ Distribution by Project Country (%)
United
States Canada
United
Kingdom Spain Egypt Italy Belgium China Singapore
77 11.6 2.6 2.6 2.6 2.6 1.3 1.3 1.3

131
Table 69
Projects’ Distribution by Project Industry Group (%)
Heavy
Industrial
Light
Industrial Building Infrastructure
47.4 19.2 24.6 9
Table 70
Projects’ Distribution by Project Nature (%)
Grassroots Brownfield Modernization Addition Other
29.5 11.5 38.5 19.2 1.3
Table 71
Projects’ Distribution by Project Business Driver (%)
Quality Risk Production
Capacity Operability Environmental Social Other
18 23% 44.9 43.6 25.6 9 10.3
Table 72
Projects’ Distribution by Project Priority (%)
Project
Cost
Project
Schedule
Project
Balanced
21.8 28.2 50
Table 73
Projects’ Distribution by Project Cost Category (%)
< $5M $5M-
$15M
$15M-
$50M
$50M-
$100M
$100M-
$500M
>
$500M
14.1 11.5 29.5 12.8 16.7 7.7
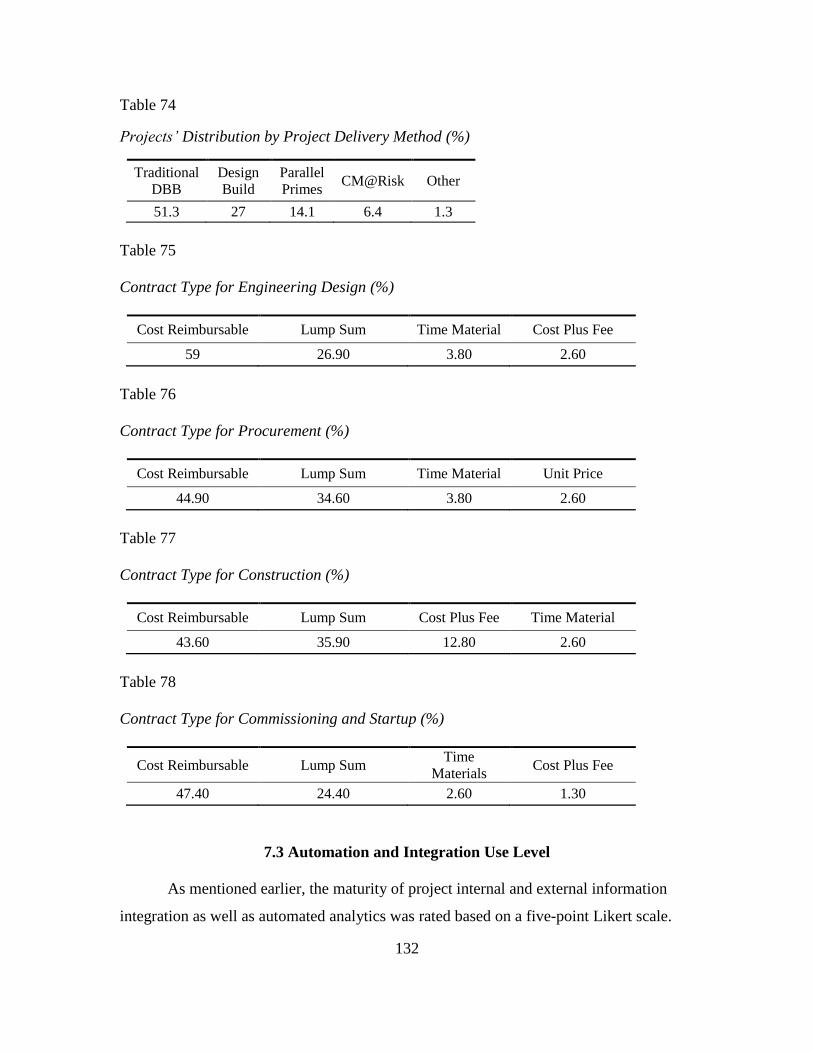
132
Table 74
Projects’ Distribution by Project Delivery Method (%)
Traditional
DBB
Design
Build
Parallel
Primes CM@Risk Other
51.3 27 14.1 6.4 1.3
Table 75
Contract Type for Engineering Design (%)
Cost Reimbursable Lump Sum Time Material Cost Plus Fee
59 26.90 3.80 2.60
Table 76
Contract Type for Procurement (%)
Cost Reimbursable Lump Sum Time Material Unit Price
44.90 34.60 3.80 2.60
Table 77
Contract Type for Construction (%)
Cost Reimbursable Lump Sum Cost Plus Fee Time Material
43.60 35.90 12.80 2.60
Table 78
Contract Type for Commissioning and Startup (%)
Cost Reimbursable Lump Sum Time
Materials Cost Plus Fee
47.40 24.40 2.60 1.30
7.3 Automation and Integration Use Level
As mentioned earlier, the maturity of project internal and external information
integration as well as automated analytics was rated based on a five-point Likert scale.
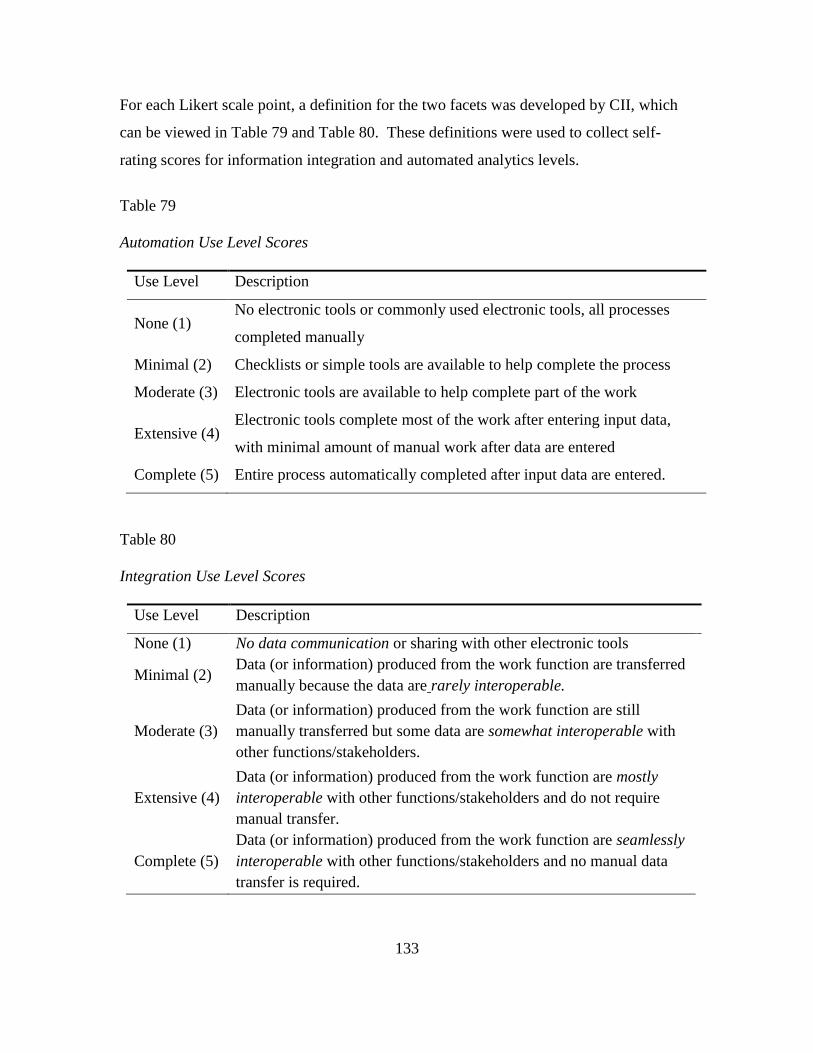
133
For each Likert scale point, a definition for the two facets was developed by CII, which
can be viewed in Table 79 and Table 80. These definitions were used to collect self-
rating scores for information integration and automated analytics levels.
Table 79
Automation Use Level Scores
Use Level Description
None (1) No electronic tools or commonly used electronic tools, all processes
completed manually
Minimal (2) Checklists or simple tools are available to help complete the process
Moderate (3) Electronic tools are available to help complete part of the work
Extensive (4) Electronic tools complete most of the work after entering input data,
with minimal amount of manual work after data are entered
Complete (5) Entire process automatically completed after input data are entered.
Table 80
Integration Use Level Scores
Use Level Description
None (1) No data communication or sharing with other electronic tools
Minimal (2) Data (or information) produced from the work function are transferred
manually because the data are rarely interoperable.
Moderate (3)
Data (or information) produced from the work function are still
manually transferred but some data are somewhat interoperable with
other functions/stakeholders.
Extensive (4)
Data (or information) produced from the work function are mostly
interoperable with other functions/stakeholders and do not require
manual transfer.
Complete (5)
Data (or information) produced from the work function are seamlessly
interoperable with other functions/stakeholders and no manual data
transfer is required.
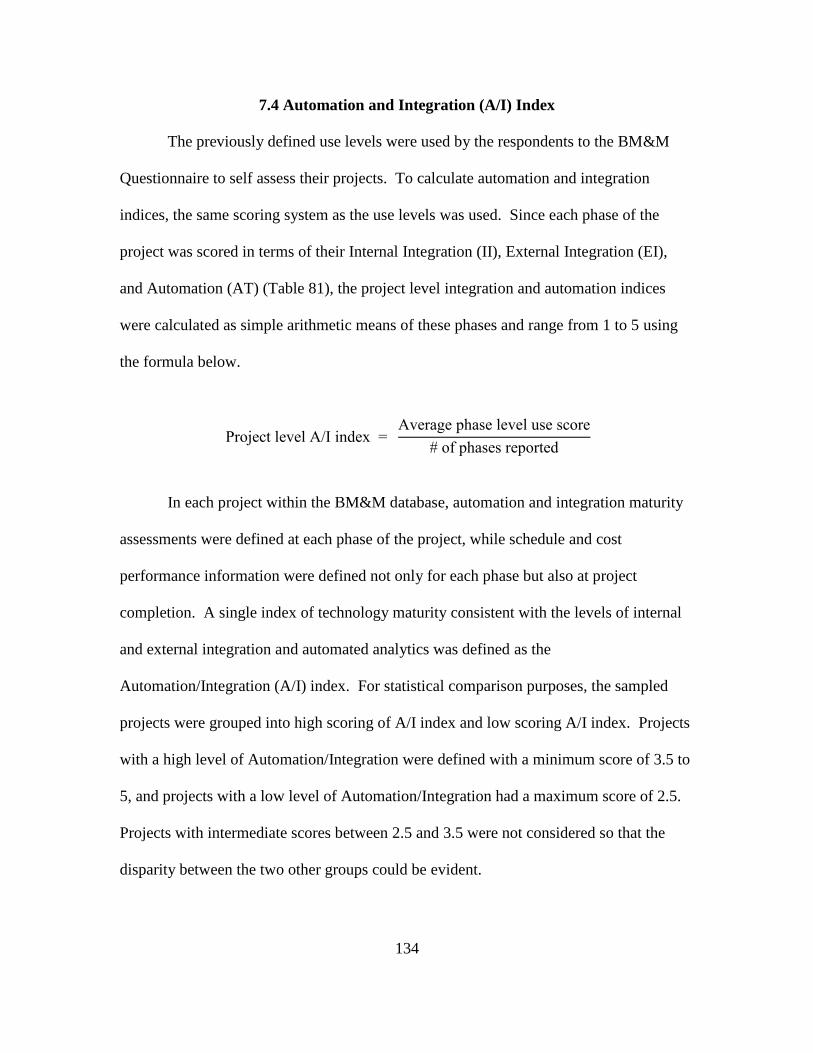
134
7.4 Automation and Integration (A/I) Index
The previously defined use levels were used by the respondents to the BM&M
Questionnaire to self assess their projects. To calculate automation and integration
indices, the same scoring system as the use levels was used. Since each phase of the
project was scored in terms of their Internal Integration (II), External Integration (EI),
and Automation (AT) (Table 81), the project level integration and automation indices
were calculated as simple arithmetic means of these phases and range from 1 to 5 using
the formula below.
Project level A/I index = Average phase level use score
# of phases reported
In each project within the BM&M database, automation and integration maturity
assessments were defined at each phase of the project, while schedule and cost
performance information were defined not only for each phase but also at project
completion. A single index of technology maturity consistent with the levels of internal
and external integration and automated analytics was defined as the
Automation/Integration (A/I) index. For statistical comparison purposes, the sampled
projects were grouped into high scoring of A/I index and low scoring A/I index. Projects
with a high level of Automation/Integration were defined with a minimum score of 3.5 to
5, and projects with a low level of Automation/Integration had a maximum score of 2.5.
Projects with intermediate scores between 2.5 and 3.5 were not considered so that the
disparity between the two other groups could be evident.
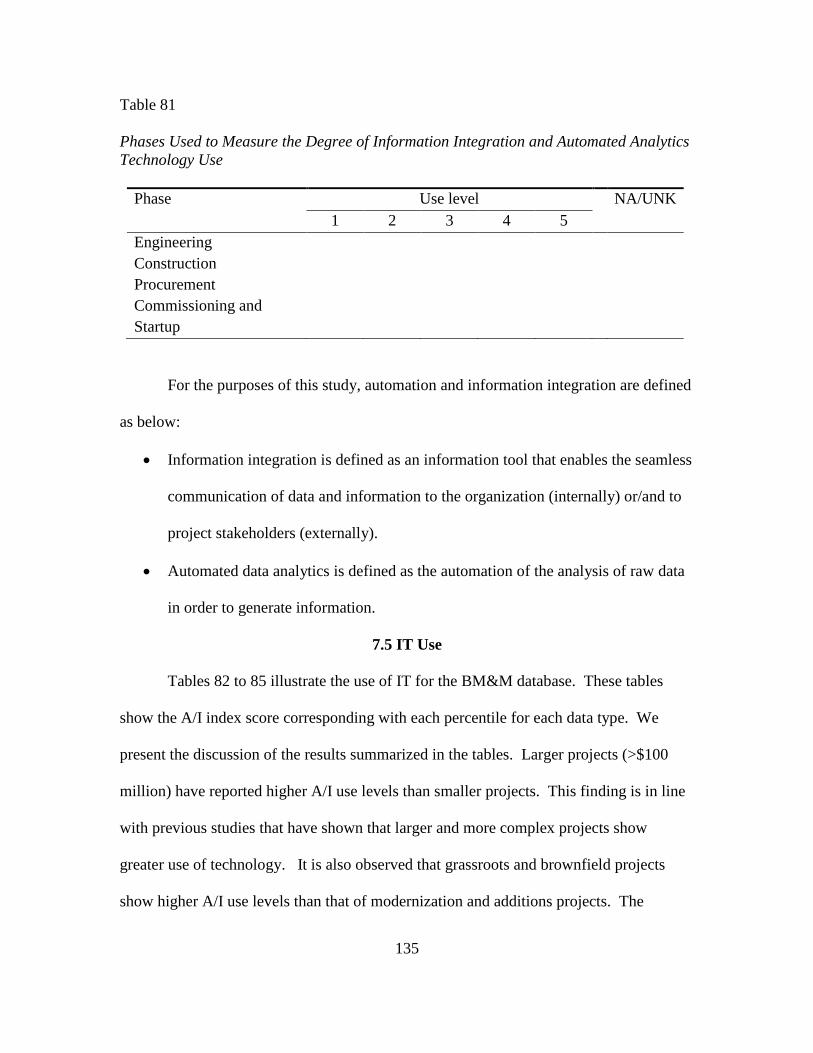
135
Table 81
Phases Used to Measure the Degree of Information Integration and Automated Analytics
Technology Use
Phase Use level NA/UNK
1 2 3 4 5
Engineering
Construction
Procurement
Commissioning and
Startup
For the purposes of this study, automation and information integration are defined
as below:
Information integration is defined as an information tool that enables the seamless
communication of data and information to the organization (internally) or/and to
project stakeholders (externally).
Automated data analytics is defined as the automation of the analysis of raw data
in order to generate information.
7.5 IT Use
Tables 82 to 85 illustrate the use of IT for the BM&M database. These tables
show the A/I index score corresponding with each percentile for each data type. We
present the discussion of the results summarized in the tables. Larger projects (>$100
million) have reported higher A/I use levels than smaller projects. This finding is in line
with previous studies that have shown that larger and more complex projects show
greater use of technology. It is also observed that grassroots and brownfield projects
show higher A/I use levels than that of modernization and additions projects. The
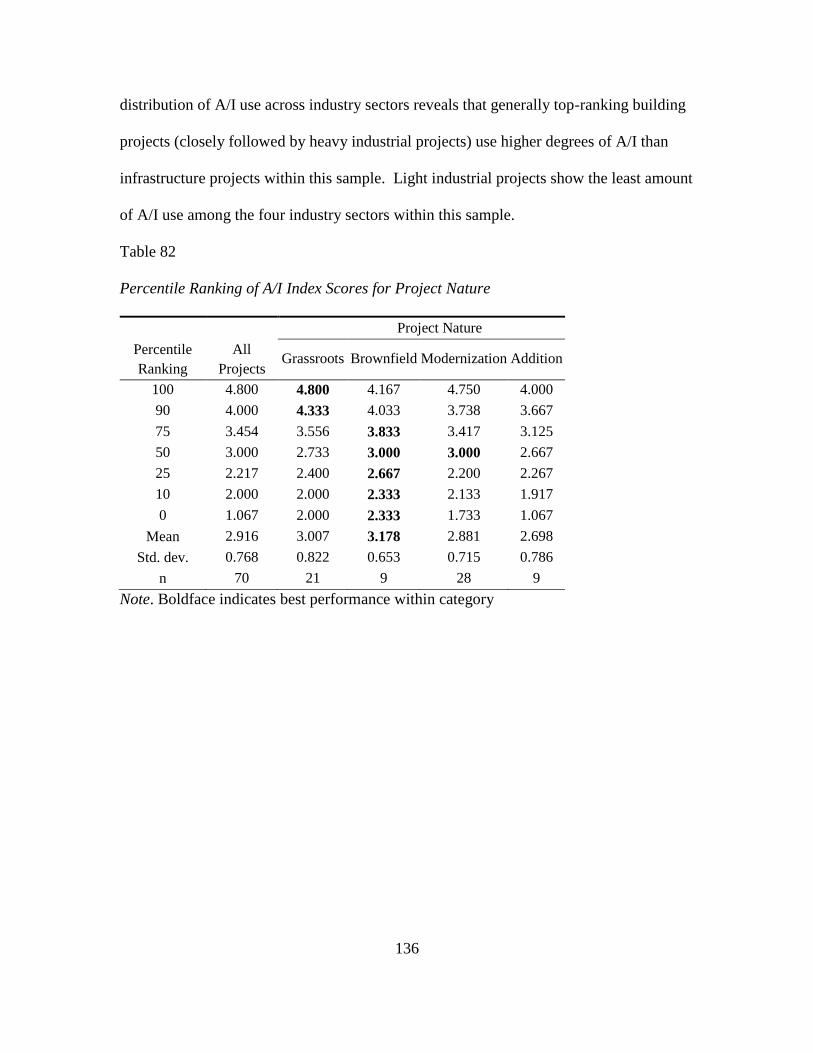
136
distribution of A/I use across industry sectors reveals that generally top-ranking building
projects (closely followed by heavy industrial projects) use higher degrees of A/I than
infrastructure projects within this sample. Light industrial projects show the least amount
of A/I use among the four industry sectors within this sample.
Table 82
Percentile Ranking of A/I Index Scores for Project Nature
Project Nature
Percentile
Ranking
All
Projects Grassroots Brownfield Modernization Addition
100 4.800 4.800 4.167 4.750 4.000
90 4.000 4.333 4.033 3.738 3.667
75 3.454 3.556 3.833 3.417 3.125
50 3.000 2.733 3.000 3.000 2.667
25 2.217 2.400 2.667 2.200 2.267
10 2.000 2.000 2.333 2.133 1.917
0 1.067 2.000 2.333 1.733 1.067
Mean 2.916 3.007 3.178 2.881 2.698
Std. dev. 0.768 0.822 0.653 0.715 0.786
n 70 21 9 28 9
Note. Boldface indicates best performance within category
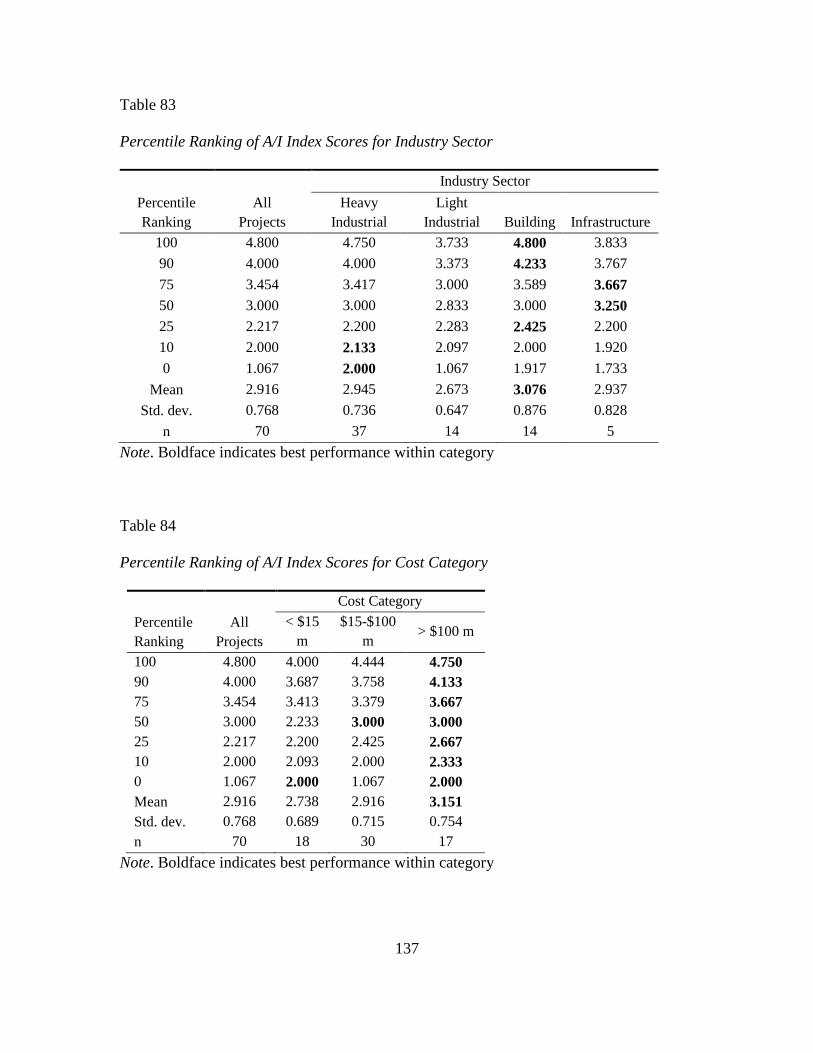
137
Table 83
Percentile Ranking of A/I Index Scores for Industry Sector
Industry Sector
Percentile
Ranking
All
Projects
Heavy
Industrial
Light
Industrial Building Infrastructure
100 4.800 4.750 3.733 4.800 3.833
90 4.000 4.000 3.373 4.233 3.767
75 3.454 3.417 3.000 3.589 3.667
50 3.000 3.000 2.833 3.000 3.250
25 2.217 2.200 2.283 2.425 2.200
10 2.000 2.133 2.097 2.000 1.920
0 1.067 2.000 1.067 1.917 1.733
Mean 2.916 2.945 2.673 3.076 2.937
Std. dev. 0.768 0.736 0.647 0.876 0.828
n 70 37 14 14 5
Note. Boldface indicates best performance within category
Table 84
Percentile Ranking of A/I Index Scores for Cost Category
Cost Category
Percentile
Ranking
All
Projects
< $15
m
$15-$100
m > $100 m
100 4.800 4.000 4.444 4.750
90 4.000 3.687 3.758 4.133
75 3.454 3.413 3.379 3.667
50 3.000 2.233 3.000 3.000
25 2.217 2.200 2.425 2.667
10 2.000 2.093 2.000 2.333
0 1.067 2.000 1.067 2.000
Mean 2.916 2.738 2.916 3.151
Std. dev. 0.768 0.689 0.715 0.754
n 70 18 30 17
Note. Boldface indicates best performance within category
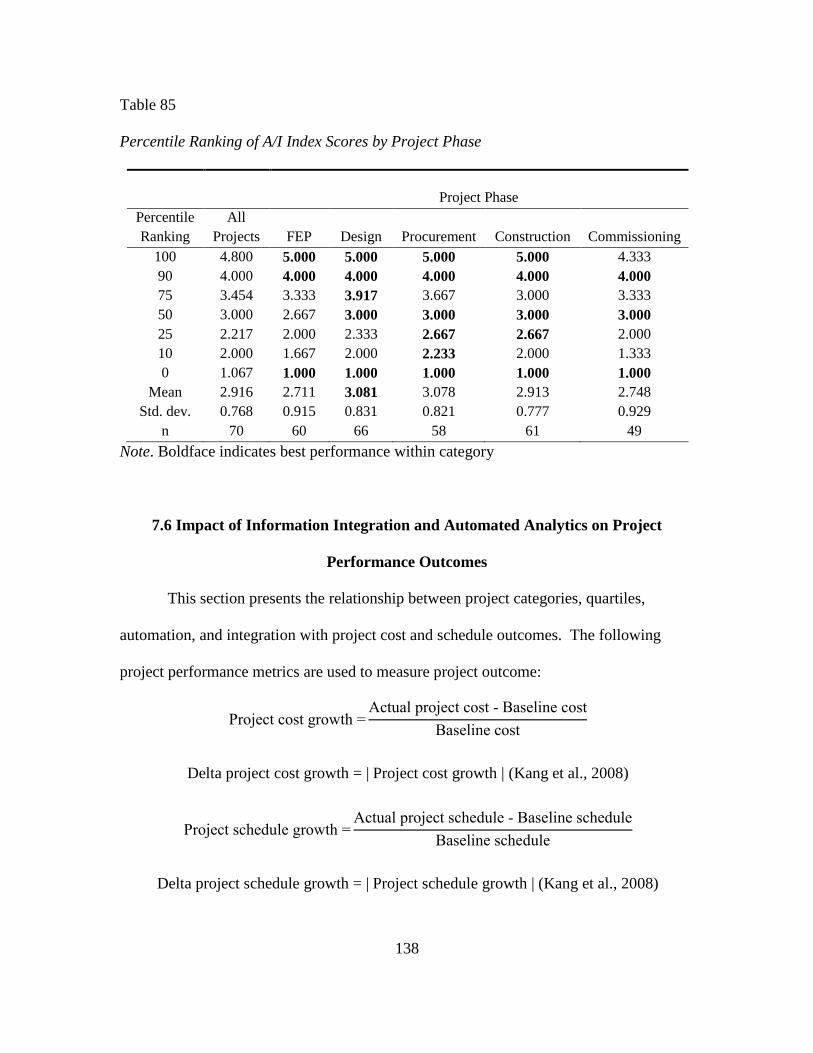
138
Table 85
Percentile Ranking of A/I Index Scores by Project Phase
Project Phase
Percentile
Ranking
All
Projects FEP Design Procurement Construction Commissioning
100 4.800 5.000 5.000 5.000 5.000 4.333
90 4.000 4.000 4.000 4.000 4.000 4.000
75 3.454 3.333 3.917 3.667 3.000 3.333
50 3.000 2.667 3.000 3.000 3.000 3.000
25 2.217 2.000 2.333 2.667 2.667 2.000
10 2.000 1.667 2.000 2.233 2.000 1.333
0 1.067 1.000 1.000 1.000 1.000 1.000
Mean 2.916 2.711 3.081 3.078 2.913 2.748
Std. dev. 0.768 0.915 0.831 0.821 0.777 0.929
n 70 60 66 58 61 49
Note. Boldface indicates best performance within category
7.6 Impact of Information Integration and Automated Analytics on Project
Performance Outcomes
This section presents the relationship between project categories, quartiles,
automation, and integration with project cost and schedule outcomes. The following
project performance metrics are used to measure project outcome:
Project cost growth =Actual project cost - Baseline cost
Baseline cost
Delta project cost growth = | Project cost growth | (Kang et al., 2008)
Project schedule growth =Actual project schedule - Baseline schedule
Baseline schedule
Delta project schedule growth = | Project schedule growth | (Kang et al., 2008)
139
Project cost and schedule growth indicate overrun and underrun of project
performance outcome. Smaller values indicate better performance. While Delta project
cost and schedule growth indicate the predictability of baseline estimates, closer values to
zero indicate better outcome predictability. Extreme outliers were defined as any value
3.5 times standard deviation away from the median and were eliminated to reduce bias in
results.
To better understand the dataset, project performance outcomes are presented
based on categories (Tables 86 to 88). It is observed that as projects become larger (in
terms of installed cost) cost and schedule growth as well as delta project schedule growth
become worse, while delta project cost growth demonstrates better performance.
Looking at project performance by project nature reveals modernization projects having
the best project cost and schedule growth performance as well as best schedule
predictability. On the other hand, addition projects demonstrate better cost predictability
performance. Looking at project performance by industry sector reveals that
infrastructure projects perform best in terms of project cost growth, but since the number
of data points for infrastructure projects is small (n=5), by disregarding these projects
light industrial projects demonstrate overall superior cost and schedule performance in
terms of growth and predictability.
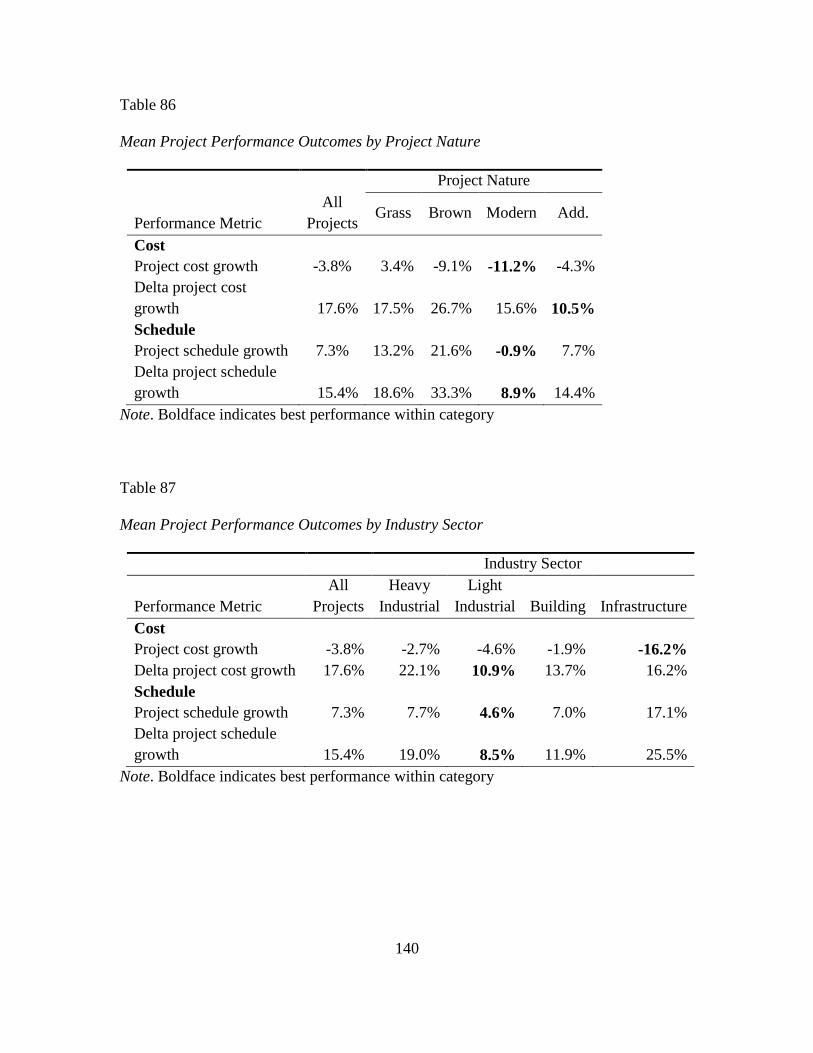
140
Table 86
Mean Project Performance Outcomes by Project Nature
Project Nature
Performance Metric
All
Projects Grass Brown Modern Add.
Cost
Project cost growth -3.8% 3.4% -9.1% -11.2% -4.3%
Delta project cost
growth 17.6% 17.5% 26.7% 15.6% 10.5%
Schedule
Project schedule growth 7.3% 13.2% 21.6% -0.9% 7.7%
Delta project schedule
growth 15.4% 18.6% 33.3% 8.9% 14.4%
Note. Boldface indicates best performance within category
Table 87
Mean Project Performance Outcomes by Industry Sector
Industry Sector
Performance Metric
All
Projects
Heavy
Industrial
Light
Industrial Building Infrastructure
Cost
Project cost growth -3.8% -2.7% -4.6% -1.9% -16.2%
Delta project cost growth 17.6% 22.1% 10.9% 13.7% 16.2%
Schedule
Project schedule growth 7.3% 7.7% 4.6% 7.0% 17.1%
Delta project schedule
growth 15.4% 19.0% 8.5% 11.9% 25.5%
Note. Boldface indicates best performance within category
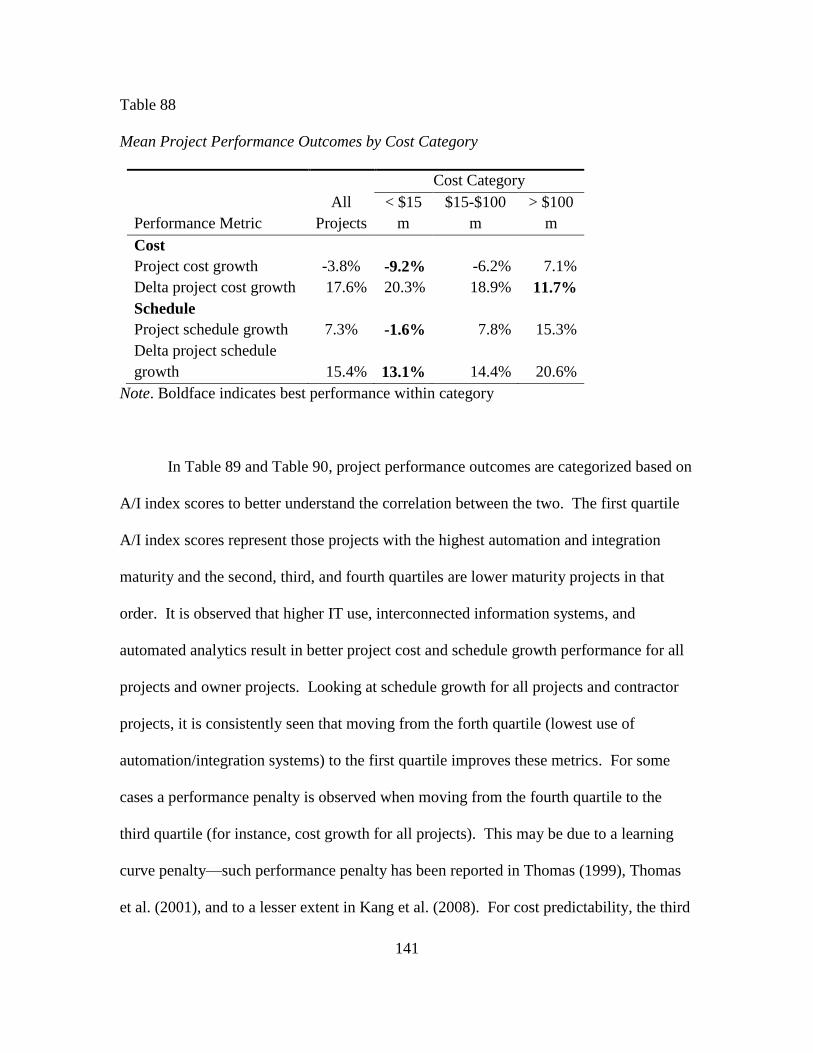
141
Table 88
Mean Project Performance Outcomes by Cost Category
Cost Category
Performance Metric
All
Projects
< $15
m
$15-$100
m
> $100
m
Cost
Project cost growth -3.8% -9.2% -6.2% 7.1%
Delta project cost growth 17.6% 20.3% 18.9% 11.7%
Schedule
Project schedule growth 7.3% -1.6% 7.8% 15.3%
Delta project schedule
growth 15.4% 13.1% 14.4% 20.6%
Note. Boldface indicates best performance within category
In Table 89 and Table 90, project performance outcomes are categorized based on
A/I index scores to better understand the correlation between the two. The first quartile
A/I index scores represent those projects with the highest automation and integration
maturity and the second, third, and fourth quartiles are lower maturity projects in that
order. It is observed that higher IT use, interconnected information systems, and
automated analytics result in better project cost and schedule growth performance for all
projects and owner projects. Looking at schedule growth for all projects and contractor
projects, it is consistently seen that moving from the forth quartile (lowest use of
automation/integration systems) to the first quartile improves these metrics. For some
cases a performance penalty is observed when moving from the fourth quartile to the
third quartile (for instance, cost growth for all projects). This may be due to a learning
curve penalty—such performance penalty has been reported in Thomas (1999), Thomas
et al. (2001), and to a lesser extent in Kang et al. (2008). For cost predictability, the third
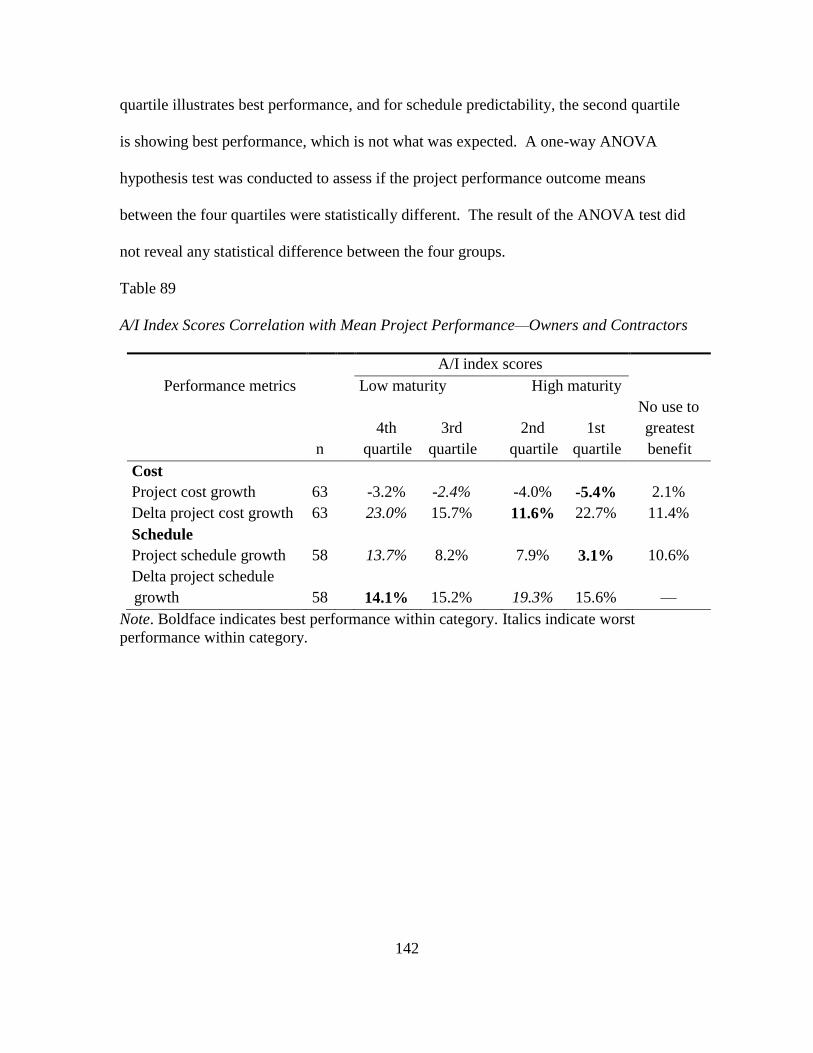
142
quartile illustrates best performance, and for schedule predictability, the second quartile
is showing best performance, which is not what was expected. A one-way ANOVA
hypothesis test was conducted to assess if the project performance outcome means
between the four quartiles were statistically different. The result of the ANOVA test did
not reveal any statistical difference between the four groups.
Table 89
A/I Index Scores Correlation with Mean Project Performance—Owners and Contractors
A/I index scores
Performance metrics Low maturity High maturity
n
4th
quartile
3rd
quartile
2nd
quartile
1st
quartile
No use to
greatest
benefit
Cost
Project cost growth 63 -3.2% -2.4% -4.0% -5.4% 2.1%
Delta project cost growth 63 23.0% 15.7% 11.6% 22.7% 11.4%
Schedule
Project schedule growth 58 13.7% 8.2% 7.9% 3.1% 10.6%
Delta project schedule
growth 58 14.1% 15.2% 19.3% 15.6% —
Note. Boldface indicates best performance within category. Italics indicate worst
performance within category.
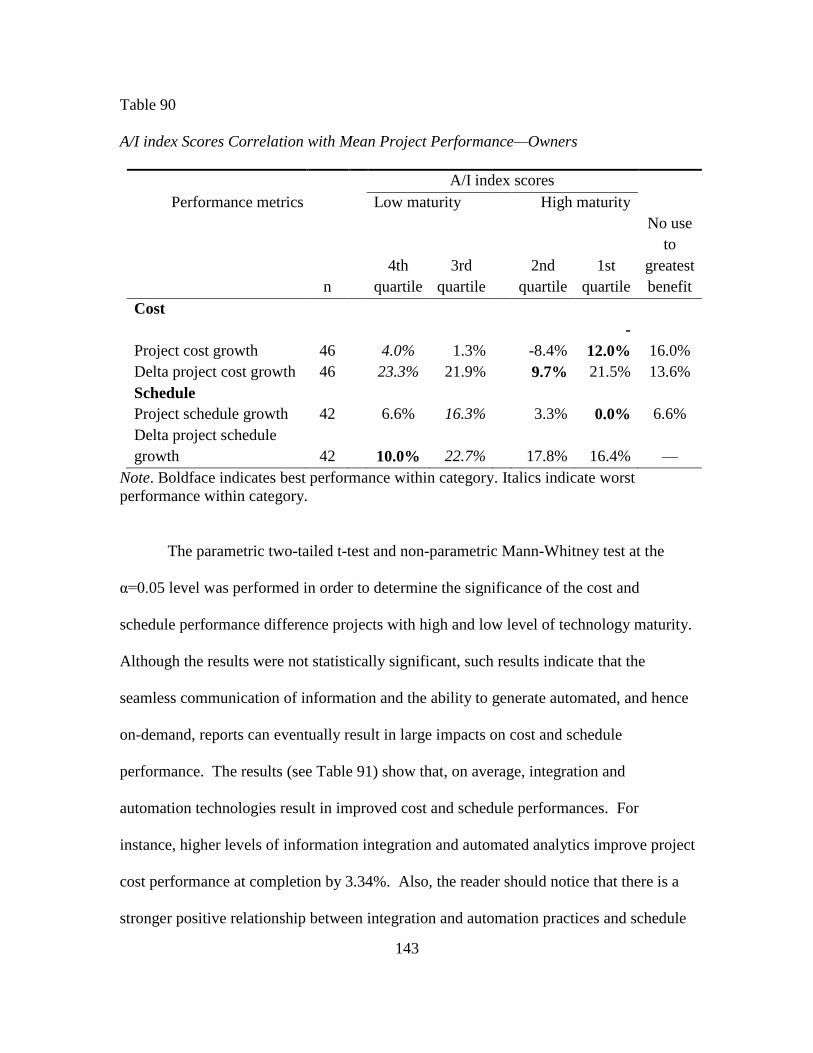
143
Table 90
A/I index Scores Correlation with Mean Project Performance—Owners
A/I index scores
Performance metrics Low maturity High maturity
n
4th
quartile
3rd
quartile
2nd
quartile
1st
quartile
No use
to
greatest
benefit
Cost
Project cost growth 46 4.0% 1.3% -8.4%
-
12.0% 16.0%
Delta project cost growth 46 23.3% 21.9% 9.7% 21.5% 13.6%
Schedule
Project schedule growth 42 6.6% 16.3% 3.3% 0.0% 6.6%
Delta project schedule
growth 42 10.0% 22.7% 17.8% 16.4% —
Note. Boldface indicates best performance within category. Italics indicate worst
performance within category.
The parametric two-tailed t-test and non-parametric Mann-Whitney test at the
α=0.05 level was performed in order to determine the significance of the cost and
schedule performance difference projects with high and low level of technology maturity.
Although the results were not statistically significant, such results indicate that the
seamless communication of information and the ability to generate automated, and hence
on-demand, reports can eventually result in large impacts on cost and schedule
performance. The results (see Table 91) show that, on average, integration and
automation technologies result in improved cost and schedule performances. For
instance, higher levels of information integration and automated analytics improve project
cost performance at completion by 3.34%. Also, the reader should notice that there is a
stronger positive relationship between integration and automation practices and schedule
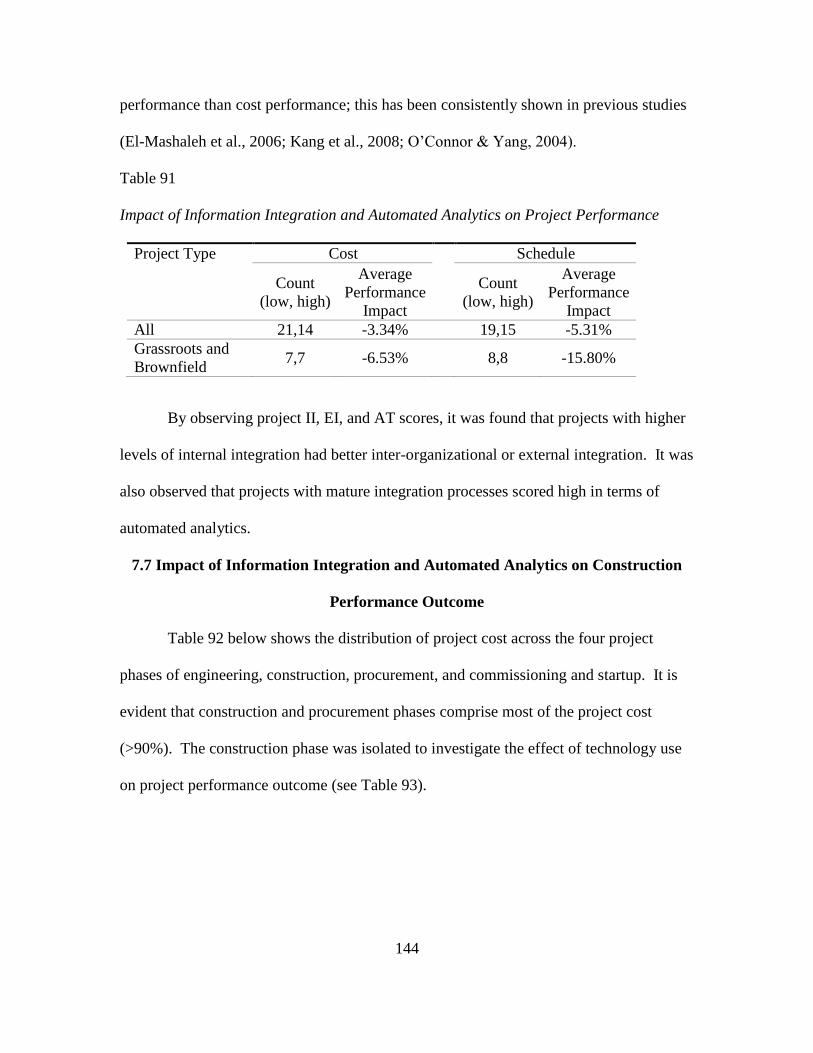
144
performance than cost performance; this has been consistently shown in previous studies
(El-Mashaleh et al., 2006; Kang et al., 2008; O’Connor & Yang, 2004).
Table 91
Impact of Information Integration and Automated Analytics on Project Performance
Project Type Cost Schedule
Count
(low, high)
Average
Performance
Impact
Count
(low, high)
Average
Performance
Impact
All 21,14 -3.34% 19,15 -5.31%
Grassroots and
Brownfield 7,7 -6.53%
8,8 -15.80%
By observing project II, EI, and AT scores, it was found that projects with higher
levels of internal integration had better inter-organizational or external integration. It was
also observed that projects with mature integration processes scored high in terms of
automated analytics.
7.7 Impact of Information Integration and Automated Analytics on Construction
Performance Outcome
Table 92 below shows the distribution of project cost across the four project
phases of engineering, construction, procurement, and commissioning and startup. It is
evident that construction and procurement phases comprise most of the project cost
(>90%). The construction phase was isolated to investigate the effect of technology use
on project performance outcome (see Table 93).
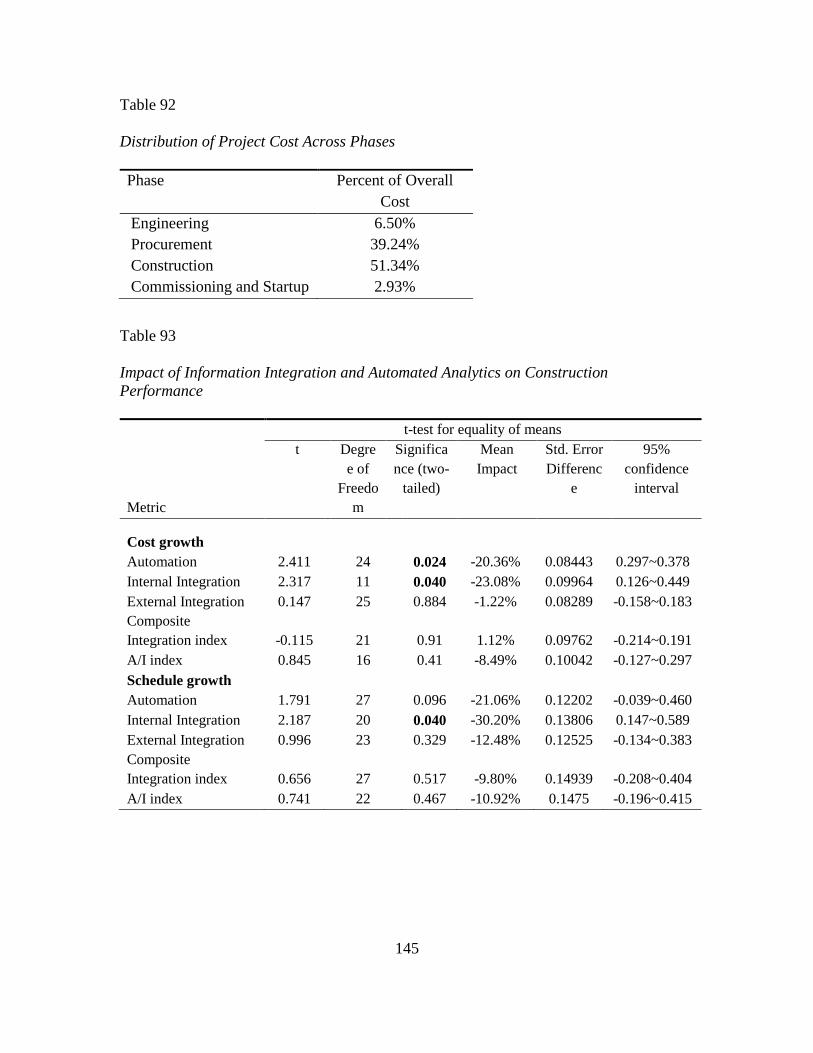
145
Table 92
Distribution of Project Cost Across Phases
Phase Percent of Overall
Cost
Engineering 6.50%
Procurement 39.24%
Construction 51.34%
Commissioning and Startup 2.93%
Table 93
Impact of Information Integration and Automated Analytics on Construction
Performance
t-test for equality of means
Metric
t Degre
e of
Freedo
m
Significa
nce (two-
tailed)
Mean
Impact
Std. Error
Differenc
e
95%
confidence
interval
Cost growth
Automation 2.411 24 0.024 -20.36% 0.08443 0.297~0.378
Internal Integration 2.317 11 0.040 -23.08% 0.09964 0.126~0.449
External Integration 0.147 25 0.884 -1.22% 0.08289 -0.158~0.183
Composite
Integration index -0.115 21 0.91 1.12% 0.09762 -0.214~0.191
A/I index 0.845 16 0.41 -8.49% 0.10042 -0.127~0.297
Schedule growth
Automation 1.791 27 0.096 -21.06% 0.12202 -0.039~0.460
Internal Integration 2.187 20 0.040 -30.20% 0.13806 0.147~0.589
External Integration 0.996 23 0.329 -12.48% 0.12525 -0.134~0.383
Composite
Integration index 0.656 27 0.517 -9.80% 0.14939 -0.208~0.404
A/I index 0.741 22 0.467 -10.92% 0.1475 -0.196~0.415
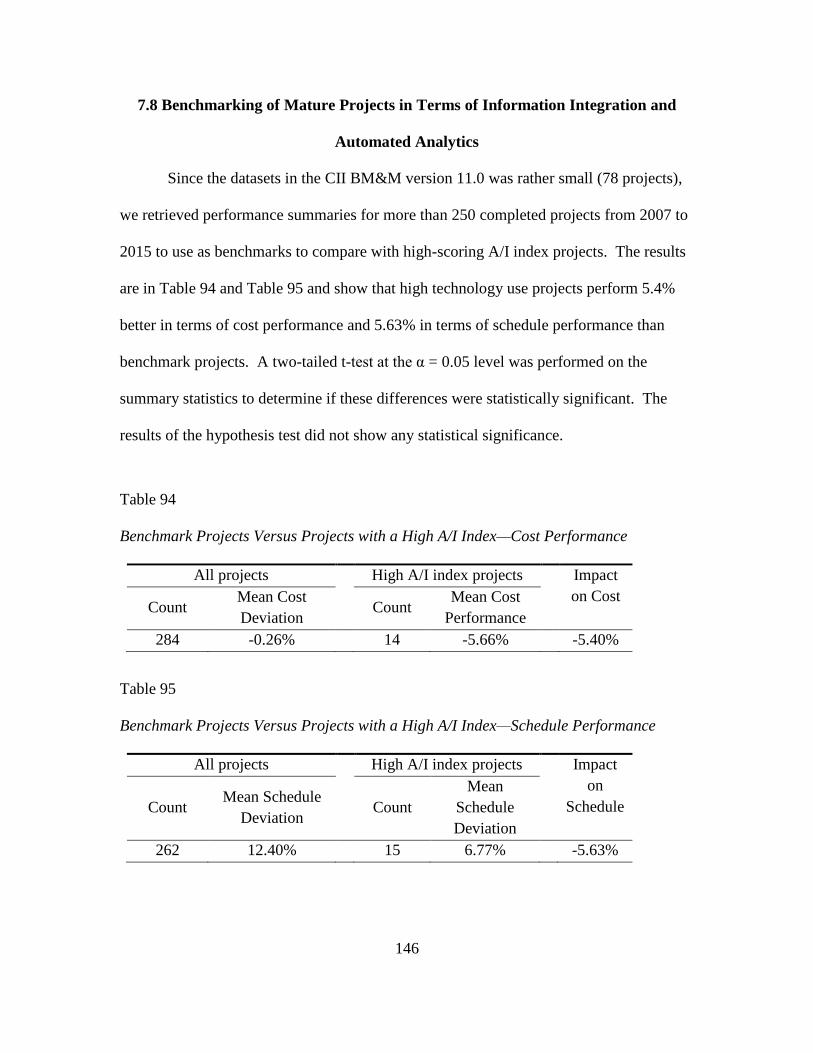
146
7.8 Benchmarking of Mature Projects in Terms of Information Integration and
Automated Analytics
Since the datasets in the CII BM&M version 11.0 was rather small (78 projects),
we retrieved performance summaries for more than 250 completed projects from 2007 to
2015 to use as benchmarks to compare with high-scoring A/I index projects. The results
are in Table 94 and Table 95 and show that high technology use projects perform 5.4%
better in terms of cost performance and 5.63% in terms of schedule performance than
benchmark projects. A two-tailed t-test at the α = 0.05 level was performed on the
summary statistics to determine if these differences were statistically significant. The
results of the hypothesis test did not show any statistical significance.
Table 94
Benchmark Projects Versus Projects with a High A/I Index—Cost Performance
All projects High A/I index projects Impact
on Cost Count
Mean Cost
Deviation Count
Mean Cost
Performance
284 -0.26% 14 -5.66% -5.40%
Table 95
Benchmark Projects Versus Projects with a High A/I Index—Schedule Performance
All projects High A/I index projects Impact
on
Schedule Count Mean Schedule
Deviation Count
Mean
Schedule
Deviation
262 12.40% 15 6.77% -5.63%
147
7.9 IT Use Over Time
To assess the growth of IT use over time, data from three previous studies was
used (Kang et al., 2008; Thomas, 1999; Thomas et al., 2001). The first data set pertains
to reported projects in 1997 and 1998 (Thomas, 1999), the second study contains data
collected between 1997 and 1999 (Thomas et al., 2001), and the third study covers data
collected between 2002 and 2004 (Kang et al., 2008). Thomas (1999) and Thomas et al.
(2001) use four specific technologies, namely 3D CAD, Electronic Data Interchange
(EDI), barcoding, and integrated databases, and scored to comprise the Design and
Information Technologies (D/IT) score. The study by Kang et al. (2008) pulls data from
a different CII BM&M database where 13 work functions are scored based on their
automation and integration use levels, an Automation/Integration tech score is then
computed from these underlying work functions. The scoring scale for these three
studies ranges from zero to 10 with zero being the least and 10 the most technology use.
The A/I index in this study was modified using the formula below to make the scores
across the studies somewhat consistent.
A/I index (modified)=A/I index-1
4 × 10
The scores from these studies are not directly comparable due to the underlying
scoring system used. However, it can be observed that for owners 25% of respondents to
the studies by Thomas (1999) and Thomas et al. (2001) did not use any level of
technology while only one project out of 130 reported projects by Kang et al. (2008)
reported no technology use, and in the current study all projects reported some degree of
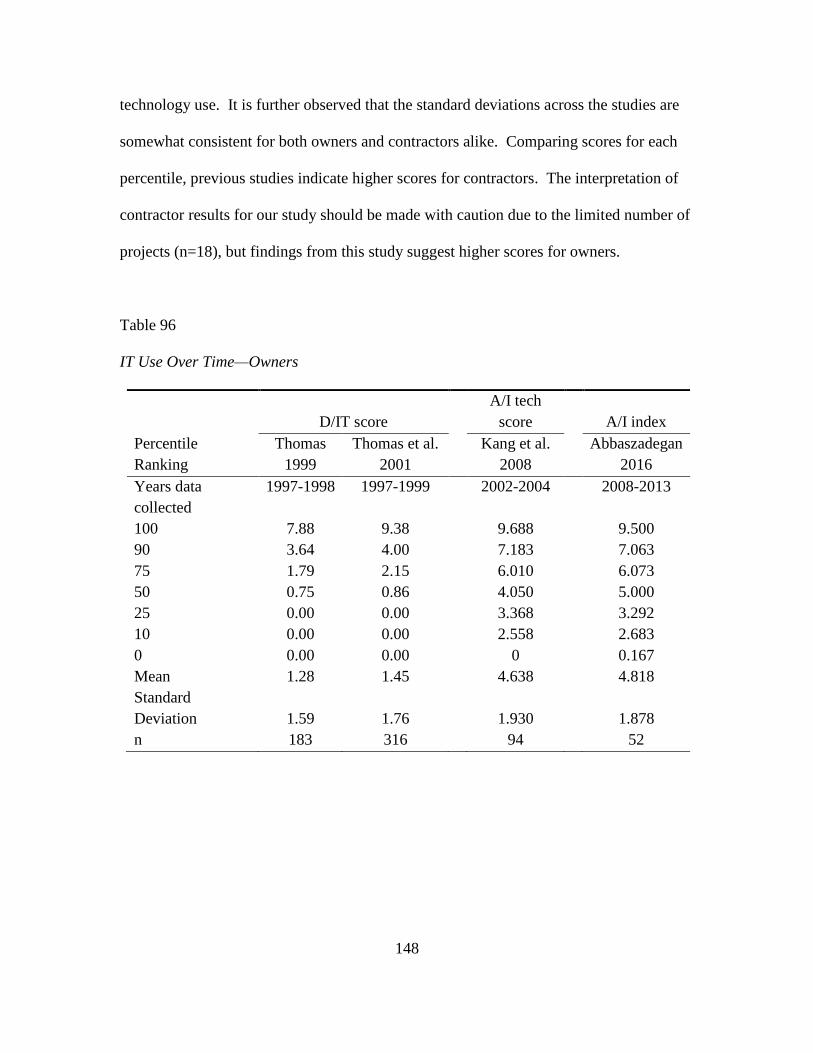
148
technology use. It is further observed that the standard deviations across the studies are
somewhat consistent for both owners and contractors alike. Comparing scores for each
percentile, previous studies indicate higher scores for contractors. The interpretation of
contractor results for our study should be made with caution due to the limited number of
projects (n=18), but findings from this study suggest higher scores for owners.
Table 96
IT Use Over Time—Owners
D/IT score
A/I tech
score A/I index
Percentile
Ranking
Thomas
1999
Thomas et al.
2001
Kang et al.
2008
Abbaszadegan
2016
Years data
collected
1997-1998 1997-1999 2002-2004 2008-2013
100 7.88 9.38 9.688 9.500
90 3.64 4.00 7.183 7.063
75 1.79 2.15 6.010 6.073
50 0.75 0.86 4.050 5.000
25 0.00 0.00 3.368 3.292
10 0.00 0.00 2.558 2.683
0 0.00 0.00 0 0.167
Mean 1.28 1.45 4.638 4.818
Standard
Deviation 1.59 1.76 1.930 1.878
n 183 316 94 52
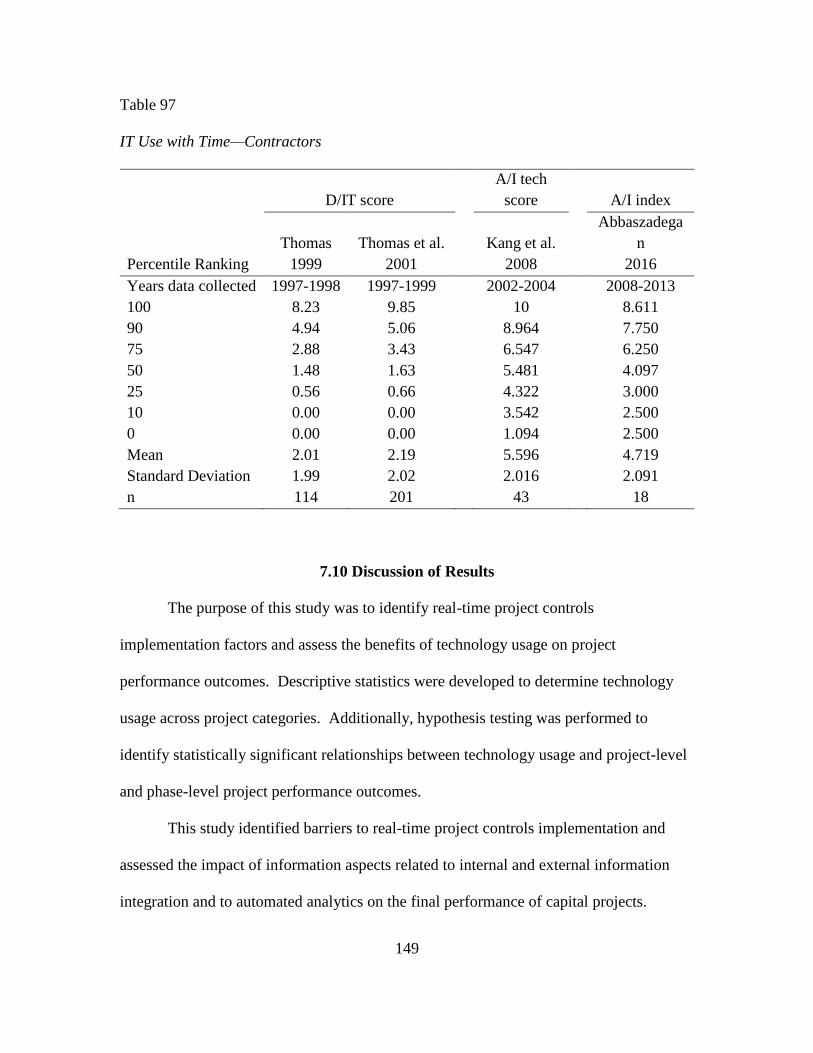
149
Table 97
IT Use with Time—Contractors
D/IT score
A/I tech
score A/I index
Percentile Ranking
Thomas
1999
Thomas et al.
2001
Kang et al.
2008
Abbaszadega
n
2016
Years data collected 1997-1998 1997-1999 2002-2004 2008-2013
100 8.23 9.85 10 8.611
90 4.94 5.06 8.964 7.750
75 2.88 3.43 6.547 6.250
50 1.48 1.63 5.481 4.097
25 0.56 0.66 4.322 3.000
10 0.00 0.00 3.542 2.500
0 0.00 0.00 1.094 2.500
Mean 2.01 2.19 5.596 4.719
Standard Deviation 1.99 2.02 2.016 2.091
n 114 201 43 18
7.10 Discussion of Results
The purpose of this study was to identify real-time project controls
implementation factors and assess the benefits of technology usage on project
performance outcomes. Descriptive statistics were developed to determine technology
usage across project categories. Additionally, hypothesis testing was performed to
identify statistically significant relationships between technology usage and project-level
and phase-level project performance outcomes.
This study identified barriers to real-time project controls implementation and
assessed the impact of information aspects related to internal and external information
integration and to automated analytics on the final performance of capital projects.
150
Initially, potential barriers to the implementation of real-time project controls
were identified through an industry-wide survey of 37 respondents. The results showed
that information integration and automated analytics were part of the top five barriers to
real-time project controls implementation; as such, they were used as surrogates to real-
time project controls. Incidentally CII BM&M survey version 11.0 had quantified these
two metrics—automation and integration—thus, two datasets were drawn from CII
BM&M databases, one with 78 projects (newly reported in this study) and another with
more than 250 reported projects. Even though the results were not statistically
significant, it seems clear that such positive impact can be realized.
Specifically, it was found that when comparing low-use with high-use technology
project improvements of 3.34% in cost and 5.31% on schedule is achieved. These
numbers are even more prominent when analyzing grassroots and brownfield projects
only, with improvements of 6.53% in cost performance and 15.80% in schedule
performance observed. Furthermore, after assessing high technology use projects against
industry standards, it is revealed that such projects perform 5.40% better in terms of cost
growth and 5.63% better in terms of schedule growth performance. Although IT use has
a positive impact on cost and schedule performance, from findings in this study and
studies by others, it is broadly found that IT use has a higher impact on schedule outcome
than on cost performance.
A comparative study of IT score percentiles across several studies reveals that IT
use is now more pervasive than 15 years ago. Contrary to previous studies, this study
indicates a higher use of technology for owners than contractors.

151
Currently, a gap in the reporting cycle exists so that decisions are made on
outdated information. Future research efforts should further investigate the impact of
information integration and automated analytics by project phase. Future research should
also focus on trends when moving from no technology use to a fully automated and
integrated information system. This was partially shown in the quartile analysis (Table
96 & Table 97), but a larger data set is needed with specific case studies to understand
trends and root cause for possible learning curve penalties. It will be beneficial to
identify projects with high levels of A/I index and conduct case studies regarding
technology use by such organizations. We did not have the luxury to do this due to
confidentiality of CII BM&M data.
152
CHAPTER 8: INTELLECTUAL MERIT AND IMPACT
Through a mixed methods study approach with qualitative and quantitative
aspects, a framework to answer the research objectives was developed that ultimately
provided the following contributions to the AEC industry.
1. Explored project controls from a comprehensive and holistic perspective:
Prior research has been sparse and has mainly focused on scheduling and costing of
capital projects without the consideration of the various processes and functions related to
controls.
2. Current state of knowledge pertaining to project controls for the construction
industry: This study investigated current practices of project controls in terms of batch
mode and state-of-the-art instantaneous practices. Among several findings, the frequency
of data collection and reporting was measured for various project control functions; the
pervasiveness of information technology utilization and integration of information
systems was investigated.
3. Development of an instantaneous project controls practices guideline: The
focus of previous studies were on cost and scheduling techniques alone but not practices
for the implementation of instantaneous controls. They did not consider organizational
processes and only focused on tools, techniques, and algorithms. For instance, there is a
need to have the right data in a timely manner in order for the developed algorithms to be
effective. Thus, a need for a holistic approach to monitoring and controls was identified
with multiple perspectives drawn from the capital project industry and other industries.
The developed framework can be generalized in any construction industry. Through a
qualitative exploratory multiple case study within and beyond the construction domain, a
153
set of high-impact strategies or key constructs were identified. By studying specific
organizations in several distinctly different industries, we identified functions that are
being controlled in real-time and are considered as state-of-the-art project control
functions. Upper managers were interviewed. Various industries were the focus of the
case studies, but a manufacturing organization provided the greatest insights to this study.
As a result of the case studies, nine key constructs were developed under the guise of
three distinct categories of organizational behavior, project controls, and technologies.
4. Distinction between monitoring and controlling: Analyzing and reporting all
control functions in real-time can be time-consuming and expensive. Thus, some
functions can be monitored in real-time, while others are controlled based on a predefined
frequency. As indicated by the case studies, quality is an example of a function
monitored in real-time.
5. Plausible potential benefits from implementation of instantaneous project
controls on project performance: The findings from Survey 2 presented the importance
of advanced sensing and automation technologies for instantaneous support. Survey 2
allowed for the utilization of the CII BM&M database for quantification of real-time
project control benefits. Retrospective data from the CII BM&M database regarding the
maturity of project information integration and automated analytics along with data on
the respective projects cost and schedule performance allowed for a cross comparison of
highly mature projects and low mature projects in those two facets. By better
understanding the benefits resulting from such real-time practices, management will be
more willing to invest and focus on the strategies identified in this study.
154
CHAPTER 9: CONCLUSIONS
Several findings are reported in this research study, including a comprehensive
definition of the existing condition within the construction engineering industry, an
identification of barriers and benefits associated with the implementation of instantaneous
project controls practices, detailed strategies and practices for the implementation of
instantaneous controls capability, and finally the quantification of benefits from
implementation of instantaneous controls. The findings represent grassroots, brownfield,
modernization, and addition types of projects and the organizations involved with such
projects.
Current project control practices are non-standard and fail to give the project
authority timely and clear insight into the status of their projects. Current project controls
processes are best described as a “batch” mode of controls where important project
controls information is not available in real-time after the raw data has been collected.
The industry believes that such batch mode of controls is not sufficient in meeting
today’s competitive needs and should be elevated to an instantaneous mode, or at least
timely availability of information.
Several barriers were identified that must be overcome to achieve the goal of
instantaneous controls. Overcoming barriers to instantaneous project controls can have
positive benefits of different aspects of project control activities, including cost, schedule,
quality, and scope. The research addressed how project controls data is collected,
accessed, and utilized and presented how planning, monitoring, and controlling can be
enhanced to support timely and accurate project controls reporting capability.
155
The research developed and presented practices and high-impact strategies for the
facilitation of instantaneous project controls. These strategies address both the
origination (“feed”) and accessibility (“read”) of project controls information so that real-
time, or at least timely, capability is provided. Practical practices are presented and
categorized as organizational characteristics of culture, leadership, contracting, work
planning, data collection, documentation and reporting, information integration,
workflow management, and business intelligence. In order to prioritize the
implementation of instantaneous controls, two principles were defined. The first
principle states that organizations should prioritize communication and reporting of
project information by establishing specific reporting frequencies for each reporting
function and organizational hierarchy (e.g., layer). This first principle implies that not all
control functions require instantaneous or real-time reporting. For instance, while
operating processes can be monitored in real-time, business and project metrics should be
reported at prioritized and specific frequencies. The second principle states that highly
variable functions that can significantly affect project performance should be
instantaneously monitored. Events and issues causing disruption to the workflow or
variations to the quality of work should be addressed immediately on the spot. The
fundamental idea is that monitoring and reporting functions are to support timely and
informed decisions and prevent negative impacts from late and uninformed decisions.
The monitoring and controls approach practiced by the manufacturing industry is
slowly but steadily being adopted by construction industry organizations. As observed
during the study, monitoring of quality, craft labor productivity, and scope functions
indicate a shift toward instant monitoring and prioritized controls by construction

156
industry organizations. Capital projects are actually highly variable processes; if this
inherent variability is not addressed proactively, significant negative impacts can
compound.
It is concluded that with the right set of practices instantaneous project controls is
achievable. A comprehensive approach is needed, which starts with the definition of the
reporting frequency as pertains to different layers of management. This research study
contains universal findings applicable across business sectors within the construction
engineering industry.
9.1 Future Studies
The research study herein utilized several modes and methods of inquiry so that
the results would be meaningful across the industry, but there are several limitations that
can be a basis for future studies.
Surveys are a powerful tool to construct trends within a large group, but the
majority of projects in this research study pertained to industrial projects. A more
balanced pool of projects will result in more realistic trends within the industry as a
whole. This fact applies to the two surveys conducted and the two BM&M datasets
utilized. The wide scope of the research poses limitations and benefits alike. The
limitation is the available research time during the course of a PhD program. On the
other hand, the benefit is the identification of a broad framework for implementation
guidelines and the industry-wide study of project controls.
Additional future research should focus on documenting and quantitatively
assessing the impact of instantaneous controls on project performance. Also, further
studies should investigate the practices needed to satisfy control requirements for
157
different project scenarios, such as size of projects (e.g., small vs. large), industry sector
(e.g., industrial, buildings, infrastructure, etc.), and contracting methods (e.g., design-bid-
build, design-build, integrated project delivery, etc.). Resource requirements such as
time, cost, technology needs, and manpower for instantaneous controls can be
investigated. And finally, specific data collection, information integration, and
automated analytics aspects need to be explored in order to facilitate the implementation
of instantaneous controls functions.
9.2 Contributors
Construction Industry Institute Research Team 316 was a contributor in this
research study by providing several resources, including their expertise, connections
regarding case studies, survey designs, CII BM&M database access, and others. I would
like to specifically thank the following people for their contributions: Douglas Weaver
(Chair), Robert Lobron (Vice Chair), David Grau (Principal Investigator), W. Edward
Back (Principal Investigator), Lillie Alston, Mitchell Cornelius, Graciela Garcia de
D’Uva, Rodolfo Gonzalez, Sandra Greene, Jeff L. Hoffa, Brian Kong, Brian R. Lipko,
Chris Marcon, Patricia Pipping, and Stephen R. Thomas.
158
REFERENCES
Abudayyeh, O. Y., & Rasdorf, W. J. (1993). Prototype integrated cost and schedule
control system. Journal of Computing in Civil Engineering, 7, 181‒198.
Abudayyeh, O., Temel, B., Al-Tabtabai, H., & Hurley, B. (2001). An intranet-based cost
control system. Advances in Engineering Software, 32(2), 87‒94.
Ahmad, I., Azhar, S., & Lukauskis, P. (2004). Development of a decision support system
using data warehousing to assist builders/developers in site selection. Automation
in Construction, 13, 525‒542.
Ahuja, V., & Thiruvengadam, V. (2004). Project scheduling and monitoring: Current
research status. Construction Innovation, 4, 19‒31.
Akinci B., Boukamp F., Gordon C., Huber D., Lyons C., & Park K. (2006). A formalism
for utilization of sensor systems and integrated project models for active
construction quality control. Automation in Construction, 15, 124‒138.
Al-Jibouri, S. H. (2003). Monitoring systems and their effectiveness for project cost
control in construction. International Journal of Project Management, 21, 145–
54.
An, M., Baker, C., & Zeng, J. (2005). A fuzzy-logic-based approach to qualitative risk
modeling in the construction process. World Journal of Engineering, 2, 1‒12.
Assaf, S. A., & Al-Hejji, S. (2006). Causes of delay in large construction
projects. International Journal of Project Management, 24, 349‒357.
Assaf, S. A., Al-Khalil, M., & Al-Hazmi, M. (1995). Causes of delay in large building
construction projects. Journal of Management in Engineering, 11(2), 45‒50.
Auerbach, C. F., & Silverstein, L. B. (2003). Qualitative Data, An Introduction to Coding
and Analysis. Location: New York University Press.
Back, W. E., Boles, W. W., & Fry, G. T. (2000). Defining triangular probability
distributions from historical cost data. Journal of Construction Engineering and
Management, 126, 29‒37.
Back, W. E., & Grau, D. (2013a) Improving the Accuracy and Timeliness of Project
Outcome Predictions. CII Research Summary 291-1.
Back, W. E., & Grau, D. (2013b). Four-casting for early predictability. Implementation
Resource 291-2, Construction Industry Institute, Austin, TX.
159
Back, W. E., & Bell, L. C. (1994). Quantifying benefits attributable to electronic
technologies. AACE International Transactions, SI1-1.
Back, W. E., & Moreau, K. A. (2000). Cost and schedule impacts of information
management on EPC process. Journal of Management in Engineering, 16(2), 59‒
70.
Back, W. E., Moreau, K. A., & Toon, J. (1996). Determining the impact of information
management on project schedule and cost. Research Report 125-11. Construction
Industry Institute (CII), Austin, Texas.
Ballard, G., (2000). The last planner system of production control. (Doctoral
dissertation). University of Birmingham.
Ballard, G. (1997, July). Lookahead planning: The missing link in production control.
In Proceedings of the 5th Annual Conference International Group for Lean
Construction, Griffith University, Gold Coast, Australia, July.
Ballard, G., Kim, Y. W., Jang, J. W., & Liu, M. (2007). Roadmap for lean
implementation at the project level. The Construction Industry Institute Research
Report 243-11, Austin, Texas.
Barraza, G. A., Back, W. E., & Mata, F. (2004). Probabilistic forecasting of project
performance using stochastic S curves. Journal of Construction Engineering and
Management, 130, 25‒32.
Baum, J., & Wally, S. (2003). Strategic decision speed and firm performance. Strategic
Management Journal, 24, 1107‒1129.
Bourgeois III, L. J., & Eisenhardt, K. M. (1988). Strategic decision processes in high
velocity environments: Four cases in the microcomputer industry. Management
Science, 34, 816‒835.
Bosche F., Teizer J., Haas C. T., & Caldas C. H. (2006). Integrating data from 3D CAD
and 3D cameras for realtime modelling. Joint International Conference on
Computing and Decision Making in Civil and Building Engineering, Montréal,
Canada.
Burati, J. L. J., Farrington, J. J., & Ledbetter, W. B., (1992). Causes of quality deviations
in design and construction. Journal of Construction Engineering and
Management, 118, 34–49.
Callahan, M. T., Bramble, B. B., & Lurie, P. M. (1990). Arbitration of construction
disputes. Location: Wiley Law Publications.
160
Callahan, K. R., Stetz, G. S, & Brooks, L. M. (2007). Budgeting, tracking, and reporting
costs and profitability (2nd ed.). Hoboken, NJ: Wiley.
Chan, D. W., & Kumaraswamy, M. M. (1997). A comparative study of causes of time
overruns in Hong Kong construction projects. International Journal of Project
Management, 15, 55‒63.
Chan, S. L., & Leung, N. N. (2004). Prototype web-based construction project
management system. Journal of Construction Engineering and Management, 130,
935‒943.
Chau, K. W., Cao, Y., Anson, M., & Zhang, J. (2003). Application of data warehouse and
decision support system in construction management. Automation in
Construction, 12, 213‒224.
Cheung, S. O., Suen, H. C. H., & Chueng, K. K. W. (2004). PPMS: A web-based
construction project performance monitoring system. Automation in Construction,
13, 361–376.
Chou, J. S., & Chong, W. K. (2008) A web-based framework of project performance and
control system. Proc., 2008 IEEE International Conference on Robotics,
Automation and Mechatronics, Vols 1 and 2. NewYork, USA, pp. 97-101.
Christensen, D. S. (1998). The costs and benefits of the earned value management
process. Journal of Parametrics, 18(2), 1‒16.
CII (1987). Project Control for Construction. Construction Industry Institute,
Publication 6–5, University of Texas at Austin, Austin, Texas.
CII, (2016) Project controls community of practice charter (Approved March 11, 2014)
Retrieved from https://www.construction-institute.org/scriptcontent/cops-
files/PCCOP-Charter.pdf retrieved: 3/14/16
Crandall, K. C., & Woolery, J. C. (1982). Schedule development under stochastic
scheduling. Journal of the Construction Division, 108(2), 321‒329.
Creswell, J. W. (2003). A Framework for Design. In Research Design: Qualitative,
Quantitative and Mixed Methods Approaches (2nd ed.)
Davidson, I.N., & Skibniewski, M.J., (1995). Simulation of automated data collection in
buildings. Journal of Computing in Civil Engineering, 9, 9–20.
De Falco, M., & Macchiaroli, R (1998). Timing of control activities in project planning.
International Journal of Project Management, 16(1), 51–58.
161
De Lapp, J. A., Ford, D. N., Bryant, J. A., & Horlen, J. (2004). Impacts of CAD on
design realization. Engineering, Construction and Architectural Management, 11,
284–291.
De Vaus, D. A. (2004). Research Design in Social Research. Location: Sage
Publications.
Department of Defense (DoD). (1967). Performance measurement for selected
acquisitions (Department of Defense Instruction, DODI-7000.2).
Defense Contract Management Agency - DoD (2006, October). Earned value
management implementation guide. United States of America -
Department of Defense.
Dutton, J., & Jackson, S. (1988). Discerning threats and opportunities. Administrative
Science Quarterly, 33, 370–387.
Eisenhardt, K. M. (1989a). Making fast strategic decisions in high-velocity environments.
Academy of Management Journal, 27, 299–343.
Eisenhardt, K. M. (1989b). Building theories with case study research. Academy of
Management Review, 14, 532–550.
El-Omari, S., & Moselhi, O. (2011). Integrating automated data acquisition technologies
for progress reporting of construction projects. Automation in Construction, 20,
699–705.
El-Mashaleh, M. S., O'Brien,W., & Kang, Y. (2006). The impact of IT use at the firm
level: An empirical study of contractor performance. A Report to the Center for
Construction Industry Studies, the University of Texas at Austin, Austin Texas.
Evgeniou, T. (2002). Information integration and information strategies for adaptive
enterprises. European Management Journal, 20, 486–494.
Faridi, A. S., & El‐Sayegh, S. M. (2006). Significant factors causing delay in the UAE
construction industry. Construction Management and Economics, 24, 1167–1176.
Fleming, Q.W., Koppleman, J. M. (2000), Earned Value Project Management, 2nd ed.
Project Management Institute, Newton Square, Pennsylvania.
Flyvbjerg, B., Holm M. S., & Buhl, S. (2002). Underestimating costs in public works
projects. Error or lie? Journal of American Planning Association., 68, 279–296.
162
Flyvbjerg, B., Skamris Holm, M. K., & Buhl, S. L. (2005). How (in) accurate are demand
forecasts in public works projects?: The case of transportation. Journal of the
American Planning Association, 71, 131–146.
Flyvbjerg, B. (2006). From nobel prize to project management: Getting risks
right. Project Management Journal, 37(3), 5–15
Froese, T. M. (2010). The impact of emerging information technology on project
management for construction. Automation in Construction, 19, 531–538.
Fuchs P. A., Washer G. A., Chase S. B., & Moore M. (2004). Applications of laser-based
instrumentation for highway bridges. Journal of Bridge Engineering, 9, 541–549.
Gallaher, M. (2004). Cost analysis of inadequate interoperability in the U.S. capital
facilities industry, National Institute of Standards and Technology, Department of
Commerce, NIST GCR 04-867.
Ghanem, A. G., & AbdelRazig, Y. A. (2006). A framework for real-time construction
project progress tracking. Earth and Space, 188(112), pp. 1–8.
Gibson, G. E., Jr., & Whittington, D. A. (2009). Charrettes as a method for engaging
industry in best practices research. Journal of Construction Engineering and
Management, 136, 66–75.
Gilsinn D. E., Cheok G. S., Witzgall C., & Lytle A. (2005). Construction object
identification from LADAR scans: An experimental study using I-beams. US
Department of Commerce, Technology Administration, National Institute of
Standards and Technology.
Glaser, B. G., & Strauss, A. L. (1967). The discovery of grounded theory: Strategies for
quantitative research. Chicago: Aldine Publishing Company .
Golparvar-Fard, M., Peña-Mora, F., & Savarese, S. (2009). D4AR–a 4-dimensional
augmented reality model for automating construction progress monitoring data
collection, processing and communication. Journal of Information Technology in
Construction, 14, 129‒153.
Goodrum, P. M., McLaren, M. A., & Durfee, A. (2006). The application of active radio
frequency identification technology for tool tracking on construction job sites.
Journal of Automation in Construction, 15, 292‒302.
Gordon S. J., Lichti D., Stewart M. P., & Franke J. (2004). Modelling point clouds for
precise structural deformation measurement. XXth ISPRS Congress, Istanbul,
Turkey.
163
Grau, D., & Back, W. E., (2014, August). Improving the Accuracy and Timeliness of
Project Outcome Predictions. CII Research Report 291-11.
Grau, D., & Back, W. E. (2015a). Instantaneous Project Controls. Research Summary
No. 316-1, Construction Industry Institute (CII), Austin. Tex.
Grau, D., & Back, W. E. (2016). Instantaneous Project Controls. Research Report No.
316-11, Construction Industry Institute (CII), Austin. Tex.
Grau, D., & Back, W. E. (2015b). Predictability index: Novel metric to assess cost and
schedule performance. Journal of Construction Engineering and Management,
141(12).
Griffis, F. H., Hogan, D. B., & Li, W. (1995). An analysis of the impacts of using three
dimensional computer models in the management of construction. Research Rep.
No. 106-11, Construction Industry Institute (CII), Austin, Tex.
Hayes, E. (1981). The complete problem solvers. Philadelphia: Franklin Institute Press.
Hazır, Ö. (2015). A review of analytical models, approaches and decision support tools in
project monitoring and control. International Journal of Project Management, 33
808‒815.
Henderson, J. C., & Lee, S. (1992). Managing i/s design teams: A control theories
perspective. Management Science, 38, 757–777.
Howell, G., & Ballard, G. (1997). Lean construction factors affecting project success in
the piping function. Lean Construction, 161‒185
Hwang, S., & Liu, L. Y. (2010). BIM for integration of automated real-time project
control systems. Proceeding. Construction Research Congress. 2010: Innovation
for Reshaping Construction Practice (pp. 509-517). Reston, VA: Construction
Institute of ASCE.
Ibrahim, Y. M., Lukins, T. C., Zhang, X., Trucco, E., & Kaka, A. P. (2009). Towards
automated progress assessment of workpackage components in construction
projects using computer vision. Advanced Engineering Informatics, 23, 93‒103.
Isaac, S., & Navon, R. (2014). Can project monitoring and control be fully automated?
Construction Management and Economics, 32, 495‒505.
Isidore, L. J., & Back, W. E. (2002). Multiple simulation analysis for probabilistic cost
and schedule integration. Journal of Construction Engineering and
Management, 128, 211‒219.
164
Jaselskis, E. J., Anderson, M. R., Jahren, C. T., Rodriguez, Y., & Njos, S. (1995). Radio-
frequency identification applications in construction industry. Journal of
Construction Engineering and Management, 121, 189‒196.
Jaselskis, E. J., & Ashley, D. B. (1991). Optimal allocation of project management
resources for achieving success. Journal of Construction Engineering and
Management, ASCE 117(2), 321–340.
Jaselskis E. J., Cackler E. T., Walters R. C., Zhang J., & Kaewmoracharoen M. (2006).
Using scanning lasers for real-time pavement thickness measurement. CTRE
Project 05-205, National Concrete Pavement Technology Center, Iowa State
University.
Johnson, R. E., & Clayton, M. J. (1998). The impact of information technology in design
and construction: The owner's perspective. Automation in Construction, 8, 3‒14.
Jones, J. W. (1993). High speed management: Time-based strategies for managers and
irganizations. San Francisco, CA: JosseyBass.
Kang, Y., O’Brien, W. J., Thomas, S., & Chapman, R. E. (2008). Impact of information
technologies on performance: Cross study comparison. Journal of Construction
Engineering and Management, 134, 852‒863.
Kang, Y., O’Brien, W., & O’Connor, J. (2012). Analysis of information integration
benefit drivers and implementation hindrances. Automation in Construction, 22,
277‒289.
Kerzner, H. (2003). Project management: A systems approach to planning, scheduling
and controlling (8th ed.). New York: John Wiley and Sons, Inc..
Kim, B. C., & Reinschmidt, K. F. (2009). Probabilistic forecasting of project duration
using Bayesian inference and the beta distribution. Journal of Construction
Engineering and Management, 135, 178‒186.
Kim, B. C., & Reinschmidt, K. F. (2010). Probabilistic forecasting of project duration
using Kalman filter and the earned value method. Journal of Construction
Engineering and Management, 136, 834‒843.
Kim, B. C., & Reinschmidt, K. F. (2011). Combination of project cost forecasts in earned
value management. Journal of Construction Engineering and Management, 137,
958‒966.
Kim, E., Wells, W.G.J., & Duffey, M. (2003). A model for effective implementation of
earned value management methodology. International Journal of Project
Management, 21, 375–382.
165
Kiziltas S., Akinci B., Ergen E., & Tang, P (2008). Technological assessment and process
implications of field data capture technologies for construction and
facility/infrastructure management [Special issue]. ITcon, 13, 134‒154
Koskela, L. (1992). Application of the new production philosophy to construction, CIFE
Technical Report No. 72, Stanford University, Stanford, CA.
Kostelyk, J. D. (2012). Project controls for engineering work in practice. Masters
Dissertation, University of Alberta.
Li, J., Moselhi, O., & Alkass, S. (2006). Internet-based database management system for
project control. Engineering, Construction and Architectural Management, 13,
242‒253
Lipman, R. (2009). Interoperability with CIS/2 and IFC, National Institute of Standards
and Technology (NIST), NASCC BIM 102 for the Steel Fabricator – 1 April
2009, Phoenix, AZ.
Liu, L. Y. (1995). Digital data-collection device for construction site documentation.
Proc., 2nd Congress on Computing in Civil Engineering, Atlanta, 1287–1293.
Liu, J. Y.-C., Chen, H. H.-G., Jiang, J. J., & Klein, G. (2010). Task completion
competency and project management performance: The influence of control and
user contribution. International Journal of Project Management, 28, 220–227.
Marcotte, P. (1990). Hastening justice: Biden committee studies task force plan to cut
trial delay. ABA Journal, 76, 40.
Meredith, J. R., & Mantel, S., Jr. (2003). Project management—A managerial approach.
New York: John Wiley and Sons, Inc.
Michalak, C. F. (1992). Establishing project controls for international projects—The
Esperanto of project controls. Proceedings of the 36th Annual Meeting of AACE.
Moselhi, O., Li, J., & Alkass, S. (2004). Web‐based integrated project control
system. Construction Management and Economics, 22, 35‒46.
Mott MacDonald. (2002). Review of large public procurement in the UK. London.
Mulva, S. P., & Dai, J. (2012). Performance Assessment. Construction Industry Institute,
2012 Edition, Austin, Texas.
Naeni, L. M., Shadrokh, S., & Salehipour, A. (2011). A fuzzy approach for the earned
value management. International Journal of Project Management, 29, 764‒772.
166
Navon, R. (2005). An overview of automated project performance control research at the
technion. In Proceedings, Twenty Second International Symposium on Automation
and Robotics in Construction, Ferrara, Italy (pp. 25-38).
Navon, R., & Goldschmidt, E., (2003). Can labor inputs be measured and controlled
automatically? Journal of Construction Engineering and Management, 129, 437–
445.
Navon, R., & Haskaya, I. (2006). Is detailed progress monitoring possible without
designated manual data collection?. Construction Management and
Economics, 24(12), 1225-1229.
Navon, R., & Sacks, R. (2007). Assessing research issues in automated project
performance control (APPC). Automation in Construction, 16, 474‒484.
Navon, R., & Shpatnitsky, Y. (2005). Field experiments in automated monitoring of road
construction. Journal of Construction Engineering and Management, 131, 487–
493.
O’Connor, J. T., & Yang, L. R. (2004). Project performance versus use of technologies at
project and phase levels. Journal of Construction Engineering and Management,
130, 322–329.
Odeh, A. M., & Battaineh, H. T. (2002). Causes of construction delay: Traditional
contracts. International Journal of Project Management, 20, 67‒73.
Odeyinka, H. A., & Yusif, A. (1997). The causes and effects of construction delays on
completion cost of housing projects in Nigeria. Journal of Financial Management
of Property and Construction, 2, 31‒44.
Plaza, M., & Turetken, O. (2009). A model-based DSS for integrating the impact of
learning in project control. Decision Support Systems, 47, 488‒499.
Project Management Institute (PMI). (2005). Practice standard for earned value
management. Newton Square, PA: Project Management Institute Publication.
Project Management Institute (PMI). (2008). A guide to the project management body of
knowledge (PMBOK Guide) (4th ed.). Newtown Square, PA: Project
Management Institute.
Rasdorf, W. J., & Herbert, M. J. (1990a). Automated identification systems-focus on bar
coding. Journal of Computing in Civil Engineering, 4, 279‒296.
167
Rebolj, D., Babič, N. Č., Magdič, A., Podbreznik, P., & Pšunder, M. (2008). Automated
construction activity monitoring system. Advanced Engineering Informatics, 22,
493‒503.
Rojas, E., & Songer, A. (1999). Web-centric systems: A new paradigm for collaborative
engineering. Journal of Management Engineering, 15, 39–45.
Rozenes, S., Vitner, G., & Spraggett, S. (2006). Project control: Literature review.
Project Management Journal, 37(4), 5‒14
Russell, A. (1993). Computerized daily site reporting. Journal of Construction
Engineering and Management, 119(2), 385–402.
Sacks, R., & Harel, M. (2006). An economic game theory model of subcontractor
resource allocation behavior. Construction Management and Economics, 24, 869‒
881.
Saidi, K. S., Lytle, A. M., & Stone, W. C. (2003). Report of the NIST workshop on data
exchange standards at the construction job site. ISARC— 20th International
Symposium on Automation and Robotics in Construction, Techniesche
Universiteit Eindhoven, Eindhoven, The Netherlands.
Simon, H. (1987). Making management decisions: The role of intuition and emotion.
Academy of Management Executive, 1, 57‒64.
Su, Y. Y., Hashash, Y. M. A., & Liu, L. Y. (2006). Integration of construction as-built
data via laser scanning with geotechnical monitoring of urban excavation. Journal
of Construction Engineering and Management, 132, 1234‒1241.
Taneja, S., Akinci, B., Garrett, J. H., Soibelman, L., Ergen, E., Pradhan, A., & Anil, E. B.
(2010). Sensing and field data capture for construction and facility
operations. Journal of Construction Engineering and Management, 137, 870‒881.
Tang, P., Huber, D., Akinci, B., Lipman, R., & Lytle, A. (2010). Automatic
reconstruction of as-built building information models from laser-scanned point
clouds: A review of related techniques. Automation in Construction, 19, 829‒843.
Teizer J., Kim C., Haas C. T., Liapi K. A., & Caldas C. H. (2005). Framework for real-
time three-dimensional modelling of infrastructure. Geology and Properties of
Earth Materials, Transportation Research Board Natl Research Council,
Washington, 177-186.
Thomas, H. (2000). Schedule Acceleration, Work Flow, and Labor Productivity. Journal
of Construction Engineering Management, 126(4), 261–267.
168
Thomas, S. R., Macken, C. L., & Lee, S. H. (2001). Impacts of design/information
technology on building and industrial projects. Proceedings NIST GCR, 01-828.
Thomas, S., Lee, S., Spencer, J., Tucker, R., & Chapman, R. (2004). Impacts of
design/information technology on project outcomes. Journal of Construction
Engineering and Management, 130, 586–597.
Vanhoucke, M. (2009). Measuring time: Improving project performance using earned
value management. New York, NY: Springer Science+Businesss Media, LLC.
Vanhoucke, M. (2012). Measuring the efficiency of project control using fictitious and
empirical project data. International Journal of Project Management, 30, 252‒
263.
Walker, D., & Betts, M. (1997). Information technology foresight: The future application
of the World Wide Web in construction. Proc., CIB W78: IT for Construction
Process Reengineering, James Cook University, Townsville, Australia, 399–407.
Warhoe, S.P. (2004) The basics of earned value management, Transactions of
AACE International CSC.07.01–CSC.07.10.
Winch, G. M., (2002). Managing construction projects. Oxford, U.K.: Blackwell.
Yin, R. (1994). Case study research: Design and methods. Beverly Hills, CA: Sage
Publications.
Yang, L. R., O'Connor, J. T., & Wang, C. C. (2006). Technology utilization on different
sizes of projects and associated impacts on composite project success.
International Journal of Project Management, 24, 96–105.
Yang, L. R., O'Connor, J. T., & Chen, J. H. (2007). Assessment of automation and
integration technology's impacts on project stakeholder success. Automation in
Construction, 16, 725‒733.
Zhiliang, M., Heng, L., Shen, Q. P., & Jun, Y. (2004). Using XML to support information
exchange in construction projects. Automation in Construction, 13, 629‒637.
Zhiliang, M., Wong, K. D., Heng, L., & Jun, Y. (2005). Utilizing exchanged documents
in construction projects for decision support based on data warehousing
technique. Automation in Construction, 14, 405‒412.
Zhai, D., Goodrum, P. M., Haas, C. T., & Caldas, C. H. (2009). Relationship between
automation and integration of construction information systems and labor
productivity. Journal of Construction Engineering and Management, 135, 746‒
753.

169
APPENDIX I
SURVEY 1—BATCH MODE SURVEY
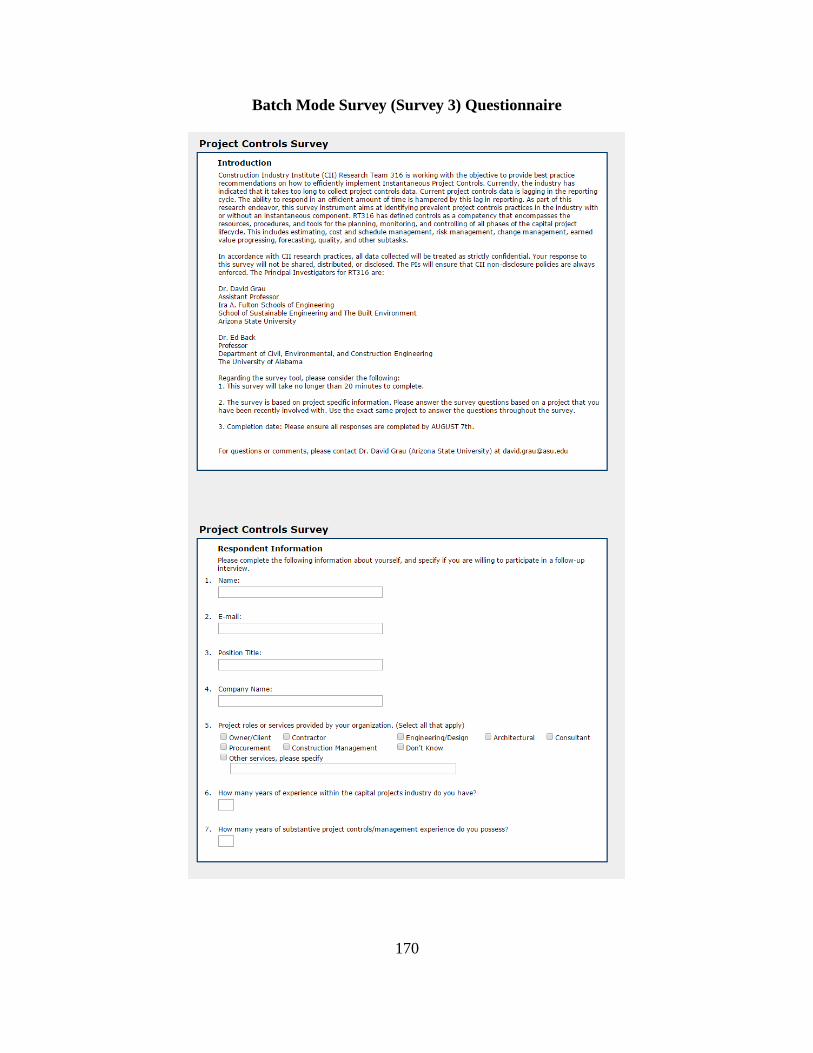
170
Batch Mode Survey (Survey 3) Questionnaire
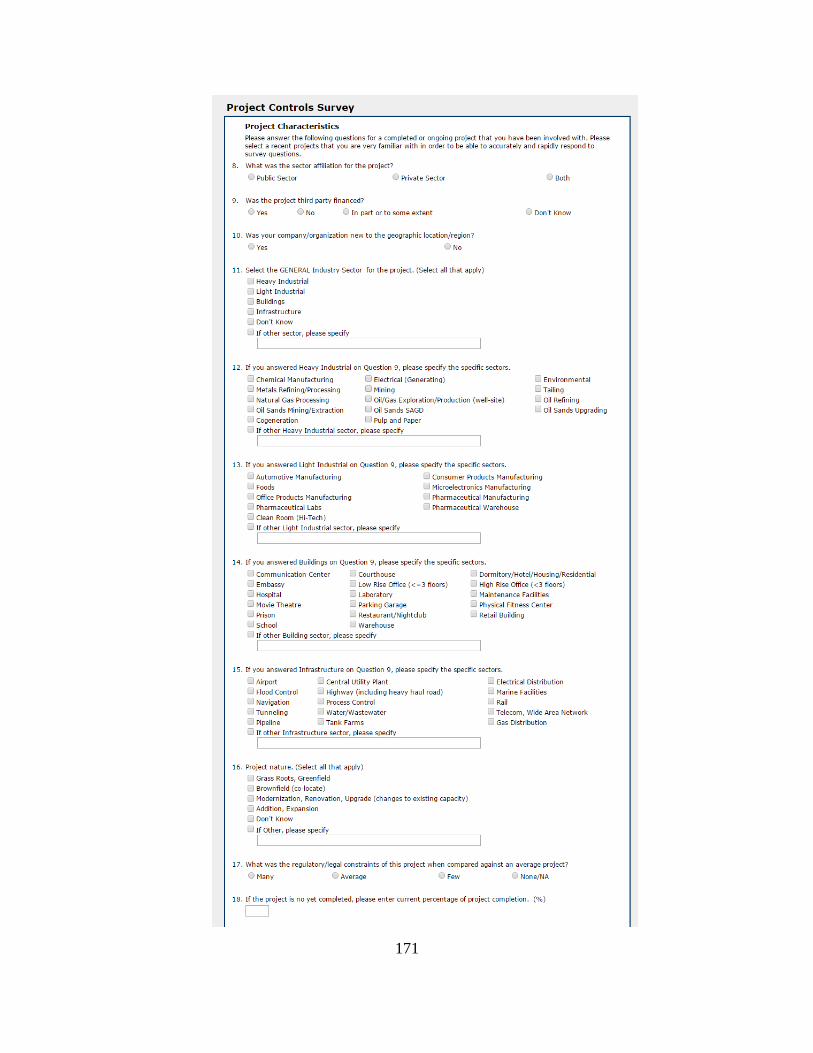
171
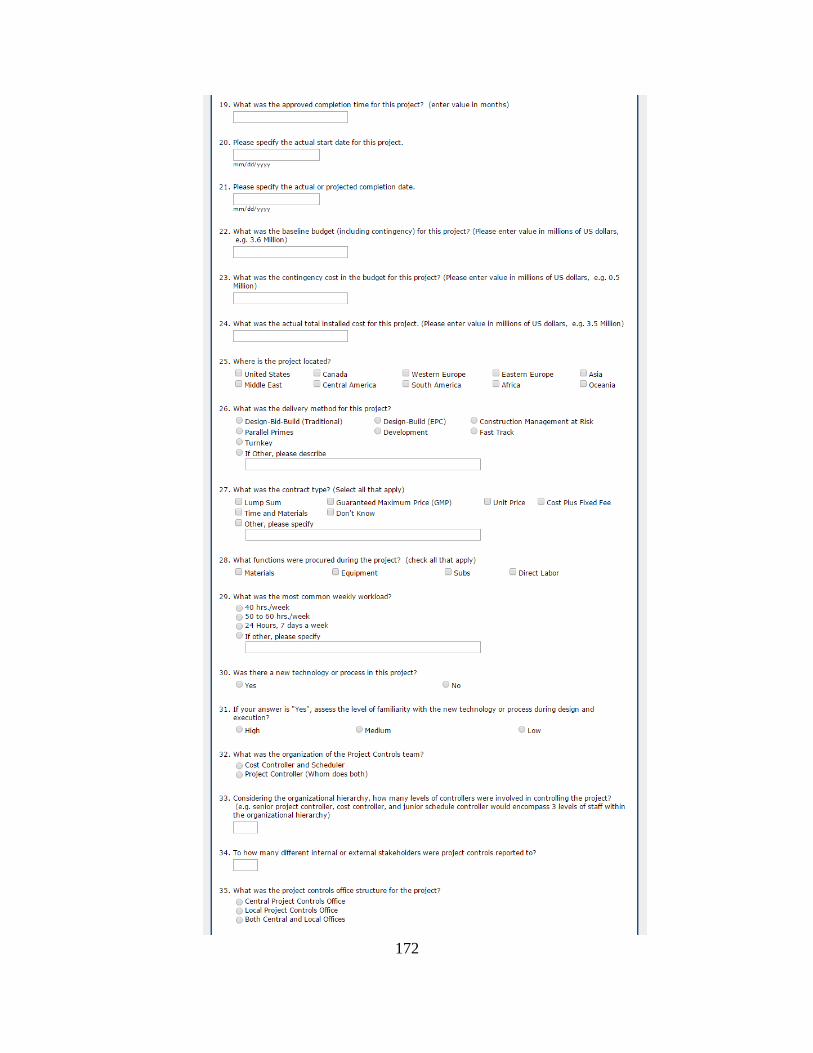
172
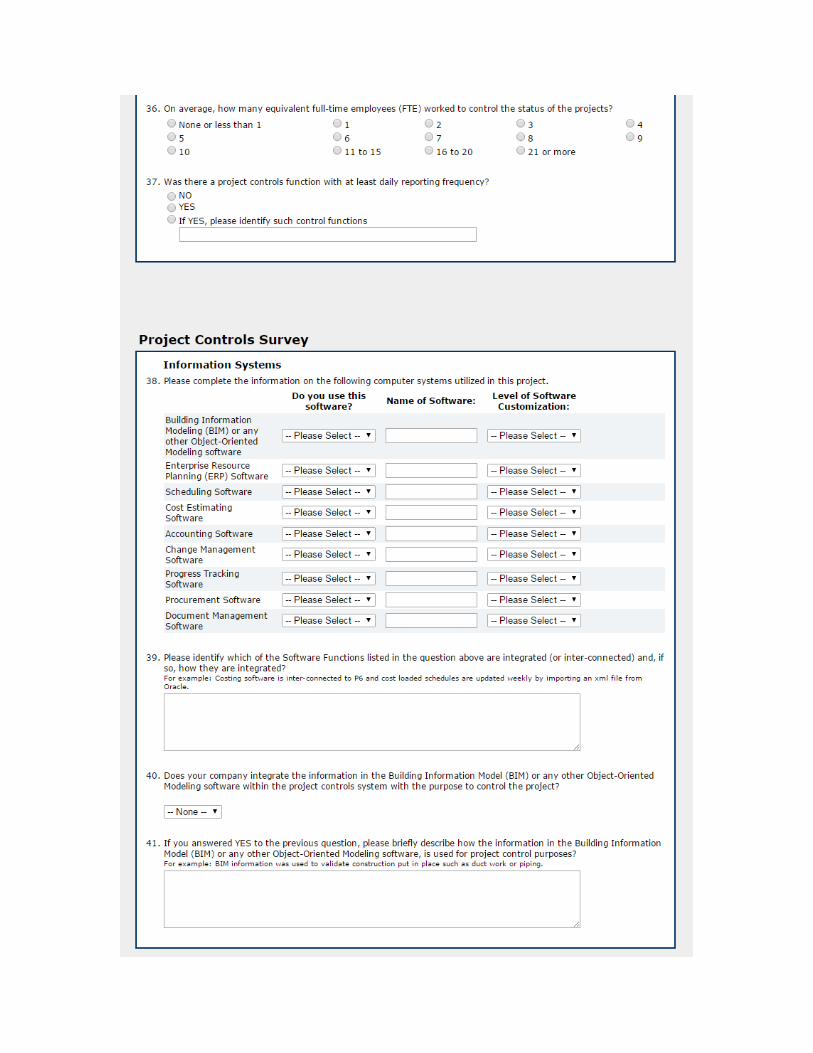
173
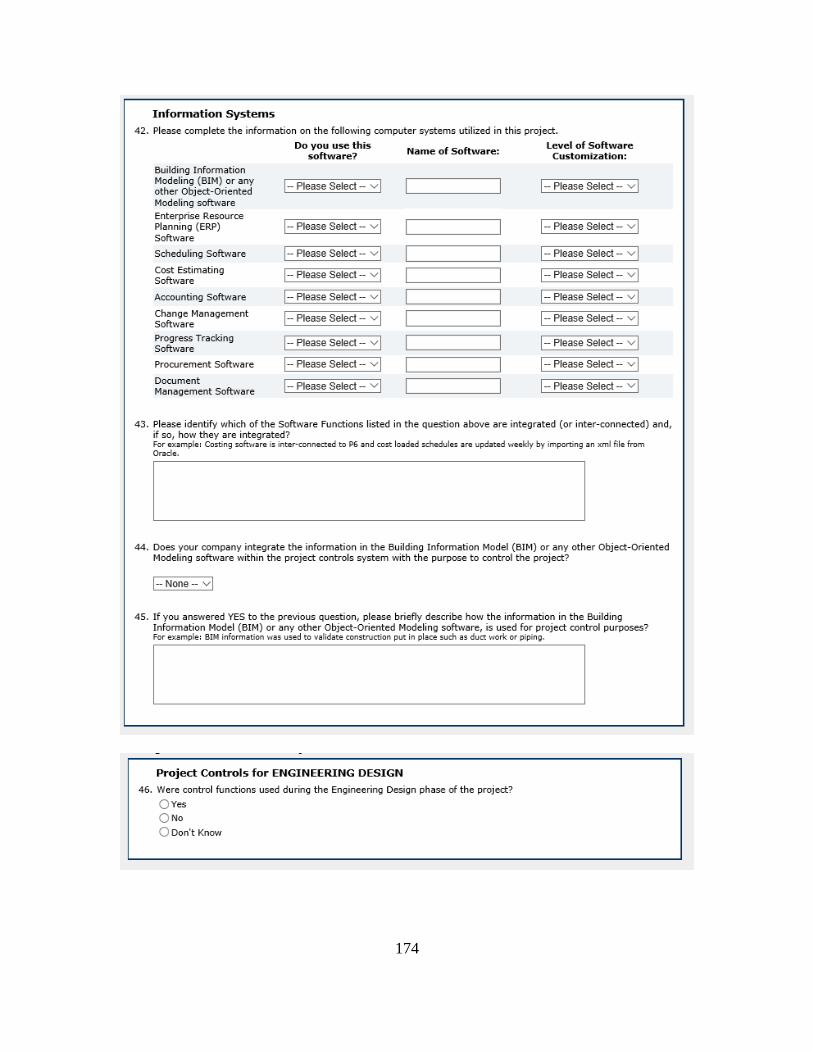
174
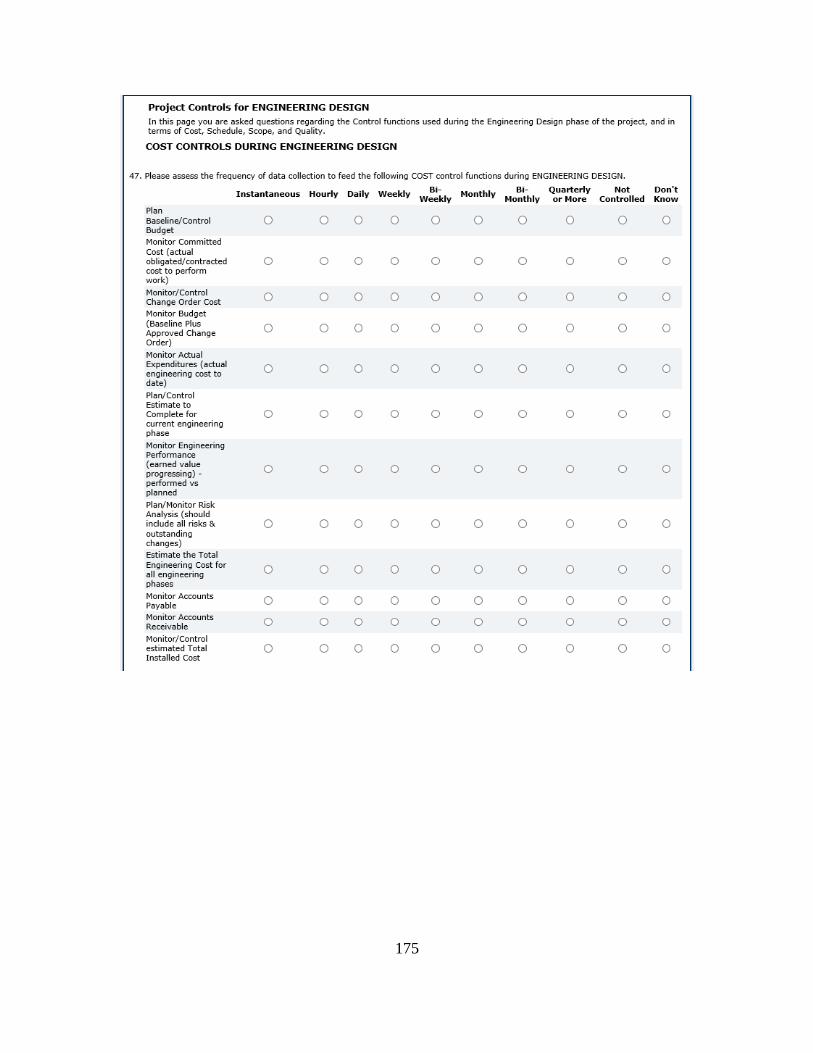
175
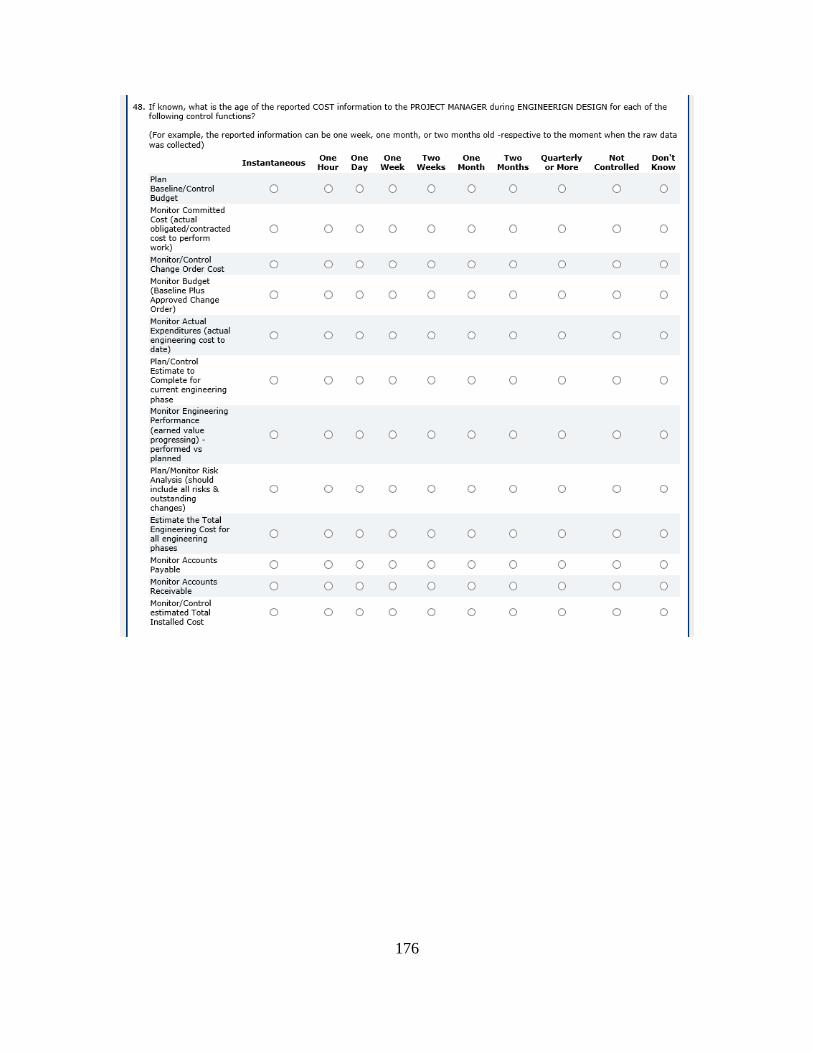
176
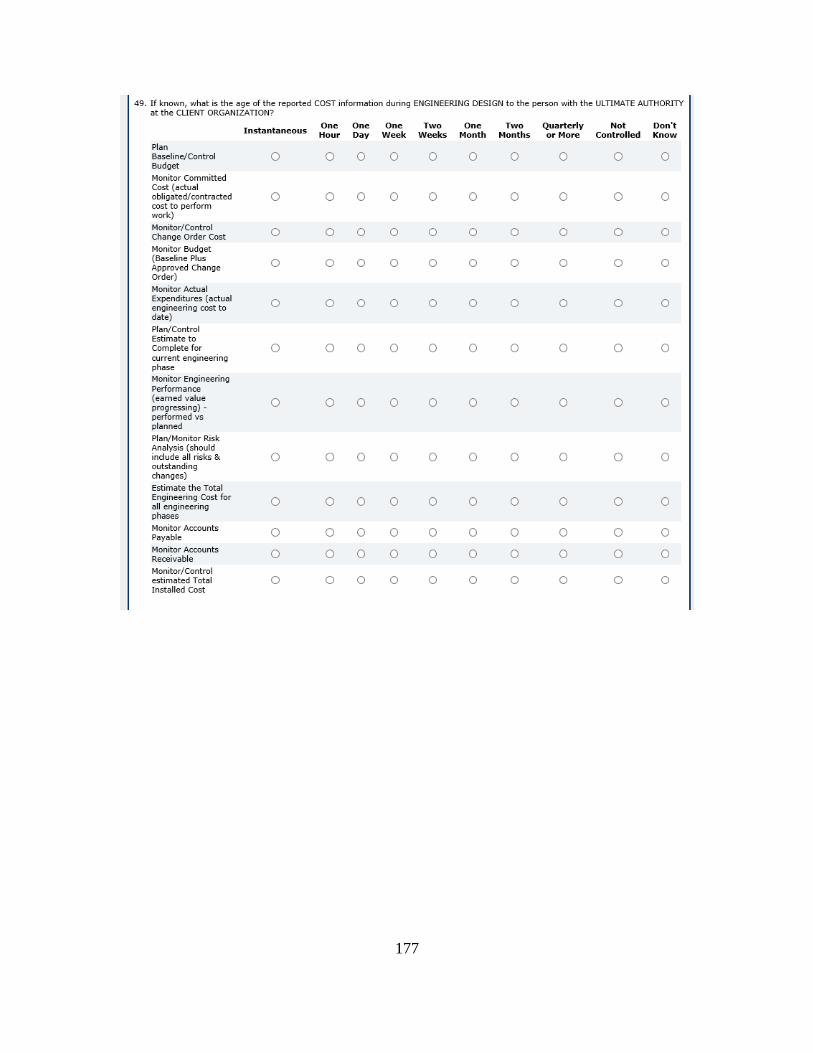
177
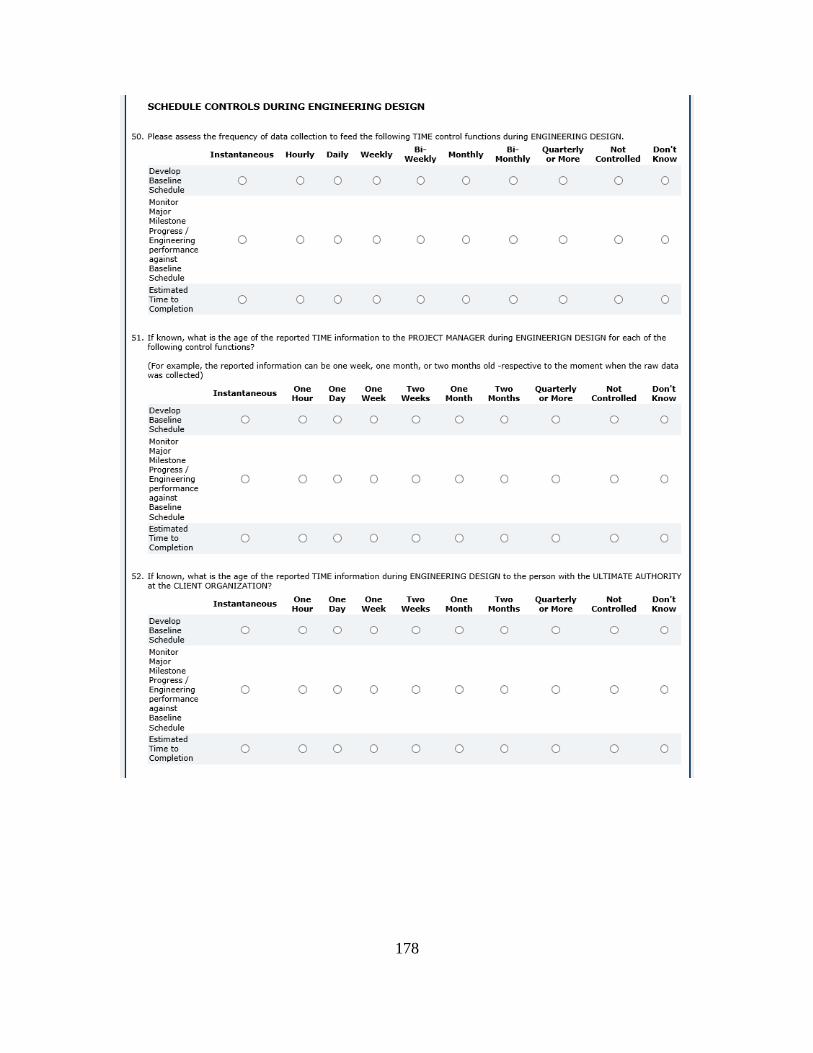
178
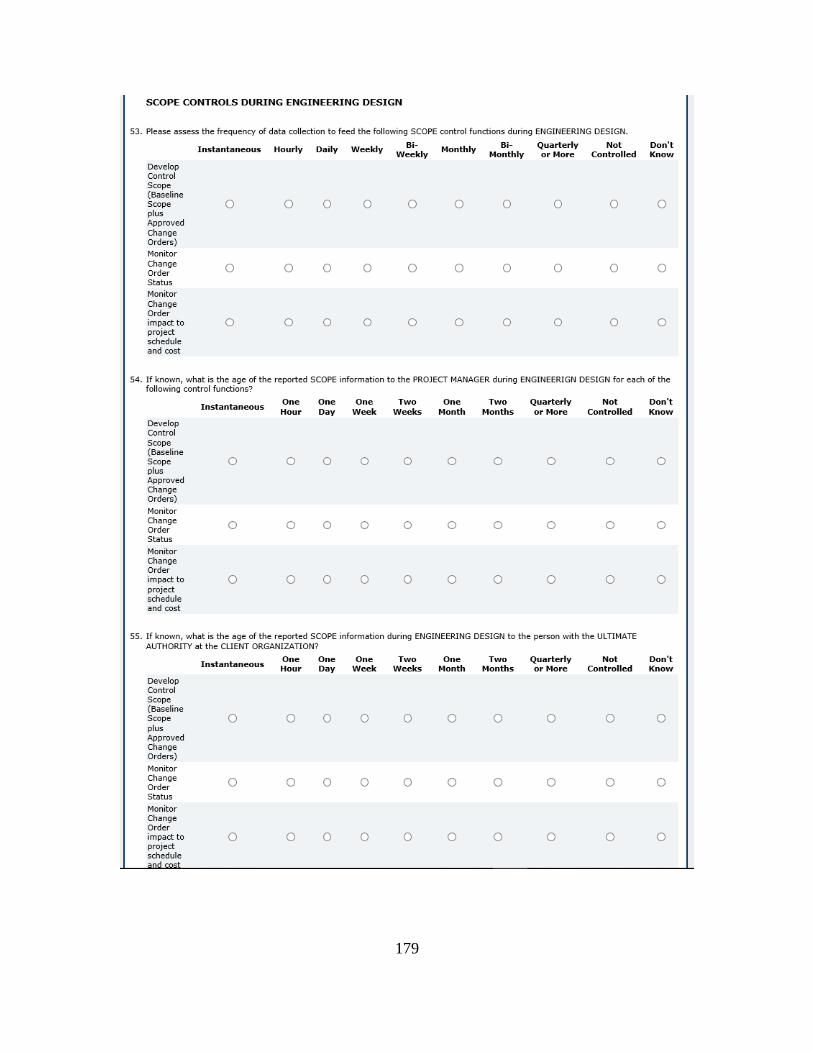
179

180
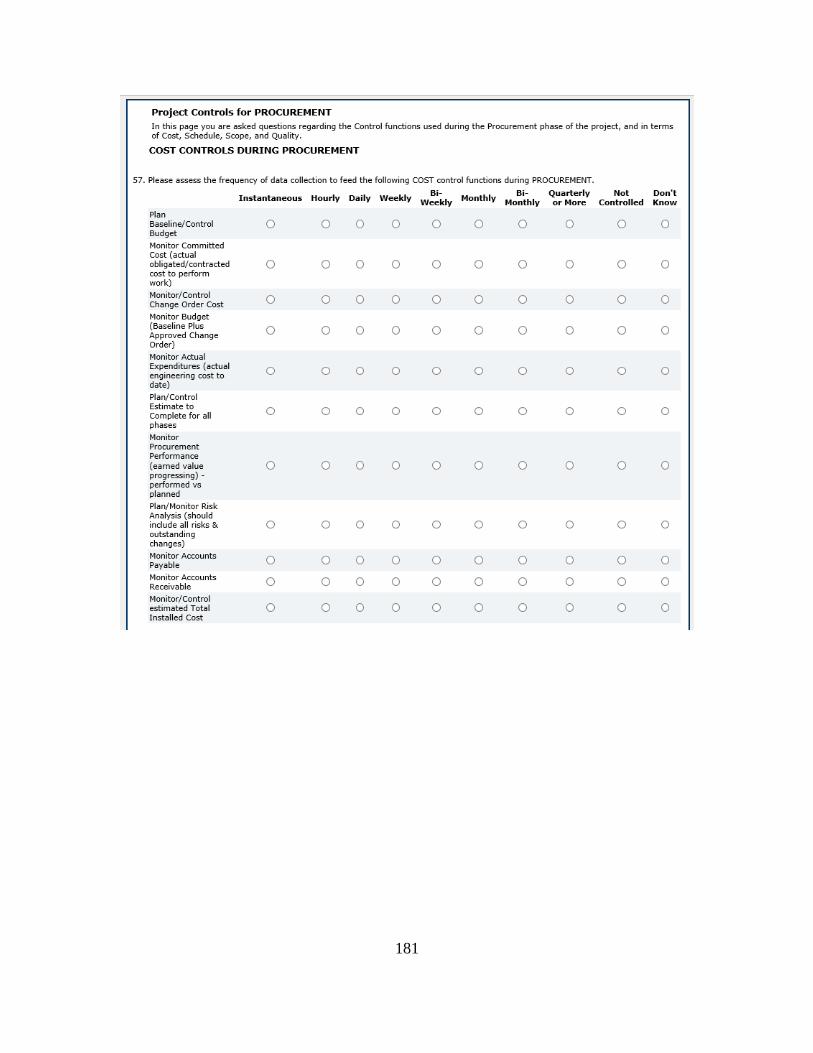
181
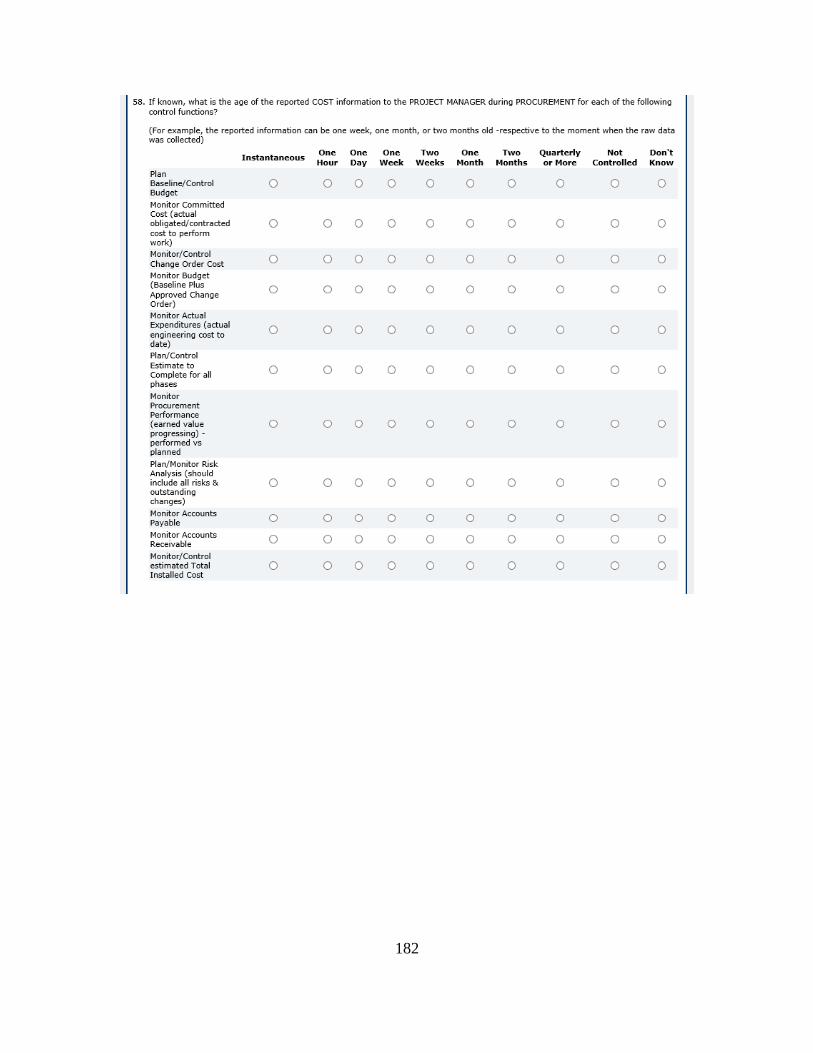
182
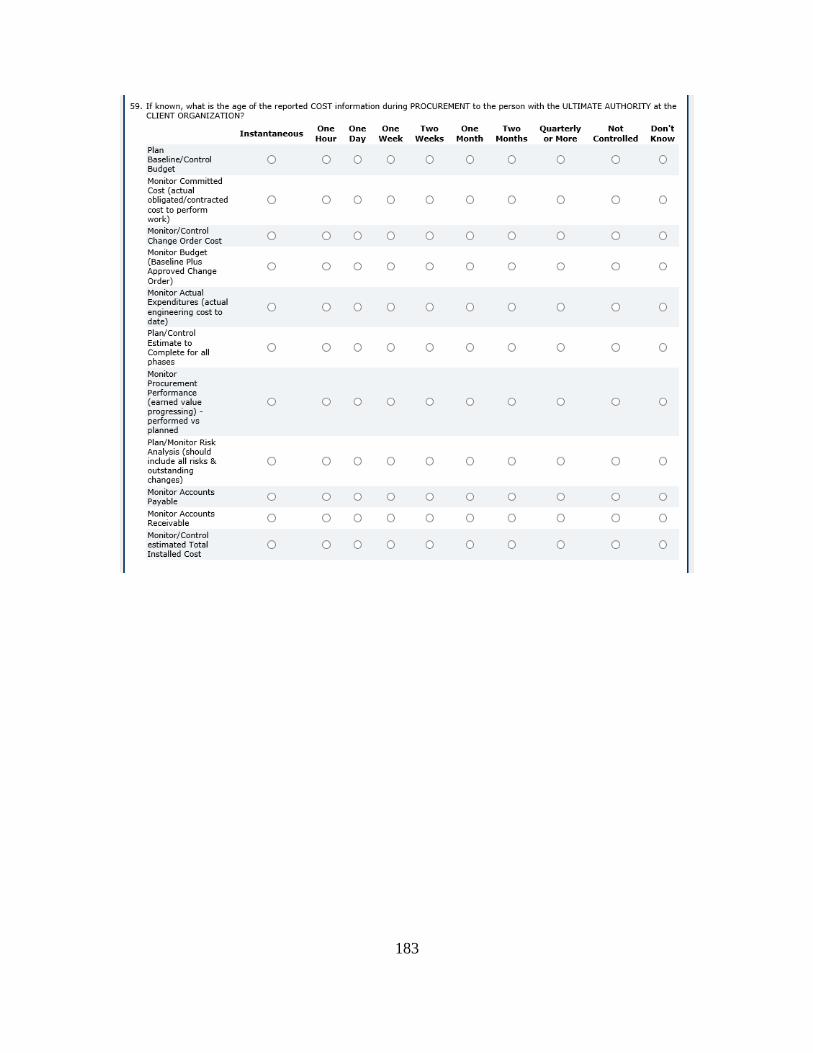
183
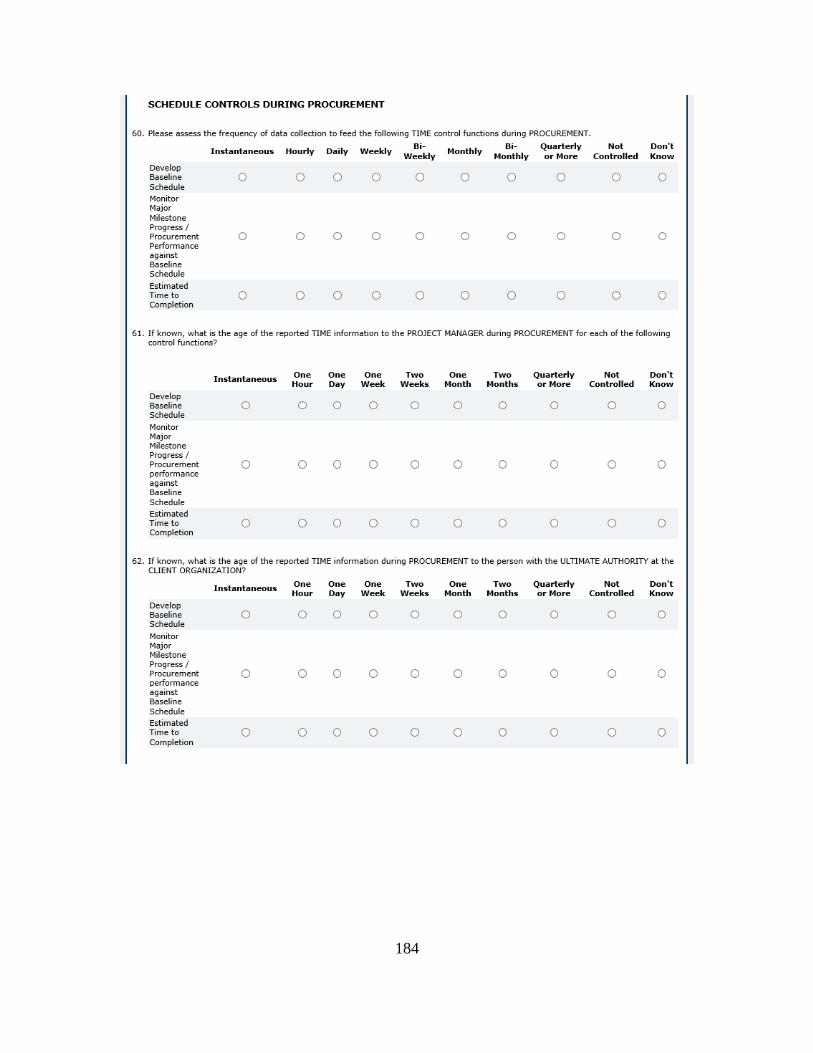
184
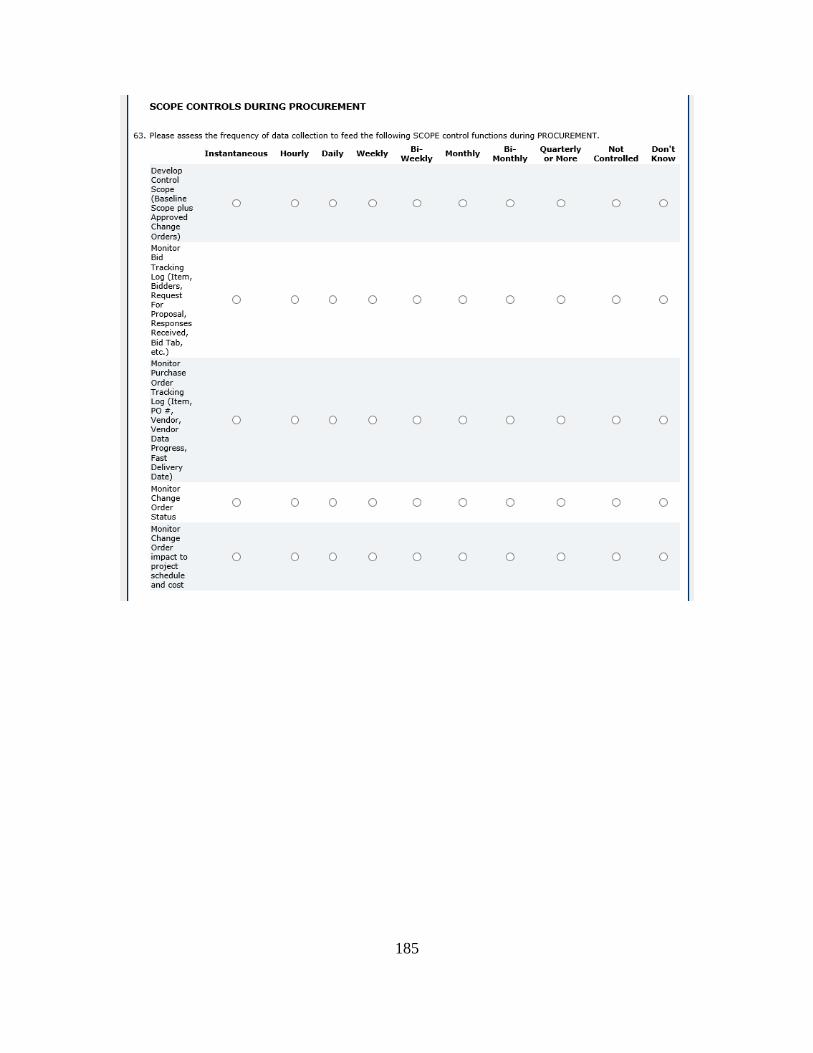
185
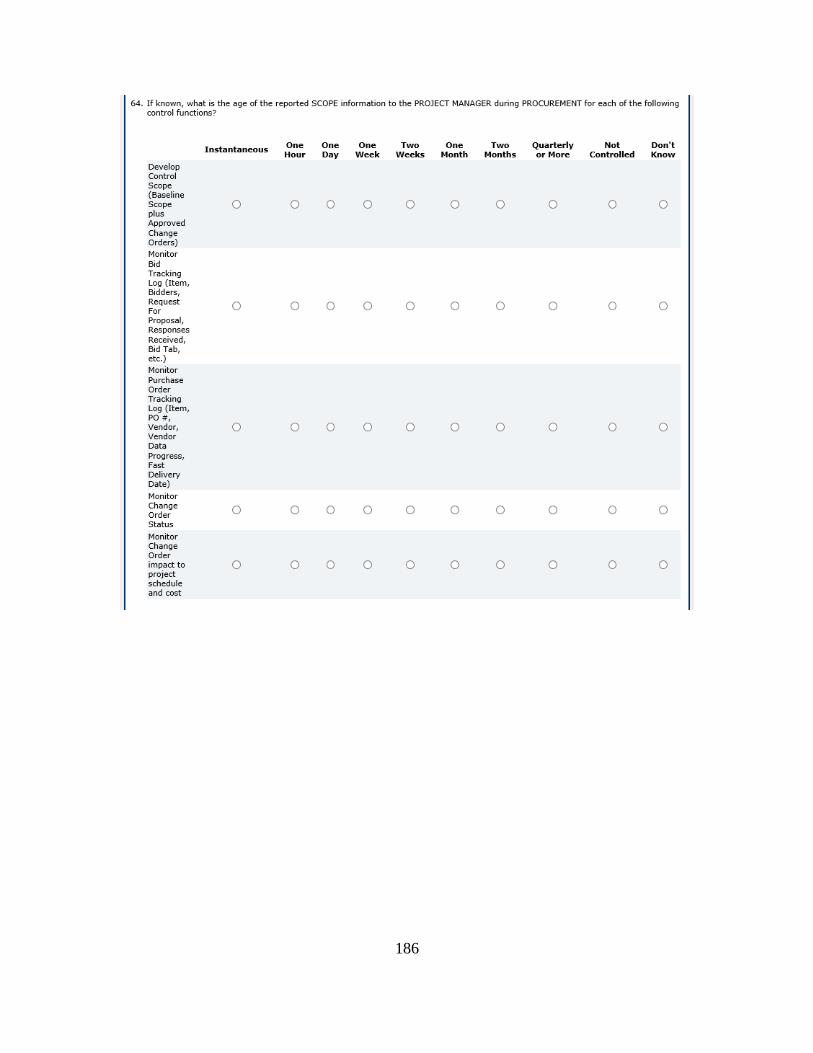
186
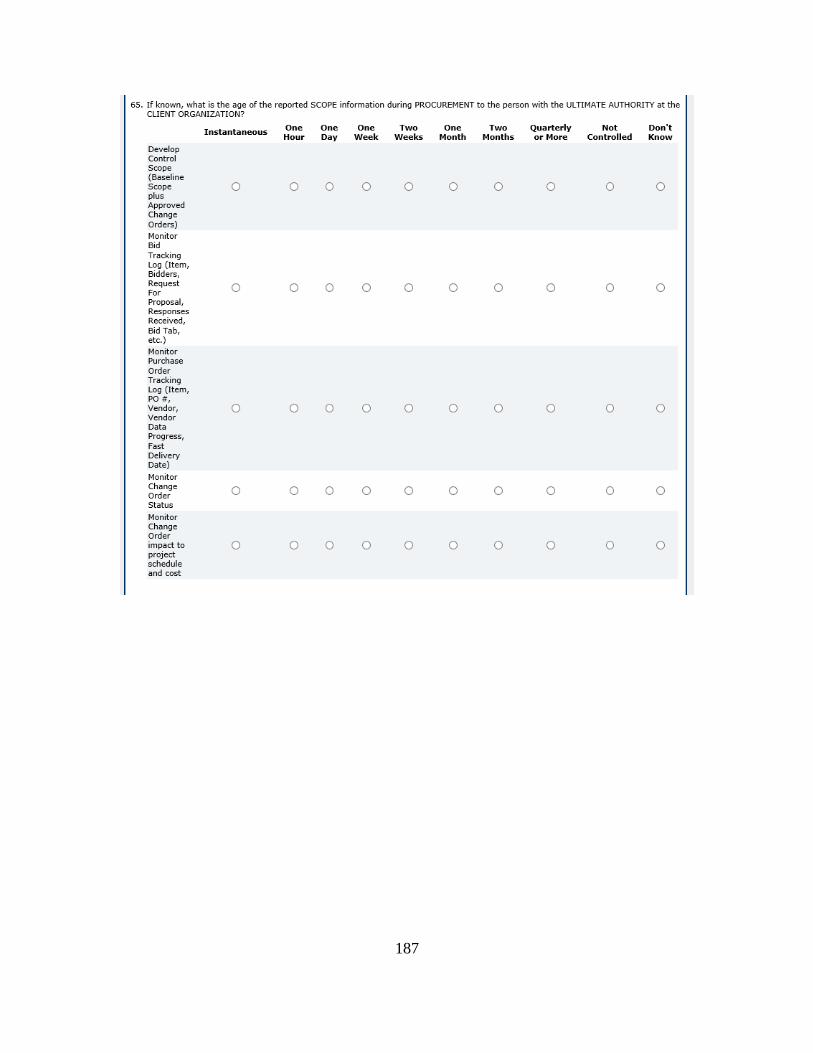
187
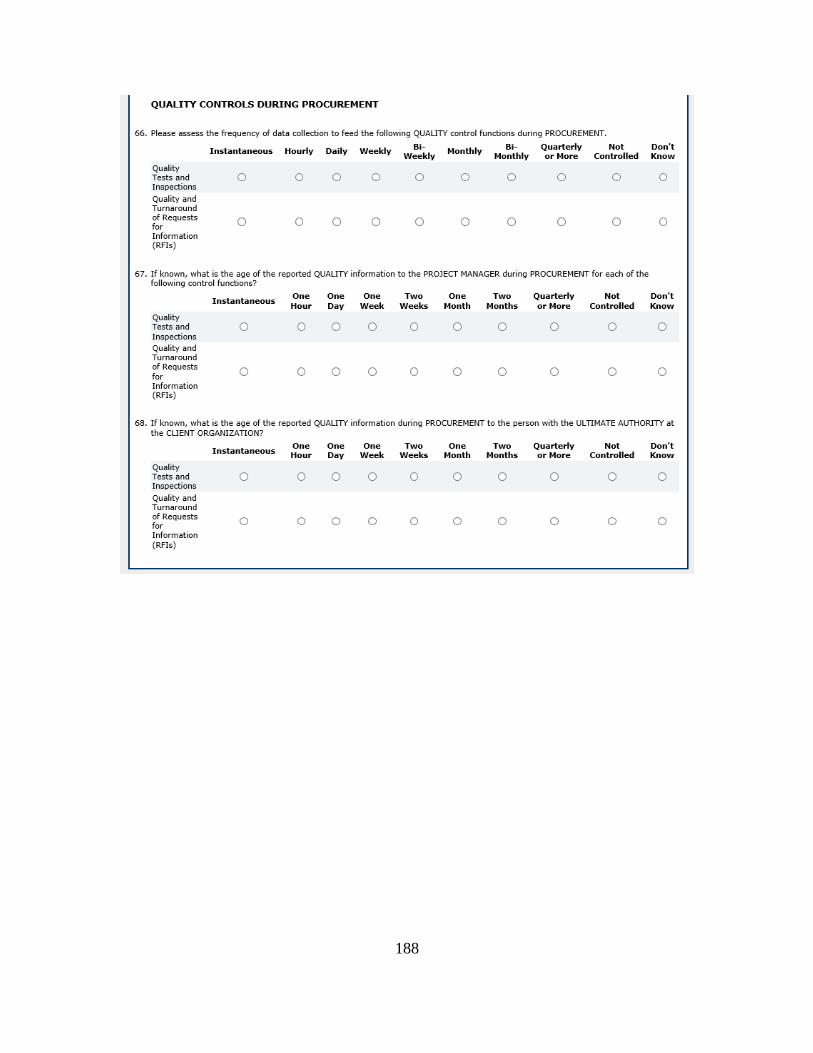
188
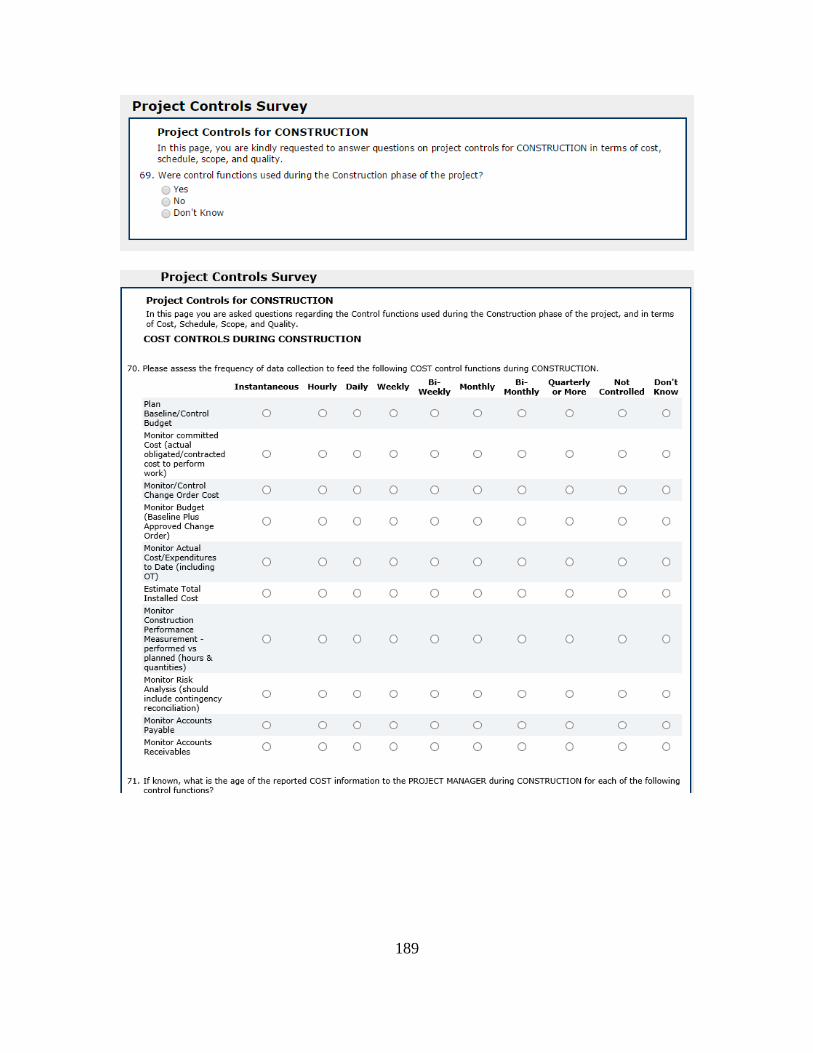
189
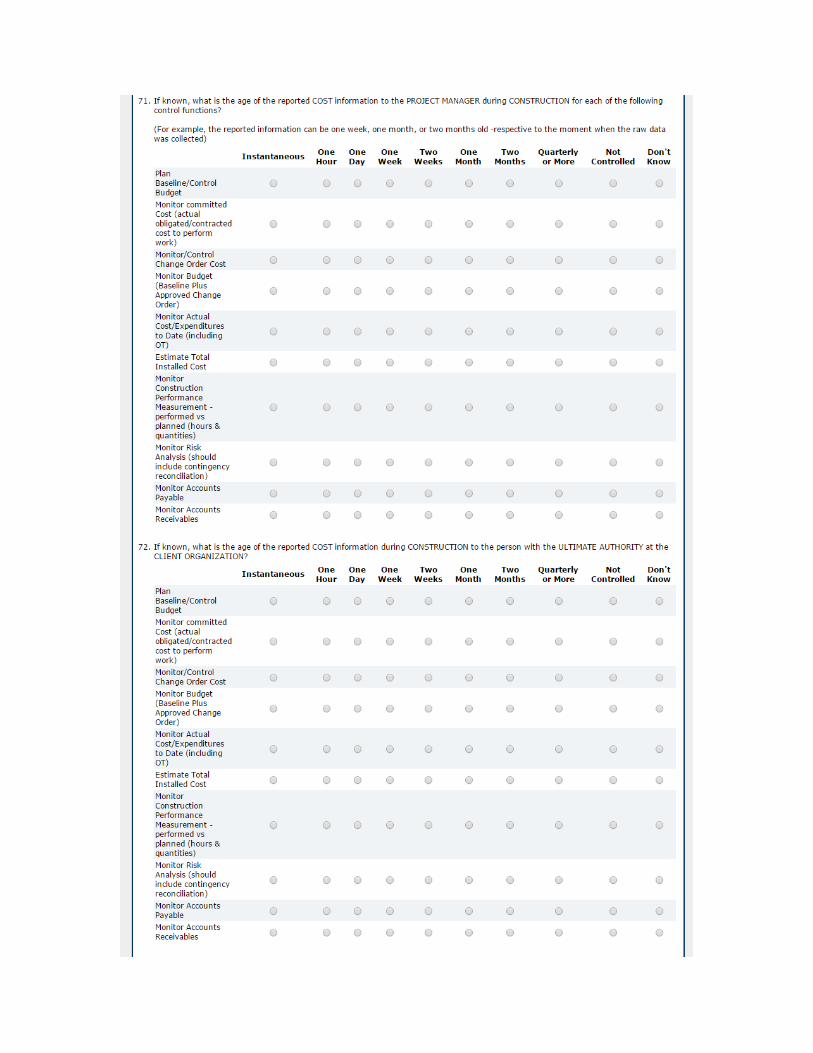
190
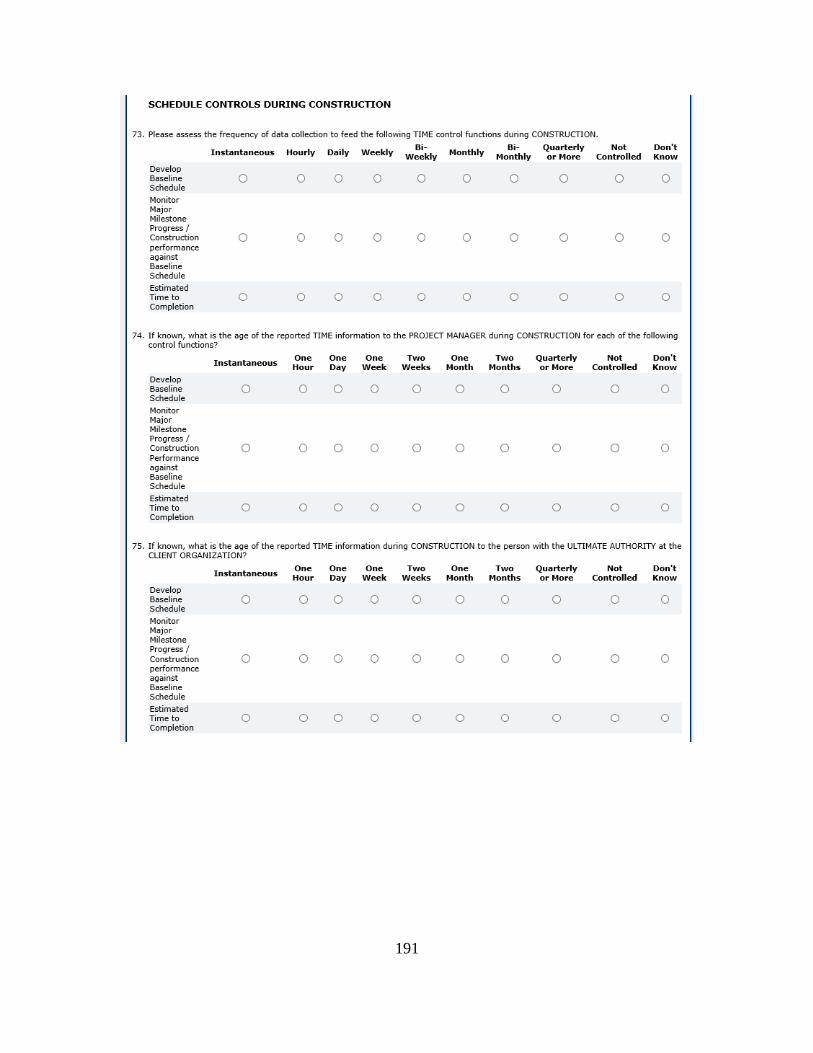
191
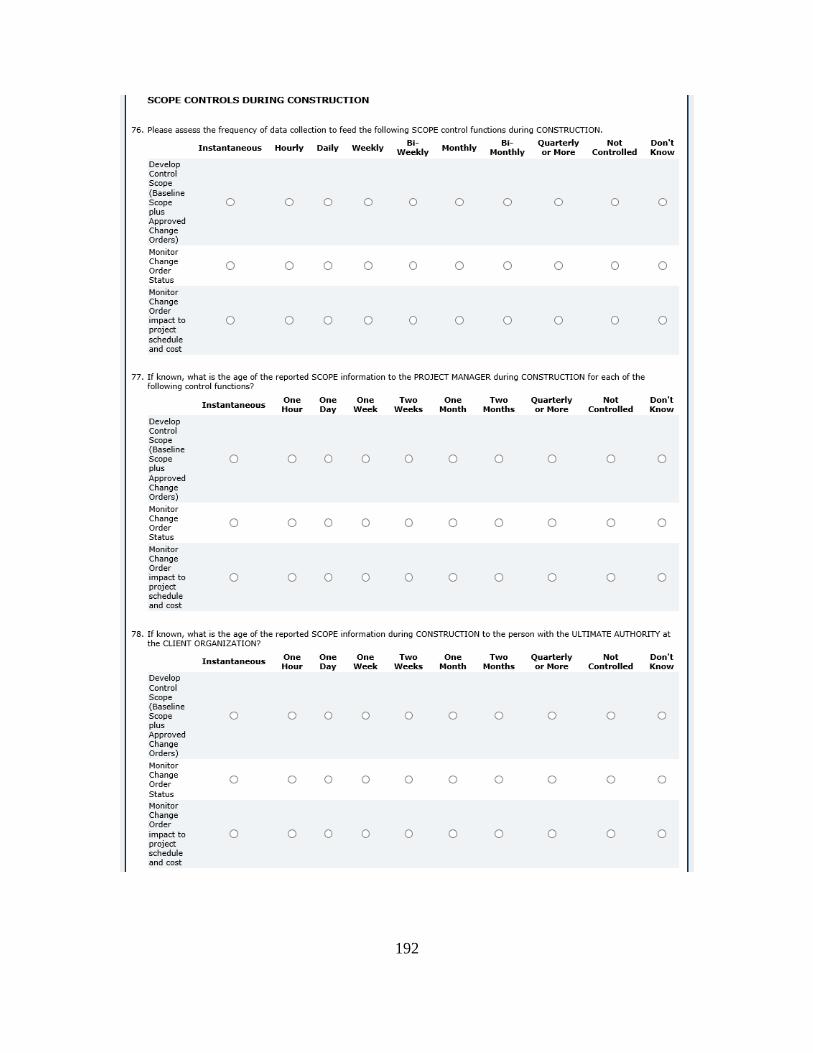
192
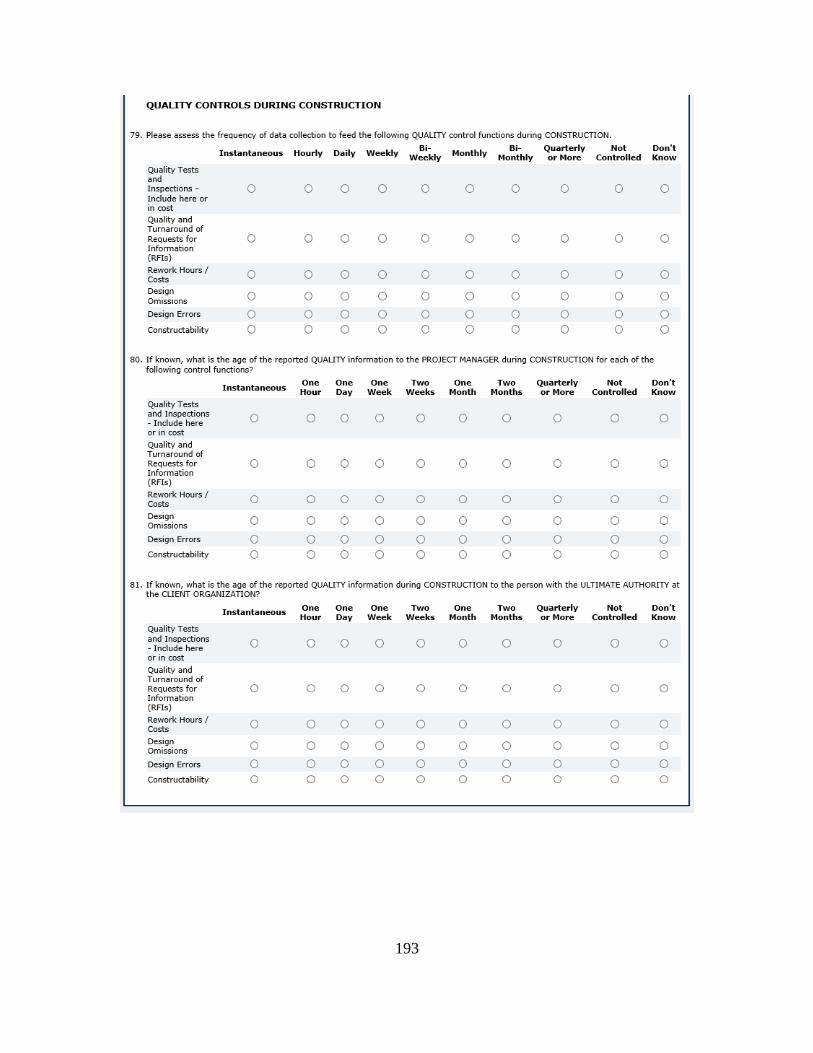
193
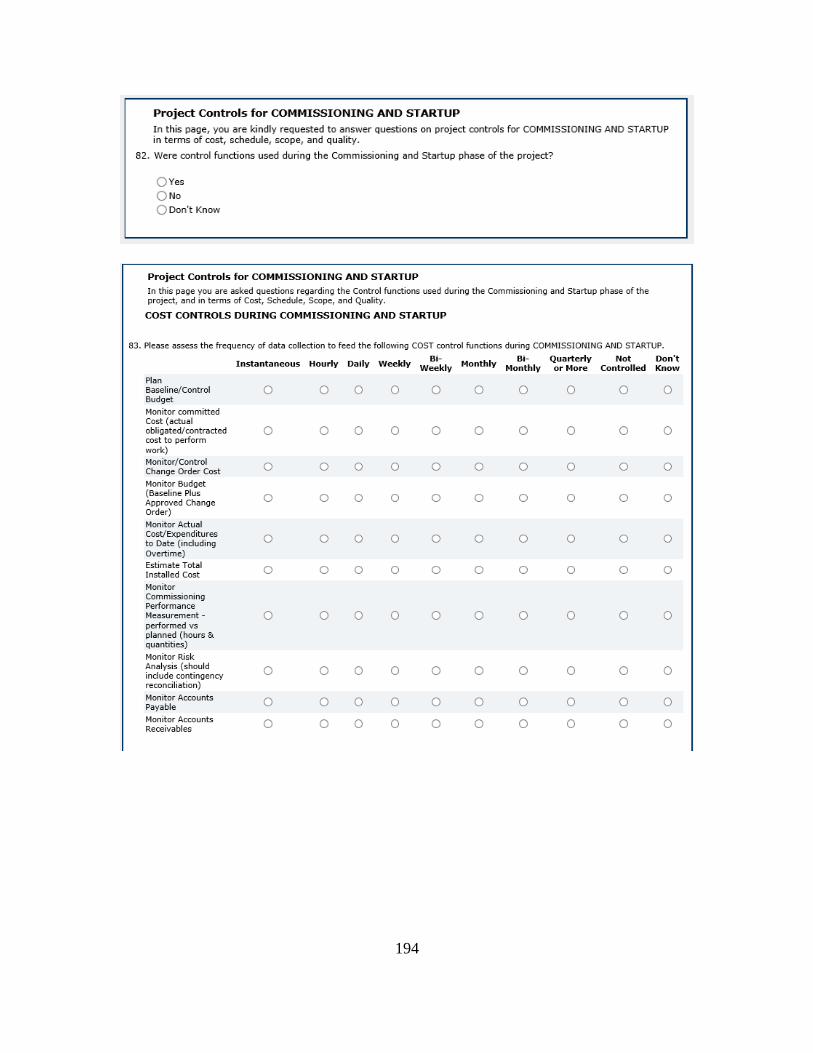
194
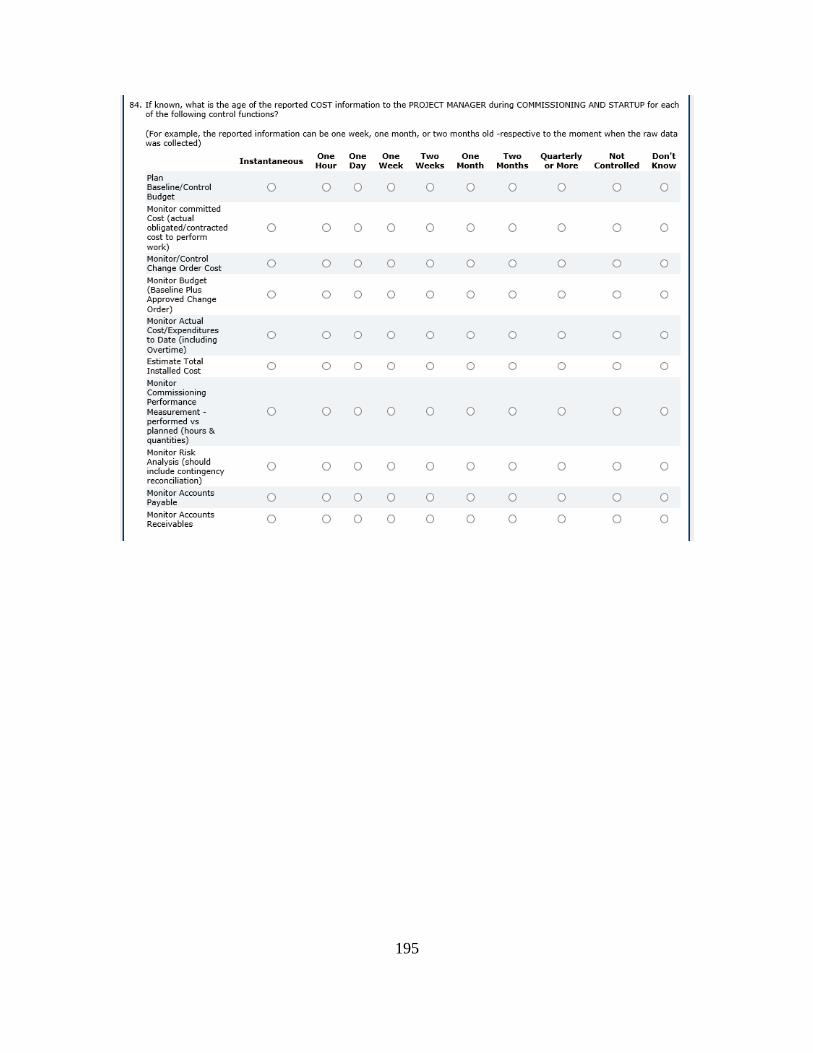
195
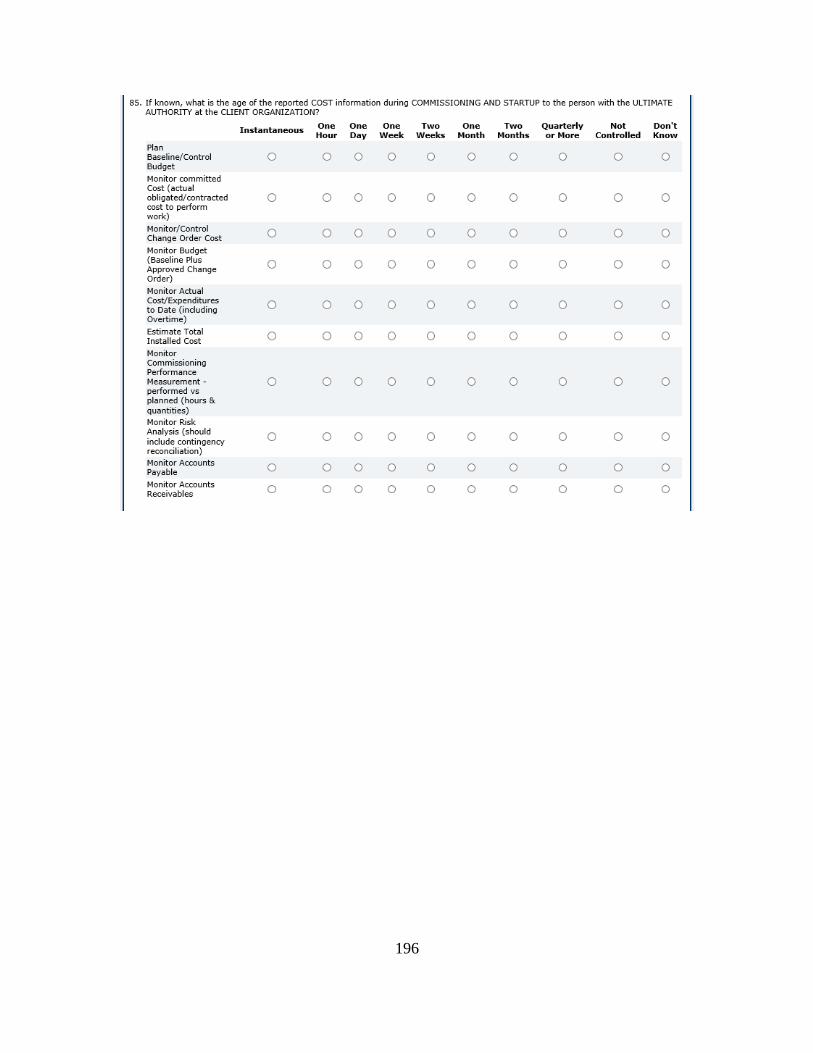
196
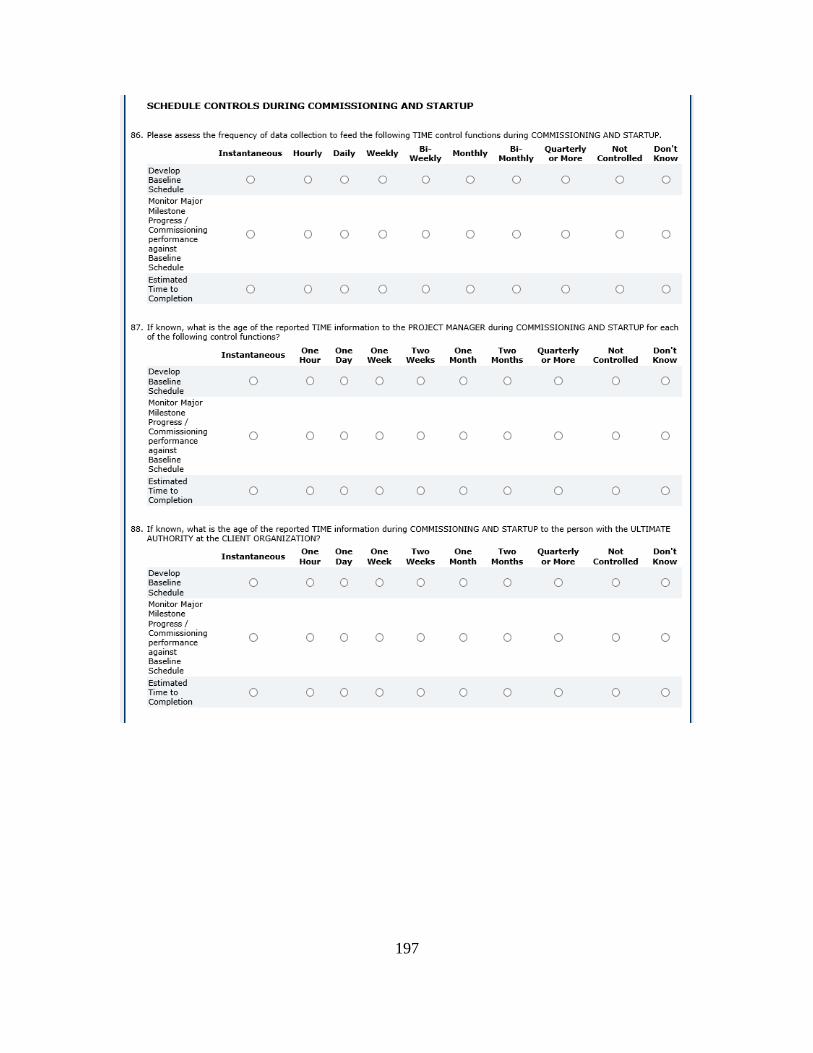
197
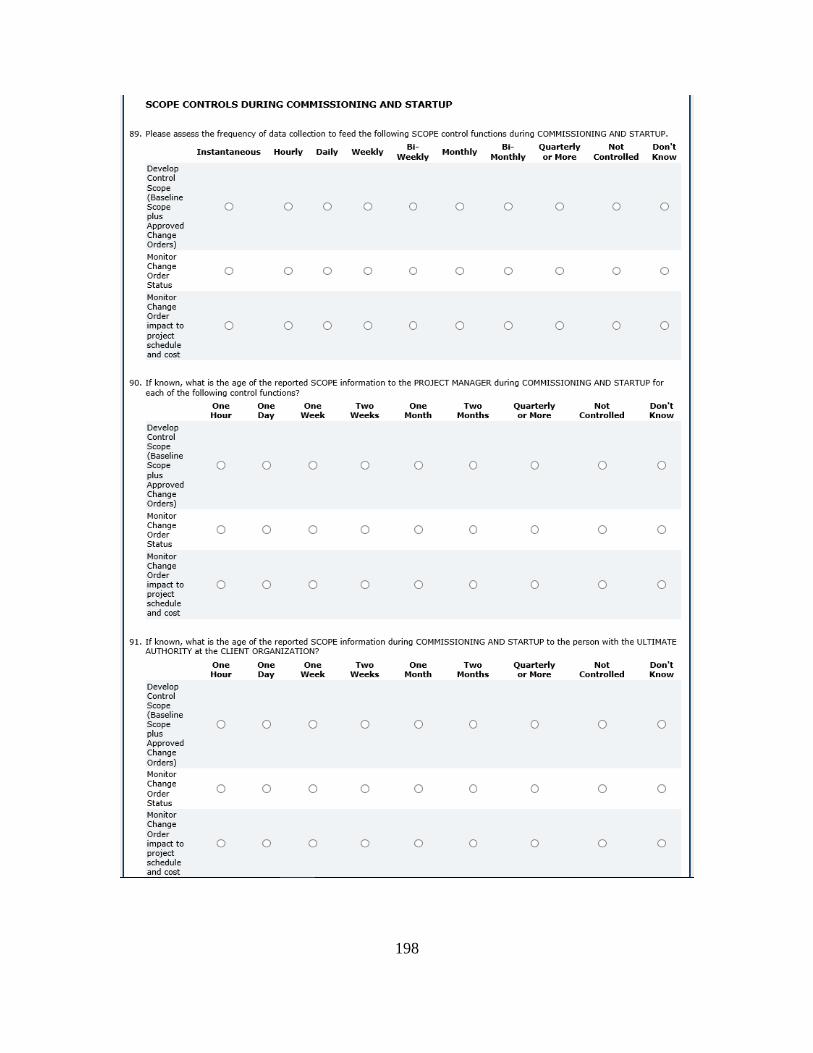
198
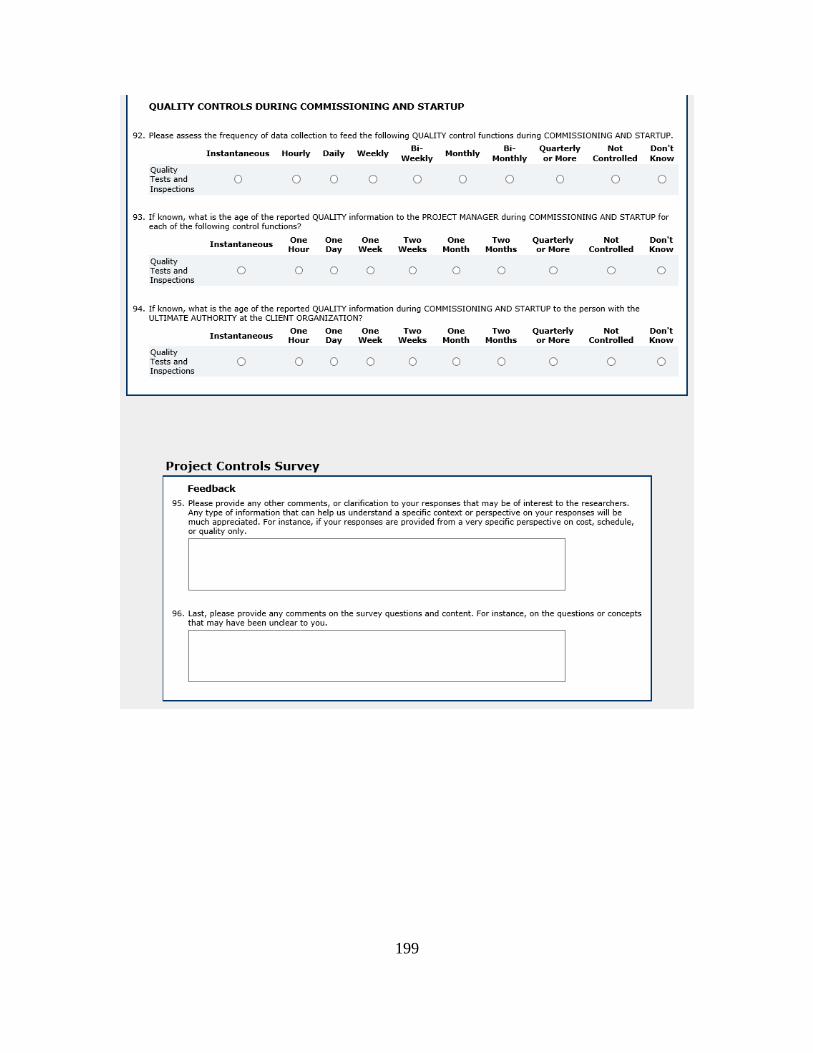
199

200
APPENDIX II
SURVEY 2—INSTANTANEOUS PROJECT CONTROLS SURVEY
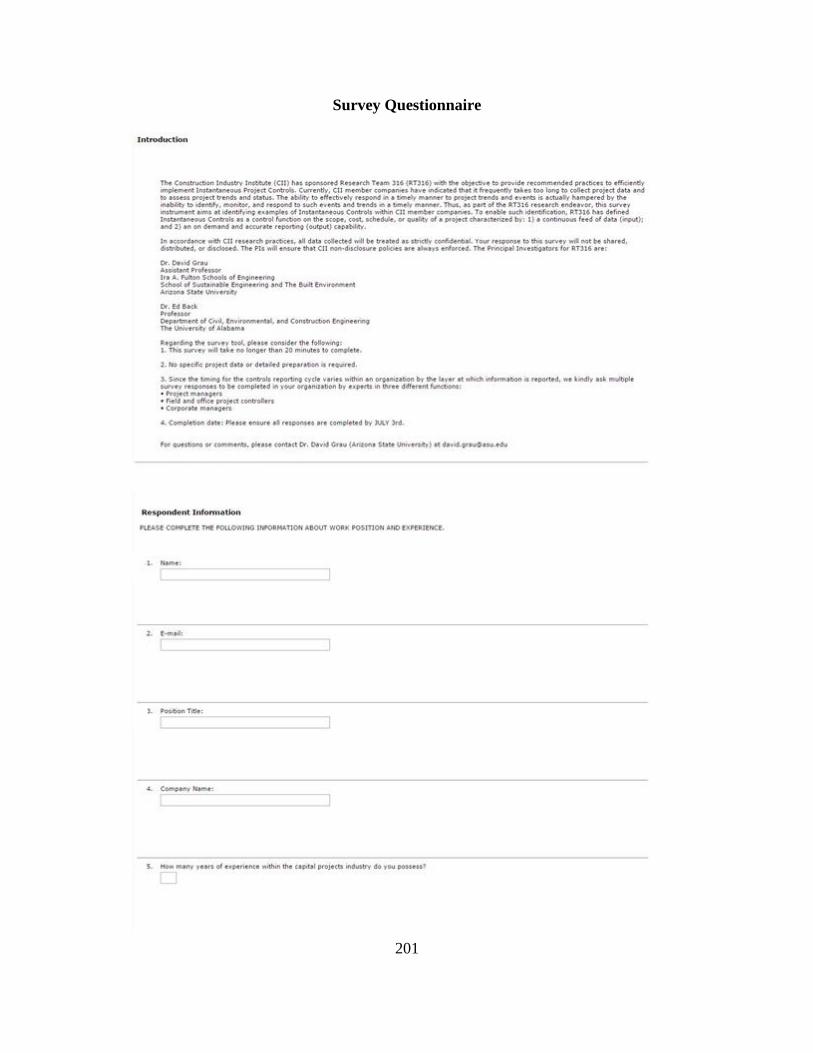
201
Survey Questionnaire
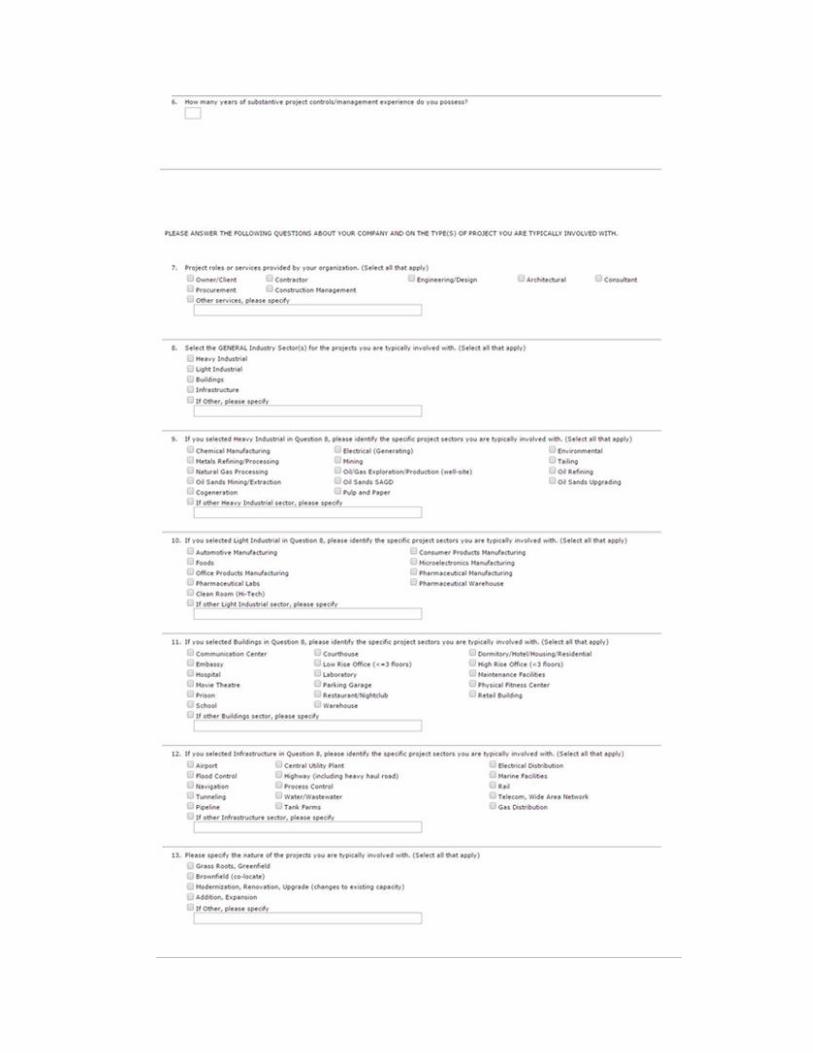
202
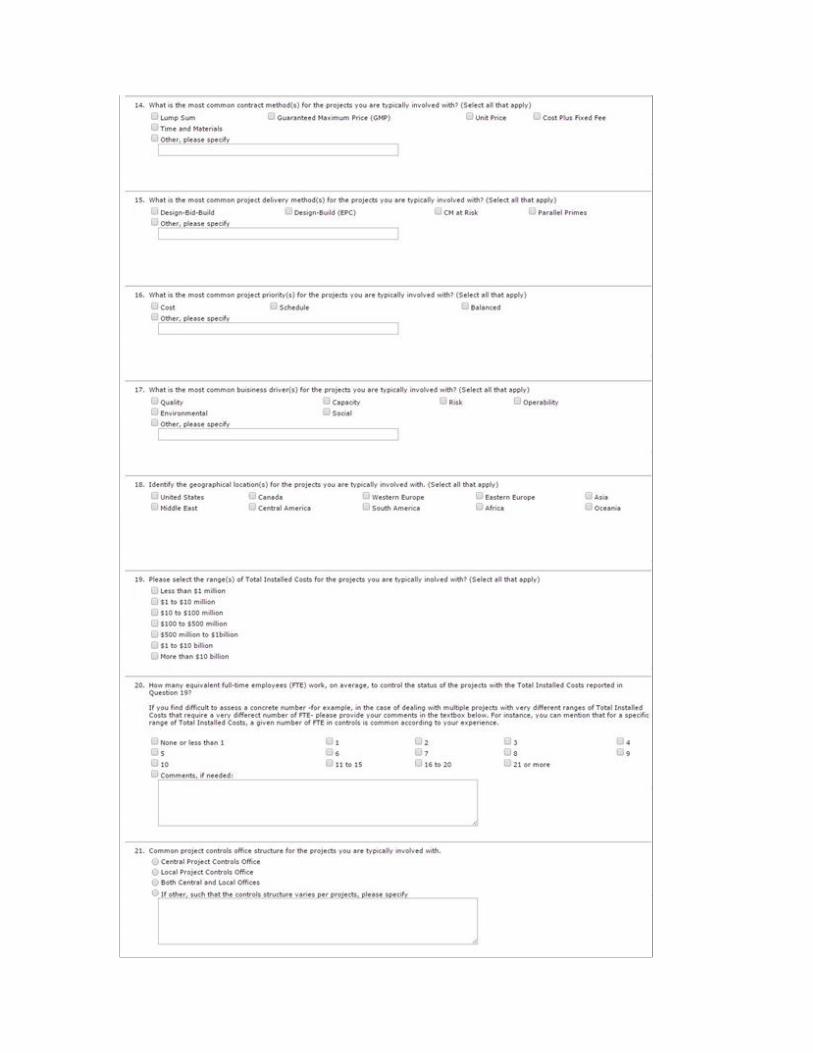
203
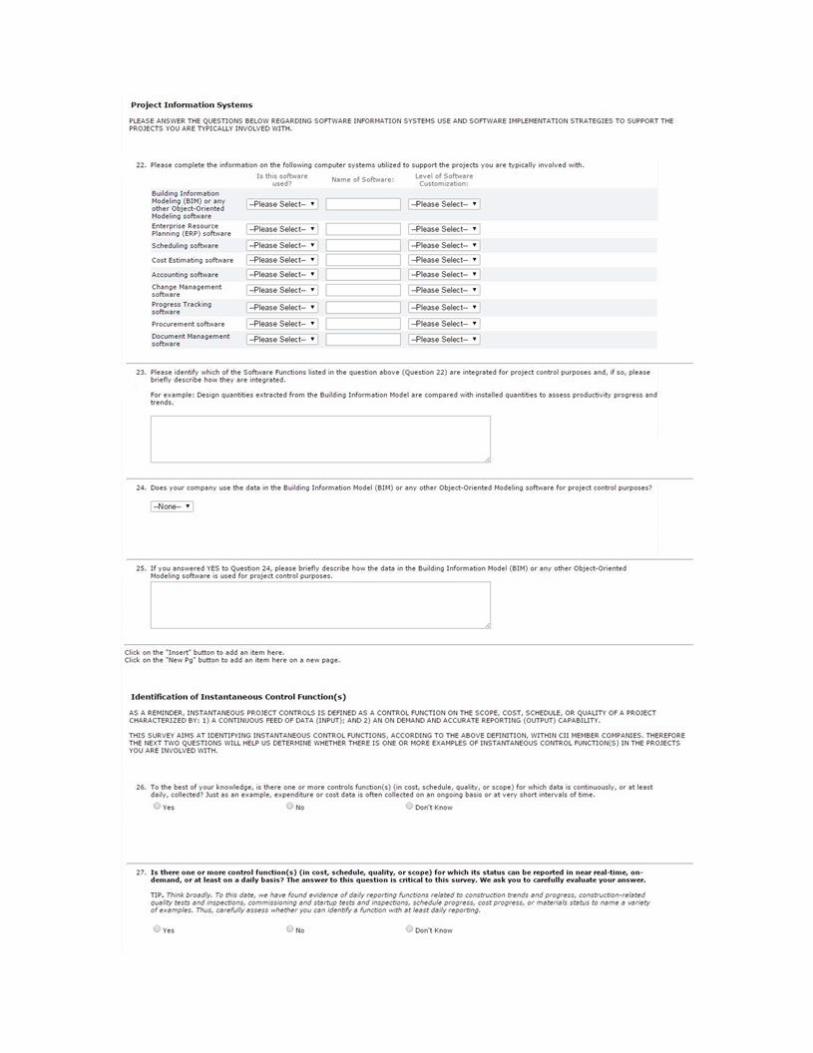
204
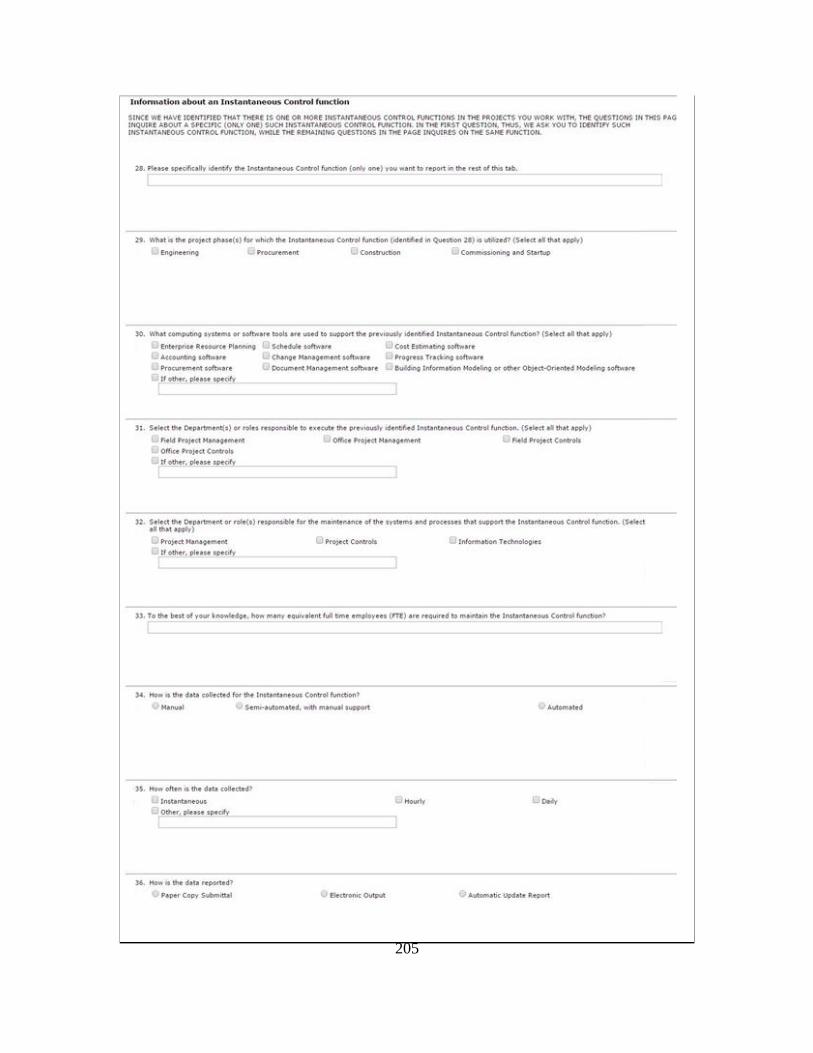
205
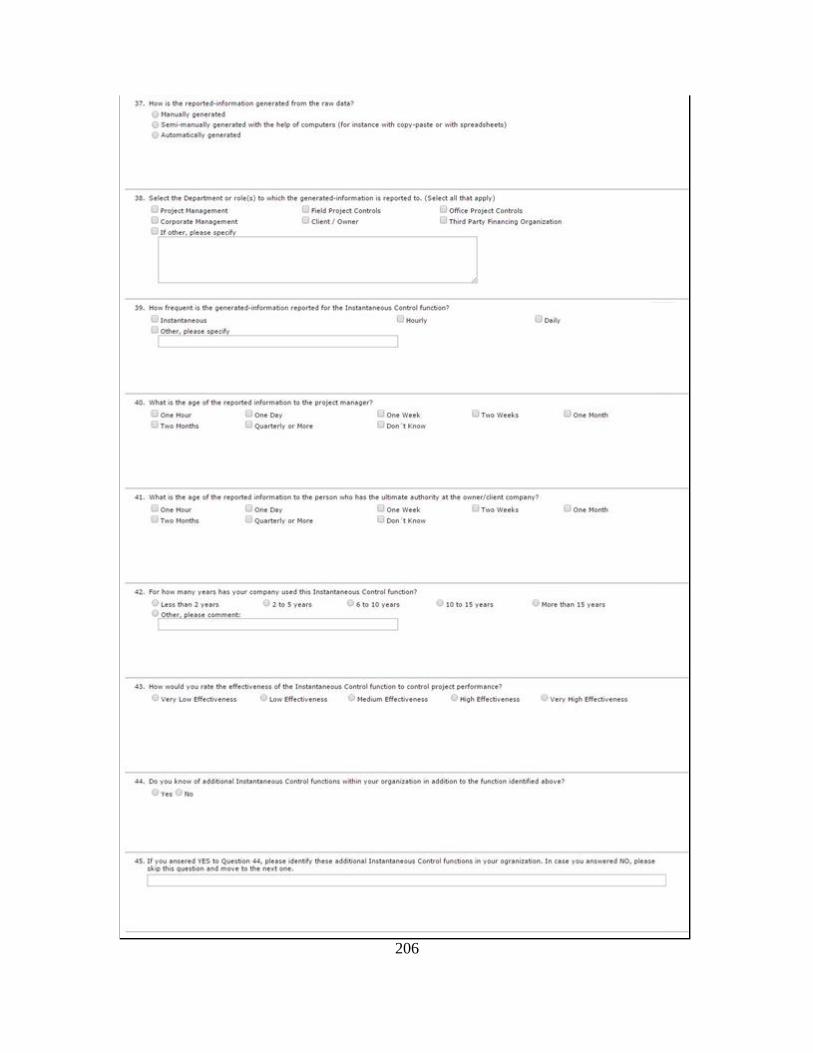
206
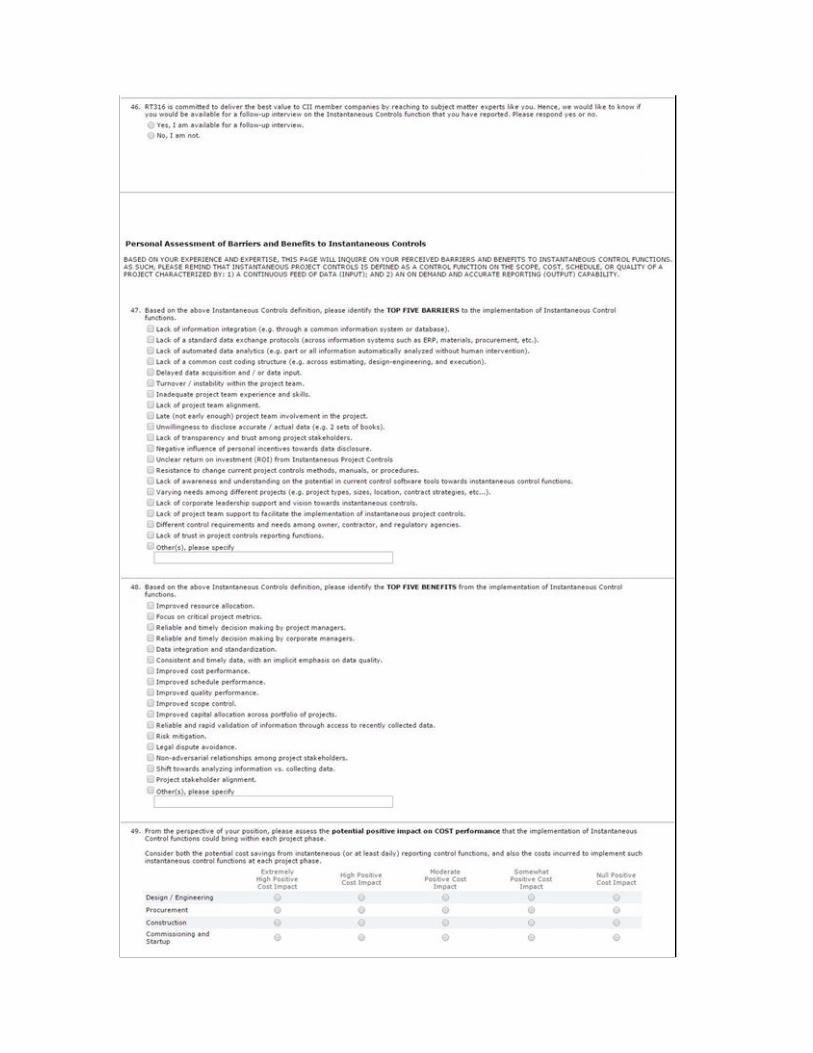
207
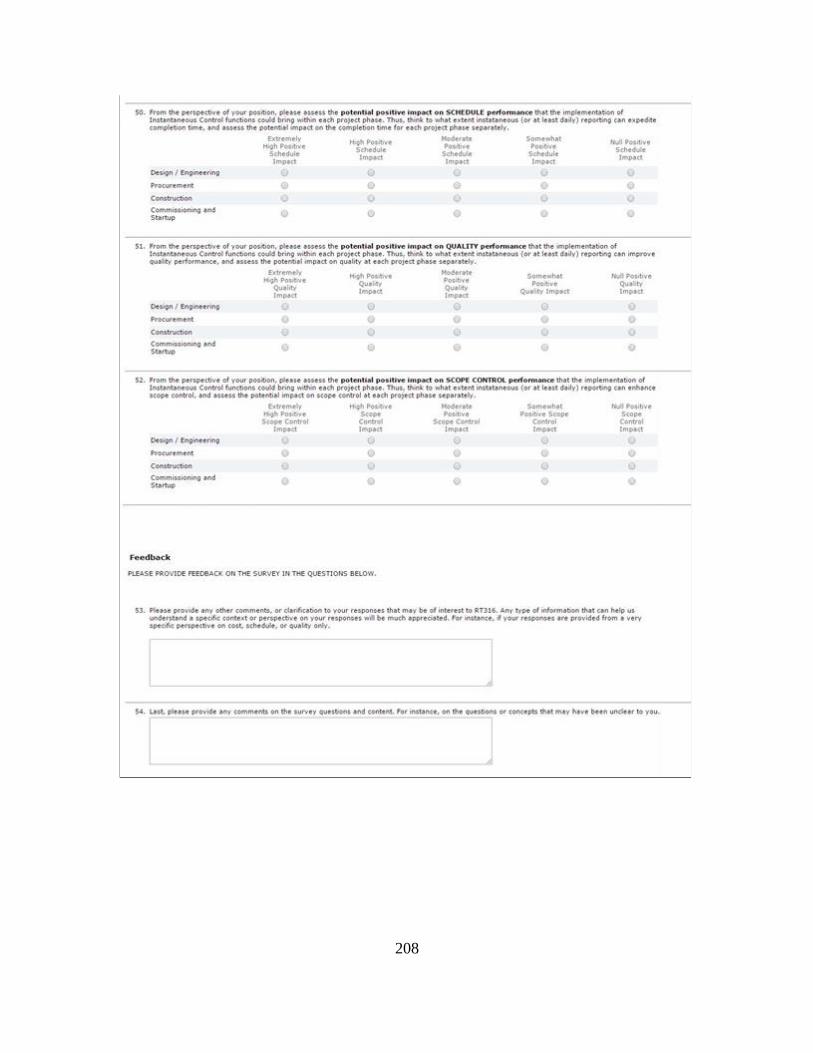
208

209
APPENDIX III
PRE-INTERVIEW EMAIL TO COMPANIES
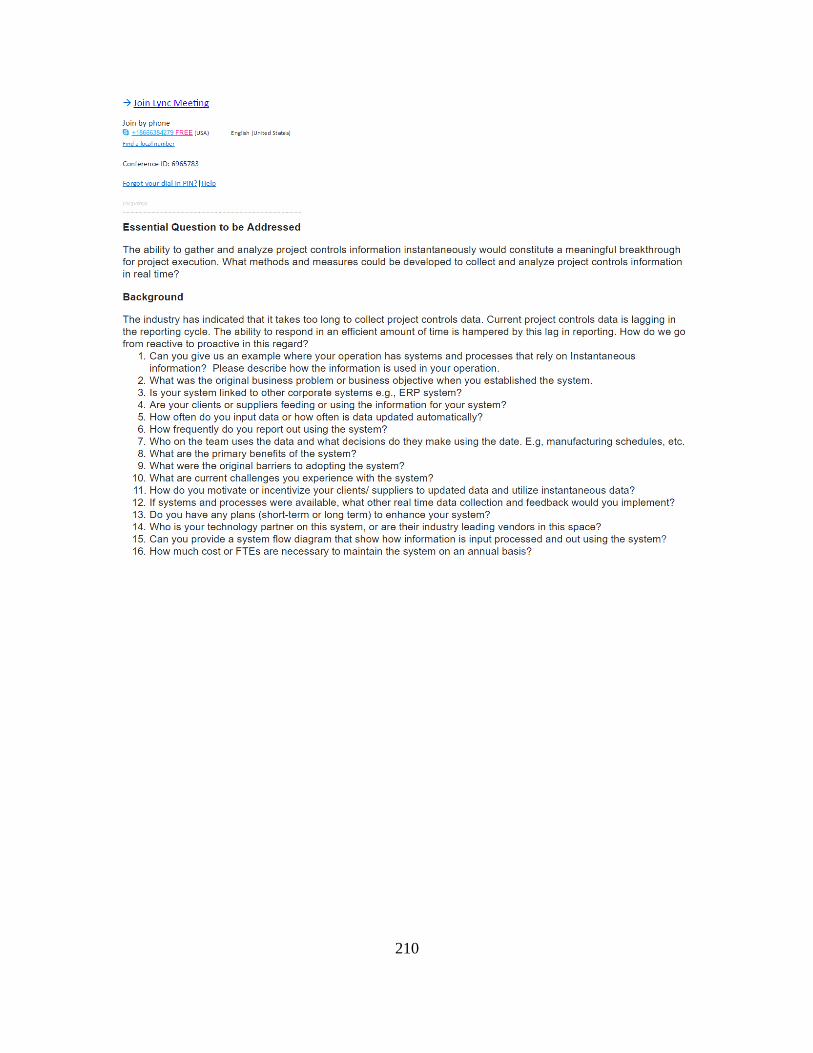
210


