Download - Infographic by A'PaePae

Course : Infographic by A’PaePae22 Sep 2016
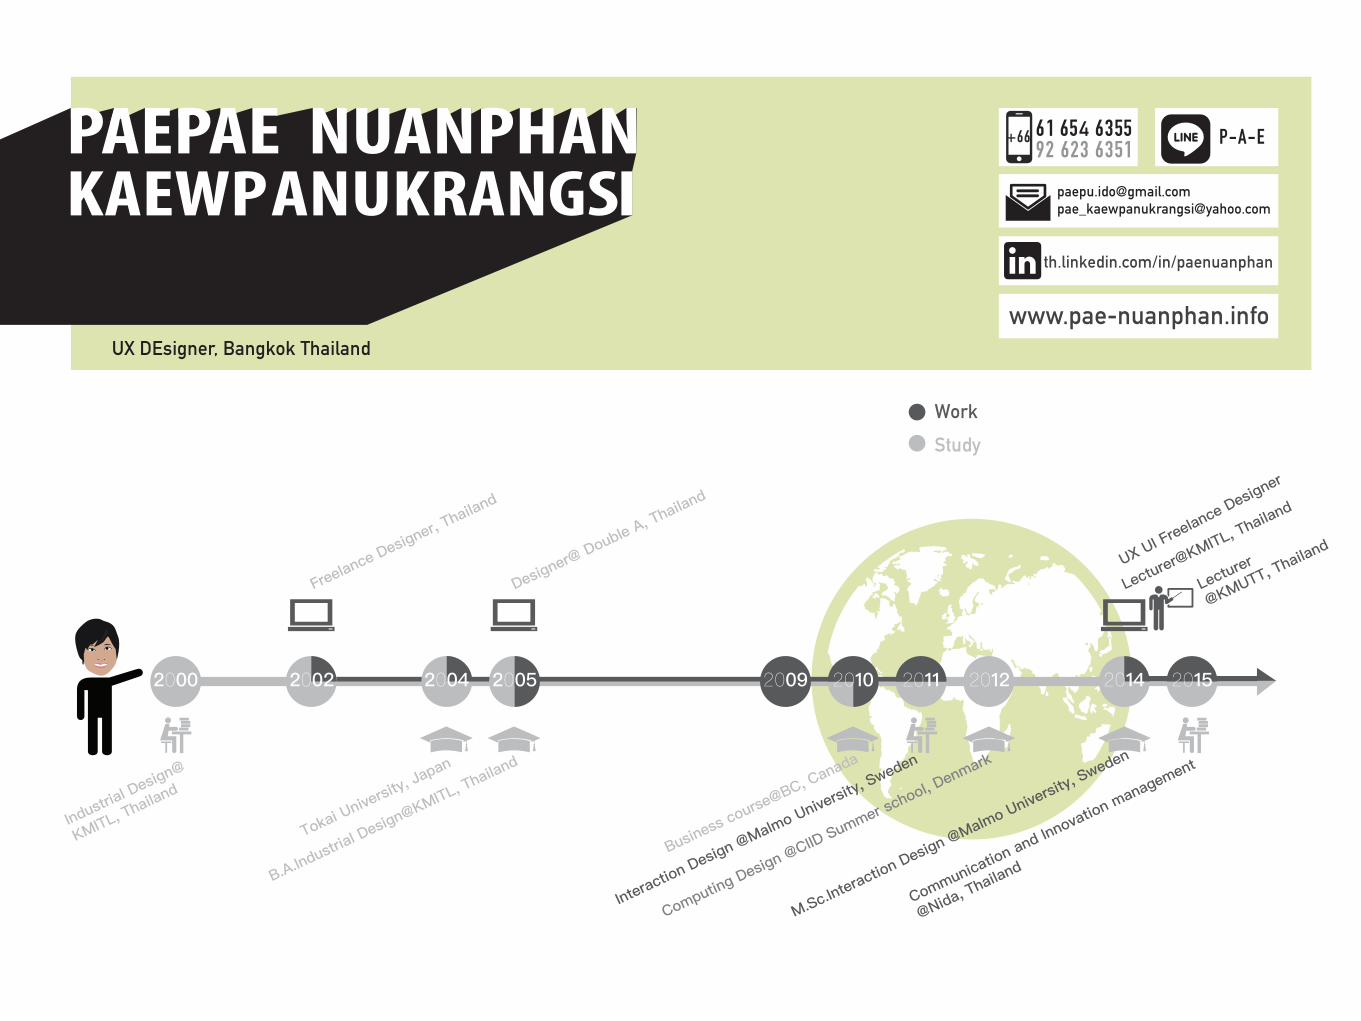
WorkStudy
UX DEsigner, Bangkok Thailand

8.93645%
Chaotic
ကeမ$က%ကမ&ဖစ%eသ$
χαώδης
haotičan
ยุ่งเหยิง2 अव्यविस्थत
00.7
Source : www.google.com
માિહતીмаалымат
!#*?
43
information
données!"#$%&!&'(
fa‘amatalagadhata
aantal
េលខ
χαώδηςnùmeru
េលខ
uimhirကeမ$က%ကမ&ဖစ%eသ$č
0101010101010101010101010
0011101010101010
36Course : Infographic by A’PaePae

Course : Infographic by A’PaePae22 Sep 2016
Infographicinfographic
Learn how to create professional-looking infographic

Course Outline
from the Noun Project
- “What is Infographic?, the important in this era”
- “The elements of infographic and the way of thinking”
- “The process to make infographic publish”
Workshop with Piktochart
Course : Infographic by A’PaePae
22 Sep 2016
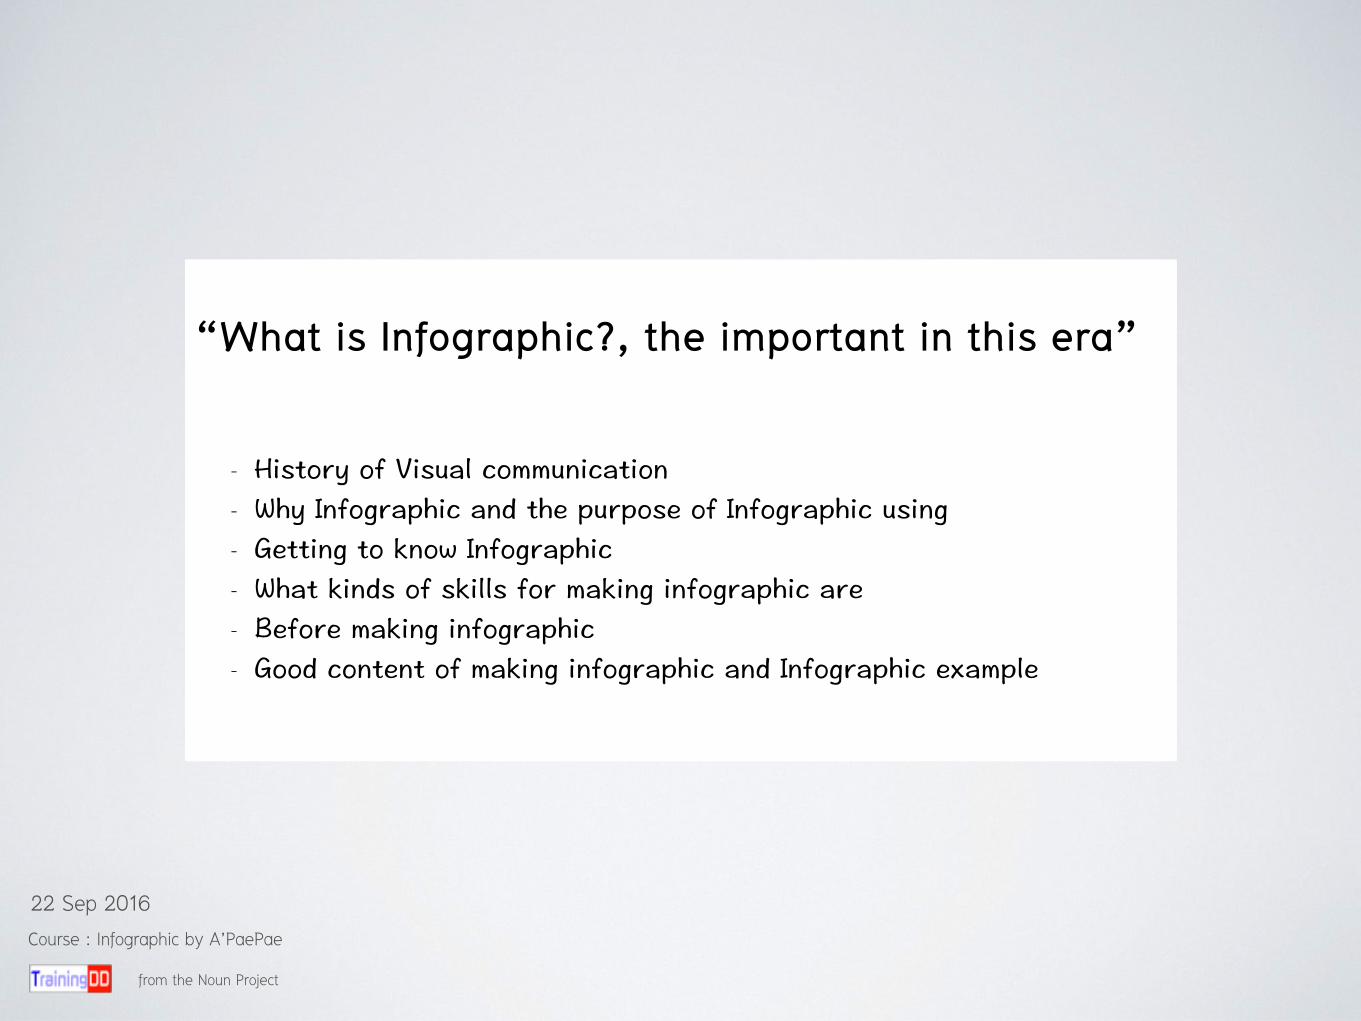
“What is Infographic?, the important in this era”
-
-
-
-
-
-
from the Noun Project
Course : Infographic by A’PaePae
22 Sep 2016
from the Noun Project
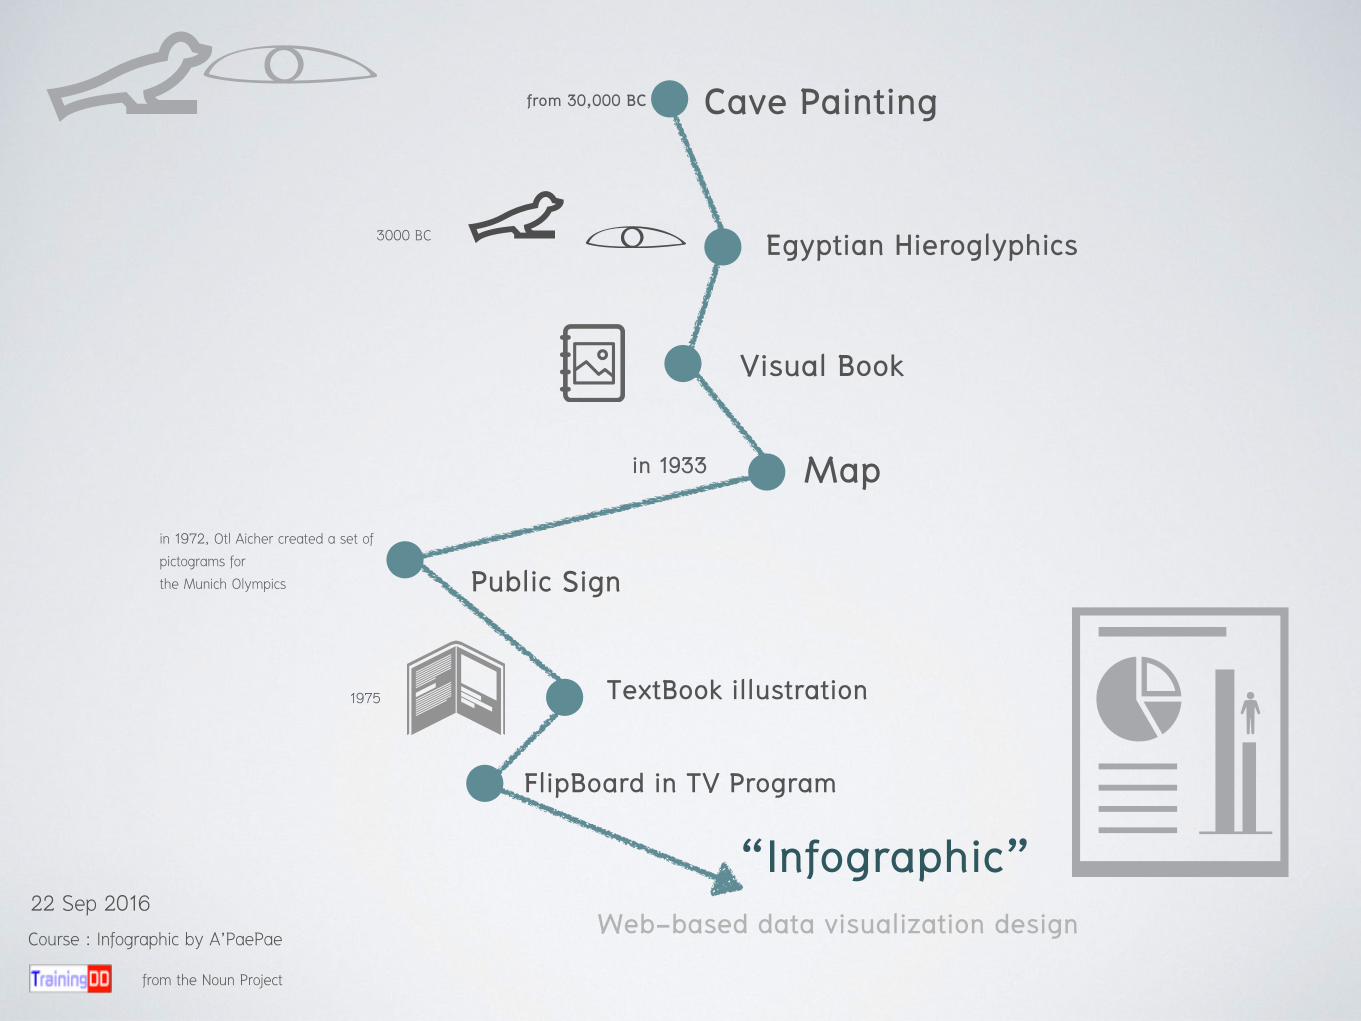
Cave Painting
Egyptian Hieroglyphics
Visual Book
Map
TextBook illustration
from 30,000 BC
3000 BC
in 1933
in 1972, Otl Aicher created a set of pictograms for the Munich Olympics Public Sign
1975
Web-based data visualization design
FlipBoard in TV Program
“Infographic”Course : Infographic by A’PaePae
22 Sep 2016

Why is infographic?-Solving a problem on numerous data or data packed -Solving a problem on data incredibility -Proofing data with evident
- Interesting - Simply Understanding data with in time Constrained - Easily Highlighting the content
- See overall data - Beautiful format of presenting
- Its can build the identity
- Fast wide spreading after its Published - People like to see visual than text ** in 2012 very wide-spreading - bringing information to further use easily - Telling a story easily
from google
Course : Infographic by A’PaePae
22 Sep 2016

Using infographic for?
Internal Communication
Sale man : Presentation
Personal ResumePR
News
Designed by Freepik
Course : Infographic by A’PaePae
22 Sep 2016

WorkStudy
UX DEsigner, Bangkok Thailand
2014-presentContact-Lecturer, UXUI and Interaction Design Class, 3D-Based Communication Design in Architecture Faculty, (KMITL) Bangkok, Thailand. - Designing UXUI for Applications that could be possible in the market. - Designing tools for communicate with developers, engineers and ventures to launch new (digital) products. - User Centric is the main of Design Approach and Personas, Used scenarios, Diagram, Wireframing, UI Design, User experience, Usability testing are included in the main Design process. - Matching human experience into the physical objects to find a new way of interaction and use(User interaction design objects) - Digital and traditional platforms are combined into designing outcomes.
Contact-Lecturer, Visual Design Thinking and Infographic design, State Enterprise Policy Office, SME offices, Bangkok, Thailand. -Each course was designed for specific learner’s targets.
Contact-Lecturer, Exhibition Design Class, Media Arts, (KMUTT:Bangkhunthian) Bangkok,Thailand. - Applying current technology, User experience design and Space requirement into the Exhibition - Using Space to tell story in Exhibition as well as display products UX UI / Interaction freelance designer. (Craft Technology)4G Launch tech ideas for True company (2014-1015, before prices bid), under IPG company - To Show 4G technology that fast, grand, and more easier in daily life experience, Users’friendly. (Find more in Portfolio)
Coca-cola ideas technology for mingle with friends @Siam square, under IPG Company - To Show how people mingle with friends in pubilc space by usingApplication (Find more in Portfolio)
Product and Graphic Freelance supporter Media Design Strategic Planning -Trends@Film2015 -ThaiMedia&CulturalPowertoAsean+3 (2016)
2005-2009Product Designer, Double A Paper and Stationary 2005-2009
ABOUT PAE
Industrial Design field is my ground, but currently my interest is about Interaction Design with focus on User Experience. Using the User Centric approch is one of my expert design methods. I am motivated and passionated designer. I love learning and enjoy teaching as well. Beside being a designer, I am also a contact lecturer in some of universities and organizations in Thailand.
ATTRIBUTES
PROFESSIONAL INTEREST
LIKE
WORK EXPERIENCE
SKILLS
TOOLS
EDUCATION
Keens to learn new things
Flexible
Enjoys Experimentingand trying different approches
Open-mindedCreative
Tales with Humanise
Dedicates
Innovative
Swimming
Biking
Painting
Exploring new Places
Reading Writing
2015- present Studying Ph.D in Communication Arts and Management Innovation, National Institute of Development Administration, Bangkok, Thailand
2011-2013 MS.c in Interaction design, Malmö University, Sweden
2012Certificate of computing design, CiiD summer school, Copenhagen, Denmark
2000-2005 B.A. in Industrial Design, King Mongkut’s Institute of Technology Ladkrabang, Thailand Overall GPA: 3.40
Course : Infographic by A’PaePae
22 Sep 2016
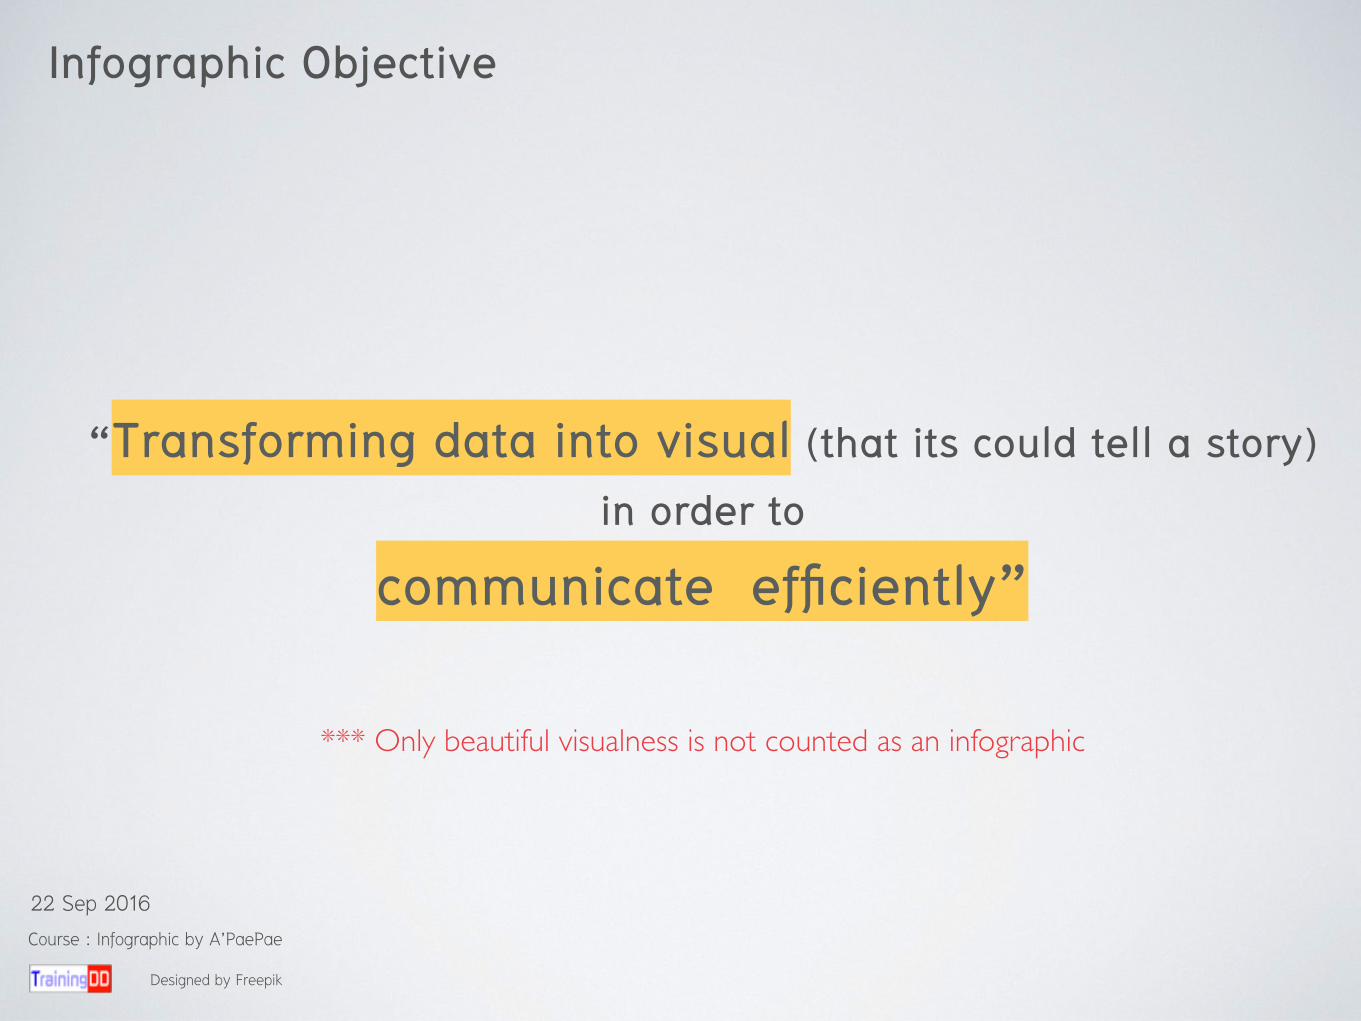
*** Only beautiful visualness is not counted as an infographic
Infographic Objective
“Transforming data into visual (that its could tell a story) in order to
communicate efficiently”
Designed by Freepik
Course : Infographic by A’PaePae
22 Sep 2016
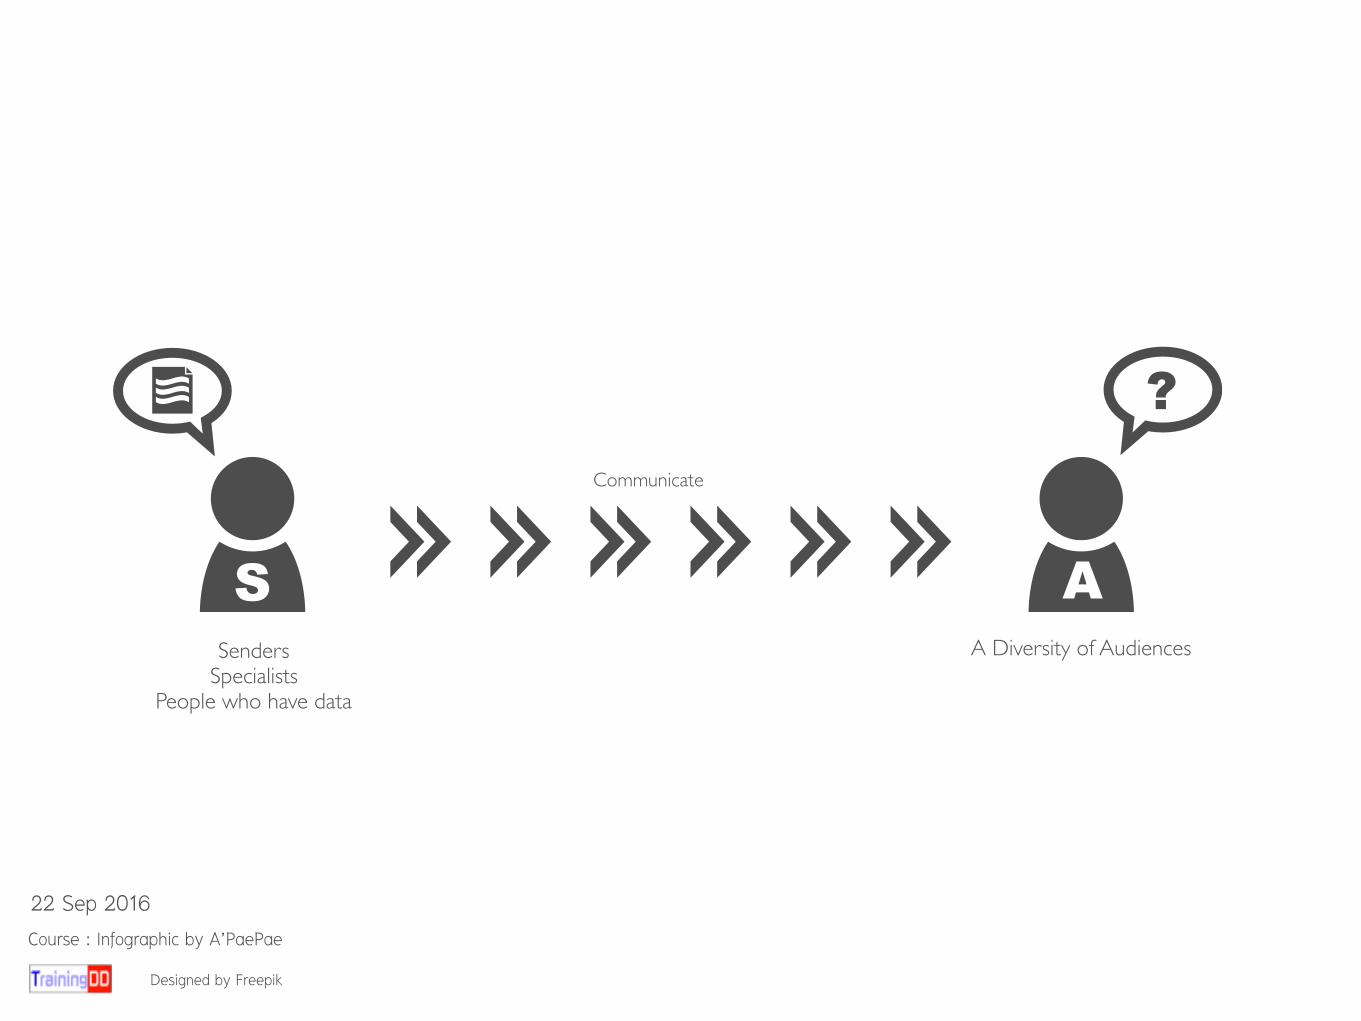
A Diversity of Audiences
Communicate
Senders Specialists
People who have data
Designed by Freepik
Course : Infographic by A’PaePae
22 Sep 2016
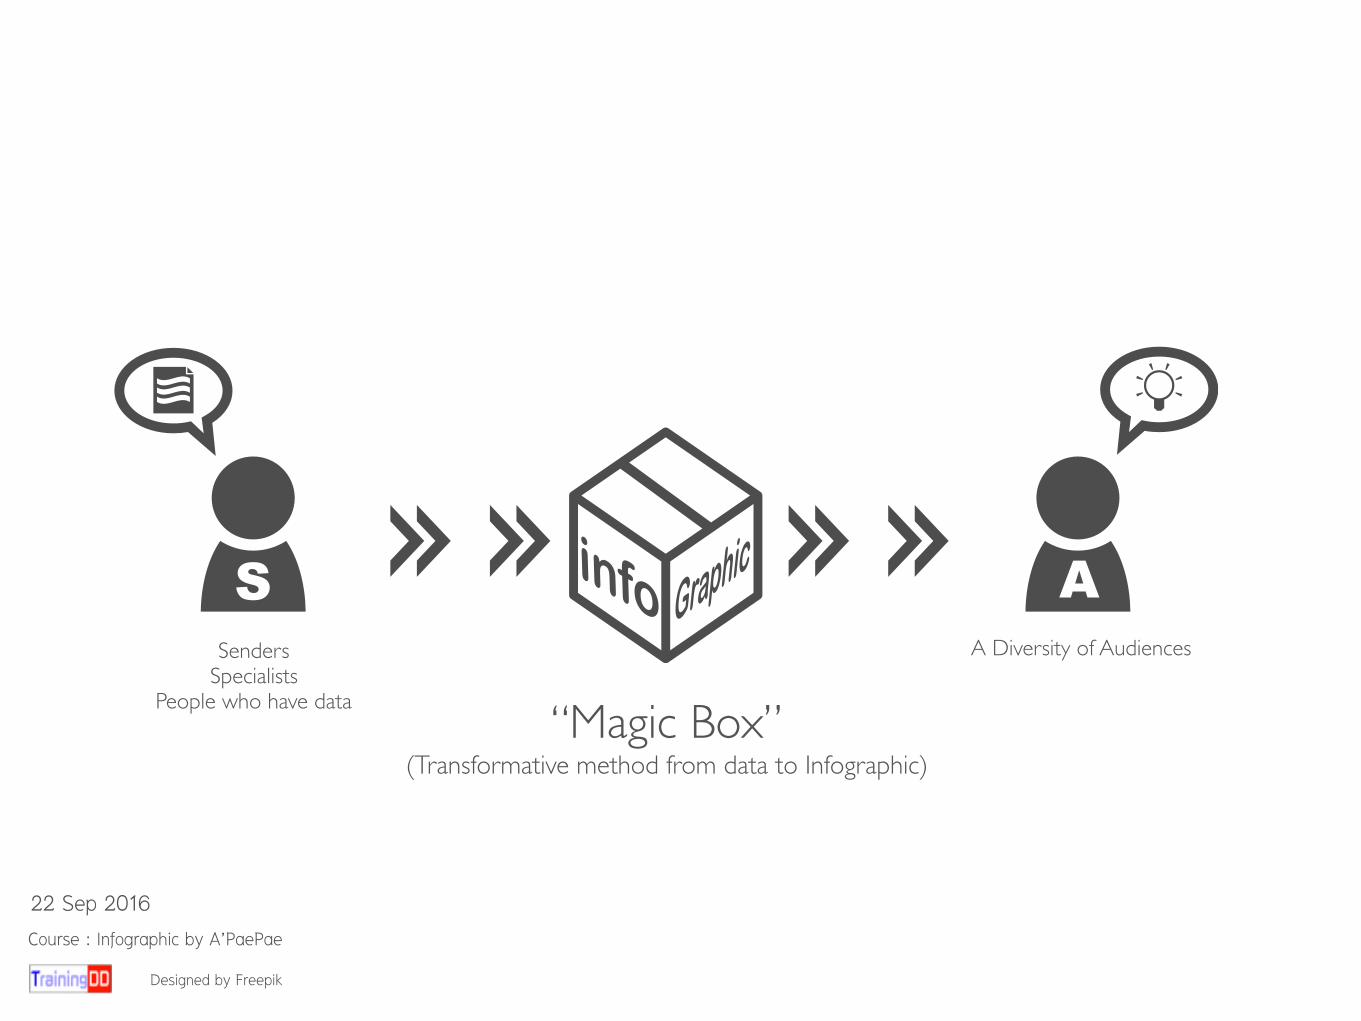
“Magic Box”(Transformative method from data to Infographic)
Designed by Freepik
Course : Infographic by A’PaePae
22 Sep 2016
Senders Specialists
People who have data
A Diversity of Audiences
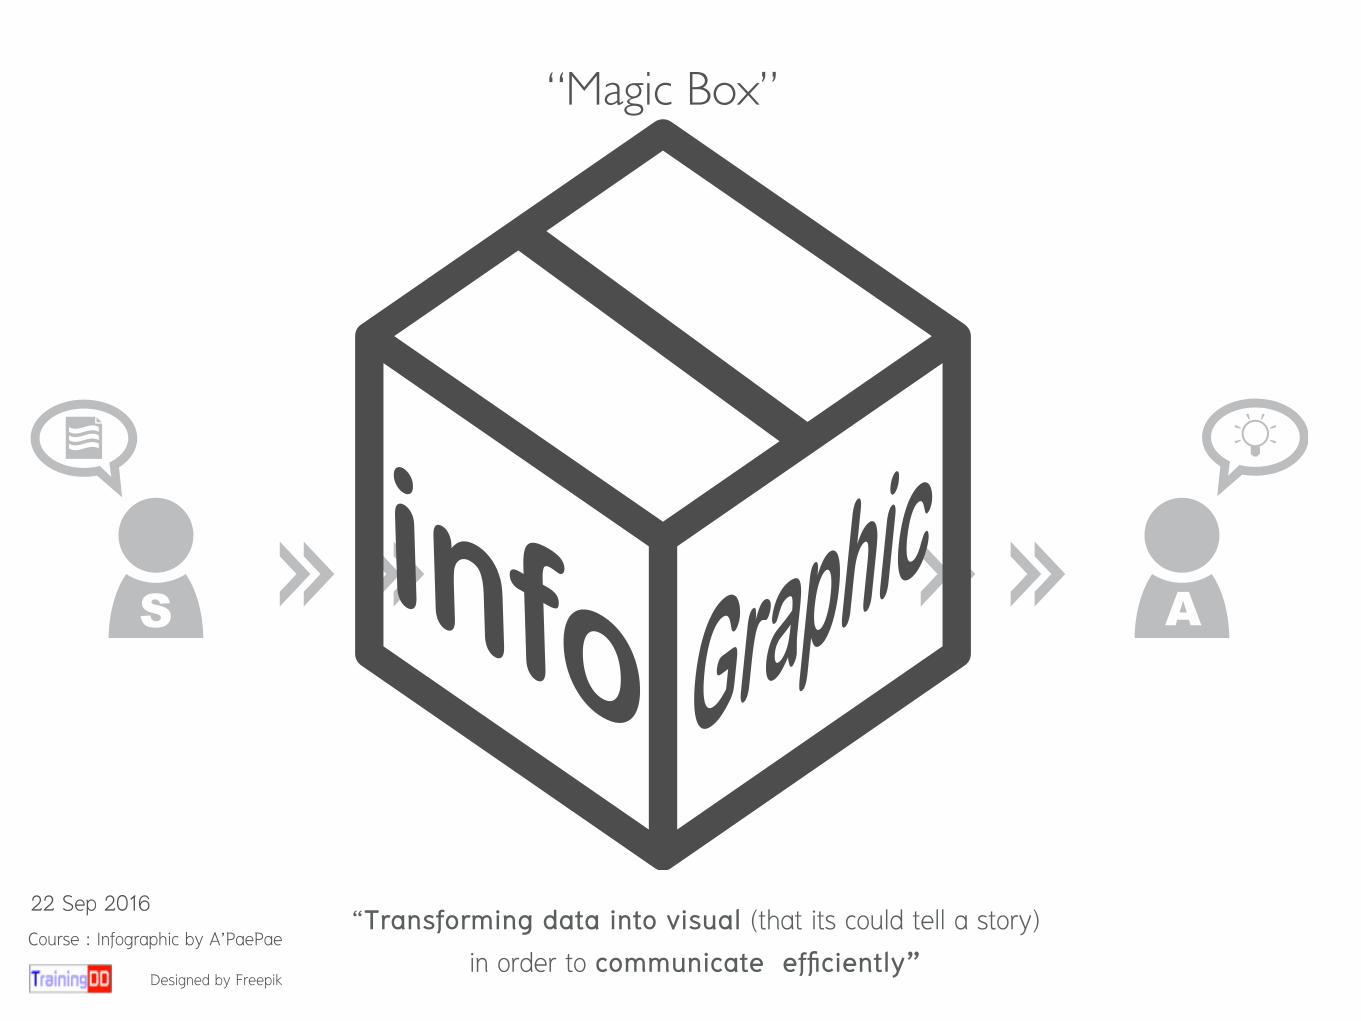
“Magic Box”
Designed by Freepik
Course : Infographic by A’PaePae
22 Sep 2016 “Transforming data into visual (that its could tell a story) in order to communicate efficiently”

What is infographic?
information graphic+ =
Source : Basic Infographic, 2015
Course : Infographic by A’PaePae
22 Sep 2016
Unfold the Magic Box
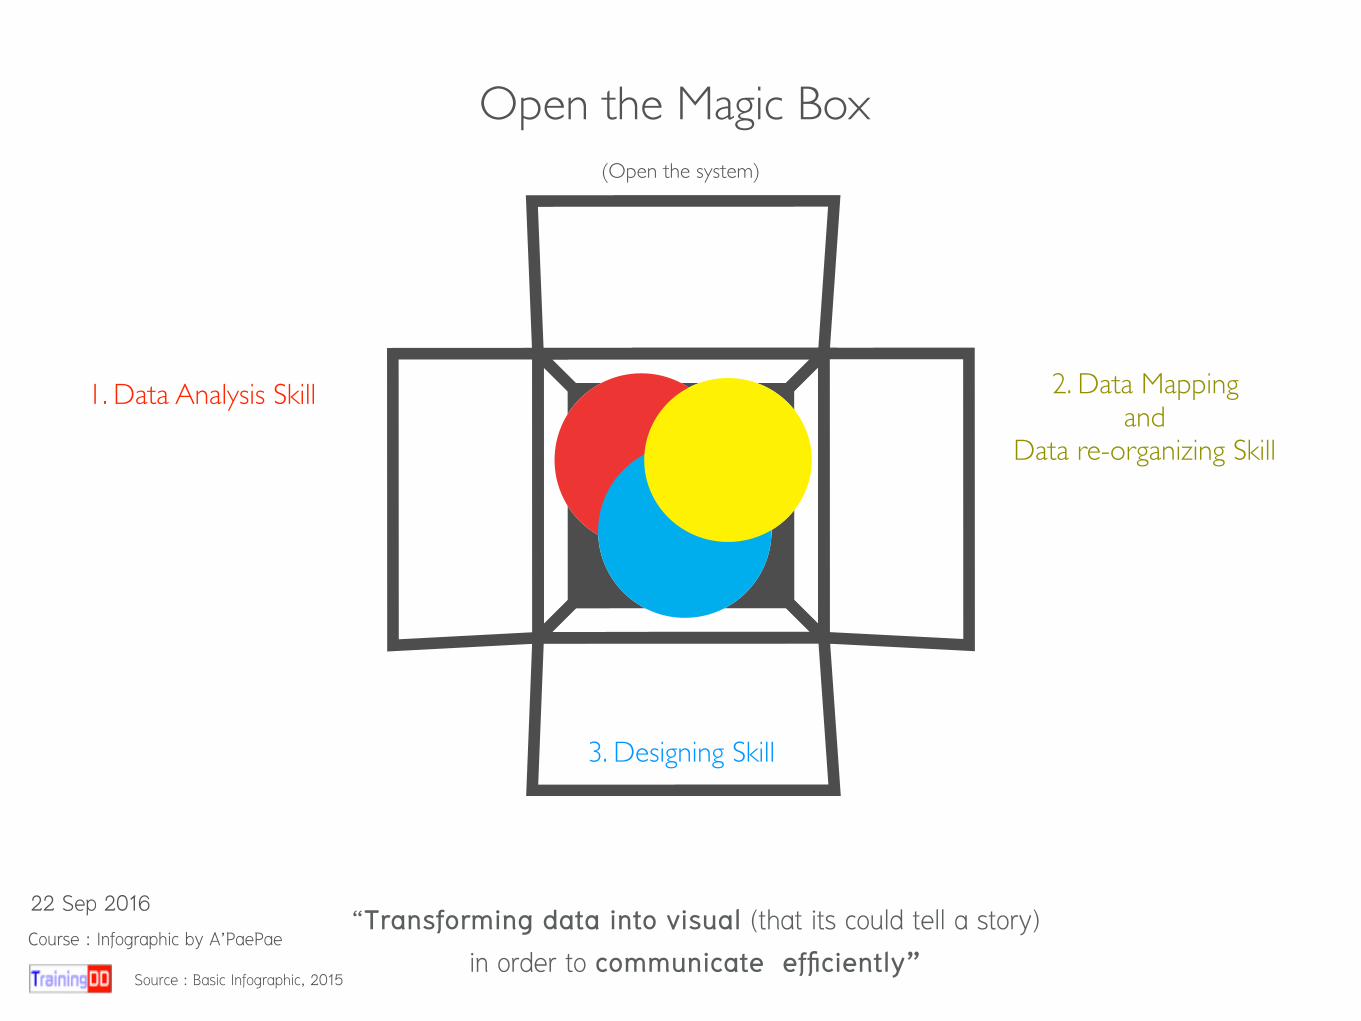
3. Designing Skill
1. Data Analysis Skill
Open the Magic Box
2. Data Mapping and
Data re-organizing Skill
(Open the system)
“Transforming data into visual (that its could tell a story) in order to communicate efficiently”
Source : Basic Infographic, 2015
Course : Infographic by A’PaePae
22 Sep 2016

What a good Infographic look like
#mind
#behaviour
#not complicated
#attractive
#Simply Understanding
#Interesting
#eye-catching
#Click Save
#Useful Content
Source : Basic Infographic, 2015
Course : Infographic by A’PaePae
22 Sep 2016
#Share
Before making an infographic You should answer…the following questions
Source : Basic Infographic, 2015
Course : Infographic by A’PaePae
22 Sep 2016
1. Objective of making infographic & The expectation
Source : Basic Infographic, 2015
Course : Infographic by A’PaePae
22 Sep 2016
2. Target Audiences who will receive the infographic
Source : Basic Infographic, 2015
Course : Infographic by A’PaePae
22 Sep 2016

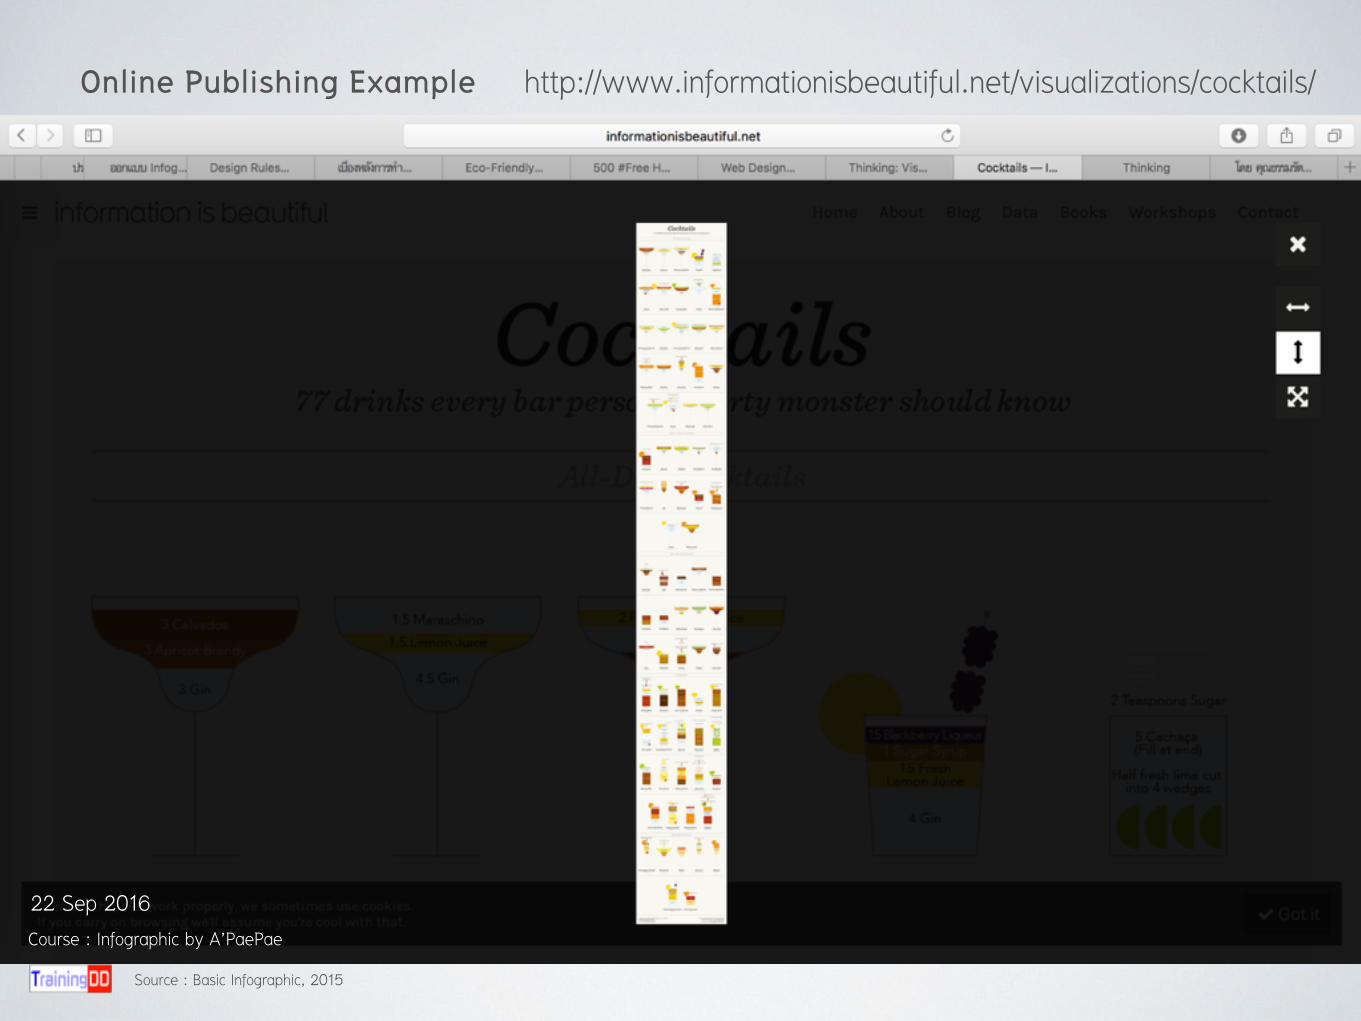
3. What kinds of media (Online / Printed)
Source : Basic Infographic, 2015
Course : Infographic by A’PaePae
22 Sep 2016

http://www.informationisbeautiful.net/visualizations/cocktails/Online Publishing Example
Source : Basic Infographic, 2015
Course : Infographic by A’PaePae
22 Sep 2016
Source : Basic Infographic, 2015
Course : Infographic by A’PaePae
22 Sep 2016
http://www.informationisbeautiful.net/visualizations/cocktails/Online Publishing Example

4. Publishing Time Checking
Source : Basic Infographic, 2015
Course : Infographic by A’PaePae
22 Sep 2016

5. Budget of making infographic (personal / organisation)
Source : Basic Infographic, 2015
Course : Infographic by A’PaePae
22 Sep 2016
6. Headline of the infographic (brainstorming)
Source : Basic Infographic, 2015
Course : Infographic by A’PaePae
22 Sep 2016

7. Source of data (if you hire a designer or an agency you should provide data from reliable source )
Source : Basic Infographic, 2015
Course : Infographic by A’PaePae
22 Sep 2016

8.Be Cautious!!! if its necessary to have an organisation Icon or Logo
Source : Basic Infographic, 2015
Course : Infographic by A’PaePae
22 Sep 2016

9. Reference of infographic style Reference of a design direction
(Color sampling, design elements, etc)www.pinterest.com
www.visual.ly www.google.com
http://www.informationisbeautiful.net
www.infographicthailand.in.th http://www.creativemove.com http://www.thaihealth.or.th
Source : Basic Infographic, 2015
Course : Infographic by A’PaePae
22 Sep 2016

10. Others
Source : Basic Infographic, 2015
Course : Infographic by A’PaePae
22 Sep 2016

Course : Infographic by A’PaePae
22 Sep 2016
Design by Pae
10Shouldn’t miss

What kinds of contents are suitable for making an infographic.
Source : Basic Infographic, 2015
Course : Infographic by A’PaePae
22 Sep 2016

www.pinterest.com
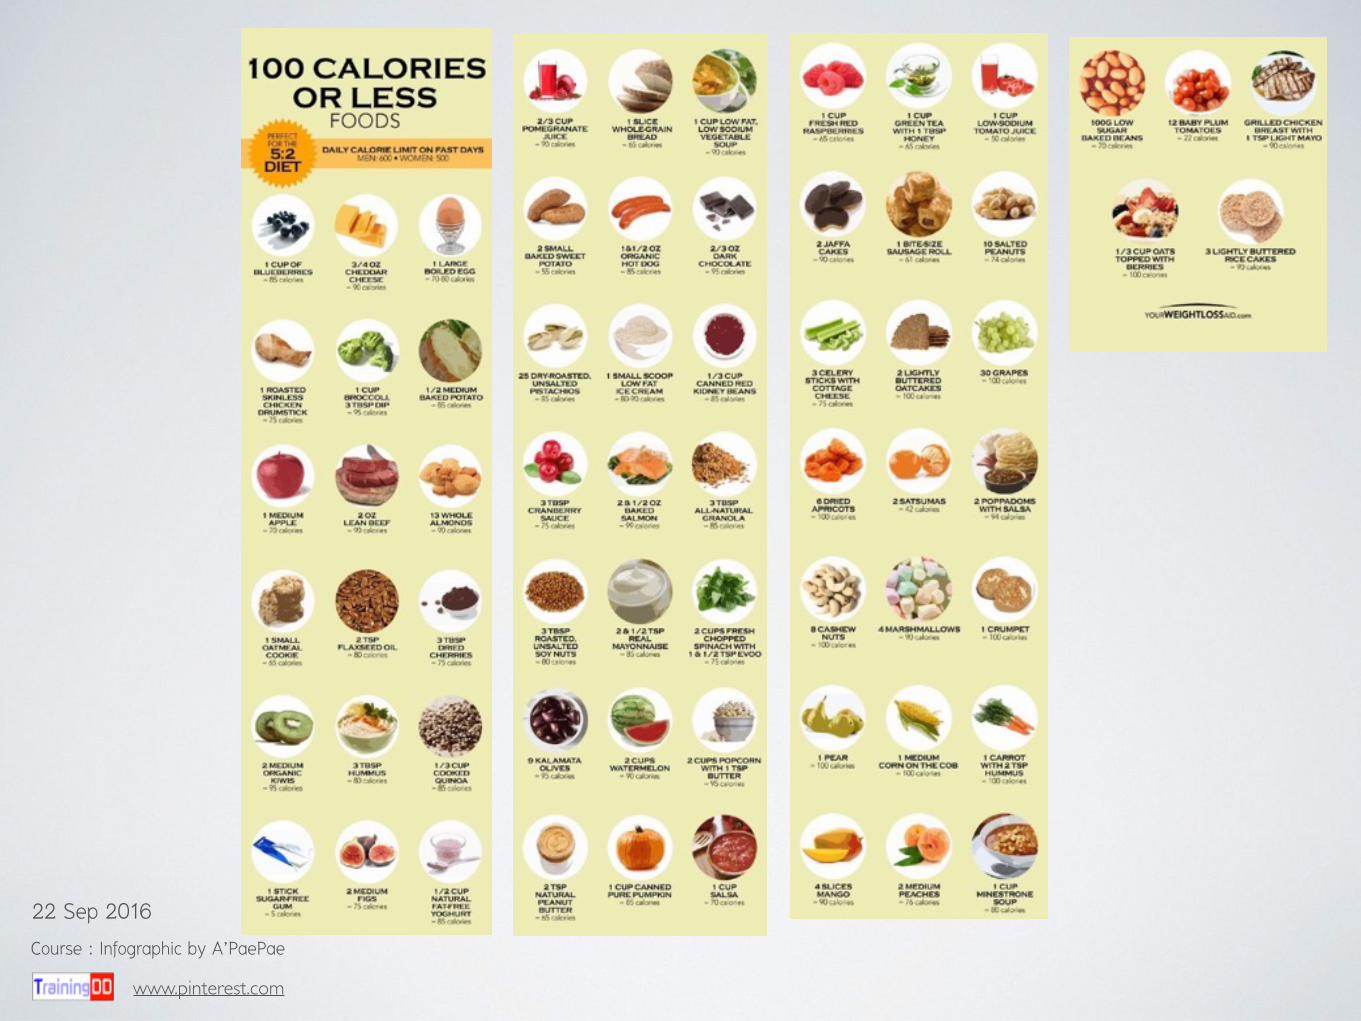
• The popular content that people pay attention on
Course : Infographic by A’PaePae
22 Sep 2016
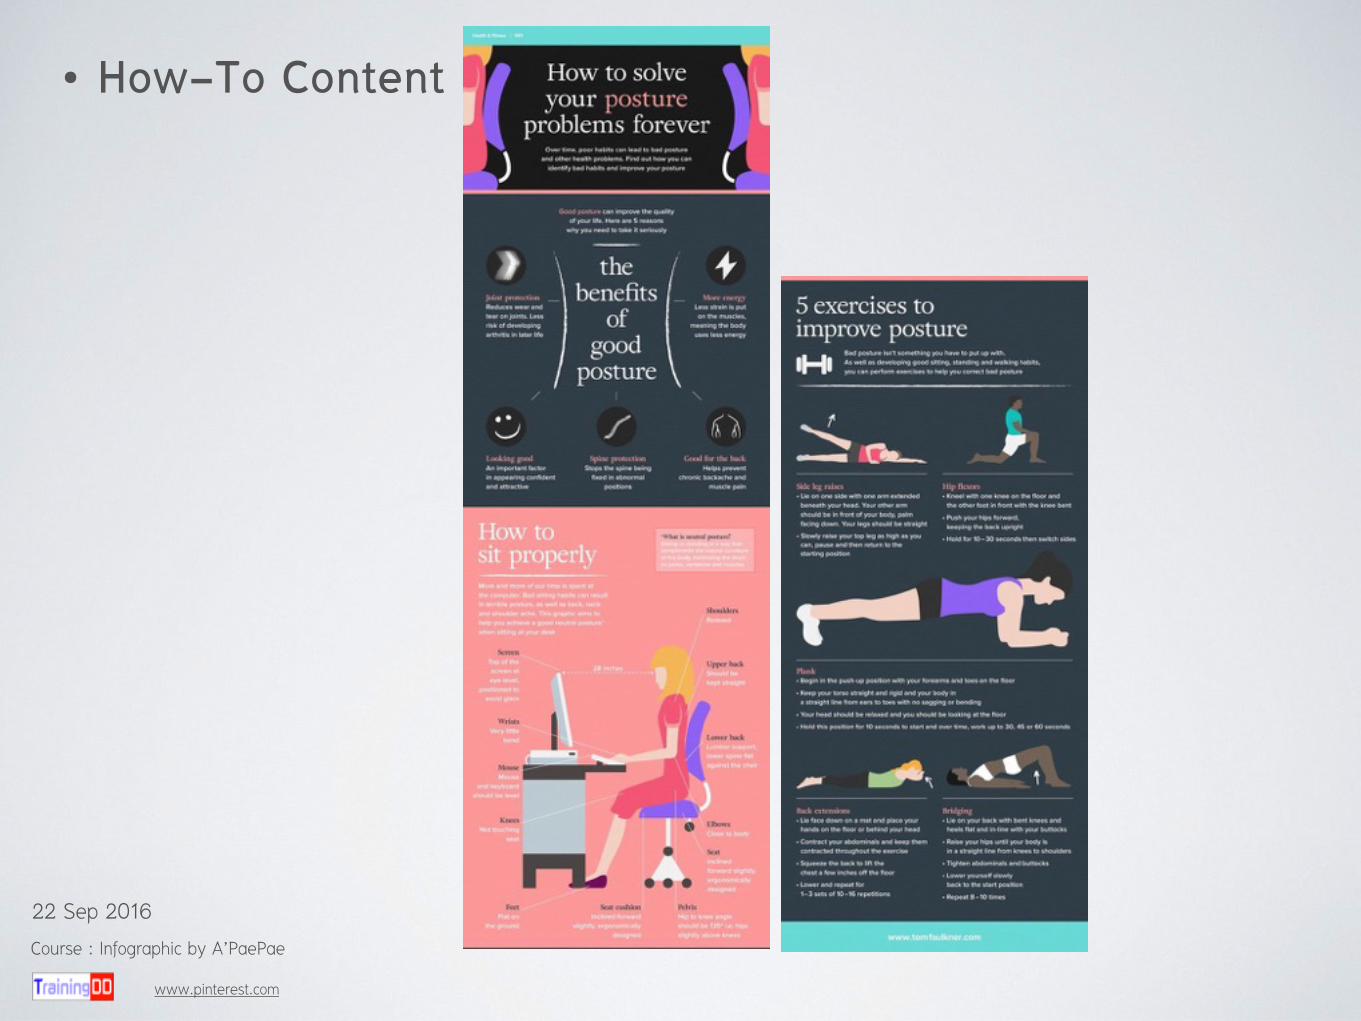
• How-To Content
www.pinterest.com
Course : Infographic by A’PaePae
22 Sep 2016

• Comparing content (VS)
www.infographicthailand.com www.pinterest.com
Course : Infographic by A’PaePae
22 Sep 2016

from Mashable , Pinterest , visual.ly
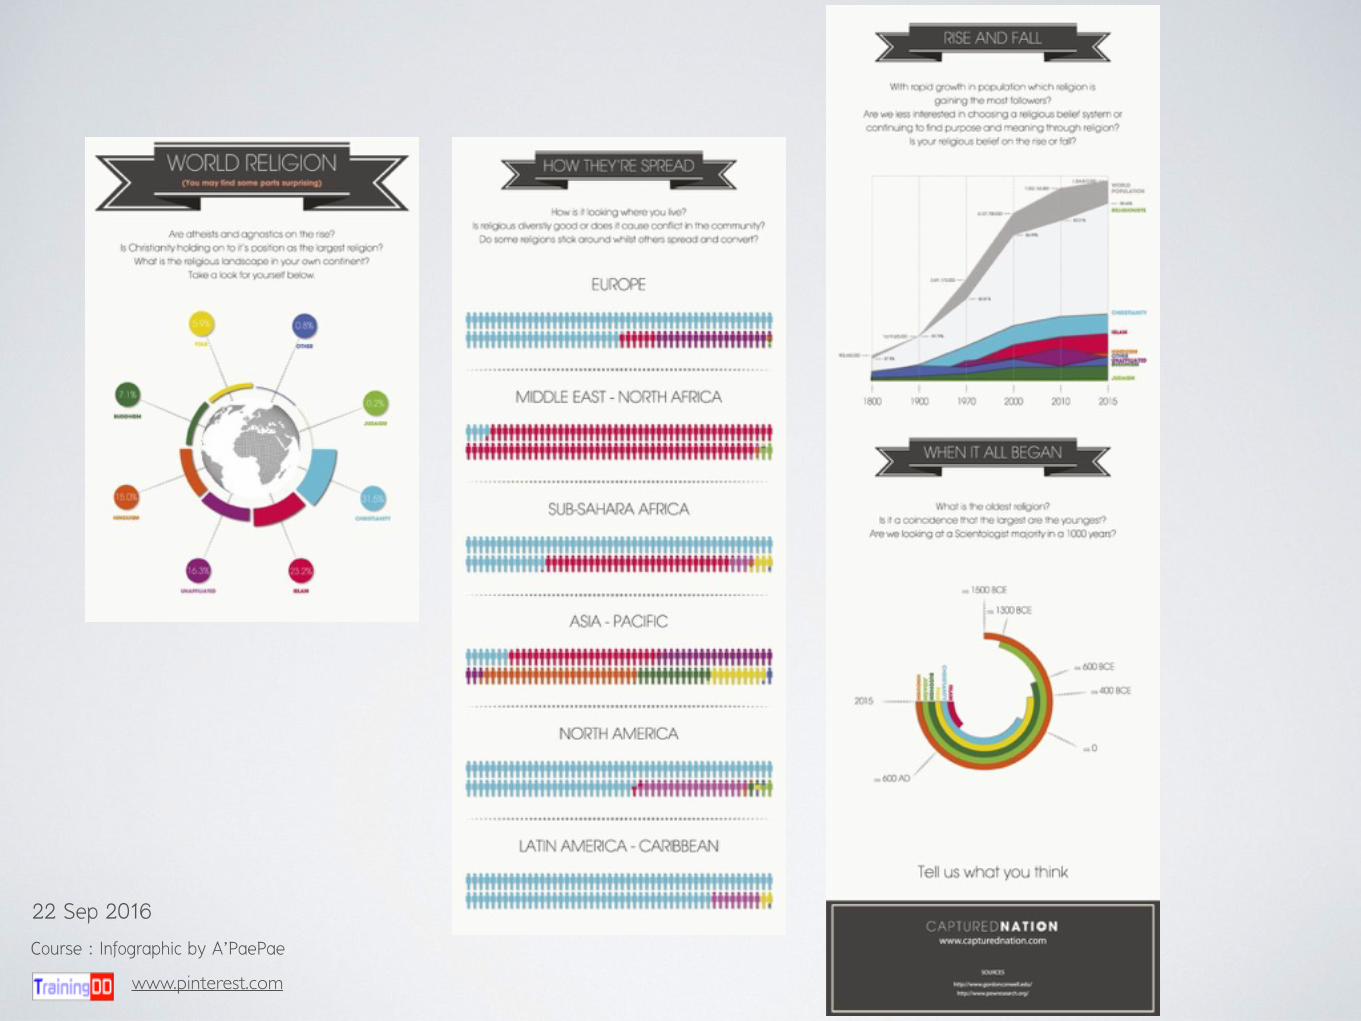
• Content about Timeline/ History of
the Evolution of
(importance thing is about prioritising/arranging data …Left-Right, Above-Below)
Course : Infographic by A’PaePae
22 Sep 2016

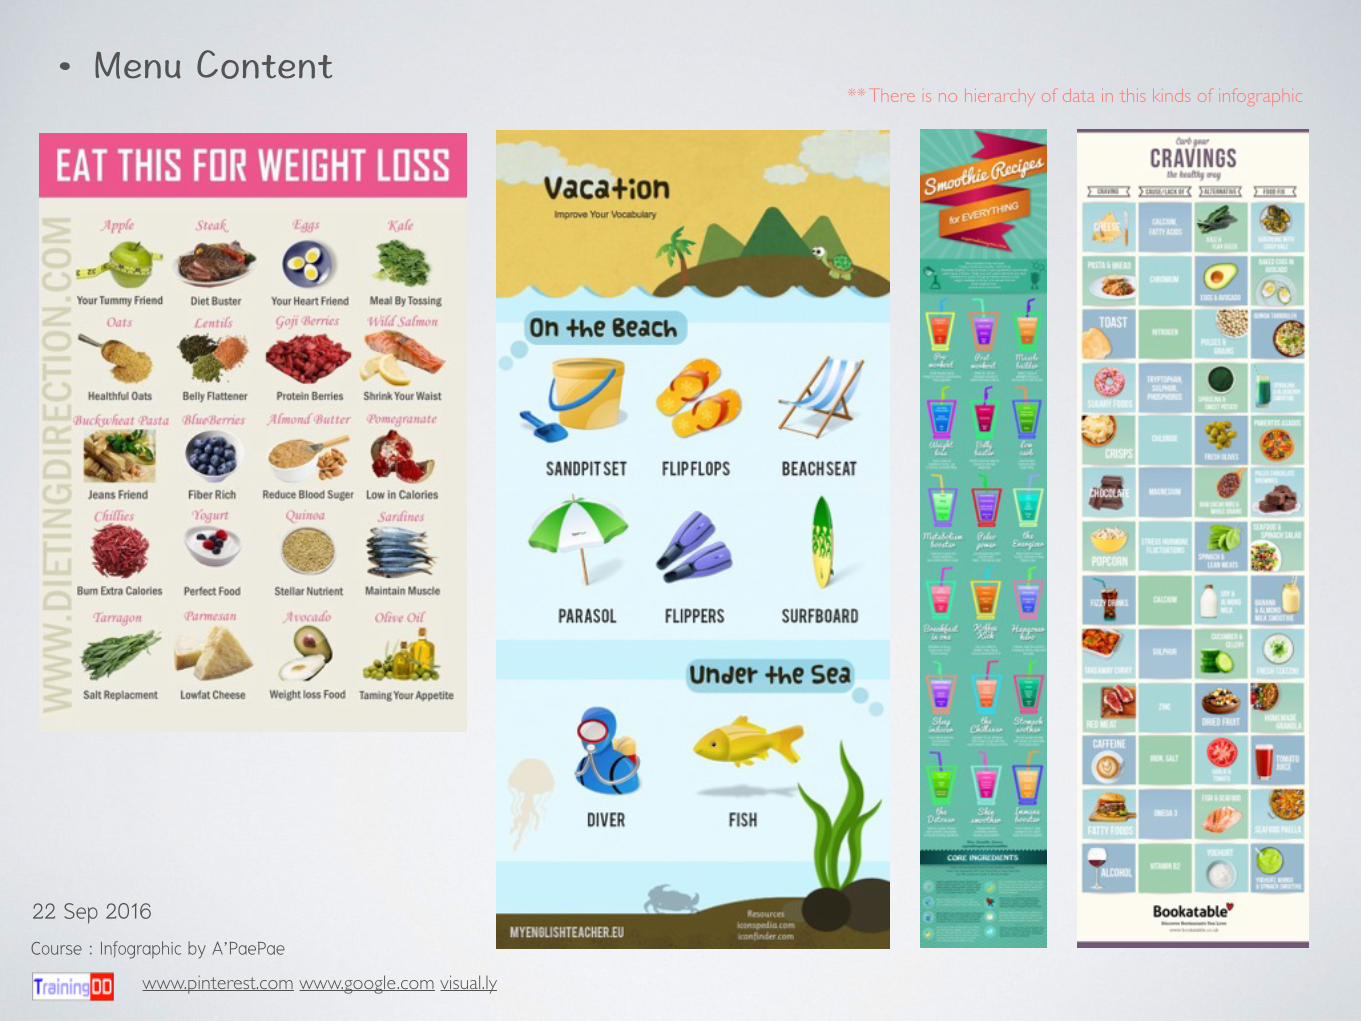
www.pinterest.com www.google.com visual.ly
** There is no hierarchy of data in this kinds of infographic
Course : Infographic by A’PaePae
22 Sep 2016
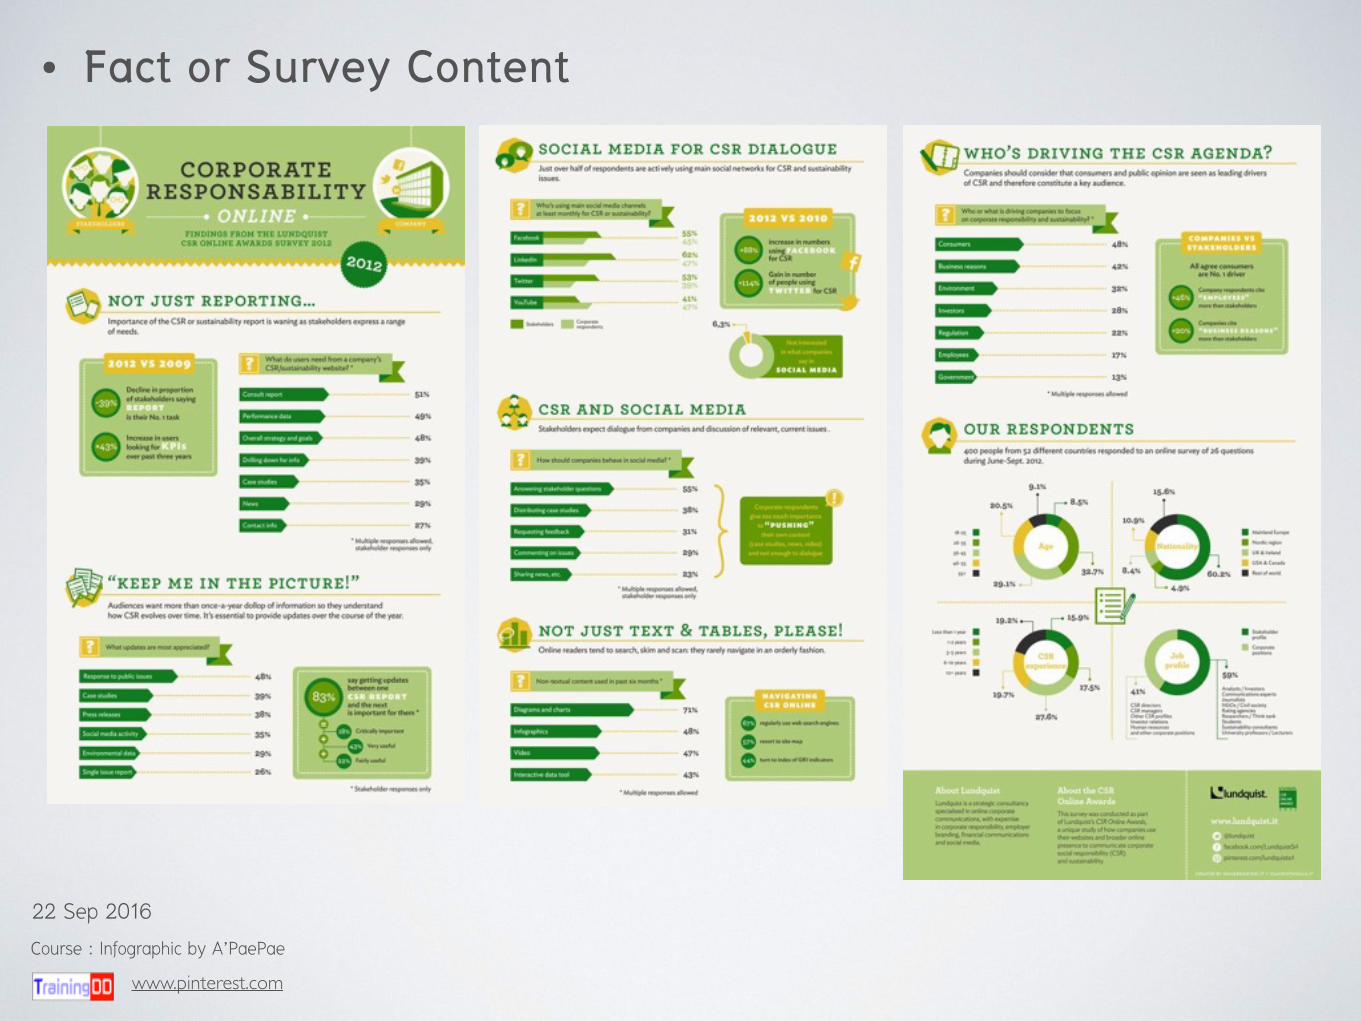
• Fact or Survey Content
www.pinterest.com
Course : Infographic by A’PaePae
22 Sep 2016
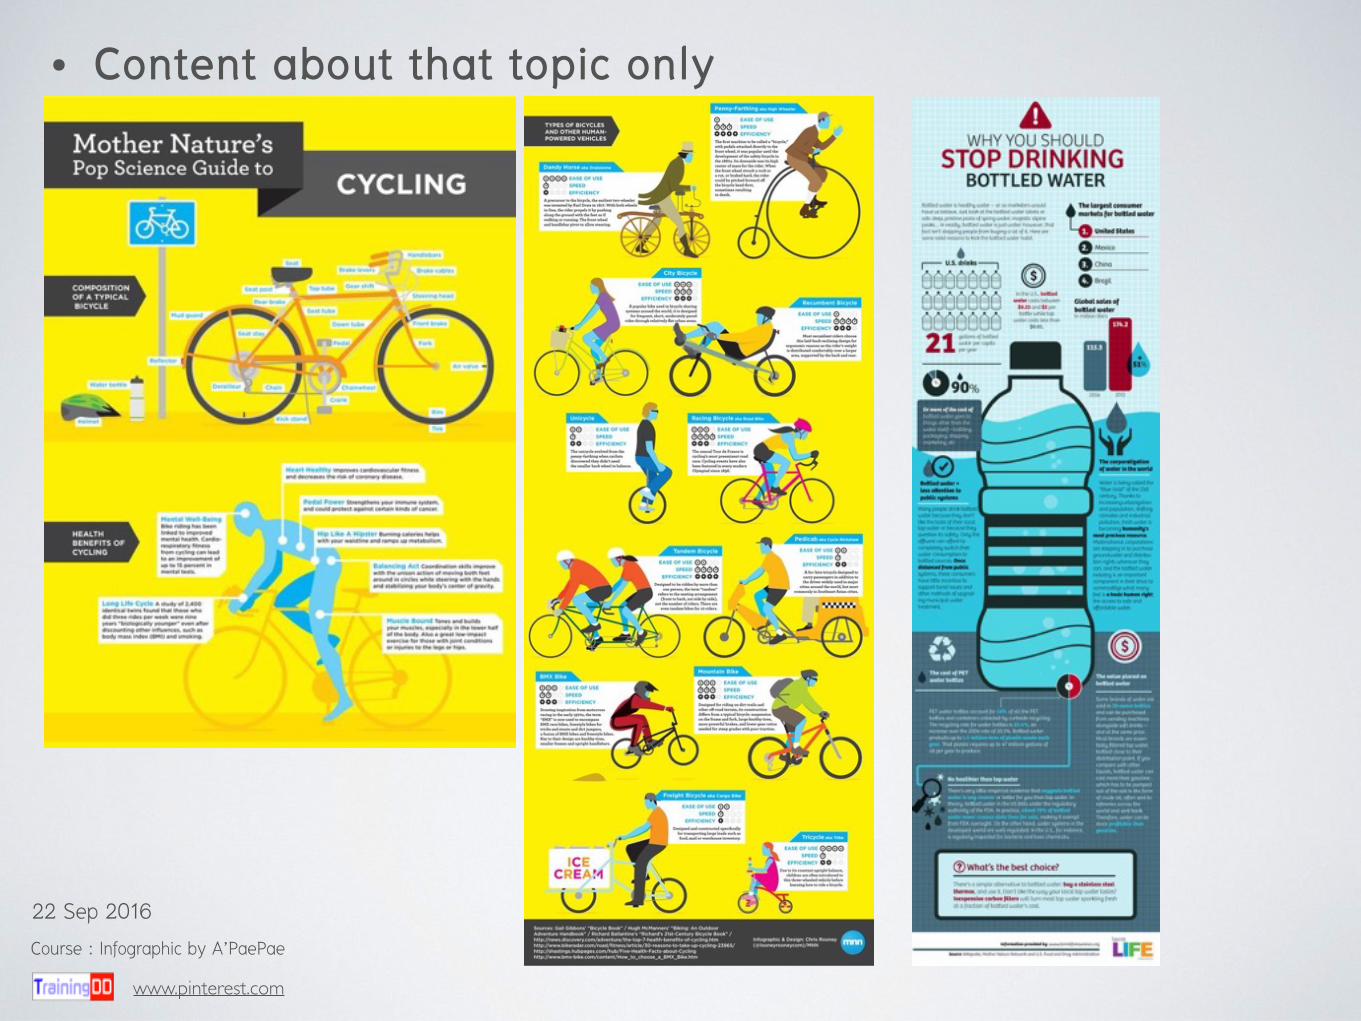
• Content about that topic only
www.pinterest.com
Course : Infographic by A’PaePae
22 Sep 2016

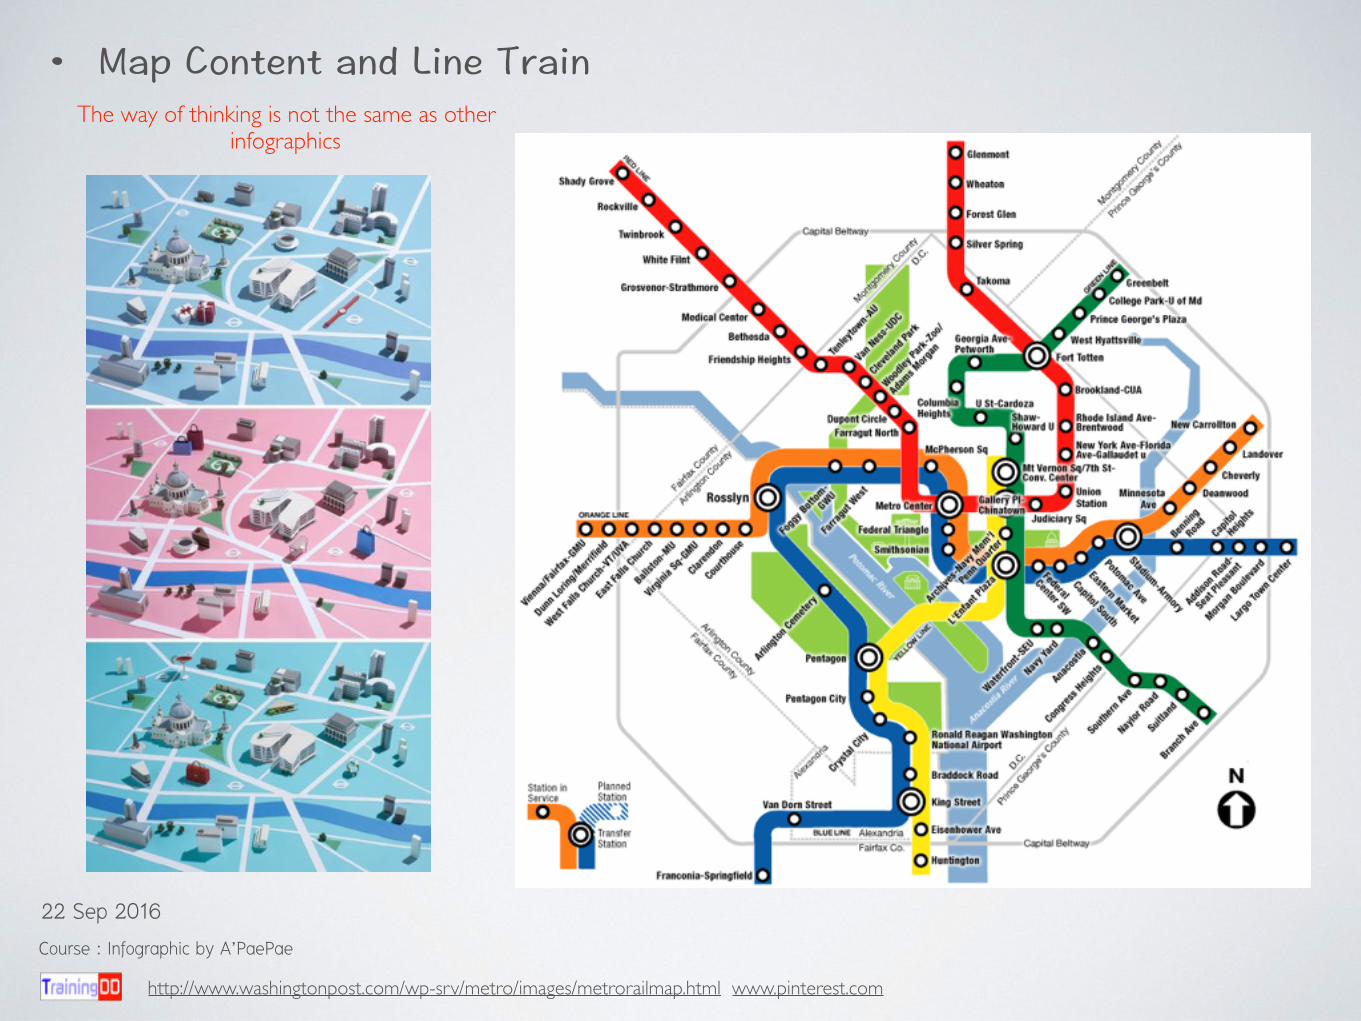
http://www.washingtonpost.com/wp-srv/metro/images/metrorailmap.html www.pinterest.com
The way of thinking is not the same as other infographics
Course : Infographic by A’PaePae
22 Sep 2016
-
-
-
-
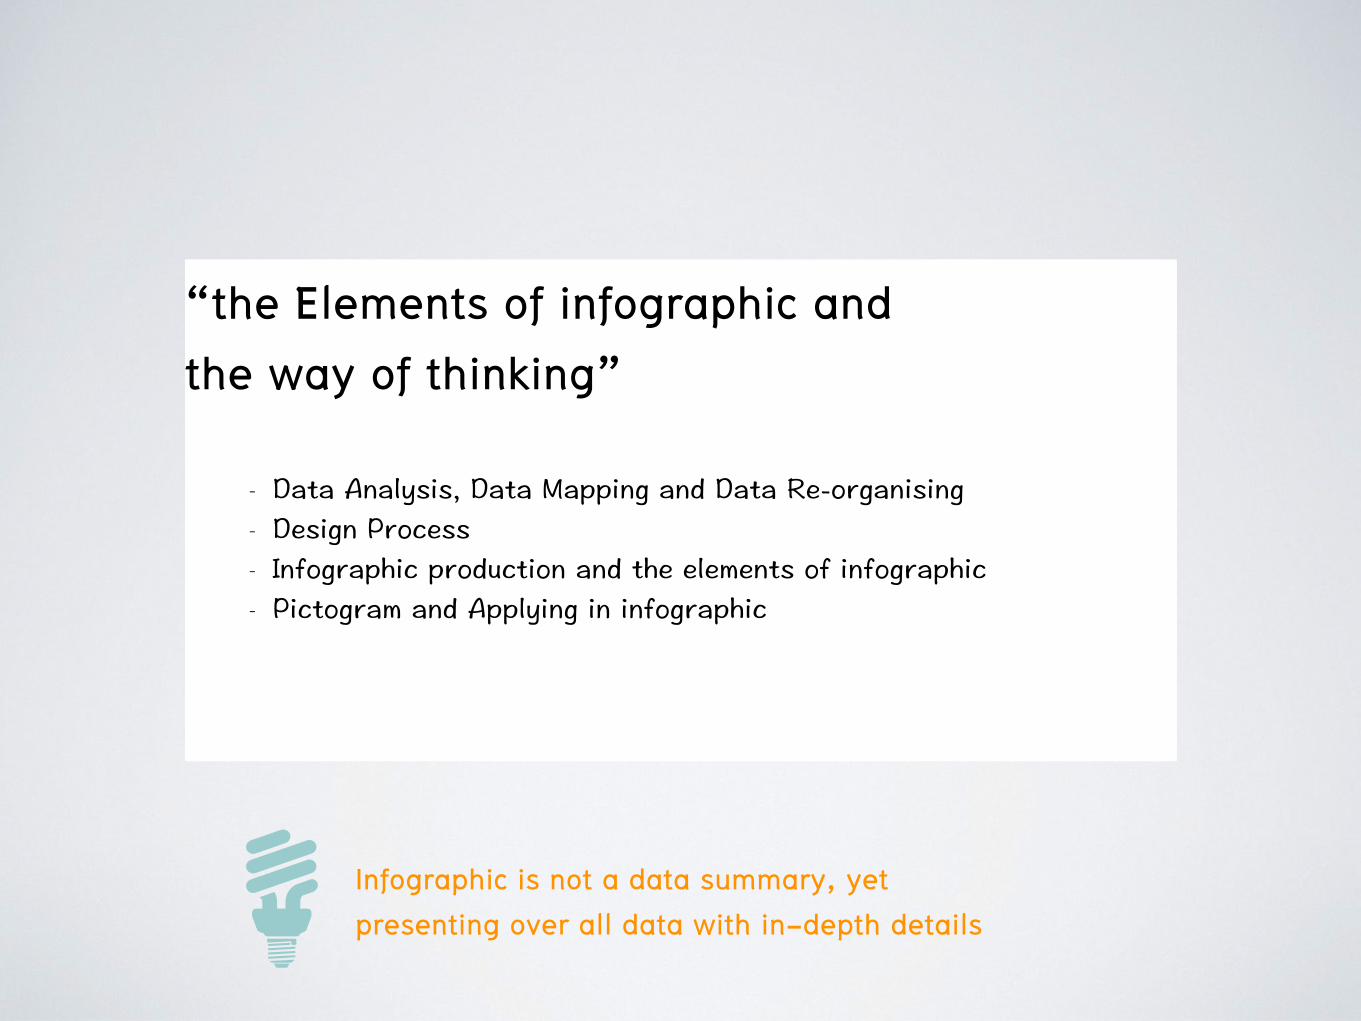
“the Elements of infographic and the way of thinking”
Infographic is not a data summary, yet presenting over all data with in-depth details

3. Designing Skill
1. Data Analysis Skill
Open the Magic Box
2. Data Mapping and
Data re-organizing Skill
(Open the system)
“Transforming data into visual (that its could tell a story) in order to communicate efficiently”
Source : Basic Infographic, 2015
Course : Infographic by A’PaePae
22 Sep 2016
- การวิเคราะห์ข้อมูล จับกลุ่มข้อมูลเพื่อเรียบเรียงใหม่ และการออกแบบ - กระบวนการผลิตinfographic และ องค์ประกอบบนภาพ infographic
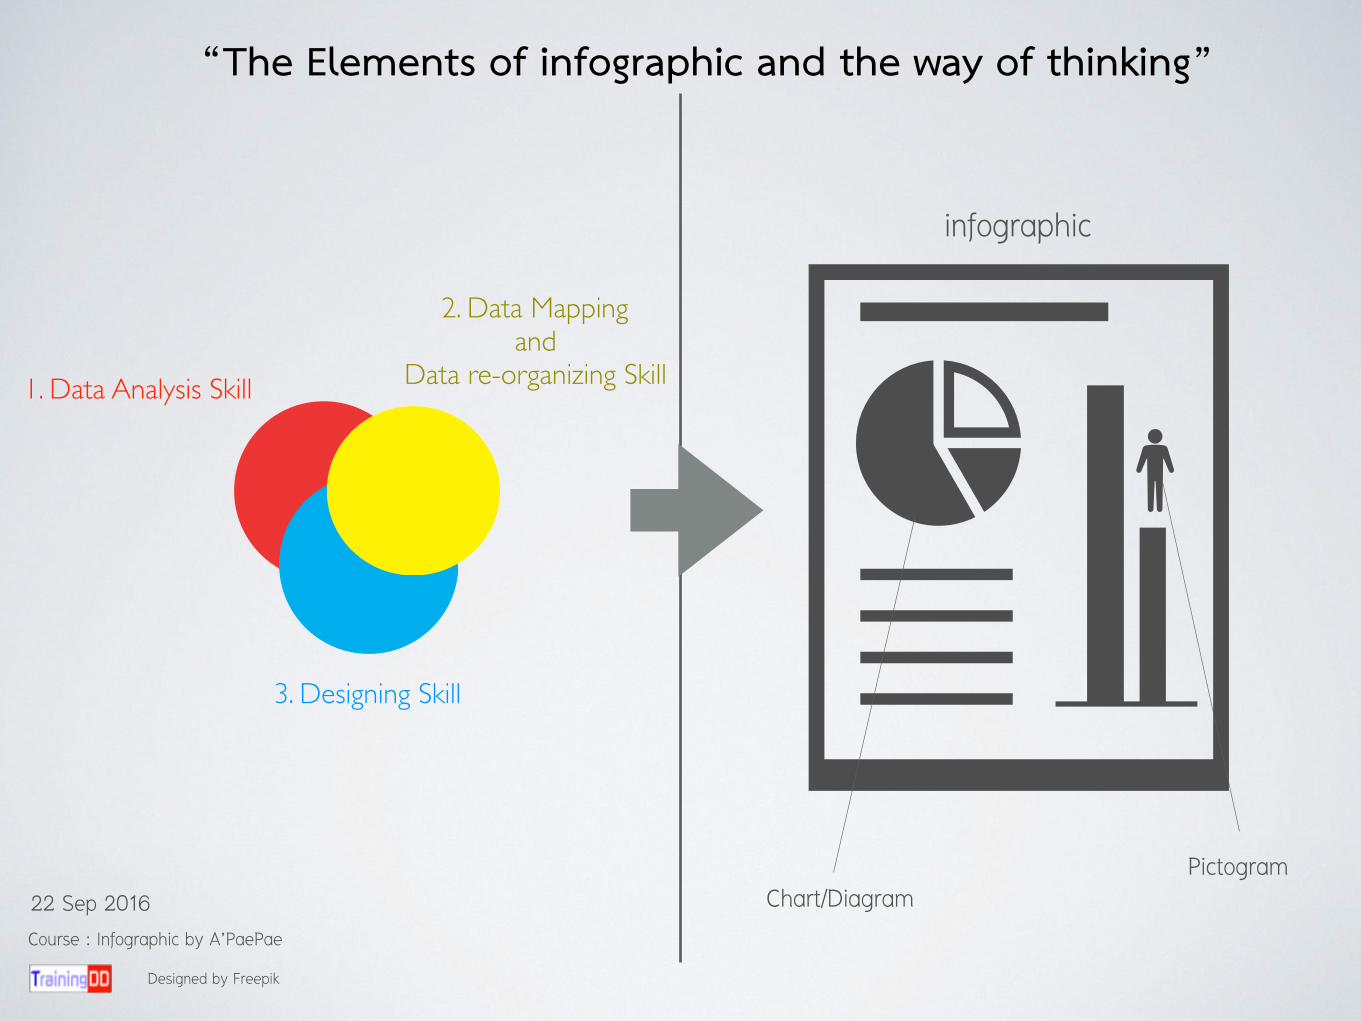
“The Elements of infographic and the way of thinking”
infographic
Pictogram Chart/Diagram
Designed by Freepik
3. Designing Skill
1. Data Analysis Skill
2. Data Mapping and
Data re-organizing Skill
Course : Infographic by A’PaePae
22 Sep 2016
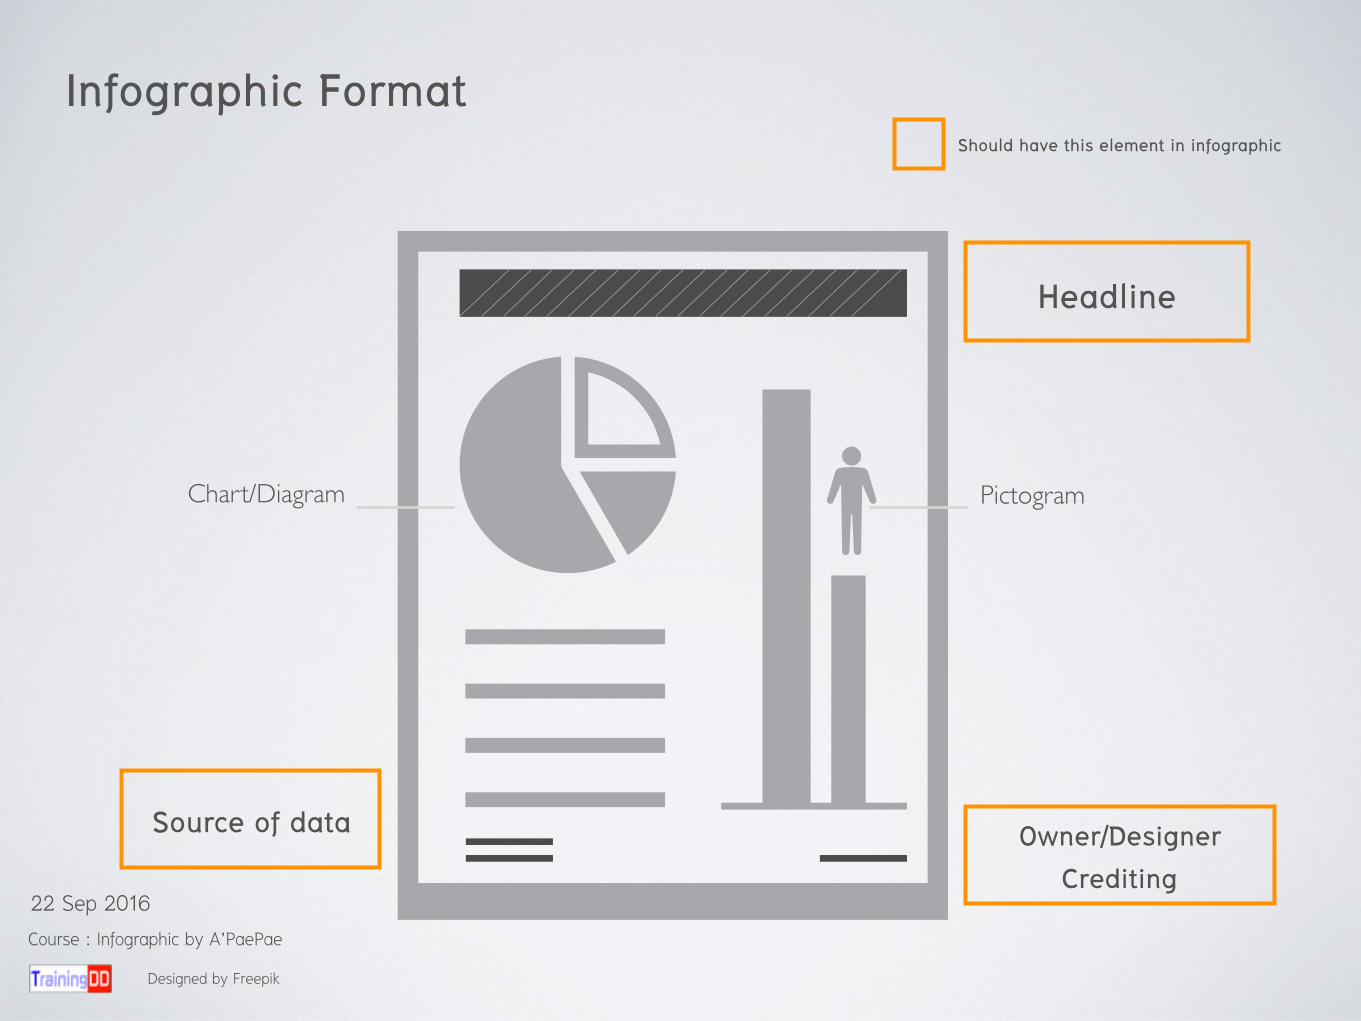
Infographic Format
Headline
Owner/Designer Crediting
Source of data
PictogramChart/Diagram
Should have this element in infographic
Designed by Freepik
Course : Infographic by A’PaePae
22 Sep 2016
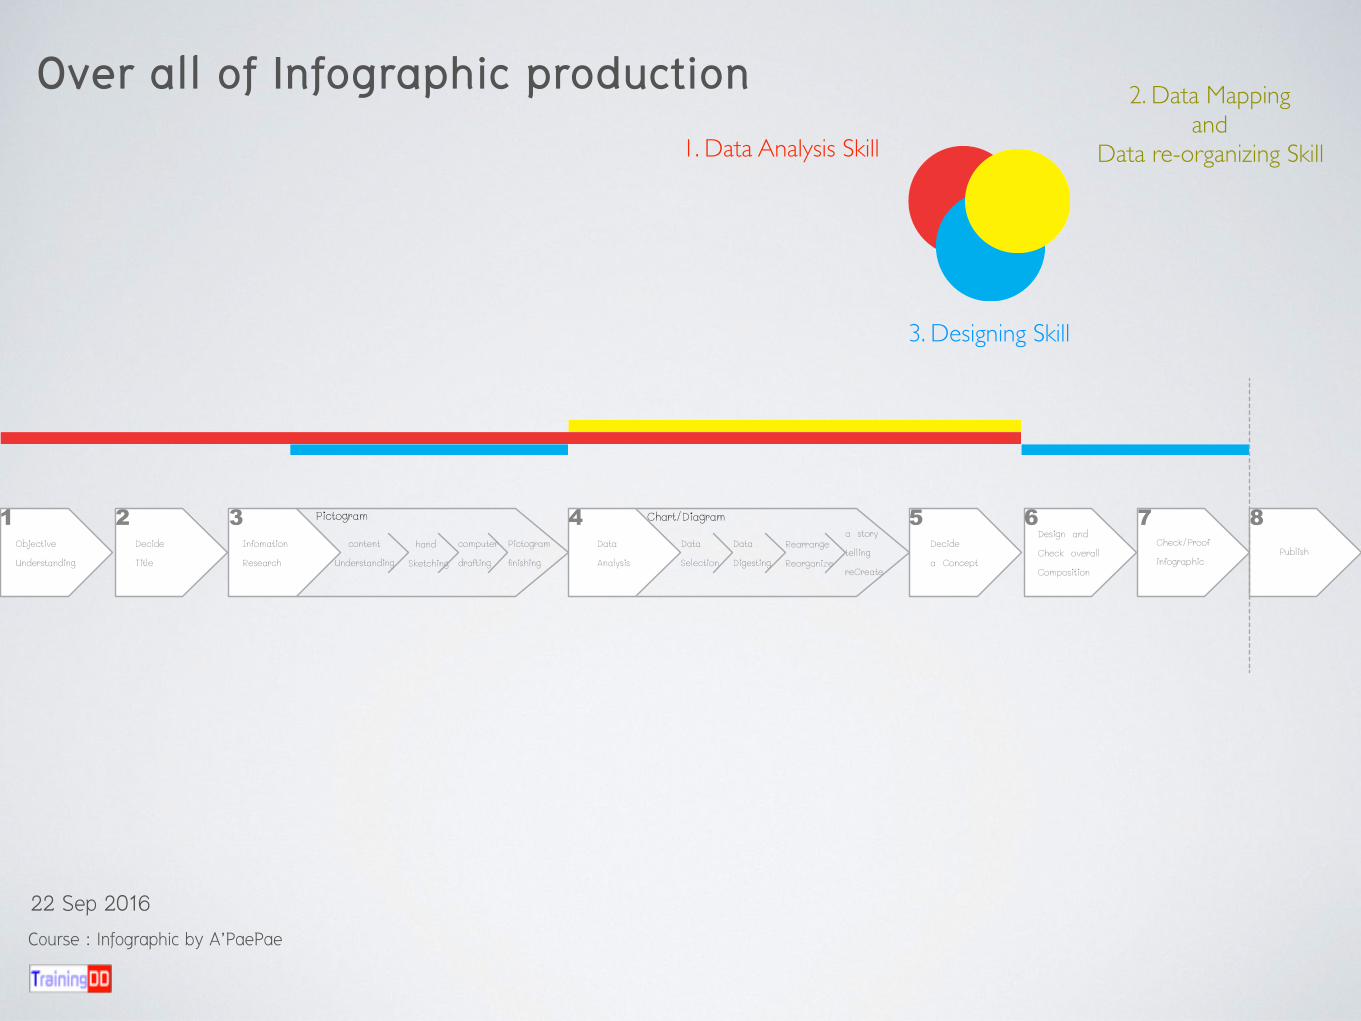
Over all of Infographic production
Course : Infographic by A’PaePae
22 Sep 2016
3. Designing Skill
1. Data Analysis Skill
2. Data Mapping and
Data re-organizing Skill
Pictogram
Designed by thenounproject
Course : Infographic by A’PaePae
22 Sep 2016
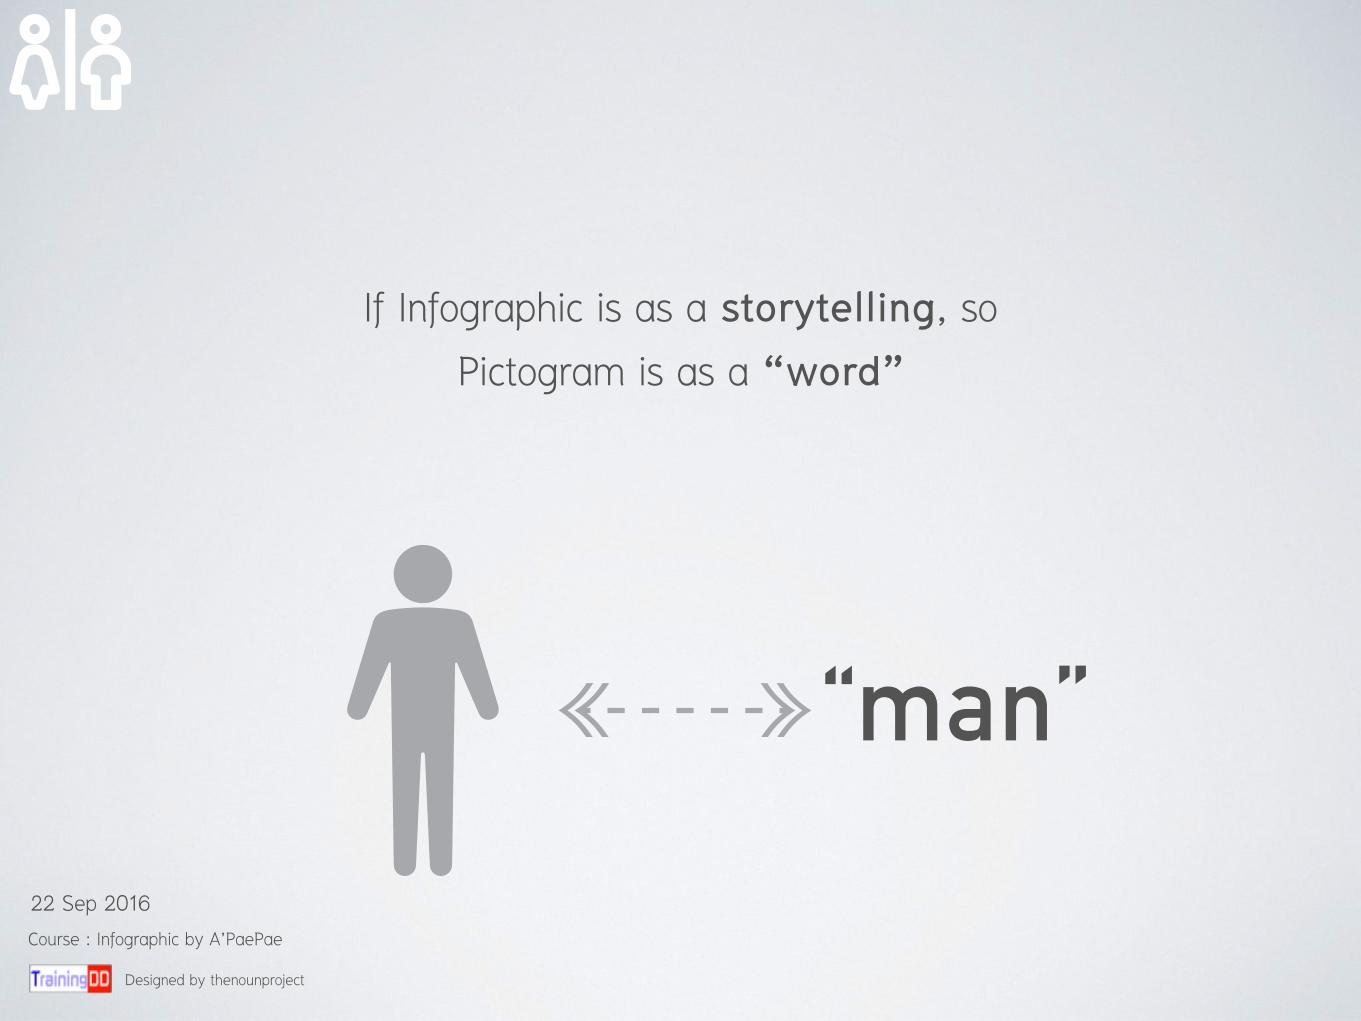
If Infographic is as a storytelling, so Pictogram is as a “word”
“man”
Designed by thenounproject
Course : Infographic by A’PaePae
22 Sep 2016

“Pictogram is to represent or support a “word” in order to visual/graphically communicate smooth.
Most of visual communications have ‘pictogram’ in the elements
Designed by thenounproject
Course : Infographic by A’PaePae
22 Sep 2016
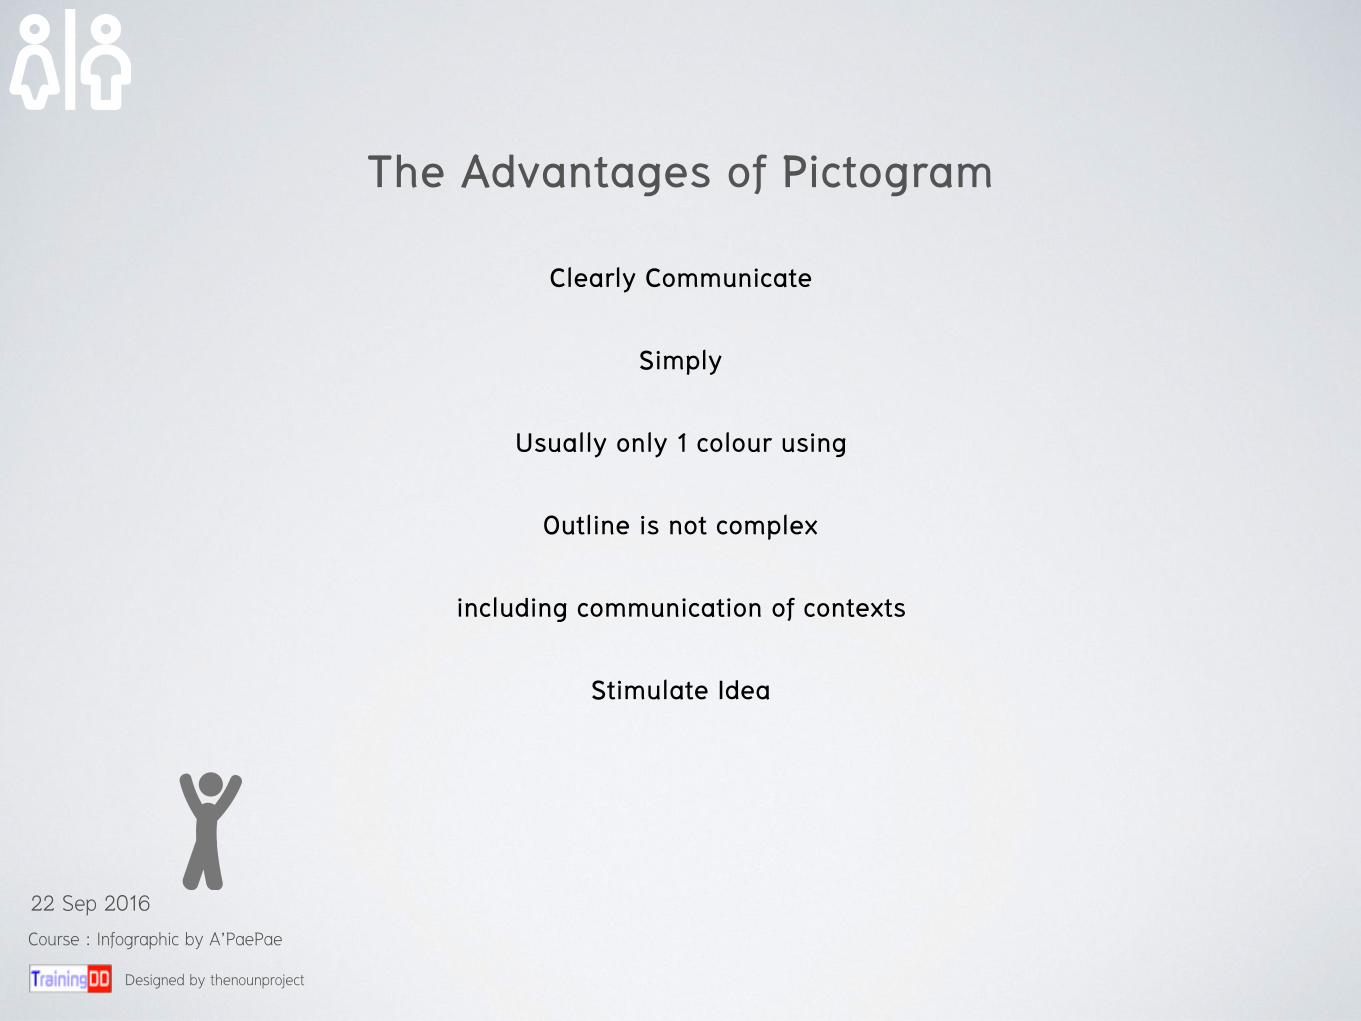
The Advantages of Pictogram
Clearly Communicate
Simply
Usually only 1 colour using
Outline is not complex
including communication of contexts
Stimulate Idea
Designed by thenounproject
Course : Infographic by A’PaePae
22 Sep 2016

Contexts created more meaning
Designed by thenounproject
Course : Infographic by A’PaePae
22 Sep 2016
The Advantages of Pictogram
Clearly Communicate
Simply
Usually only 1 colour using
Outline is not complex
including communication of contexts
Stimulate Idea

Designed by thenounproject
Course : Infographic by A’PaePae
22 Sep 2016

Example of Motion Graphic + Infographic Media that mainly use pictogram
The History of Advertising Motion Graphic Info Graphic
https://www.youtube.com/watch?v=Pq4hiF9K6tI
Course : Infographic by A’PaePae
22 Sep 2016

Using Pictogram
Designed by thenounproject
Course : Infographic by A’PaePae
22 Sep 2016

Designed by pinterest / Google
Course : Infographic by A’PaePae
22 Sep 2016

Free pictograms (Vectors)
www.thenounproject.com
www.freepik.com
Designed by thenounproject.com www.freepik.com
Course : Infographic by A’PaePae
22 Sep 2016

Designed by thenounproject
Course : Infographic by A’PaePae
22 Sep 2016

Why?
Tiny space on mobile screen
No need to long explain
easily to decorate
Universal communication
more understand than speech
easily to make more variety
Pin the location
Designed by thenounproject
Course : Infographic by A’PaePae
22 Sep 2016

Where?
Printed
Outside
Inside
Mobile Screen
Computer Screen
Designed by thenounproject
Course : Infographic by A’PaePae
22 Sep 2016
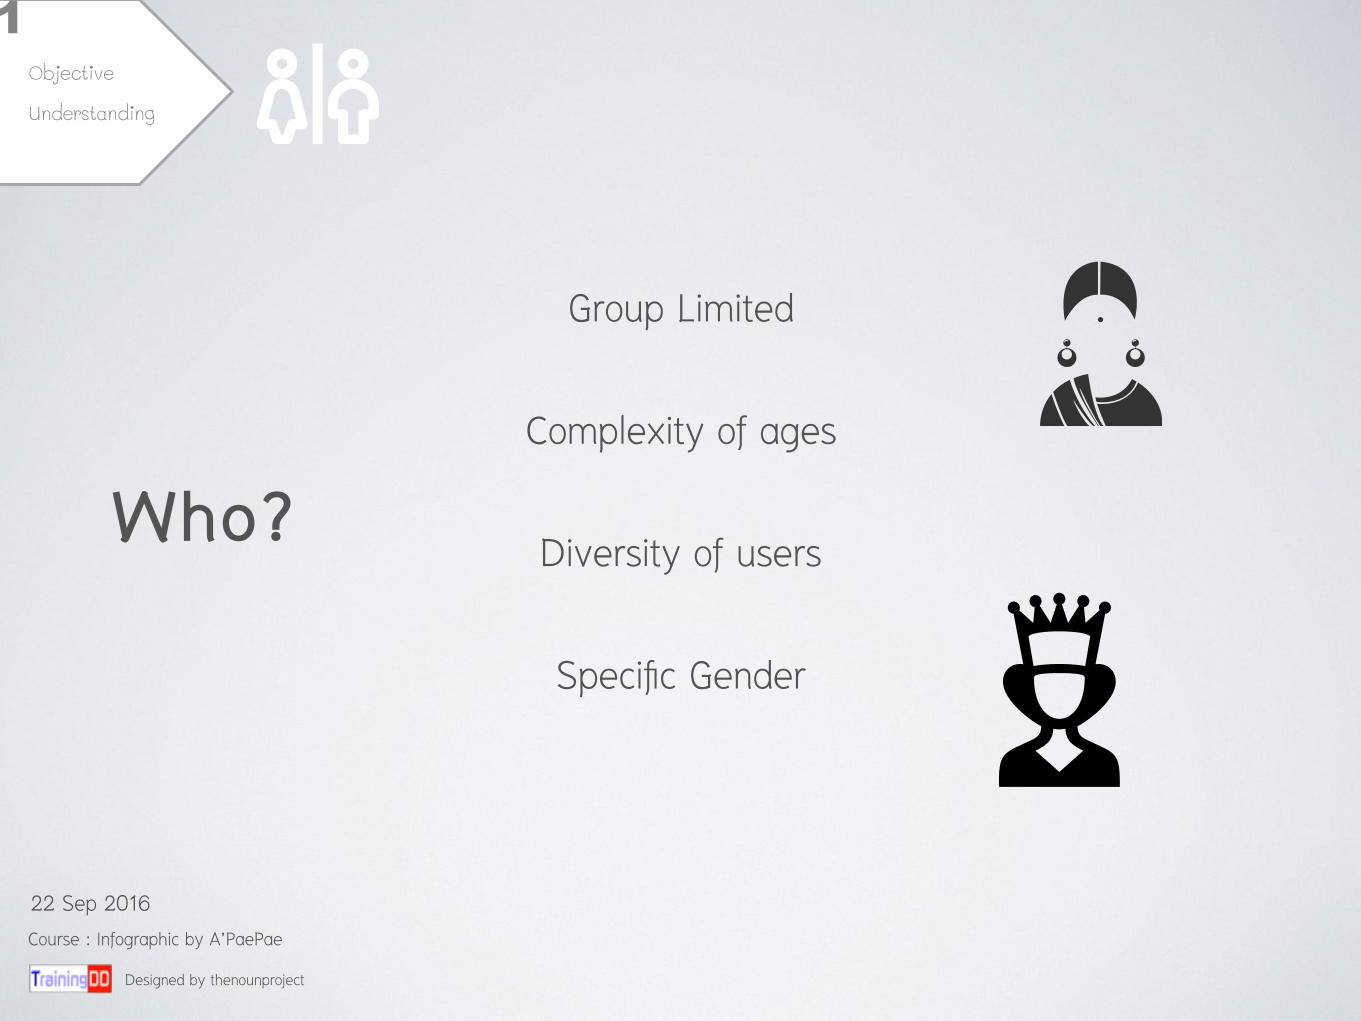
Who?
Group Limited
Complexity of ages
Diversity of users
Specific Gender
Designed by thenounproject
Course : Infographic by A’PaePae
22 Sep 2016
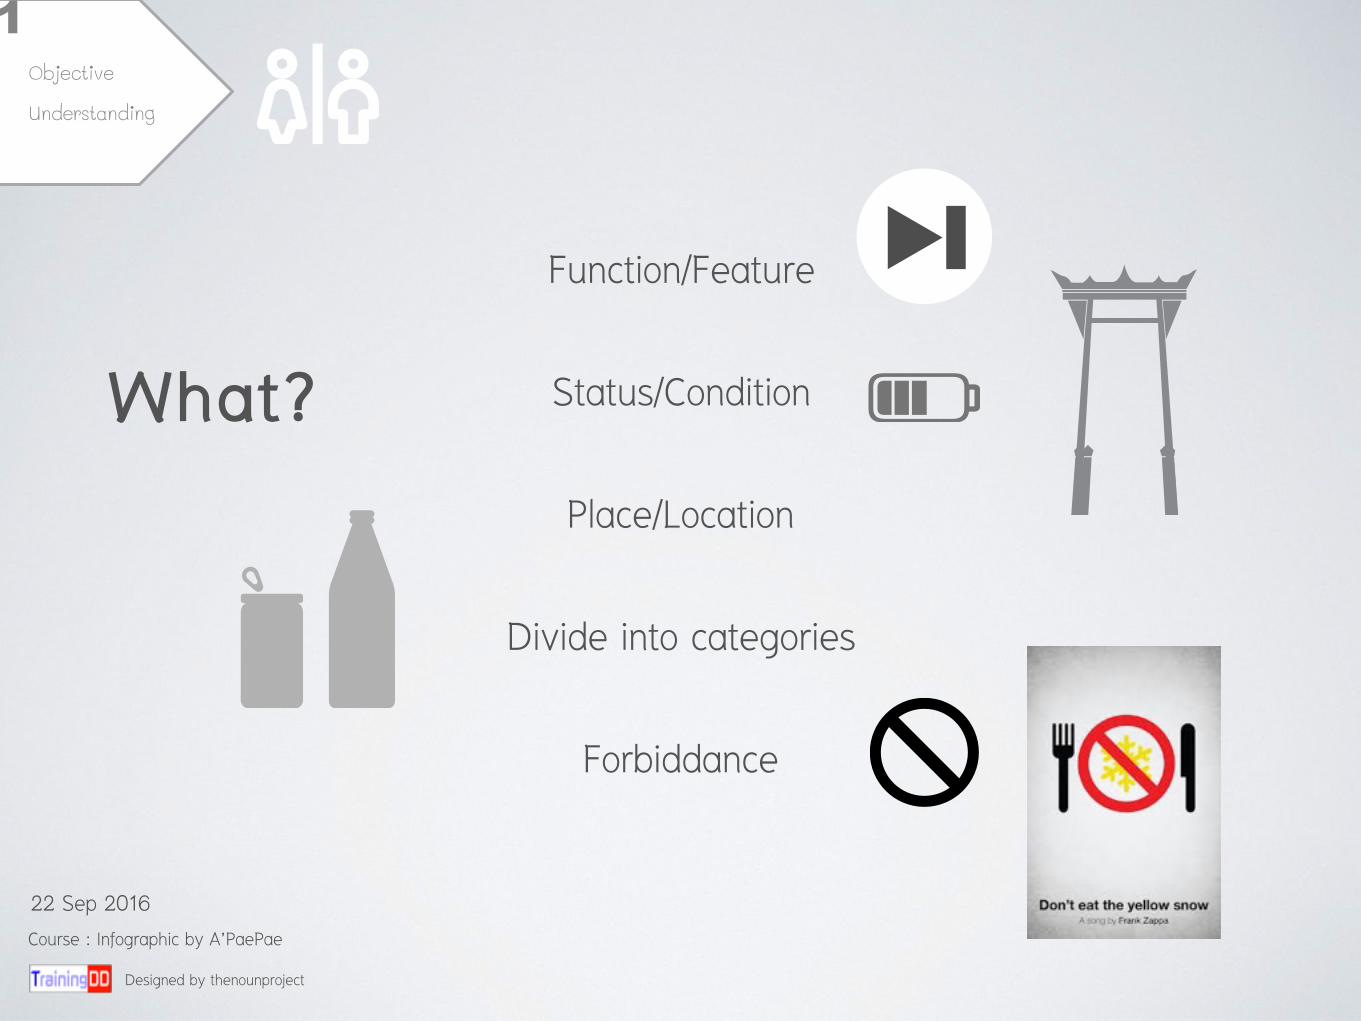
What?
Function/Feature
Status/Condition
Place/Location
Divide into categories
Forbiddance
Designed by thenounproject
Course : Infographic by A’PaePae
22 Sep 2016

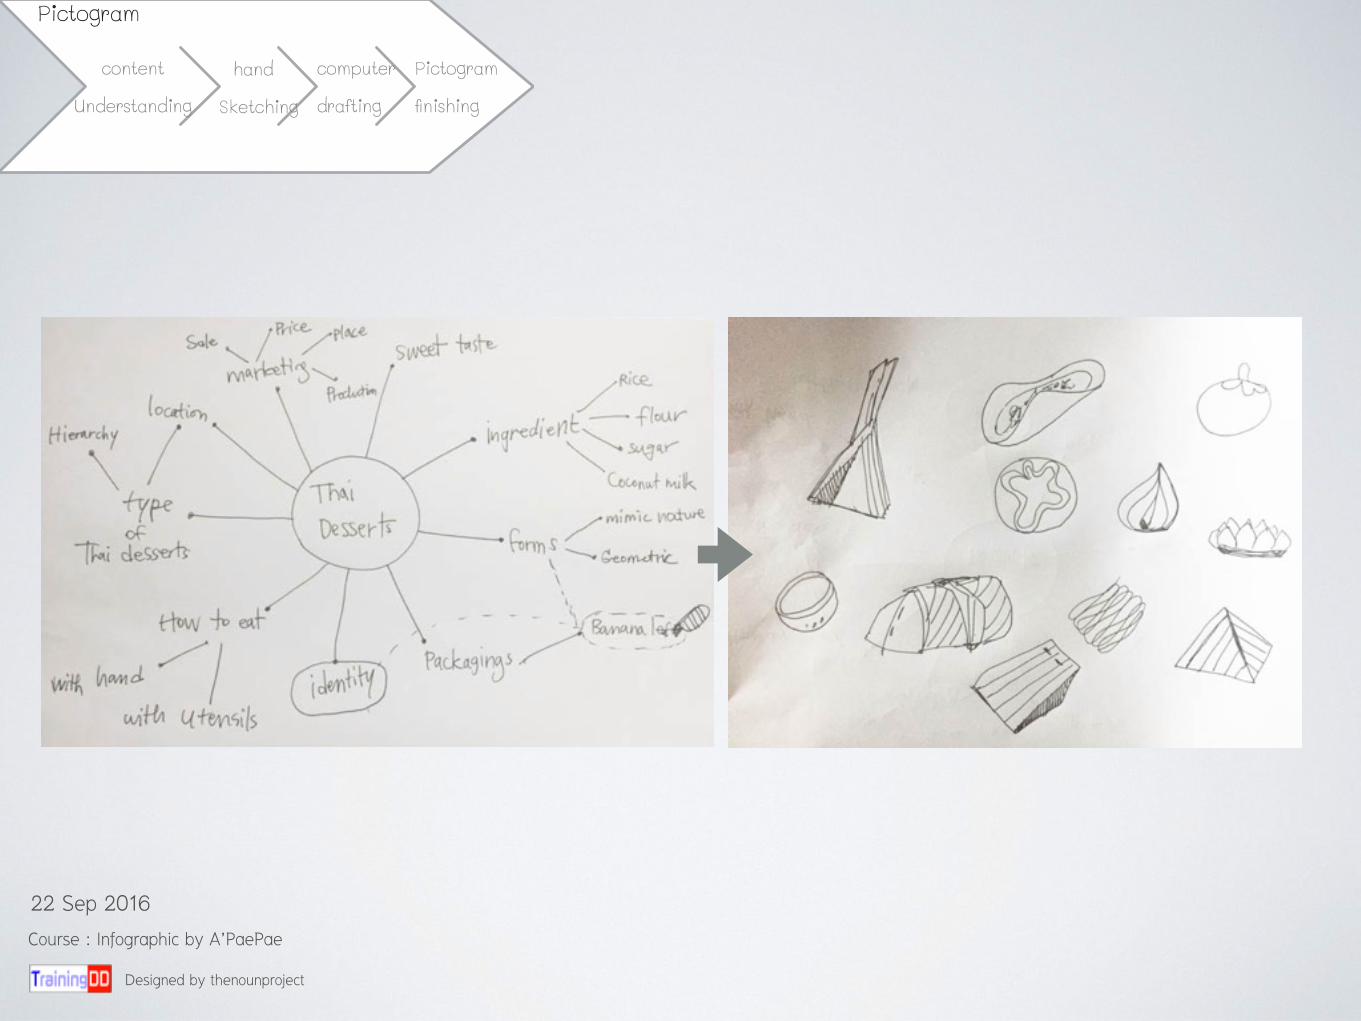
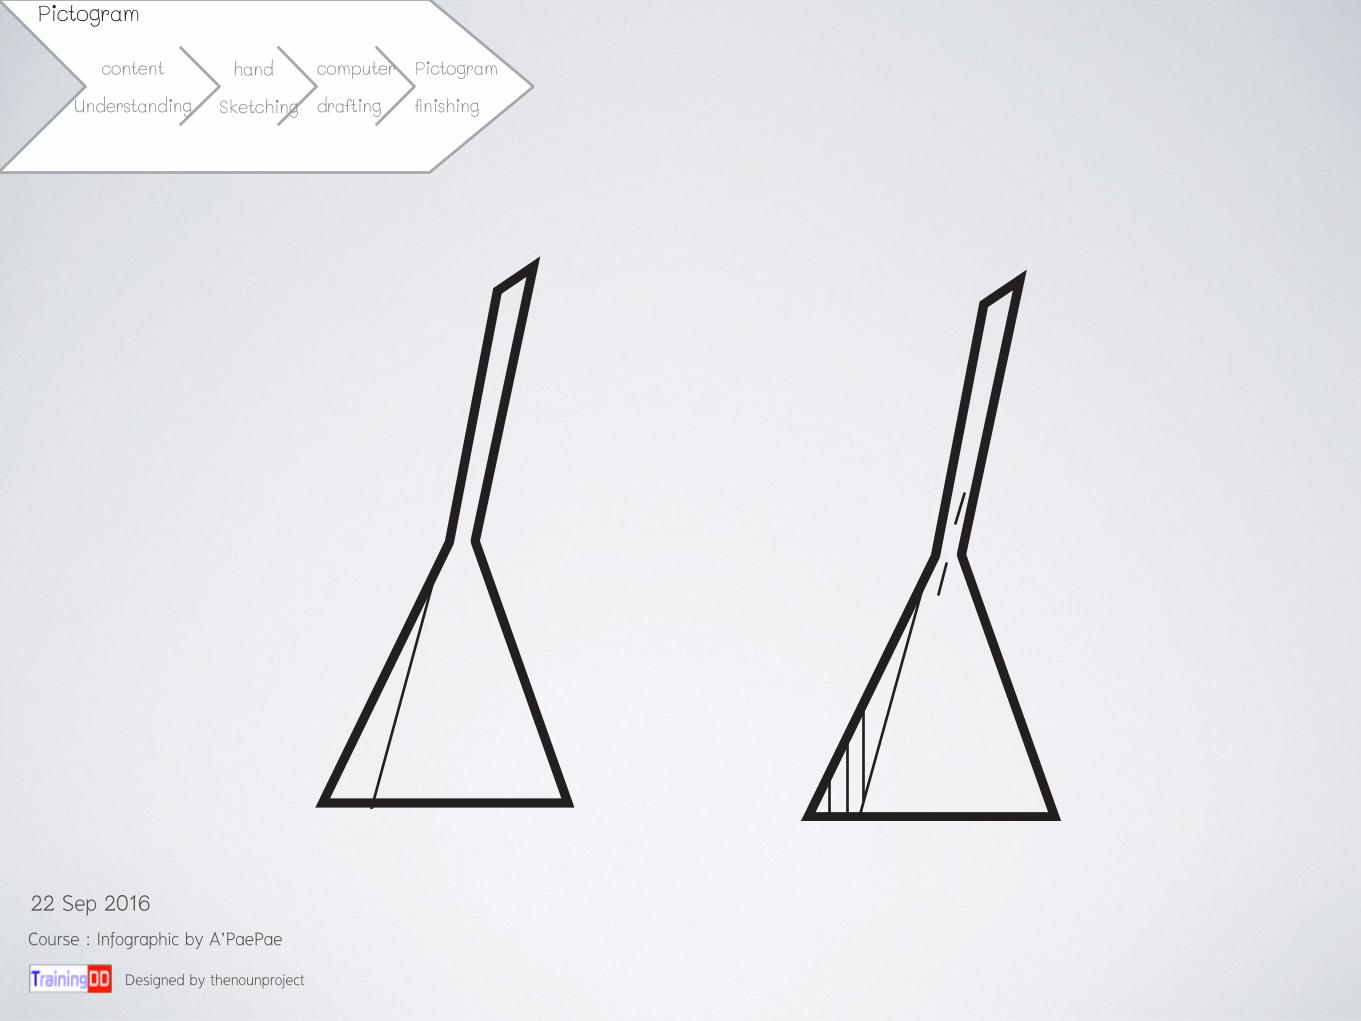
Pictogram Production
+
Geometry shape + free form shape
Designed by thenounproject
Course : Infographic by A’PaePae
22 Sep 2016

From Pictogram to Infographic
Using Pictograms to build relation between 4 boxes storytelling
Designed by thenounproject
Course : Infographic by A’PaePae
22 Sep 2016
Designed by thenounproject
Course : Infographic by A’PaePae
22 Sep 2016
Designed by thenounproject
Course : Infographic by A’PaePae
22 Sep 2016
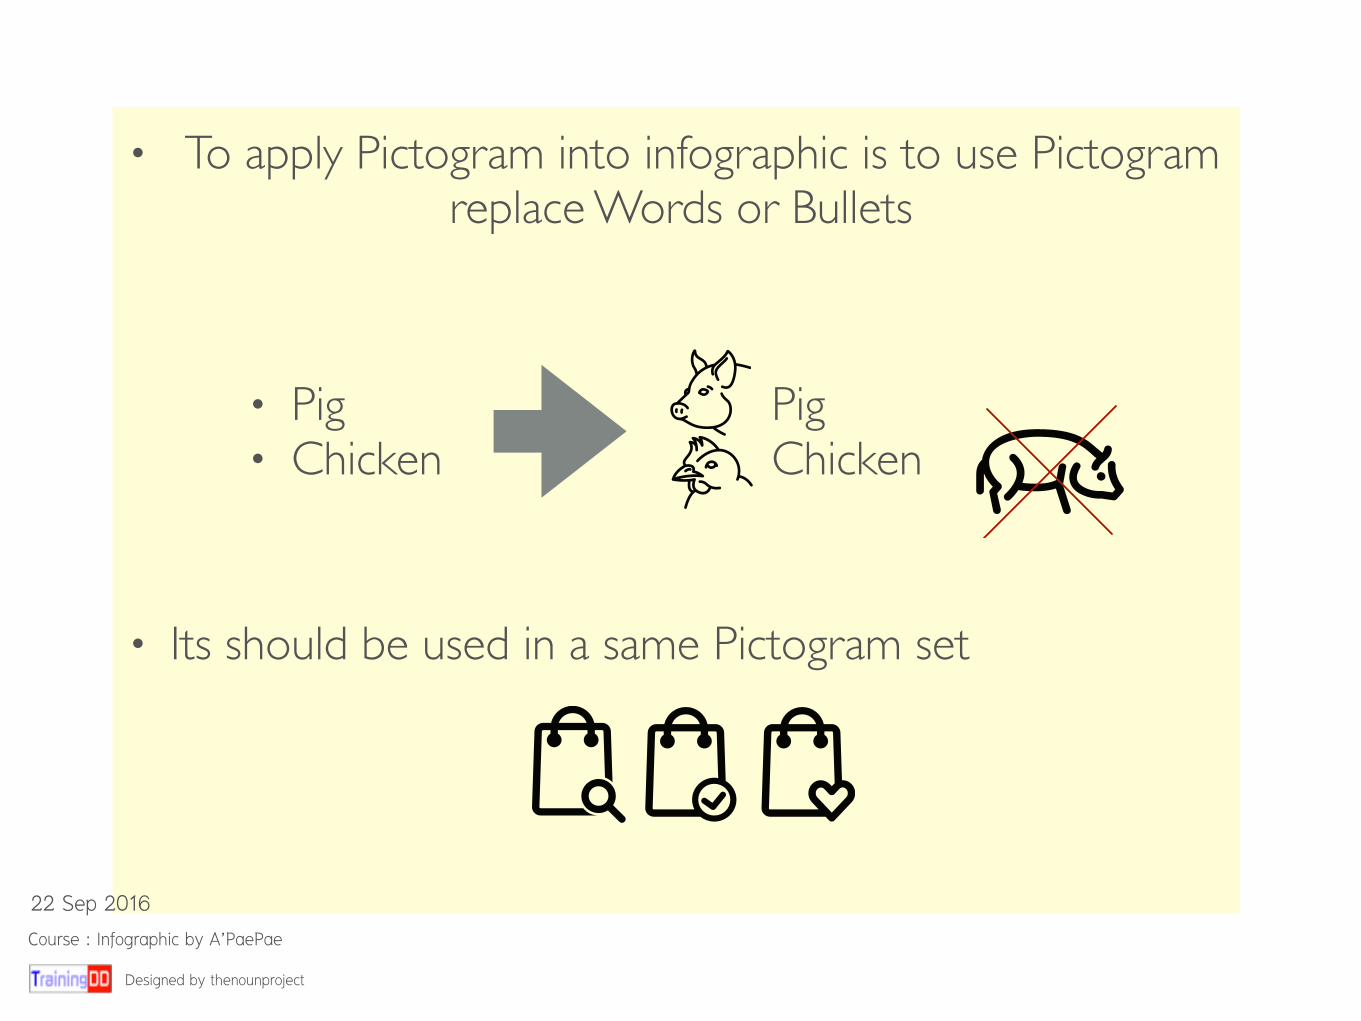
• To apply Pictogram into infographic is to use Pictogram replace Words or Bullets
• Its should be used in a same Pictogram set
• Pig• Chicken
PigChicken
Designed by thenounproject
Course : Infographic by A’PaePae
22 Sep 2016

Applying chart into infographic
Course : Infographic by A’PaePae
22 Sep 2016

Diagram
You need to be more careful while reading Diagram than Infographic
Interesting
Telling The heart of a content
Be not so Narrative
Organising data better than texts
Telling a story will be Straightforward
and Systematic
Not bored
How Diagram is good for infographic
Course : Infographic by A’PaePae
22 Sep 2016
Diagram is like a tool for organising Ideas to be more systematic composition
that contains the heart of the content in an infographic
Designed by thenounproject
Course : Infographic by A’PaePae
22 Sep 2016

Data Arrangement
Designed by thenounproject
Course : Infographic by A’PaePae
22 Sep 2016

Data Structure
Data
minor data Data
Data
Dataminor data
minor data
minor data
minor data
minor data
minor data
minor data
minor data
Course : Infographic by A’PaePae
22 Sep 2016

Data Arrangement
Gathering data Data Selection
Weed data out
Data Digestion
Course : Infographic by A’PaePae
22 Sep 2016

#Keyword Data
#A#B
#A
#A
#A
#A
#A
#B
#B#C
#C
#C
#C
#C
aaaaa
aaaabbaaaa
aaxxghaaaaaa
aaaaaavfbaaaaa
aaaaacbaaaaaaa
aa
bbbbbbbbaa
bbcabb
cccccccccfvg
ccccc
ccc
cccnnc
cccnnc
1. Data Analysis
Course : Infographic by A’PaePae
22 Sep 2016
#A#B
#A
#A
#A
#A#A
#B
#B#C
#C
#C
#C
#C
aaaaa
aaaabbaaaa
aaxxghaaaaaa
aaaaaavfbaaaaa
aaaaacbaaaaaaa
aa
bbbbbbbbaa
bbcabb
cccccccccfvgccccc
ccc
cccnnc
cccnnc
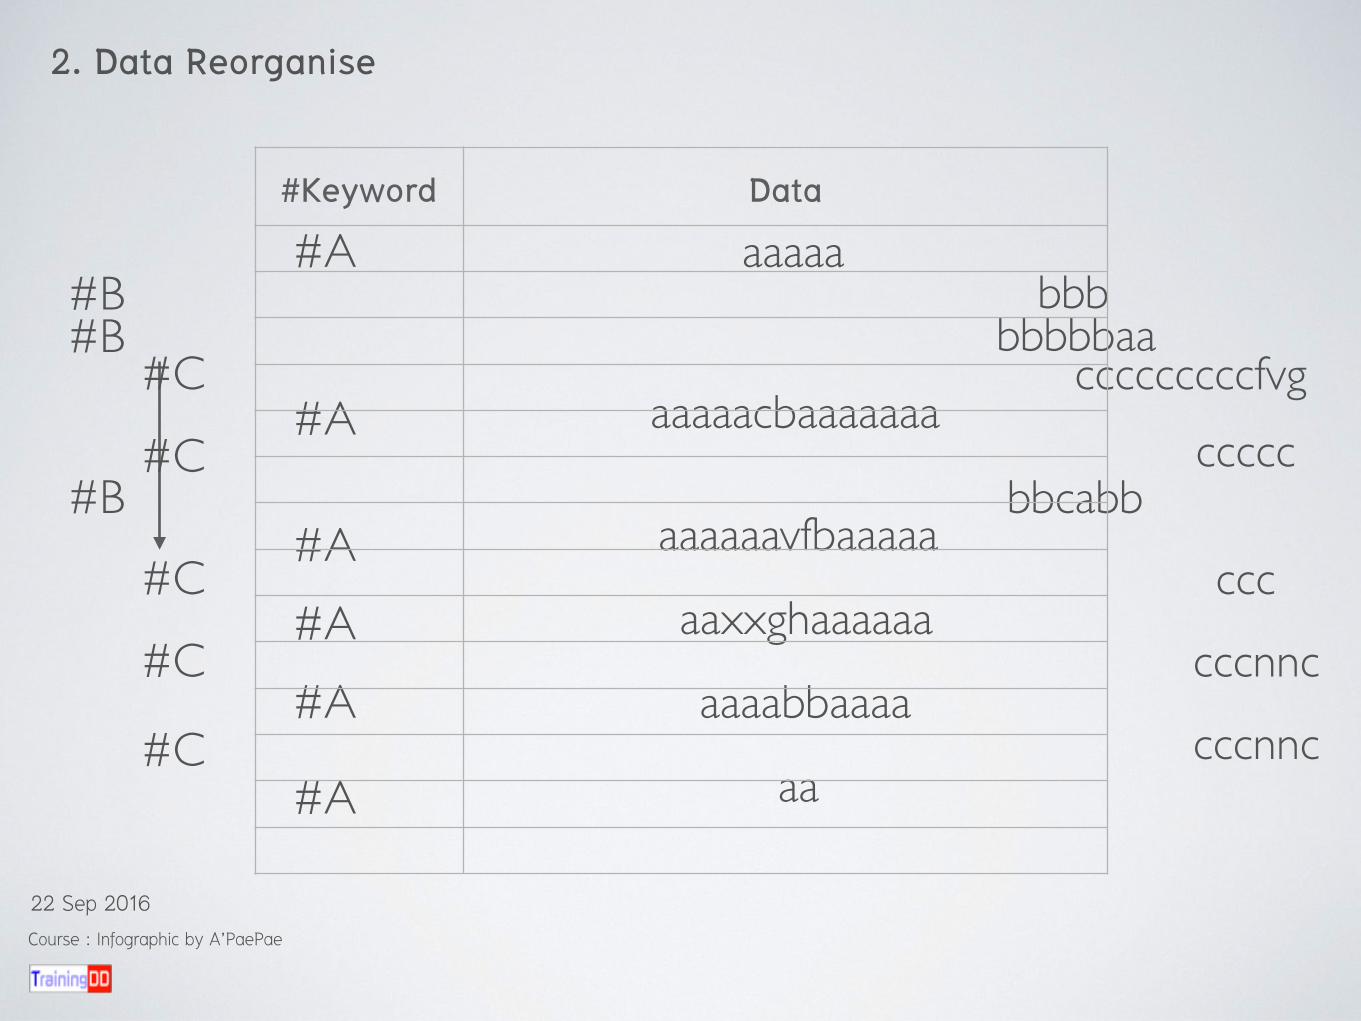
2. Data Reorganise
#Keyword Data
Course : Infographic by A’PaePae
22 Sep 2016

#A
#B
#A
#A
#A
#A#A
#B
#B
#C#C
#C#C#C
aaaaaaaaabbaaaa
aaxxghaaaaaaaaaaaavfbaaaaaaaaaacbaaaaaaa
aa
bbb
bbbbbaabbcabb
cccccccccfvg
cccccccc
cccnnccccnnc
2. Data Reorganise
#Keyword Data
Course : Infographic by A’PaePae
22 Sep 2016
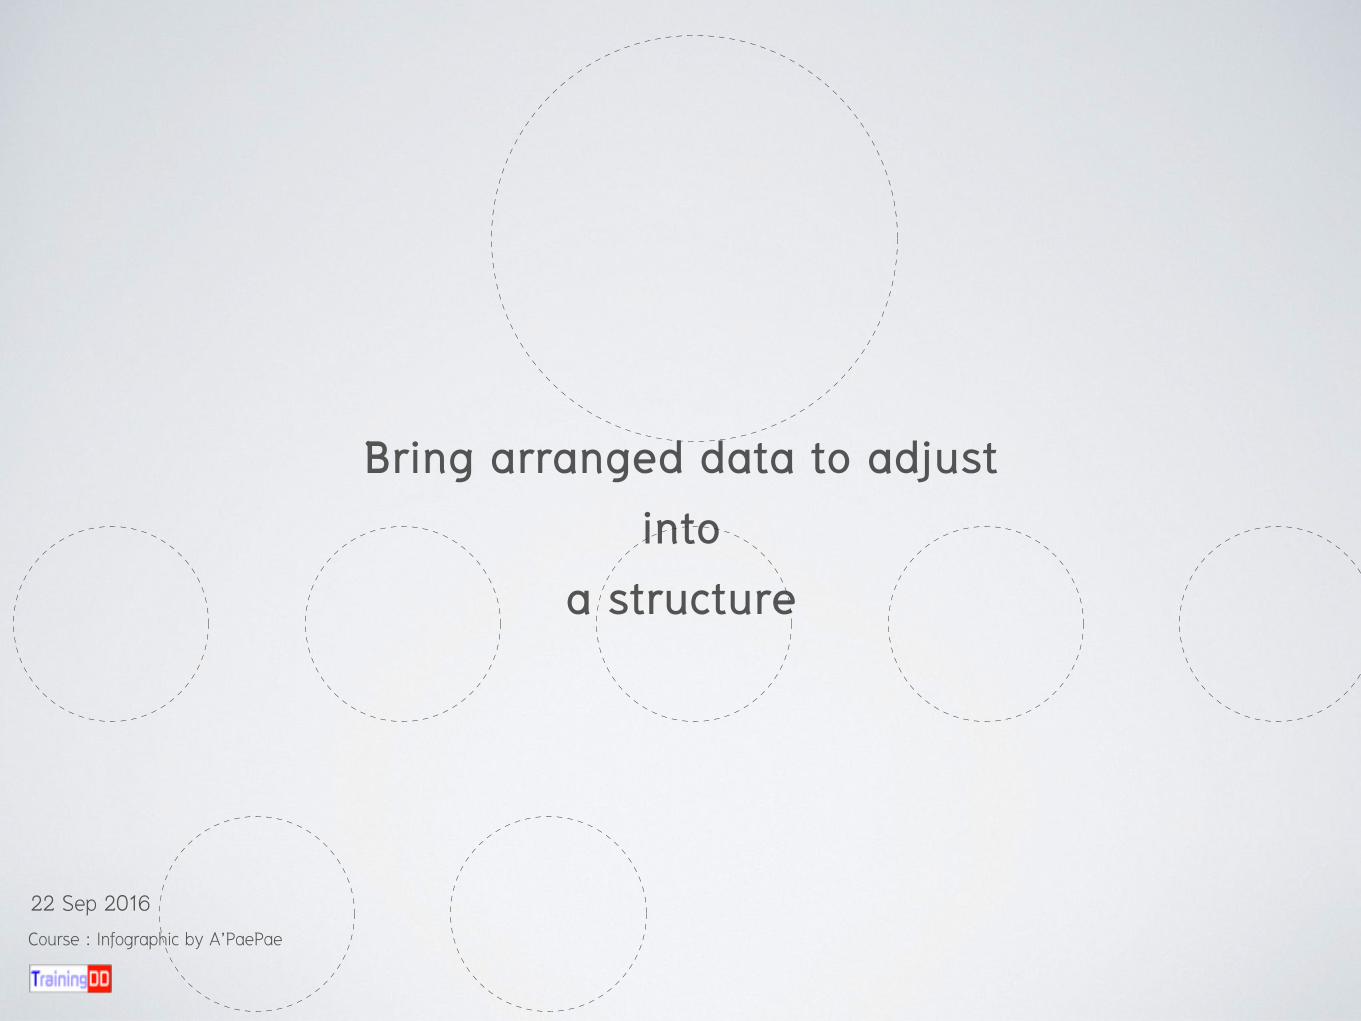
Bring arranged data to adjust into
a structure
Course : Infographic by A’PaePae
22 Sep 2016
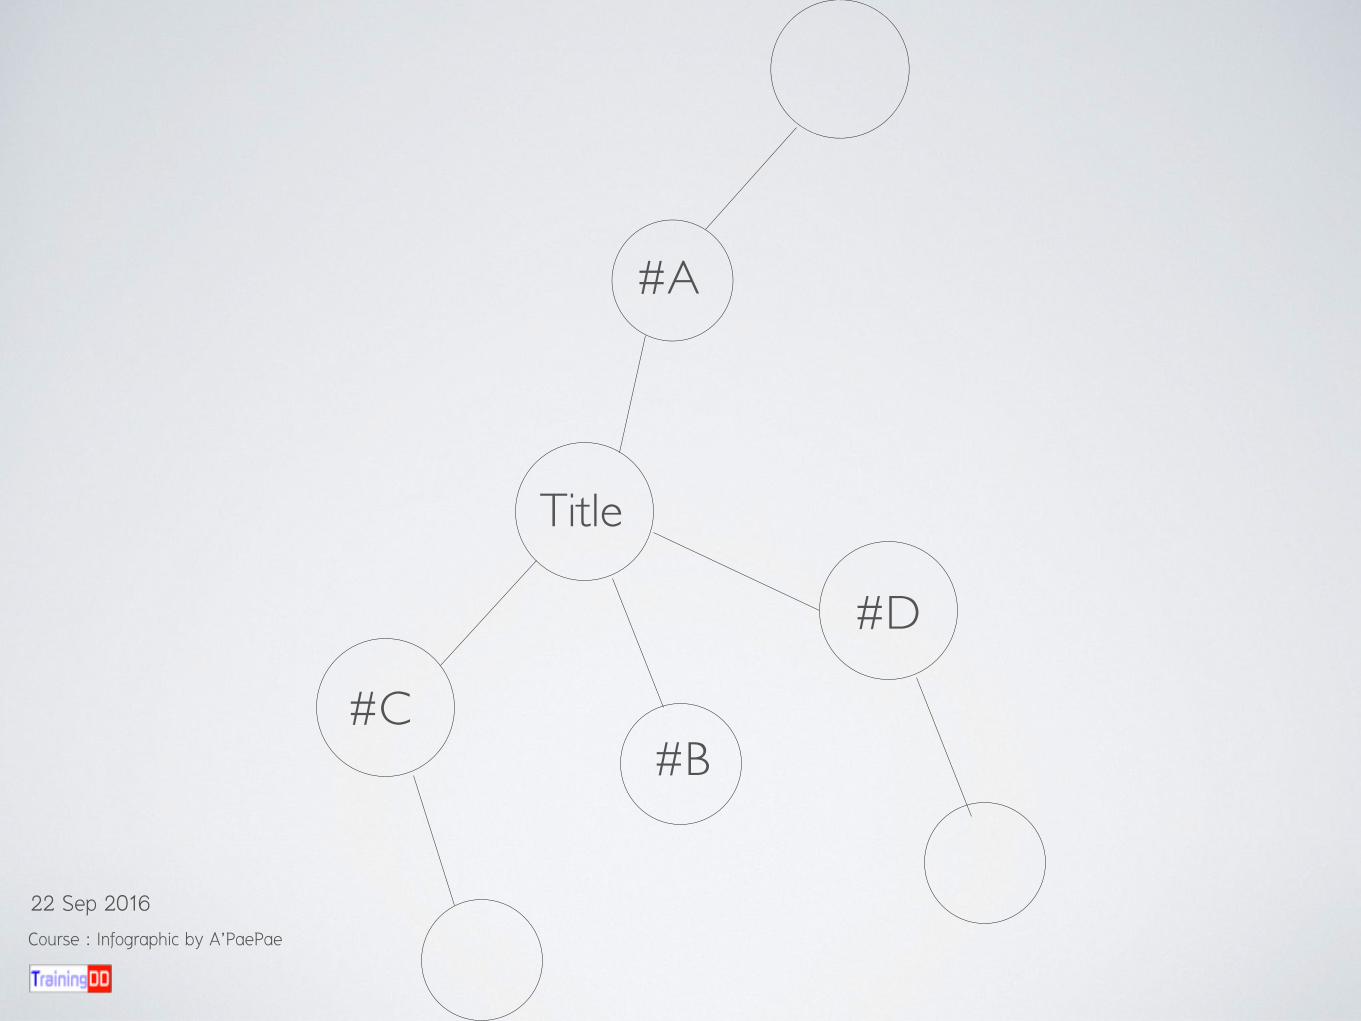
Title
#A
#B#C
#D
Course : Infographic by A’PaePae
22 Sep 2016

From Data structure to tell a story
1Starting3 Developing
4 Climax2 Ending
story...................#B
#C
#D#A
Course : Infographic by A’PaePae
22 Sep 2016

Selection a type of Diagram with following a kind of data content
1 Venn Diagram 2 Satellite Diagram
3 Hive Diagram 4 Pyramid
Diagram Types
Course : Infographic by A’PaePae
22 Sep 2016

5 Donut Diagram 6 Table Diagram
7 Axis Diagram 8 Cycle Diagram
Course : Infographic by A’PaePae
22 Sep 2016
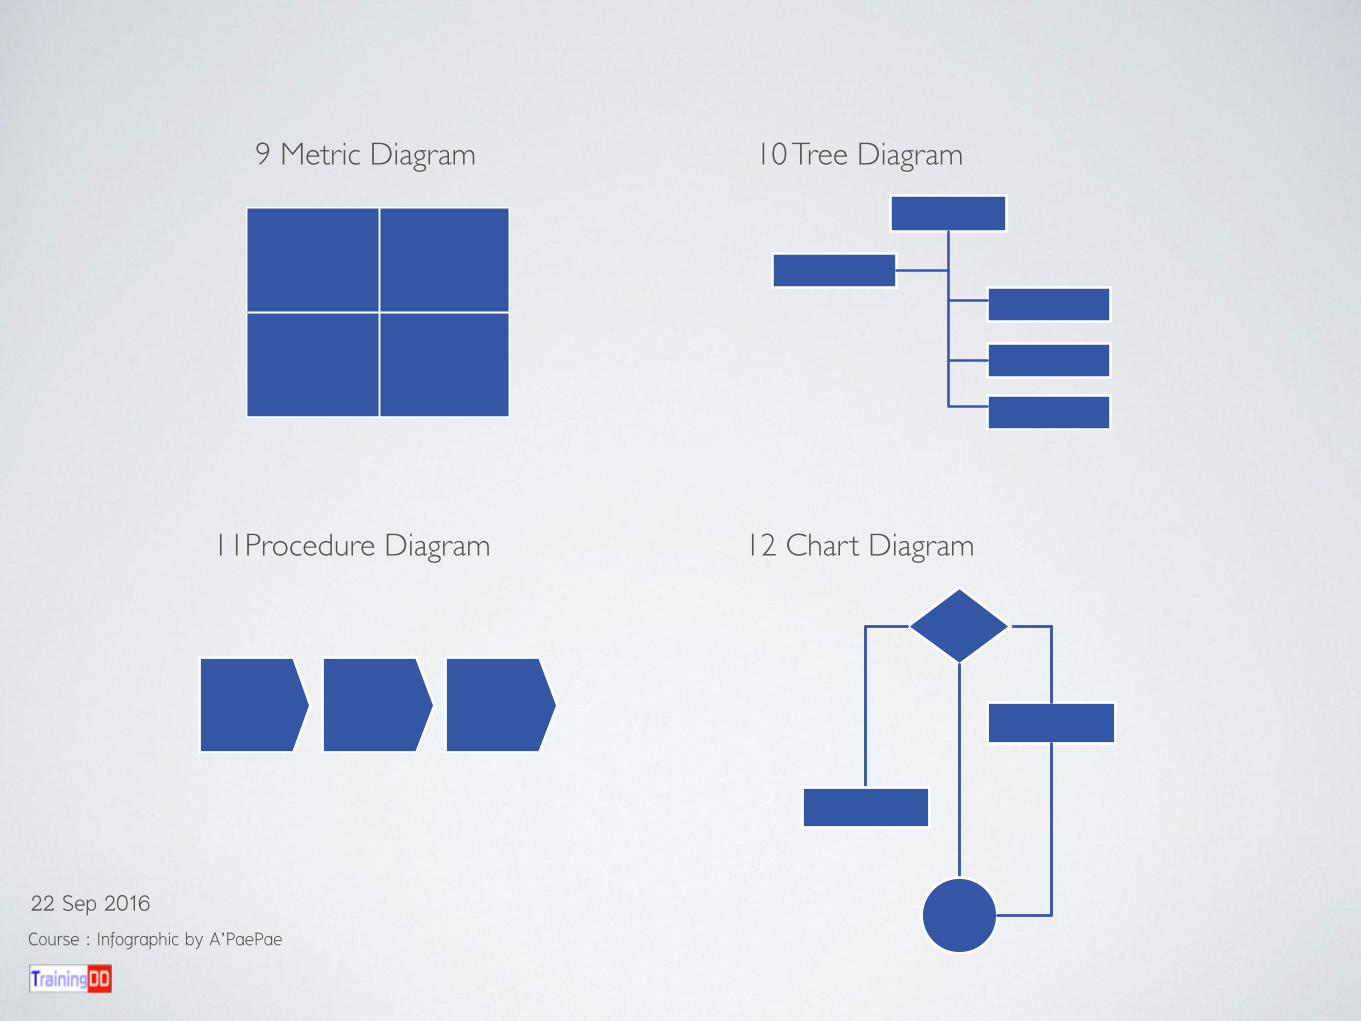
9 Metric Diagram 10 Tree Diagram
11Procedure Diagram 12 Chart Diagram
Course : Infographic by A’PaePae
22 Sep 2016

How to select a type of diagram… Depending on what kind of data is
1 Explain elements
2 Compare elements
Course : Infographic by A’PaePae
22 Sep 2016

3 Solutions
4 Explain meaning with arrangement /Step or procedure of something
Course : Infographic by A’PaePae
22 Sep 2016

“The process to make infographic publish”
Course : Infographic by A’PaePae
22 Sep 2016
-
-

Over all of Infographic production
Course : Infographic by A’PaePae
22 Sep 2016
3. Designing Skill
1. Data Analysis Skill
2. Data Mapping and
Data re-organizing Skill

Pictograms + Diagram
INFOGRAPHIC
** During Unite Diagrams, we can research more data and/or put more pictures
Course : Infographic by A’PaePae
22 Sep 2016

Wireframeto unite Diagram and data priority processing with Wireframe
Colour Format Composition Background www.google.com, www.pinterest.com
Course : Infographic by A’PaePae
22 Sep 2016

www.google.com, www.pinterest.com
Course : Infographic by A’PaePae
22 Sep 2016
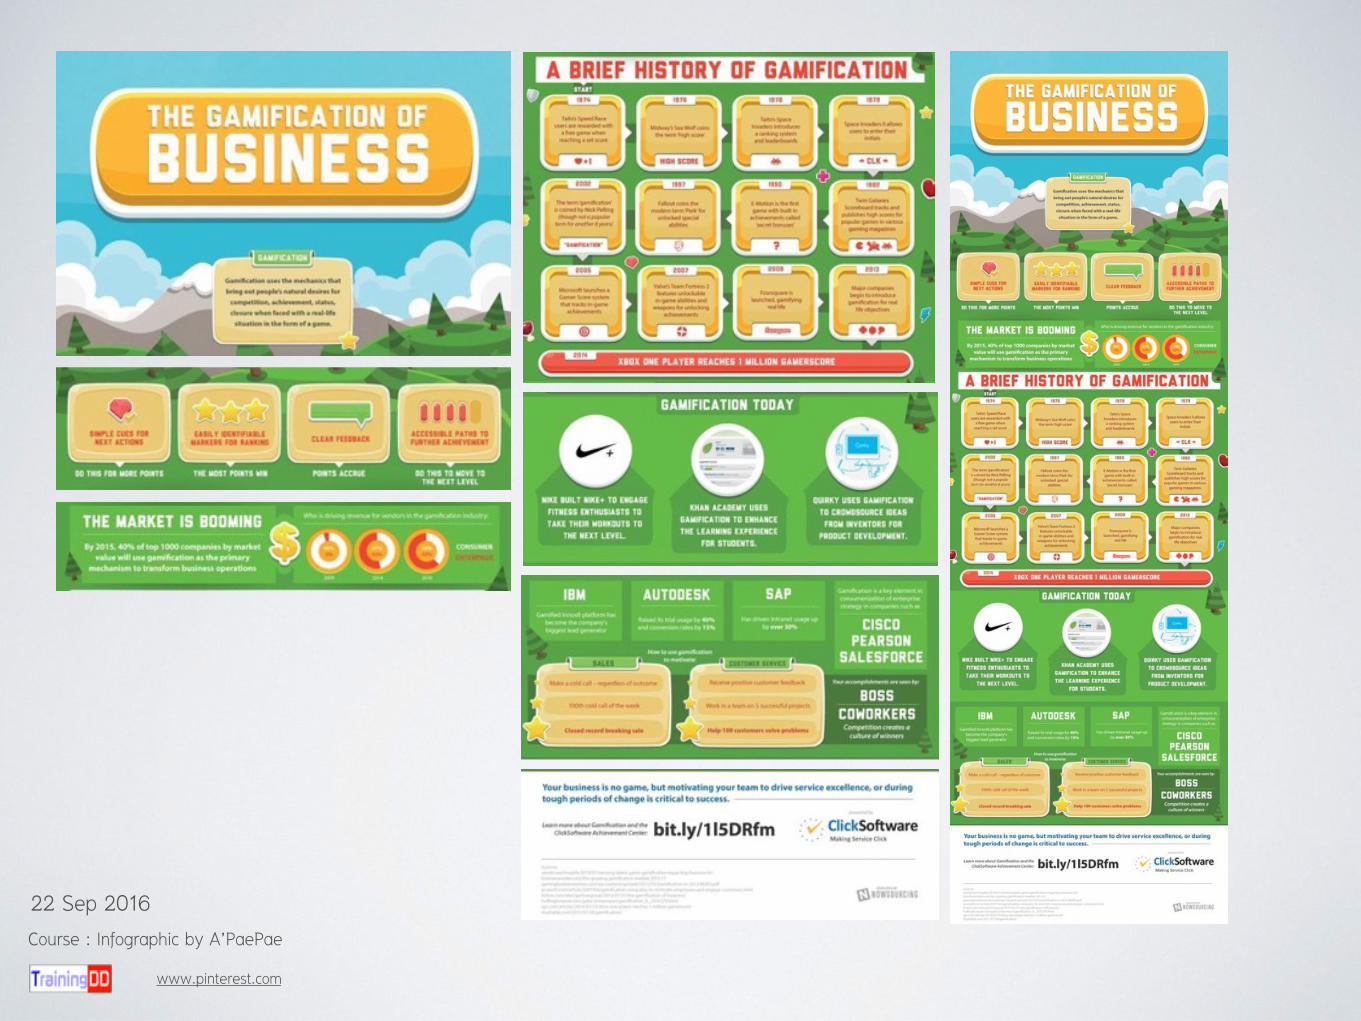


Example INFOGRAPHIC with a type of Diagram
Course : Infographic by A’PaePae
22 Sep 2016
www.pinterest.com


www.visual.ly, www.pinterest.com
Course : Infographic by A’PaePae
22 Sep 2016

Workshop Section Exercise A (20 minutes)
• Divide into 7 groups ….. one group has 10 members
• Each group will have a proposition (next slide ) • Each group has to brainstorm and make a decision on “ a
planning sheet for infographic communication” in order to make an infographic.
• Each group need to sketch a wireframe on A3 paper
• After 20 minutes each group need to present and the works will be criticised in order to have a direction
Course : Infographic by A’PaePae
22 Sep 2016

1. How to trade something from Thailand to Singapore. 2. If a small company want to deal with a big
organisation, what kinds of information that your group want to communicate to a small company.
3. How to import something from Europe. 4. If you group were Thailand representation, what kinds
of products that your group would like to present to other countries to import.
5. Social Campaign for foreigners to eat mangosteen. 6. Compare the same product on exporting with importing
in one country. 7. Communicate to rice traders
This exercise is merely practising, so the data is just only assuming to see the idea on how your group understand an infographic procedure.
*** Some details are missing so please fill in the gap
Course : Infographic by A’PaePae
22 Sep 2016

Infographic Criticism…
Course : Infographic by A’PaePae
22 Sep 2016
Course : Infographic by A’PaePae
22 Sep 2016
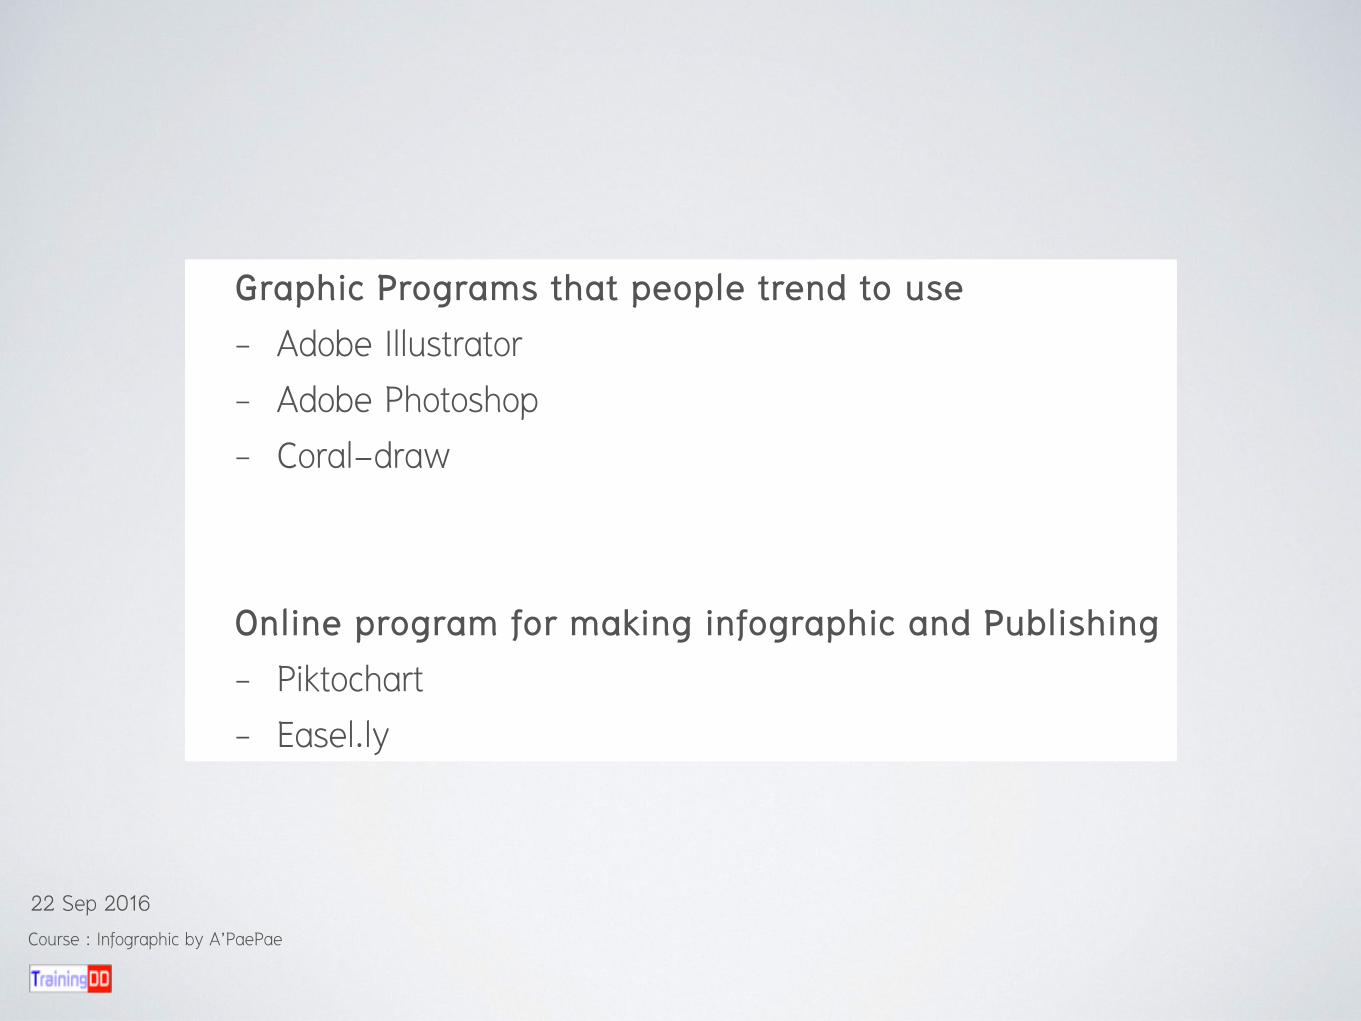
Graphic Programs that people trend to use - Adobe Illustrator - Adobe Photoshop - Coral-draw
Online program for making infographic and Publishing - Piktochart - Easel.ly


Exercise B (60 minutes)
• Working in pair (from the same group) • From previous exercise (A), try to make an infographic on
computer online program, Piktochart
Course : Infographic by A’PaePae
22 Sep 2016

Thank You


