
i
INFLUENCE OF TECHNOLOGY ON GENDER DIVISION OF LABOUR IN
HOUSEHOLDS: THE CASE STUDY OF WET COFFEE POST
HARVEST HANDLING IN KASESE DISTRICT
BY
KULE ENOS KATYA
BSC AGRICULTURAL LAND USE AND MANAGE MENT
(MUK)
A THESIS SUBMITED TO MAKERERE UNIVERSITY IN PARTIAL FULFILMENT
OF THE REQUIREMENTS FOR THE AWARD OF A DEGREE OF MASTER OF
SCIENCE IN AGRICULTURAL EXTENSION/ EDUCATION
SEPTEMBER 2010

i
DECLARATION
I, KULE ENOS KATYA, declare that this thesis has not been submitted for a degree in this
University and any other University or institution of higher learning. All information contained
here-in is original unless stated otherwise.
Signed: ……………………………………Date…………………………………………
KULE ENOS KATYA
(STUDENT)
This thesis has been submitted with our approval as the University supervisors.
Signed: …………………………………… Date………………………………………
DR. FLORENCE .B. KYAZZE
( FIRST SUPERVISOR)
Signed: ………………………………… Date………………………………………
DR. ISUBIKALU PROSSY
(SECOND SUPERVISOR)

ii
DEDICATION
To my Dear parents Late Mother Kabugho Yoniah and Late father Masereka Zebedayo Katya
who brought me into being and shaped a career for me.

iii
ACKNOWLEDGEMENT
I acknowledge the contribution of my supervisors: Dr. Florence .B. Kyazze and Dr. Prossy
Isubikalu both of the Faculty of Agriculture whose criticisms, advice and encouragement have
led to the successful completion of this report. I also thank Dr. Margaret .N. Mangheni of the
same Faculty who kept encouraging me up to the completion of this report.
I wish to express sincere thanks and gratitude to Belgium Technical Co-operation and APEP who
financed the studies and the research respectively and enabled me to collect the necessary data.
I thank the Kasese District Agricultural Office that provided me with the necessary information.
I fully recognize the active participation of all the group leaders and respondents of the farming
groups I visited.
I thank all friends and colleagues I have been interacting with both at the University and outside
whose encouraging words were of much help to me.
However, the ideas and opinions expressed in this report remain my independent views and any
errors and omissions are mine.

iv
TABLE OF CONTENTS
Declaration…………………………………………………………………………………. ……..i
Dedication …………………………………………………………………………………. …….ii
Acknowledgement ……………………………………………………………………………….iii
Table of Contents…………………………………………………………………………............iv
List of Tables………………………………………………………………………………..........vi
Appendices…………………………………………………………………………...................viii
List of Acronyms………………………………………………………………................... ……ix
Abstract…………………………………………………………………………….. …………….x
CHAPTER ONE: INTRODUCTION…………………………………………….. ……………..1
1.1Background to the study………………………………………………………... ……………..1
1.2Problem Statement……………………………………………………………… ……………..2
1.3Objectives of the study…………………………………………………………..……………..3
1.4Significance of the study………………………………………………………... ……………..3
CHAPTER TWO: LITERATURE REVIEW……………………………………………………..4
2.1 Coffee Development in Uganda: A historical perspective ……………………………..…….4
2.2 The coffee industry in Uganda ………………………………………………… ……………..5
2.3 Coffee post harvest handling ………………………………………………….. …………….5
2.3.1 Dry coffee post harvest handling Technology ………………………………. …………….6
2.3.2 The wet coffee post harvest handling Technology …………………………..……………..7
2.4 Influence of WCPT on household gender division of labor …………………. …………….8
2.5 Influence of WCPT on household gender access and control of income…….... …………….9
CHAPTER THREE: METHODOLOGY………………………………………………………..12
3.1 The study area …………………………………………………………………. ……………12
3.2 Research design ……………………………………………………………………….. ……12
3.3 Sampling ……………………………………………………………………….……………13

v
3.4 Data collection instrument…………….. .…………………………………………………...14
3.5 Data collection….…………………………………………………………….... ……………15
3.6 Data analysis…………………………………………………………………................……15
CHAPTER FOUR: FINDINGS AND DISCUSSION……………………………. ……………17
4.1 Characteristics of respondents…. ……………………………………………...…………….17
4.2 Farming status among respondents……………………………………………. ……………18
4.3 Land tenure systems in Kasese District………………………………………..…………….20
4.4 Farming systems in Kasese District………………………………………………………….20
4.5 Coffee production in Kasese ………………………………………………………………..22
4.6 Advantages and Disadvantages of wet and dry coffee processing Methods……………….23
4.6.1 Advantages of wet and dry coffee processing……………………………….. ……………23
4.6.2 Disadvantages of wet and dry coffee processing…………………………….. ……………24
4.7 Household gender Division of labor among wet and dry coffee processors………………...27
4.8 Household gender division of labor with respect to food production.
The case of cassava production enterprise in Kasese……………………………………............29
4.9 Household Gender division of non- farm sources of income labor …………………………31
4.10 Household Gender division of domestic activities………………………….... ……………33
4.11 Household Gender division of communal activities………………….............…………….35
4.12 Relationship between access to income and gender among
Wet and dry coffee processors………………………………………………………………….36
4.13 Relationship between control of income and gender among
Wet and dry coffee processors ………………………………………………………………….38
CHAPTER FIVE ………………………………………………………………………………..40
5.0 Introduction ……………………………………………………………………. ……………40
5.1 Recommendations …………………………………………………………………………...40
References………………………………………………………………………………………..41

vi
LIST OF TABLES
Table 1: Sample characteristics of coffee farmers in Kasese District …………………………..17
Table 2: Farming status of household members. …………………………………………. ……19
Table 3: Land tenure……………………………………………………………………………..20
Table 4: Major crops grown in Kasese…… ……………………………………………………21
Table 5: Land allocated to coffee and cassava by the WCPT and DCPT users………………...21
Table 6: Quantity of coffee generated by coffee farmers in Kasese per acre …………………..23
Table 7: Advantages of wet and dry coffee processing …………………………….…………..24
Table 8: Disadvantages of wet and dry coffee processing…………………………..…………..25
Table 9: Gender division of labor within coffee processing technologies ………….…………..27
Table 10: Gender provision of labor across the coffee post harvest handling
Technologies …………………………………………………………………………………….28
Table 11: Gender division of cassava labor within the coffee post harvest Handling
technologies …………………………………………………………………………..…………29
Table 12: Gender provision of cassava labor across the coffee Post harvest handling
technologies ………………………………………………………………………….………….30
Table 13:Gender division of non-farm income labor within the coffee Post
harvest handling technologies……………………………………………………………………31
Table 14: Gender provision of non-farm income labor across the technologies ……..…………32
Table 15: Gender division of domestic activities within the coffee Post harvest
handling technologies …………………………………………………………………………...33
Table 16: Gender division of domestic activities across the post
harvest handling technologies…………………….……………………………………………..34
Table 17: Gender division of communal activities within the coffee Post harvest
handling technologies …………………………………………………………………………...35
Table 18: Gender provision of communal activities labor across the Coffee post
harvest handling technologies …………………………………………………………..………36
Table 19: Relationship between access to income and gender among wet and

vii
dry coffee processors…………………………………………………………………….37
Table 20: Relationship between control of income and gender among wet and dry
Coffee processors………………………………………………………………………...38

viii
LIST OF APPENDICES
Appendix 1: Map showing the position of Kasese District ……………………………44
Appendix 2: Interview shedule…………………………………………………………45
ix
Acronyms
FAO Food Agriculture Organization of the United Nations
NEMA National Environmental Management Authority
WCPT Wet Coffee Post harvest handling Technology
DCPT Dry Coffee Post harvest handling Technology
UCDA Uganda Coffee Development Authority
RFC Rwenzori Finest Coffee Company
PEAP Poverty Eradication Action Plan
UBOS Uganda Bureau of Statistics
ICC International Coffee Council
CQIP Coffee Quality Improvement Program
UCTF Uganda Coffee Trade Federation
ITC International Trade Council
DAO District Agricultural Officer
MAAIF Ministry of Agriculture, Animal Industry and Fisheries
MFED Ministry of Finance and Economic Development
CRI Coffee Research Institute
x
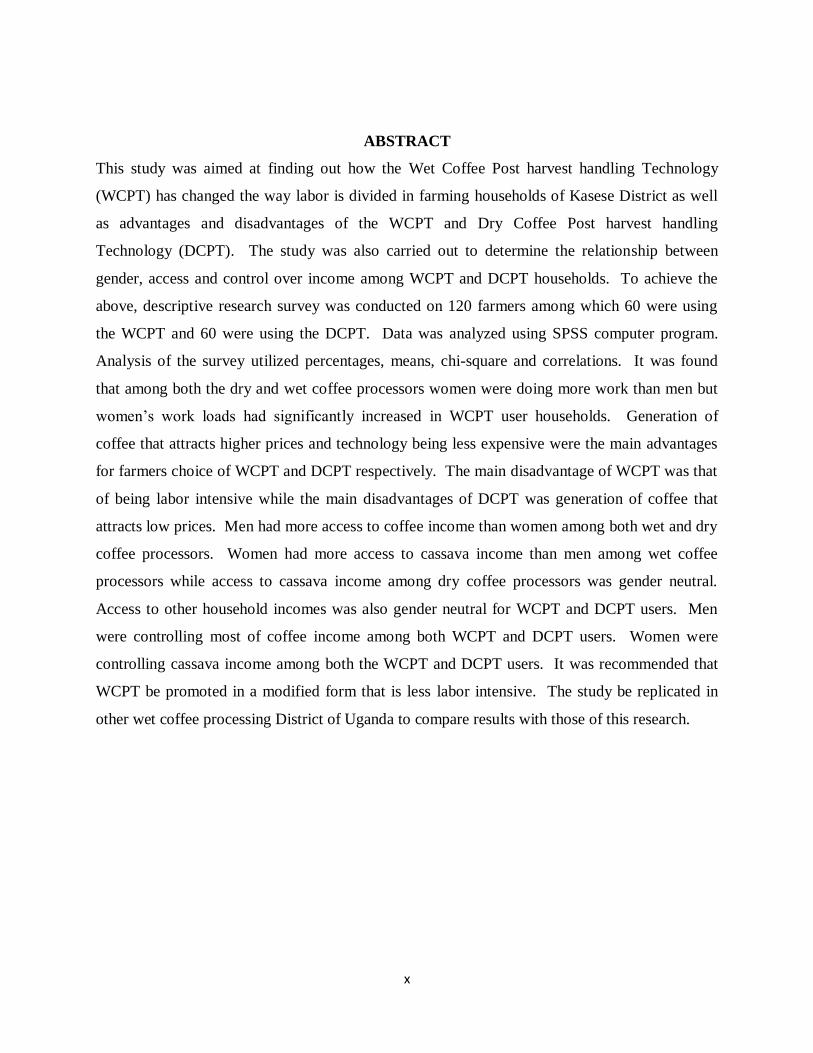
ABSTRACT
This study was aimed at finding out how the Wet Coffee Post harvest handling Technology
(WCPT) has changed the way labor is divided in farming households of Kasese District as well
as advantages and disadvantages of the WCPT and Dry Coffee Post harvest handling
Technology (DCPT). The study was also carried out to determine the relationship between
gender, access and control over income among WCPT and DCPT households. To achieve the
above, descriptive research survey was conducted on 120 farmers among which 60 were using
the WCPT and 60 were using the DCPT. Data was analyzed using SPSS computer program.
Analysis of the survey utilized percentages, means, chi-square and correlations. It was found
that among both the dry and wet coffee processors women were doing more work than men but
women’s work loads had significantly increased in WCPT user households. Generation of
coffee that attracts higher prices and technology being less expensive were the main advantages
for farmers choice of WCPT and DCPT respectively. The main disadvantage of WCPT was that
of being labor intensive while the main disadvantages of DCPT was generation of coffee that
attracts low prices. Men had more access to coffee income than women among both wet and dry
coffee processors. Women had more access to cassava income than men among wet coffee
processors while access to cassava income among dry coffee processors was gender neutral.
Access to other household incomes was also gender neutral for WCPT and DCPT users. Men
were controlling most of coffee income among both WCPT and DCPT users. Women were
controlling cassava income among both the WCPT and DCPT users. It was recommended that
WCPT be promoted in a modified form that is less labor intensive. The study be replicated in
other wet coffee processing District of Uganda to compare results with those of this research.

1
CHAPTER ONE
INTRODUCTION
1.1 Back ground to the study
Coffee is one of the most important cash crops across the world and a major source of export
earnings. It is second only to crude oil as the most important internationally traded commodity in
monetary value (FAO, 2004). In spite of high export earnings from coffee globally, coffee
produced in most African countries fetch low prices compared to coffee from other continents
due to relatively lower quality coffee (Bibangambah, 1989). As a result, most coffee farmers in
Uganda get lower incomes from coffee sales, which make very little difference in helping them
out of poverty.
Under Poverty Eradication Action plan (PEAP, 2004), Uganda is encouraging its farmers to
improve the quality of their coffee if they are to obtain competitive prices for their product on the
world market. Kasese District which is one of the leading producers of coffee in this country has
in the recent past been trying all ways possible to improve the quality of farmers’ coffee whose
quality had been jeopardized during post harvest handling. In effort to help farmers to step up the
quality and therefore income generated from coffee, Wet Coffee Post Harvest handling
technology (WCPT) was introduced in Kasese in 2004. This was through an NGO called
Rwenzori Finest Coffee Company whose aim was to generate high quality coffee that fetches
competitive prices at national and international markets. Like many other new technologies, the
WCPT is labor intensive necessitating farmers to work up to 12 a day or more hours during the
peak of the season (FAO, 2004).
Most rural labor intensive technologies are known to increase the workload of women and girl
children compared to their male counter parts (Ssekikoobo, 1995). This emerges from the fact
that females engage in using the technology besides performing their usual chores in the
household and on-farm. The females get more affected with the technologies. Whitehead (1985)
argues that most technologies introduced to rural areas do not take into consideration the
resultant effect on workload distribution with respect to sex, age and economic status of
households in the rural production systems. This is because most technologies have been

2
introduced without first making analysis of the existing gender labor dynamics with in the
farming communities (Agrawal, 1985). Yet, technological change influence household gender
division of labour (World Bank, 1994).
The extent to which a technology influences labor divisions depends on whether its technology
designers considered gender roles and responsibilities in households of an agro-ecological zone
in which the technology is intended to be implemented. Agrawal (1980) argues that the
introduction of agriculture modernization schemes has generally affected rural women in
developing countries through increasing their workloads with limited access and control of
resultant resources. Agrawal (1985) therefore emphasized the importance of taking into accounts
the implication of technological or innovation change on relative workloads, absolute and
relative access to and control over income for women, men and children.
1.2 Problem statement
Coffee farmers in Kasese District have in the recent past adopted the Wet Coffee Post harvest-
handling Technology in order to produce high quality coffee that generates high incomes
compared to the traditional Dry Coffee Post harvest handling Technology (DCPT). FAO (2004)
however noted that the WCPT is labor intensive compared to the DCPT. Studies carried out in
Equatorial Guinea on the use of WCPT also indicated that women workloads increased in
households using the technology (CRI, 2005). It is therefore likely that the WCPT increased the
workload among women farmers in Kasese District where it is currently being practiced (DAO,
2006). Though this may be the case, no investigations have been carried out to provide
evidence on how use of the WCPT influences gender division of labor with in households in
Kasese. The study therefore aimed at finding out how the WCPT influenced the labor patterns
and division in households so as to suggest strategies of ensuring technological use in a gender
equitable manner.

3
1.3 Objectives of the study.
The general objective of this study was to find out how the WCPT has changed the way labor is
divided in coffee farming households of Kasese District with respect to gender.
Specifically, the study aimed at the following:
1. To describe the general characteristics of households using the WCPT and DCPT
2. To determine the advantages and disadvantages of DCPT and WCPT
3. To find out labor division pattern among households using the WCPT and DCPT,
4. To find out the relationship between gender, access and control over income among
WCPT and DCPT households.
1.4 Significance of the study
Many farmers in Kasese District are now using the WCPT as a replacement for the DCPT
because it generates quality coffee that fetches competitive prices (Ushs 3500 for wet processed
coffee compared to Ushs 2400 for dry processed coffee). However some farmers have not
adopted the WCPT because of its labor intensiveness and that it would increase their workloads
and yet they may not necessarily have access to and control over income generated from the
technology. Establishing how the WCPT has influenced gender division of labor as well as
access and control over income within households would help determine how females and males
accessed and controlled income got from using the WCPT so that strategies can be sought on
how to bridge the imbalances that may exist with regard to access and control of income.
The findings of the study would assist the Government agencies, Non Governmental
Organizations and policy makers promoting coffee in Kasese get insights that would be used to
effectively promote a technology that is appropriate to farmers’ socio- economic conditions. The
technology designers would be in position to redesign, modify or continue promoting the WCPT
the way it is so long as it fits into the household gender labor system of the area. The study
findings would also be useful to academicians who may need to review the work, replicate the
study in other areas or extend the topic further.

4
CHAPTER TWO
LITERATURE REVIEW
2.1 Coffee Development in Uganda: a historical perspective
There are two coffee varieties grown in Uganda; Robusta (coffea canephora) and Arabica (coffea
arabica). Before the coming of colonialists, Robusta coffee which is believed to be native to
Uganda’s natural forests was being grown in Buganda. A ritual significance was attached to
Robusta coffee in Buganda. It was used as an offering to gods and the spirits. In the ceremony of
brother hood the two beans were taken out of the berry; each man moistened it with blood and
gave it to the other to eat. When a visitor arrived at a house, he was given coffee beans to chew
before being offered food. Coffee was also used in ceremonial gifts. Only a few trees were
planted around the homes to supply berries for these purposes. It was a custom among the
Baganda that coffee was always planted by a visitor (Haarer, 1962).
However, the struggle to develop coffee into a commercial enterprise dates back from 1898
during the colonial era, when the colonial Government first introduced Robusta coffee at
Entebbe Botanical gardens for trial as a cash crop (Haarer, 1962). Arabica coffee originated from
Ethiopia (Abyssinia) transported to Southern Arabia through slavery activities around 600A.D. It
was later spread to Malawi (Nyasa Land) from where Uganda under the colonial Government
obtained the first Arabica coffee seed stock in 1900 (Purseglove, 1968). Both Robusta and
Arabica was later introduced at Kampala trial Gardens in 1900 and eventually at Kawanda
Research station in 1937 where the selection and breeding for improved seed stock has since
been done.
Robusta (coffea canephora) is a low altitude crop grown between1000-1500M above sea level; it
requires rich fertile soils and rainfall of over 700mm. This explains why Robusta coffee is
mainly grown in the lake crescent zone along the shores of Lake Victoria (Jameson, 1970).
Arabica coffee is grown at high altitudes of 1500-2500M above sea level in the coarse volcanic
loamy alluvial soil, light textured, and well drained with slightly acidity (Ph of 5.0-6.0). This

5
explains why Arabica coffee is mainly grown in the high land areas of Uganda in the Rwenzori
Mountains, Elgon and Muhavura ranges (FAO, 2004; MAAIF, 1993)
2.2. The Coffee Industry in Uganda
Uganda’s economy largely depends on the agricultural sector. Agriculture contributes about 42%
of the Gross Domestic Product (GDP) of which 80% of the monetary value is from coffee.
Coffee is the leading export crop and leading foreign exchange earner. In 1997, coffee
contributed about 55% of the total export earnings. Coffee provides both direct and indirect
employment to over 5milliom Ugandans. This therefore calls for focusing of attention from
Government and development partners to coffee industry development in order to reap more
from this crop (UCTF, 2001). The quantity of coffee exported by Uganda has been fluctuating
since 1964. The highest export volume of up to about 4.2M sixty-kilogram bags of coffee was
registered in the 1996/97 financial year attracting up to US$ 355M.The lowest export volume
was registered in 1977/78 financial year of 1,7M sixty-kilogram bags attracting US$312M. The
causes for these fluctuations include political instability, poor coffee quality, unfavorable
weather conditions in some years (UCDA, 2001; MPED, 1997).
Uganda Coffee Development Authority (UCDA) is championing efforts to make coffee a vibrant
and strategic source of income with great emphasis on quality (Wetala, 1996). The process of
achieving optimum coffee quality begins from the way coffee is managed at the farm, especially
post harvest handling technology used by the farmers (Mukiibi, 2001).
2.3.0 Coffee Post harvest handling
Robusta and Arabic coffee are handled differently. Robusta coffee is only handled by the DCPT
while Arabica is processed using both the WCPT and the DCPT. The DCPT has been in use
since the colonial times (RFC, 2006) while the WCPT was introduced in Uganda in the early
1970s. However, WCPT was later abandoned in 1977 due to the political upheavals that
escalated during that time leading to fleeing of the country by WCPT promoters who were
mostly British to their home countries. The WCPT was reintroduced by RFC in 2004 in Kasese
and Mbale Districts where Arabica coffee is predominantly grown. Failure to subject Robusta

6
coffee to WCPT (like the Arabic type) was linked more to lack of interest on the part of
investors. Apparently, no investor has shown interest, yet, in promoting the WCPT among the
Robusta farmers. WCPT may perhaps in future be applied even on Robusta coffee (UCDA,
2001).
2.3.1 The Dry Coffee Post harvest handling Technology
In the DCPT ripe, semi ripe, dry and berries already fallen on the ground are picked and dried
(Mukiibi, 2001). Harvested cherries are sun dried on coffee yards and tapelines for about 6-8
weeks and hulled by machines which are in most cases located far away from farms in urban
area (ITC, 1992). Like any other technology, the DCPT has advantages and disadvantages that
influence its usage.
The advantages of DCPT include less labor demanding as it only requires picking, drying and
marketing (UCTF, 1999). This creates time that allows farmers to engage in various farm and
off-farm activities to diversify their livelihoods. Owners of coffee huller often reap more from
accumulated seasonal coffee husks. The husks are often sold for mulch and manure generation.
The major disadvantage of the DCPT is reduced quality of coffee. The International Coffee
Council (ICC) has identified dry coffee processing as one of the key ways through which coffee
loses quality easily. ICC put a resolution to the effect of minimizing chances of reduced quality
of coffee. The ICC resolution No.407 on Quality Improvement Program which puts the
minimum export standard at 86 defects per 300g of Arabica and 150 defects per 300g of Robusta
was passed in 2002. If implemented, coffee producer countries would hold an estimated 5-10
million bags of coffee previously deemed exportable and divert it to other uses or destroy it all
together (UCTF, 2003).RFC (2006) describes coffee processed by the DCPT as poor quality, a
reason why its price is lower than that produced by the WCPT. According to FAO (2004),
Coffee produced by the DCPT is said to have a high mycotoxin content, which makes it less safe
for human consumption.

7
2.3.2 The Wet Coffee Post harvest handling Technology
According to Rwenzori Finest Coffee Company, (RFC, 2004) the steps followed during coffee
post harvest handling include; red ripe coffee berries are selectively picked leaving the unripe
and semi ripe coffee berries. These berries are then poured into a basin/source pan or any
container half full of clean water. Quality coffee berries sink while the poor quality coffee berries
float together with other unwanted debris. Floating coffee is then removed together with other
floating materials. The sunken berries are then washed and pulped using a hand driven pulpier.
Coffee berries are put in the pulpier in rations that can be handled depending on the size of the
pulpier dish.
Pulpiers rub off the skin and some of the mesocarps by forcing the berries between a rubber strip
and a perforated rotating drum. The expelt fruit still have mucilaginous pulp adhering to the
endocarp around the seeds. Pulping must be done on the same day of coffee picking to prevent
loss of coffee quality. The pulp is heaped to decompose and then used as manure. The next stage
is fermentation. In the fermentation stage there is enzymatic degradation of pectinaceous
mucilage. Beans are placed in a pile/source pan/basin and clean water added until the beans are
fully covered. This process takes 24-36 hours depending on environmental temperatures. Some
beans float and the biggest percentage of the beans sink.
Floating beans are removed because they are of low value. Sunken beans are then washed 3-4
times after fermentation to prevent staining. Beans are then dumped from wash containers to
wire meshed drying tables in doors for three days while still inside the endocarp/parchment.
Plenty of clean water is needed for washing coffee. An estimated 22,750 liters of water have
been found ideal for washing coffee that generates up to 1000 Kgs of coffee ready for sale
(Mukiibi, 2001). Sun drying takes 7-14 days in dry weather on raised wire mesh drying tales.
Properly dried coffee can be stored for 3-4 years at room temperatures.
The main advantage of WCPT is production of high quality coffee. According to UCTF (2003)
the WCPT produces high quality coffee that meets the International Coffee Council (ICC)
resolution No.47 on Coffee Quality Improvement Program (CQIP) under which minimum
8
standards for exportable coffee are set. The minimum export standard is 86 defects per 300grams
of Arabica and 150 defects per 300 grams of 0f Robusta coffee. The levels of mycotoxins in wet
processed coffee are low making it the most ideal coffee for human consumption. The benefits
of wet coffee processing are not only to producers who receive higher prices but also to coffee
roasters who will receive high quality beans for their customers. It is a win-win situation.
Wet processed coffee (using hand driven pulpier) generates pulp that is used as mulch by farmers
who generate it. This helps farmers who may not be in position to purchase and transport coffee
husks from hullers that are in most cases located far from farms in urban centers (FAO,
2004).Wet processed coffee takes a shorter period (about two weeks) to dry enabling farmers to
access cash in a short time so as to meet their basic needs. In areas where wet coffee processing
has been impressed like in Kenya, formation of coffee farmers savings and credit co-operative
societies has taken place enabling farmers to access low interest loans and also be able to save
money (FAO, 2004)
Disadvantages of WCPT include; Wet coffee Processing technology is more expensive than the
Dry Coffee Processing Technology. It calls for more attention or concentration and labor right
from harvesting to drying if quality coffee is to be achieved. This situation may lead to gender
exploitation considering the fact that men are controllers of labor in households (Upudhay, 2004)
2.4 Influence of WCPT on household gender division of labor
Any change from one technology to another or introduction of any new technology has
implications on household members’ labor demands (Everts, 1998). In the literature on
technological change; household division of labor, productivity and income distribution with
respect to gender could be seen as influential and important paradigms (White head, 1985).
Analyzing the effect of technological change using a household as a unit of analysis would be
misleading as it wrongly assumes that the needs and well-being of each family member
regardless of sex get equal consideration and that each member gets an equal share of the
household’s supply of goods and services (Agrawal 1985; Benerjee, 1985). Therefore when

9
analyzing the influence of technological change on house gender division of labor, the analysis
should target both men and women in that household.
Bryceson (1985) noted that there is a wide array of technological devices that could positively
influence household division of labor and therefore reduce labor-intensive activities for women.
However there are many other technologies that are a threat to women’s welfare particularly
their workloads (Kabeer, 1991). For example in Papua New Guinea, the introduction of the Wet
Coffee Post harvest handling Technology, to replace the Dry Coffee Post harvest handling
Technology, increased the work load of rural women. Besides the traditional or usual household
chores, women had to farm to produce food, and participated in wet coffee processing. The men,
only participated in wet coffee processing and left other domestic chores to women(Grossman
and Lawrence, 1984)
Studies carried out in Kenya and Rwanda have shown displacement of men’s labor from other
income generating activities to coffee as a result of introducing the WCPT (FAO, 2004). In
Kasese money generated from coffee has been used by men to hire laborers which has enabled
men to engage in less labor-intensive activities like retail business using the money from coffee
sales (RFFC, 2006)
2.5 Influence of WPCT on house hold gender access and control of income
Technological change has got either a positive or negative effect on the incomes of household
members (Whitehead, 1985). In Rwanda the introduction of the WCPT to replace the DCPT
greatly increased household incomes but severely reduced the incomes of wives and children
(FAO, 2004). Upudhay (2004), points out that an increase in individuals’ workload cannot
automatically be assumed to increase access and control over income by that individual. UNDP
(1994) observed that most labor intensive technologies that have been promoted in most rural
settings of Africa often have proved a thorn in the flesh of women’s socio-economic success.
Even where men are putting less effort they have remained in control of cash crop incomes and
yet have priorities that are less related to household food security (Haddad, 1992). In Rwanda,
households that have impressed the WCPT have had more cases of malnutrition since cash
income earned from coffee is taken by men who use it for non house hold related expenditure.

10
Women in such households are poorer than those in the DCPT households. Therefore,
technology-promoting agencies should focus on income generation and nutritional security.
Any technology that compromises the food security of household members by taking away the
labor of women necessary for generating food and income to sustain the household should not be
recommended for adoption (Booth, 1998). In Africa, farming is one of the sources of income and
sometimes not the major one; Wage employment, selling labor and trading are common
additional sources of income for rural households. Therefore farming systems researchers in
technology generation should focus on technologies that are flexible and can be accommodated
in the household diverse production activities to maximize household utility (FAO, 2002).
Gender neutral technologies (technologies socially acceptable and easy to use by both men and
women) are being advocated for. Bhaduri (1985) argued that non-neutral technological change
occurs when the distribution of income alters as a consequence of technological change. He
defines technological change as neutral if it leaves the pattern of income distribution among
relevant groups or individuals unchanged and that technological change will be said to have a
bias in favor of a particular group/individual if the pattern of income distribution is shifted in
favor of that group/individual.
Overlooking the influence of technological change on incomes of individuals in a household by
technology intervening agency or development organization may further marginalize them
(Upadhay, 2004). Women and children do not always share in the benefits of income earned
from farm (cash crops) produce even though they may have done most of the work. For example
In Arua district (PEAP, 2004) women in the early 1990s were much less enthusiastic than men
about tobacco growing because of the men’s pronounced control over income use. In Papua
New Guinea, WCPT fetched higher income for the households than DCPT. Most households
concentrated on WCPT and had to fore go alternative activities from which they were earning
wages. Households that remained with DCPT whose labor requirements was low and used
excess labor to earn wages had there welfare better off than those who specialized in wet coffee
processing (FAO, 2002).
11
When focusing on the household, it is important to involve both men and women in the process
of introducing a technology especially in rural communities. Feedback from the women and
men to agricultural engineers should be an important input in designing and redesigning
technology for appropriateness and gender sensitivity. Men and women have different interests
even from the same technology. Men prefer technologies that make them generate more income
while women prefer technologies that help them produce as much food for the family as possible
(Haddad, 1992).

12
CHAPTER THREE
METHODOLOGY
3.1 The study area
This study was conducted in Kasese District (see appendix 1). Kasese is one of the leading
coffee growing Districts and also where wet coffee processing was predominantly being done in
Uganda (UCDA, 2005). Two parishes namely Kibandama of Kilembe Subcounty and Kitabona
of Kyarumba Sub County were purposively selected. Purposive sampling was considered
appropriate because according to RFC (2006), these areas were the leading producers of wet
processed coffee in the district. The same parishes were also the leading producers of dry
processed coffee in the district (UCDA- Kasese office, 2006) The District is located in the
Western region of Uganda and is bordered by the Districts of Bushenyi to the South, Kamwenge
to the East, Kabarole to the North East, Bundibugyo to the North and the Democratic Republic of
Congo to the West border the District. The total land area is 2,724sq.kms of which 1,647sq.kms
is available for farming activities and human settlement (NEMA, 1998). The population is
estimated at 534,000 (UBOS, 2003) giving an average density population of 324 persons per
square kilometer of settled areas. The major farming system is mixed farming systems of
banana-coffee-livestock with average farm holdings ranging from 0.4-1.2 hectares (NEMA,
1998). The food crop systems include intercropping beans or groundnuts with maize, banana,
cassava and potatoes. Cash crops include coffee, cotton, passion fruits and vanilla (DAO, 2004).
3.2 Research Design
The study was a descriptive survey. Data was collected from coffee farmers who were using the
WCPT and those who were using the DCPT. Farmers using the WCPT were asked to provide
information on its advantages, how labor is divided in their households with respect to gender
and the rate of access and control over income by different house hold members. The same
information above was collected from farmers using the DCPT in order to make comparison and

13
be able to ascertain how the WCPT has influenced gender division of labor, access and control of
income in this area.
3.3 Sampling
The target population consisted of coffee farmers using WCPT and DCPT in Kibandama Parish
of Kilembe Sub county and Kitabona Parish of Kyarumba Sub County. A list of all wet coffee
processing households in Kibandama and Kitabona parishes was obtained from Rwenzori Finest
Coffee Company while the list of dry coffee processors in the same parishes was made by the
researcher in collaboration with the local and opinion leaders in the area. Systematic sampling
was used to select households for the study. This procedure involved drawing the sample by
taking every Kth
case from the population of each of the coffee processing technology users. A
decision was taken on how many subjects one wanted in the sample (n) and since the total
population was known (N), the sampling interval was determined by dividing N by n (K=N/n).
The first respondents were randomly selected from the first Kth members on the list and then
every Kth
member of the population was selected for the sample. The area had 1203 wet coffee
processing households while dry coffee processing households were 1321. Every 20th
household
on the list was selected giving a total of 60 respondents among the wet coffee processors.
Selecting every 22nd case gave a total of 60 respondents among the dry coffee processors. The
60 respondents from the wet coffee processing cluster added to 60 respondents from dry coffee
processing cluster made the 120 respondents that were considered for the study. Systematic
sampling was preferred because of its ability to eliminate bias in selecting respondents which
reduces sampling error ( Saunders et al, 1997)

14
Only 120 respondents were selected because of limited resources. The respondents were either
household heads or their spouses who had an equal chance of being interviewed depending on
whether one is participating in coffee post harvest handling and also whether one is available.
These were found more appropriate because they had a higher stake in coffee post harvest
handling.
3.4 Data collection Instrument
The main instrument for data collection was an Interview schedule (see appendix 2). This was
developed by the researcher with the help of supervisors in line with the objectives of the study.
The interview schedule was preferred to other types of instruments because a higher completion
rate was expected given that the researcher searches for respondents and interviews them face to
face. Open ended and closed ended questions were used. Open-ended questions were used
because the respondent was able to give his/her mind about the topic that the researcher could
not think about. They also made it possible for the interviewer to probe deeper. Closed ended
questions enable the researcher to gain information about predetermined answers (Kabali and
Mwesigye, 2003). An interval scale of 1-5 (where 1 represented the lowest and 5 represented the
highest proportion of work done by individual household members in particular activities) was
adapted.
The interview schedule was pre-tested on 20 farmers; 10 in Katoke Parish of Bugoye Sub
County and 10 in Kyanya parish of Maliba Sub County. Of the 20 farmers 10 used WCPT and
10 used DCPT. Maliba and Bugoye sub-counties have impressed both the WCPT and the DCPT
(DAO, 2006). Pre testing the interview schedule in a different area enables the researcher to fine
tune the instrument before applying the tool to the target population. It also prevents monotony
of interviewing the same respondents if they happen to be in the study sample (Howe and
Eisenhart, 1994)
Professionals in the Department of Agricultural extension/Education reviewed the interview
schedule for content validity. Their views were sought on the clarity of the questions, the general

15
layer out of the instrument and whether the questions adequately covered the objectives of the
study. These professionals gave their opinions and subsequent revisions were made deleting the
irrelevant questions and adding some on relevant areas of study.
The interview schedule was tested for its reliability during the pre-testing exercise. Twenty
farmers were selected from Katoke and Kyanya Parishes of Maliba and Bugoye Sub Counties
and interviewed twice by the researcher using the same interview schedule. The interval between
the interviews was two weeks. Two weeks were appropriate because the respondent would have
forgotten the previous response. This was meant to check for the consistency of the responses
given by the same respondents during the two interviews. When the results were correlated,
reliability coefficients ranging from0.57 to0.68 were obtained. Hence the interview schedule was
considered reliable for data collection, as the reliability coefficients were reasonably high.
3.5 Data collection
Data was collected in the months of August and September 2007 by the researcher. Both primary
and secondary data was collected. Primary data was collected through face-to-face interviews in
addition to observations made on who does what activity during coffee harvesting and post
harvest handling. The most popular language in the area (Lhukonzo) was used during interviews
while the responses were recorded in English. This was done because the researcher was well
versed in both languages and hence it saved time during interviews. The respondents who were
interviewed were either house hold heads or their spouses because they were considered to have
a bigger stake in coffee post harvest handling activities carried out on their farms more than
anybody else in their households. Respondents were interviewed by the researcher to generate
information about the advantages and disadvantages of using the WCPT and the DCPT, gender
division of labor as well as access and control of income in households using the WCPT and
DCPT. Secondary data was generated through review of Rwenzori Finest Coffee Company and
UCDA documents respectively about the database of wet coffee processing farmers and where
dry coffee processing is done most in the District.
3.6 Data Analysis

16
After data collection, data was coded, entered and analyzed using SPSS computer soft ware.
SPSS was used because of its ability to handle diverse numbers of variables and test them
simultaneously (Schneider, 2005). Multiple response analysis was used to compute the
advantages and disadvantages of the WCPT and the DCPT. Percentages were computed to find
out the proportions of work done by female and male members of the household using the
WCPT and the DCPT while using the chi-square to determine whether there were significant
differences between work done by females and males. Chi square estimate enables the researcher
to know the degree of confidence to have in accepting or rejecting a hypothesis. Chi square also
tests whether or not two different groups of people are different enough in some aspects. This
made it possible to compare whether there were significant differences in workloads for males
and females participating in wet and dry coffee processing.
Pearson correlation was used to find the relationship between gender, access and control of
income among the wet and dry coffee processors. Data was then presented in tables for easy
interpretation. Pearson correlation can vary from -1 to +1. This is convenient because one can
distinguish between positive and negative correlation which helps the researcher to determine the
direction of correlations. Among both the Pearson correlation and chi square, two tailed tests
were carried out because the direction of the relationship was not known and therefore two tailed
tests would be able to handle variations in both positive and negative directions from the mean
(Howe and Eisenhart, 1994)
17
CHAPTER FOUR
FINDINGS AND DISCUSSION
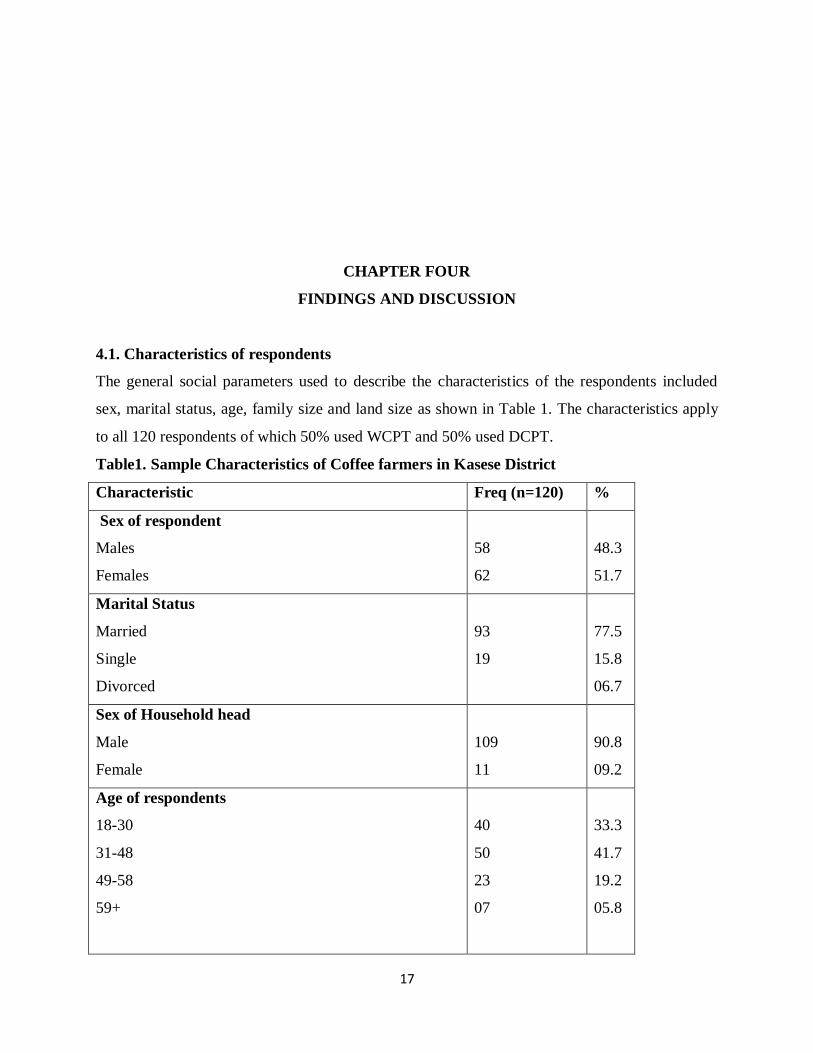
4.1. Characteristics of respondents
The general social parameters used to describe the characteristics of the respondents included
sex, marital status, age, family size and land size as shown in Table 1. The characteristics apply
to all 120 respondents of which 50% used WCPT and 50% used DCPT.
Table1. Sample Characteristics of Coffee farmers in Kasese District
Characteristic Freq (n=120) %
Sex of respondent
Males
Females
58
62
48.3
51.7
Marital Status
Married
Single
Divorced
93
19
77.5
15.8
06.7
Sex of Household head
Male
Female
109
11
90.8
09.2
Age of respondents
18-30
31-48
49-58
59+
40
50
23
07
33.3
41.7
19.2
05.8

18
Average family size (n=120)
Average land size (acres) among WCPT users(n=60)
Average land size (acres) among the DCPT users(n=60)
9
2.7
2.3
Results in table 1 above indicate that both females and males participated in coffee production
with bigger proportions of females (51.7%) than males (48.3%) participating. The estimated ratio
of females to males among the study participants was 1:1 which is similar to that estimated by
UBOS (2002) as the national average for Uganda. This means that coffee farming was an activity
for both men and women. The majority of the respondents (77.5%) were married with
only15.8% and 6.7% single and divorced respectively. This showed that labor was mostly being
provided by married men and women. Most households (90.8%) were male headed while 9.2%
households were female headed. The fact that most households were male headed meant that
men were likely to influence women to take up bigger tasks.
Majority of respondents (41.7%) were aged 31-48, followed by 33.3% aged 18-30, 19.2% aged
49-58 and those aged 59 and above were 5.8%. This was mainly a young population capable of
providing on farm labor needed for wet and dry coffee processing. Family sizes averaged nine
persons per household with a minimum of one person and a maximum of 20 persons. This is in
agreement with NEMA (1998) who found out the average family size in Uganda as nine persons.
This shows how it could be possible for the family to provide sufficient labor if well coordinated.
Since most families were depending on farming to earn a living, concerted efforts from all family
members were vital in improving the status quo of their farms to be able to generate meaningful
gains while sustaining food security
Land size also varied among the wet and dry coffee processors. The average land size for wet
coffee processors was 2.7 acres compared to 2.3 acres for dry coffee processors. This there

19
indicates that the wet coffee processors were likely to do more on farm work than dry coffee
processors since they owned more land.
4.2 Farming status among the respondents
The study participants were much involved in farming with over 78% of females being full time
farmers and about 61% males being full time farmers among the wet and dry coffee processors
respectively. The fact that females were more involved in full time farm activities shows that
they were providing more on farm labor than males. Males (30%) were more part timers in
farming than females (10%) among both wet and dry coffee processors. In both the wet and dry
coffee processors males that were not involved in farming were about 6% while there was not a
single female not involved in farming (See table 2). The above trend is in line with the findings
of UBOS (2002) that females were more involved in farming at about 76% compared to men at
61%. This could have been due to the fact men who are in most cases the controllers of labor and
income could have engaged females more in coffee processing as they engage in other
businesses using income generated from the coffee.
Table2. Farming status of household members
Farming
status
Wet coffee processors Dry coffee processors
Females
(%)
Males
(%)
X2 Asymp.sig
2 tailed
Females Males X2 Asymp.sig
2 tailed
Full time 85.2 67.0 4.545 0.033* 78.3 61.5 5.828 0.016*
Part time 14.8 28.3 4.041 0.044* 21.7 30.3 5.330 0.026*
Not farming 0 4.7 2.321 0.000* 0 8.2 3.217 0.012*
KEY: *_Significant at 0.05
From table 2, the Chi-square value for females and males involvement in farming was
statistically significant at 0.05 level of significance among the wet and dry coffee processors.

20
This means that there were significant differences between females’ and males’ participation in
farming among both the wet and dry processors with females being more full time farmers in
both the wet and dry coffee processors. This was in line with NPA (2008) which asserts that over
60% of the farm labor in Uganda is provided by women. This shows how women’s workloads
supersede that of men in this area. Thus the introduction of wet coffee processing a more labor
intensive technology was likely to have women doing more work which could increase their
workloads more. In order to productively grow both food and cash, land ownership was very
critical. In this farming system, the respondents owned land under various tenure systems.
4. 3 Land tenure systems in Kasese District
The land tenure systems ranged from customary, freehold, rented and borrowedland
(see Table 3).
Table 3: Land tenure
Land tenure WCPT n=60 (%) DCPT n=60 (%)
Customary 69.2 70.1
Freehold 51.5 46.8
Rented 40.7 50.4
Borrowed 37.6 42.9
Percentages add to more than 100 due to multiple responses
The farmers owned land under various tenure systems including, customary, free hold, rented
and borrowed. Land ownership systems were not mutually exclusive, one person/farmer could
own land under multiple tenure systems. Among the various tenure systems, customary land
ownership was the most common with 70% of the respondents under both the wet and dry coffee
processors. Other type of land tenure systems included free hold, rented and borrowed that were
common to almost equal proportion of wet and dry processors. The land tenure system
influenced the area of land under different crops. This could be the reason behind differences in
allocation of land to different enterprises (Table 4). Farmers having long term tenure systems
such as customary and free hold were more likely to engage in long term enterprises such as

21
coffee. On the contrary, farmers with temporary land tenure such as land borrowing and renting
were more engaged in annual crop enterprises.
4. 4 Farming systems in Kasese District
In Kasese, coffee is the main cash crop. Other major crops were cassava, beans, bananas (locally
called matooke), Irish potatoes and sweet potatoes (table 4). These crops were primarily grown
for home consumption though the excess was sold off to generate household income.
Table 4 Major crops grown in Kasese
Crop WCPT users n=60
(%)
DCPT users n=60
(%)
Coffee 100 100
Cassava 100 100
Beans 88.3 93.3
Bananas 73.3 71.7
Irish potatoes 45.0 61.7
Sweet potatoes 31.7 46.7
Percentages add to more than 100 due to multiple responses.
Coffee and Cassava were the major crops grown by all the participating households. Beans and
bananas were also among the common food crops as indicated by over 70% of the respondents.
Irish potatoes and sweet potatoes were least grown as indicated by 31.7% and 46.7% by the wet
and the dry coffee processors respectively. This shows how the dry coffee processors relatively
had more food than the wet coffee processors whose labor was more focused into coffee
production.
Since cassava and coffee were the competing crops for labor and land among both the wet and
dry coffee processors, it was imperative that detailed analysis of the study be based on these
enterprises.

22
Table 5 Size of land allocated to coffee and cassava by the WCPT and DCPT users
Land size (acres) WCPT n=60
DCPT n=60
Coffee Cassava Coffee Cassava
Average land size
Minimum land size
Maximum land size
1.7
0.4
6.0
0.6
0.2
2.4
1.3
0.3
4.0
0.9
0.3
3.0
Arabica coffee was the major cash crop produced by farmers in Kasese District. Due to the
importance of the crop, each household cultivated coffee. From Table 5, the wet coffee
processors had allocated more land to coffee with an average of 1.7 acres while the dry coffee
processors had allocated 1.2 acres. The minimum land allocated to coffee was 0.4 and 0.3 acres
among the wet coffee processors and dry coffee processors respectively. The maximum land
allocated to coffee was 6 and 4 acres among the wet and dry coffee processors respectively. The
fact that wet coffee processors had allocated more land to coffee than the dry coffee processors
shows how the wet coffee processors were more interested in coffee due to higher prices they
were fetching from their coffee sales. This also means that women who are more involved in
coffee farming were likely to get much loaded with coffee work among the wet coffee processors
than the dry coffee processors.
On average wet coffee processors had allocated less (0.6 acres) of land to cassava growing
compared to (0.9 acres) for dry coffee processors. This could be due to the value attached to
cassava as an enterprise. The dry coffee processors could be attaching more value to cassava
production than the wet coffee processors because their dry processed coffee was bringing in
lesser income compared to wet processed coffee resulting into more land allocation to cassava
growing so as to strike a balance in income. The minimum amount of land allocated to cassava
growing by wet coffee processors was 0.2 acres while the maximum was 2.4 acres. The
minimum land allocated to cassava growing by dry coffee processors was 0.3 acres while the
maximum was 3 acres. This further explains the fact that dry coffee processors value cassava

23
more than wet coffee processors. This stemmed from the fact that cassava production and sales
still makes economic sense to dry coffee processors who sell their coffee cheaply compared to
wet coffee processors (Ushs 3500 per Kg of wet processed coffee and Ushs 2400 per Kg of dry
processed coffee).
4.5 Coffee production in Kasese
Farmers engaged in wet and coffee processing were likely to harvest varying quantities of clean
coffee as the amount of care for coffee varied.
Table 6: Quantity of Coffee generated by coffee farmers in Kasese per acre
Quantity (Kgs) per season WCPT users n=60
DCPT users n=60
Average yield
Minimum yield
Maximum yield
490
209
632
403
130
556
Due to differences in commitment and care allocated to coffee production, the coffee yield also
varied among the wet and dry coffee producers (see Table 6). On average, Wet coffee processors
realized higher yields (490 Kgs per acre) as compared to the dry coffee processors (403Kgs) for
dry coffee processors. This was because wet coffee processors were applying better production
practices gained from the trainings by the WCPT promoting extension staff. Therefore women in
wet coffee processing households were likely to have more workloads than their counter parts
among the dry coffee processors due to the fact that women in this area do more work on the
farm than males. Farmers in this area have got different views about the advantages of the coffee
post harvest handling technologies which are mainly centered on price of coffee generated and
labor intensiveness of technologies.
4. 6 Advantages and Disadvantages of the Wet and dry coffee processing methods

24
Choice between WCPT and DCPT depended largely on farmers’ understanding of the
advantages and disadvantages of the technology. Below are the advantages for which farmers
decided to take up either of the processing technologies;
4. 6.1 Advantages of wet and dry coffee processing
Higher price of the processed coffee was the main basis upon which farmers decided to take up
WCPT while access to credit was the least basis (Table 7). Being less expensive was the main
basis upon which farmers decided to take on DCPT while other advantages of dry coffee
processing included the technology being less labor intensive, less time consuming and
immediate payment for coffee on delivery to the market.
Table 7 Advantages of wet and dry coffee processing
Advantages WCPT (n=60)
%Response
DCPT (n=60)
%Response
Higher coffee price 100 -
Quick coffee drying 94.7 -
Clean coffee generated 86.0 -
Coffee management training 84.2 -
On farm coffee husks disposal 82.5 -
Access to credit 62.4 -
Not expensive - 71.7
Less labor intensive - 65.0
Less time consuming - 63.3
Immediate coffee payment - 63.2
The percentages add up to more than 100 due to multiple responses.
From table 7 above, all the farmers (100%) using the WCPT found it advantageous because the
coffee generated by the technology fetched higher prices of Ushs 3500 per kilogram compared to
coffee generated by the DCPT which was sold at Ushs 2400 per kilogram. Other advantages of
the WCPT included quick coffee drying (12-14 days) reported by 94.7%, clean coffee

25
generation (86%), through drying coffee on suspended wire mesh during the first four days of
drying and then on tapelines between 5-14 days of coffee drying. Access to coffee management
training by Rwenzori Finest Coffee extension staff was reported by 84.2% of the farmers while
(82.5%) reported that coffee husks generated on farm were used to make on-farm manure.
Among dry coffee processors, the DCPT being less expensive (71.7%) than the WCPT in terms
of buying wire mesh for coffee drying, tapelines, pulpier among other equipments was the main
advantage they found associated with the technology. Other advantages of dry coffee processing
included the technology being less labor intensive as reported by 65%, less time consuming
(63.3%) and immediate coffee payment on delivery to the market (63.2%).
4. 6.2 Disadvantages of wet and dry coffee processing
The wet and dry coffee processing methods had a range of disadvantages (Table 8)
Table 8 Disadvantages of wet and dry coffee processing
Disadvantages of WCPT
%Response(n=60) % Response(n=60)
Labor intensive 90.9 -
Expensive 84.1 -
Time consuming 81.8 -
Leads to food insecurity 77.3 -
Delayed coffee payment 29.5 -
Low coffee prices - 93.3
Coffee drying takes long - 75.0
Generated coffee less clean - 53.3
Off farm coffee husks disposal - 56.7
Summation of the percentages adds up to more than 100 due to multiple responses.
The main disadvantage of wet coffee processing was being labor intensive as reported by 90.9%
of the respondents due the fact that it has many activities. These activities include cherry
pulping, selective cherry picking, fetching water for coffee processing, cherry sorting and drying.
Other disadvantages of wet coffee included being expensive as it involved buying of pulpier,
tapelines, and drying wire mesh (84.1%) which poor farmers could not afford. The WCPT was

26
time consuming as it involved selective cherry picking. Pulping of coffee on the same day of
picking it which sometimes makes the farmer work up to 15hours a day (81.8%), complicated
the work more. This has led to food insecurity because it takes a way some labor needed in food
production and yet men who are the major controllers of income earned may be less willing to
spend money earned on food (77.3%) and delayed coffee payment (29.5%) where by it can take
one or two weeks for RFC to pay the farmers for coffee supplied.
This there shows that though farmers were motivated to use the WCPT due to its associated
advantages, selling coffee on credit was demoralizing as farmers need the money to meet the day
to needs.
The main disadvantage of dry coffee processing reported by 93.3% of the respondents was
generating coffee that fetches a lower price of Ushs 2400 compared to Ushs3500 per kilo offered
for wet processed coffee. Other disadvantages of dry coffee processing included; coffee drying
takes a long time about 4-6 weeks (75%) which prompts financially needy farmers to sell their
raw coffee at lower prices. Farmers (56.7%) pointed out that they were losing soil fertility
because of disposing coffee husks to owners of coffee hulling factories mostly located in Kasese
town. Farmers (53%) asserted that the coffee generated by the dry coffee processing method was
less clean as it involved drying coffee on the bare ground. This results into low quality coffee
that attracts lower prices.
4. 7 House Hold Gender Division of Labor among both the wet and dry coffee processors
Labor is one of the most constraining factors when a new innovation is introduced (Whitehead,
1985). This study therefore endeavored to find out the kind of labor changes that took place in
Kasese District when a new coffee processing method was introduced among the coffee farmers.
A farmer in Kitabona Parish Kyarumba Sub County was quoted saying “I will stop selling my coffee to Rwenzori Finest Coffee Company if they do not stop making us wait for a week before we can be paid. I do not know where the proprietors come from. Suppose they disappear, where can we go to ask for our money?”

27
The wet coffee processing method, unlike the dry processing methods involved a range of
activities to enable the farmer produce the quality of coffee that was required to meet
international standards (see table 9). The activities ranged from coffee weeding, coffee picking,
carrying water for coffee processing, coffee pulping and carrying coffee to the market and these
were performed in varying proportions by both men and women.
Table 9: Gender division of Labor within coffee processing technologies
Activity Type of coffee processors
Wet coffee processors (n=60) Dry coffee processors (n=60)
% F % M X2 Asymp.Sig %
F
% M X2 Asymp.Si
g
Weeding 33 67 36.667 0.009* 38 62 20.500 0.037*
Coffee picking 40 60 34.500 0.002* 25 75 52.700 0.000*
Carrying water 70 30 14.667 0.033* - - - -
Coffee pulping 17 83 9.908 0.007* - - - -
Transportation 66 34 32.000 0.032* 68 32 28.300 0.000*
Marketing 20 80 8.453 0.003* 24 76 22.500 0.003*
Key: X2- Chi square, * -Significant at 0.05 (2 tailed), F -Females and M-Males
Weeding, coffee picking, transportation and marketing were common activities for both the wet
and the dry coffee processors. Among these activities however, a significant proportion of men

28
(over 60% among both processors) participated more in the weeding, picking and marketing of
the coffee than the women. This was because coffee fetched more income than other farm
enterprising. Traditionally, men associated themselves more with income generating activities in
households. They, in principle, take the responsibility of meeting household bills though this
may not be true in practice. It was observed that men’s interest in marketing the crop (80%) was
mainly to control the money. Some men even lied the amount of money realized from their
wives so that they could spend it to meet their individual needs other than the family/household
need.
The trend was however reversed with respect to the transportation of the coffee to the market.
Under this activity, more women (over 65%) than men (less than 35%) were involved among the
wet and the dry processors. Though the women did not participate in the actual selling of the
coffee, by cultural norms they were obliged to carry coffee to the market.
Table 10: Gender provision of labor across the coffee post harvest handling technologies
Activity Gender WCPT DCPT X2 Asymp.Sig
Weeding F 33 38 36.667 0.009*
M 67 62 33.212 0.278
Coffee picking F 40 25 35.540 0.001*
M 60 75 22.321 0.002*
Carrying water F 70 0 34.523 0.002*
M 30 0 34.435 0.000*
Coffee pulping F 17 0 8.234 0.000*
M 83 0 32.212 0.000*
Transportation F 66 68 5.437 0.714
M 34 32 11.363 0.276
Marketing F 24 20 6.572 0.563
M 80 76 7.681 0.433
29
Key: X2- Chi square, * -Significant at 0.05 (2 tailed), F -Females and M-Males
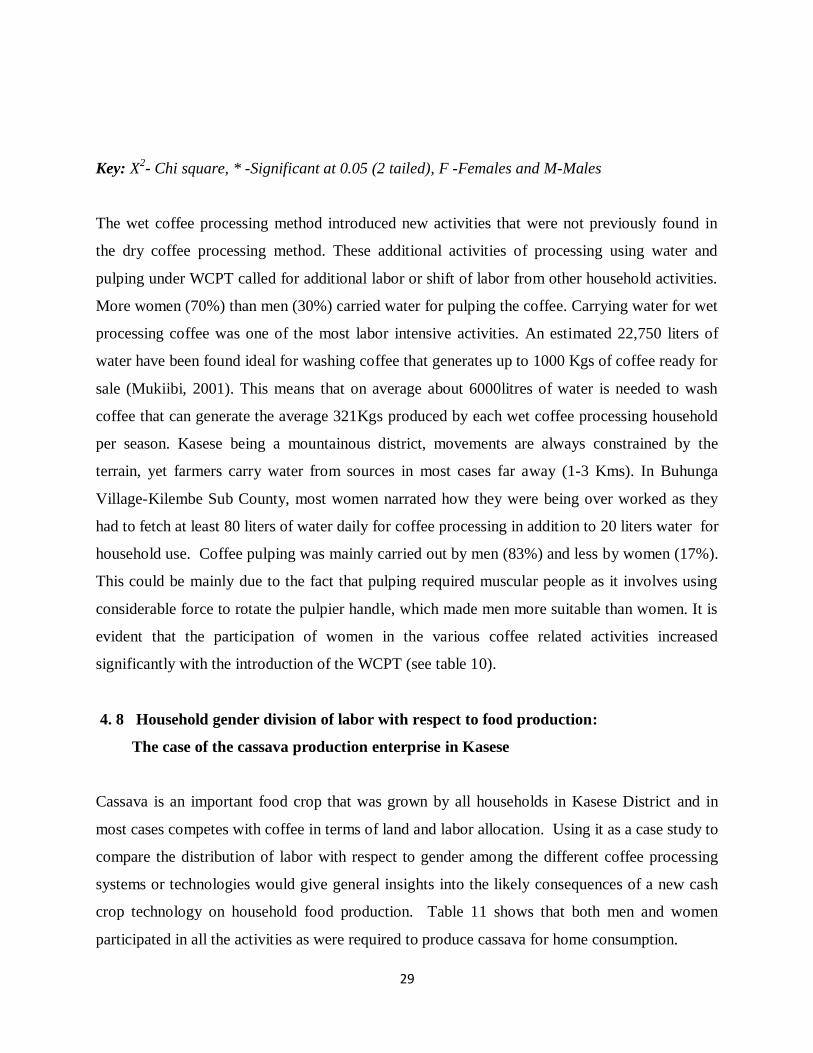
The wet coffee processing method introduced new activities that were not previously found in
the dry coffee processing method. These additional activities of processing using water and
pulping under WCPT called for additional labor or shift of labor from other household activities.
More women (70%) than men (30%) carried water for pulping the coffee. Carrying water for wet
processing coffee was one of the most labor intensive activities. An estimated 22,750 liters of
water have been found ideal for washing coffee that generates up to 1000 Kgs of coffee ready for
sale (Mukiibi, 2001). This means that on average about 6000litres of water is needed to wash
coffee that can generate the average 321Kgs produced by each wet coffee processing household
per season. Kasese being a mountainous district, movements are always constrained by the
terrain, yet farmers carry water from sources in most cases far away (1-3 Kms). In Buhunga
Village-Kilembe Sub County, most women narrated how they were being over worked as they
had to fetch at least 80 liters of water daily for coffee processing in addition to 20 liters water for
household use. Coffee pulping was mainly carried out by men (83%) and less by women (17%).
This could be mainly due to the fact that pulping required muscular people as it involves using
considerable force to rotate the pulpier handle, which made men more suitable than women. It is
evident that the participation of women in the various coffee related activities increased
significantly with the introduction of the WCPT (see table 10).
4. 8 Household gender division of labor with respect to food production:
The case of the cassava production enterprise in Kasese
Cassava is an important food crop that was grown by all households in Kasese District and in
most cases competes with coffee in terms of land and labor allocation. Using it as a case study to
compare the distribution of labor with respect to gender among the different coffee processing
systems or technologies would give general insights into the likely consequences of a new cash
crop technology on household food production. Table 11 shows that both men and women
participated in all the activities as were required to produce cassava for home consumption.

30
Table 11: Gender division of cassava labor within the coffee post harvest handling
technologies
Activity Type of coffee processors
Wet coffee processors (n=60) Dry coffee processors (n=60)
% F % M X2 Asymp.Si
g
%
F
% M X2 Asymp.Sig
Land clearing 41 59 7.950 0.000* 30 70 5.328 0.000*
Planting 80 20 57.333 0.000* 75 25 24.326 0.002*
Weeding 90 10 39.167 0.000* 70 30 20.157 0.000*
Harvesting 81 19 8.240 0.001* 75 25 22.253 0.000*
Transportation 83 17 6.752 0.000* 70 30 15.506 0.000*
Marketing 98 2 4.537 0.000* 89 11 6.679 0.000*
Key: X2- Chi square, * -Significant at 0.05 (2 tailed), F -Females and M-Males
Across the two processing technologies women significantly contributed labor to cassava
production activities than the men. Among the wet coffee processors women’s involvement in
various cassava activities was; (80%) planting, (90%) weeding, harvesting (81%), transportation
(83%) and (98%) marketing of cassava. A similar trend was observed among the DCPT
farmers: Over 70% of all the women were engaged in weeding, transportation, planting,
harvesting and marketing of the crop. Though men were also engaged in these activities as well,
their participation was very minimal with (20%) engaged in planting, (10%) weeding, (19%)
harvesting and (17%) transporting cassava to the market. Nonetheless, men’s participation in
cassava production was more pronounced during land clearing but this does not mean that
women did not participate in land clearing as well. Further scrutiny of the results indicates that
men’s participation in cassava land clearing, planting, weeding, harvesting and transportation to
the market has significantly reduced among the wet coffee processors (see table 12).
Table 12: Gender provision of cassava labor across the two coffee post harvest handling
technologies

31
Activity Gender WCPT DCPT X2 Asymp.Sig
Land clearing F 41 30 4.159 0.002*
M 59 70 24.353 0.002*
Planting F 80 75 6.753 0.723*
M 20 25 9.733 0.324*
Weeding F 90 70 8.241 0.000*
M 10 30 3.9167 0.000*
Harvesting F 81 75 9.333 0.423*
M 19 25 3.546 0.002*
Transportation F 83 70 8.689 0.000*
M 17 30 20.235 0.000*
Marketing F 98 89 8.539 0.000*
M 2 11 6.859 0.003*
Key: X2- Chi square, * -Significant at 0.05 (2 tailed)
The labor provided by men in cassava farming had significantly reduced due to adoption of the
WCPT. That meant that women’s work load increased significantly since men were doing less
work in cassava production. The reduction in males’ involvement in cassava activities was
because coffee production was more profitable with the introduction of the WCPT as compared
to cassava production which made men concentrate more on coffee leaving most cassava work to
women.
A coffee farmer in Kyarumba Sub-County had this to say about cassava and coffee production.
The above script signified that coffee production was first priority for this male farmer and
probably many more male farmers were thinking in the same way about coffee production.
“I can no longer waste time in cassava gardens because I have been poor for a long time while producing a lot of cassava. Now that wet processed coffee is gold, I must concentrate on my coffee with all my children and wife. Whoever does not want to work on my coffee must leave my home.”

32
Women on the other hand though otherwise as verified by the lamentation of one female farmer
in Kilembe sub-county during the coffee harvesting season of April, 2008.
This shows that though women were providing labor in wet coffee processing, they were
benefiting less form the income generated from coffee sells. Since women have to work hard in
both cash and food crop enterprise, it is more likely that more labor is likely to be shifted from
food to coffee production, a situation that will make most households food insecure. The
situation was even aggravated by the fact that men were unwilling to invest in food purchase
after the sales of the coffee.
4. 9 Household Gender division of non- farm sources of income labor.
The different household members participated in other off farm income generating activities to
supplement the farm income. Table 13 shows that both men and women among the wet and dry
coffee processor participated in civil service, small business and labor sales.
Table 13: Gender division of non farm income labor within the coffee post harvest
handling technologies.
Activity Type of coffee processors
Wet coffee processors (n=60) Dry coffee processors
% F %
M
X2 Asymp.Sig % F %
M
X2 Asymp.Sig
Civil service 35 65 5.723 0.000* 38 62 18.867 0.002*
Business 38 62 17.546 0.041* 45 55 2.770 0.001*
Selling labor 42 58 3.167 0.043* 58 42 3.934 0.042*
Key: X2- Chi square, * -Significant at 0.05 (2 tailed), F -Females and M-Males
For both types of processors, more men than women were more involved in off farm income
generating activities. Men were significantly involved in civil service (64.4%) and (61.4%) for
DCPT and WCPT than females at 36.4% for WCPT and 38.6% respectively and all other non
“We are going to suffer from famine in this home because we have been captured here on coffee. Rats and weeds are destroying our cassava and yet this man is going to spend the coffee money in Kasese Town without buying for us food.”

33
farm sources of income. There was a general decline of women engagement in non farm sources
of income after adopting the WCPT an indication that their workloads had increased due to
participation in the WCPT as indicated in table 14.
Table 14 Gender Provision of non-farm income labor across the technologies
Activity Gender WCPT DCPT X2 Sig.(2tailed)
Civil service F 35 38 5.483 0.714
M 65 62 11.031 0.276
Business F 38 45 31.124 0.002*
M 62 55 29.700 0.300
Selling labor F 42 58 31.667 0.000*
M 58 43 3.965 0.000*
Key: X2- Chi square, * -Significant at 0.05 (2 tailed), F -Females and M-Males
The proportion of work done by females and males did not significantly change as a result of
using the WCPT in civil service and business activities. However, there was a significant decline
in females’ involvement in selling labor which can be attributed to their being busy on the farm
doing most of the cassava work and also participating in the WCPT. The rate at which males
were selling labor significantly increased among the wet coffee compared to females as they
could use any off coffee time to work on other farms while women would allocate this time to
cassava cultivation. Since the trend of gender participation in non- farm activities had changed
due to the adoption of the WCPT, this was likely to affect the way domestic activities were
being shared between males and females.
4. 10: Household Gender division of domestic activities.
In addition to production of food and cash crops, the various household members provided their
labor to meet the various reproductive roles. The reproductive roles included; fetching water for
home use, preparing food, collecting fire wood, child care and home cleaning (See table 15)
Table15: Gender division of domestic activities within the coffee post harvest handling
technologies

34
Activity Type of coffee processors
Wet coffee processors (n=60) Dry coffee processors
% F % M X2 Asymp.Sig % F % M X
2 Asymp.Sig
Fetching
water
80 20 15.321 0.002* 84 16 12.33 0.000*
Preparing
food
86 14 5.237 0.000* 83 17 7.663 0.000*
Collecting
fire wood
80 20 5.736 0.001* 84 16 23.067 0.000*
Child care 75 25 24.300 0.002* 74 26 2.349 0.001*
Home
cleaning
74 26 23.533 0.003* 70 30 7.865 0.000*
Key: X2- Chi square, * -Significant at 0.05 (2 tailed), F -Females and M-Males
Results in table 15, indicate that females were significantly doing more domestic work than
males in all activities among both the WCPT and DCPT. This was being done in addition to the
extra labor being put into wet coffee processing. The introduction of wet coffee processing
therefore did increase the workload for women.
Table 16: Gender Division of domestic activities across the coffee post harvest handling
technologies
Activity Gender WCPT DCPT X2 Asymp.Sig
Fetching water
F 80 84 3.632 0.891
M 20 16 3.208 0.073
Preparing food F 86 83 5.473 0.276
M 14 17 11.236 0.132
Collecting fire wood
F 80 84 5.689 0.058
M 20 16 5.048 0.080
Child care F 75 74 2. 857 0.240
M 25 26 2.556 0.279

35
Home cleaning F 74 70 2.899 0.089
M 26 30 2.260 0.132
Key: X2- Chi square, * -Significant at 0.05 (2 tailed), F -Females and M-Males
Domestic work remained predominantly a responsibility of women because traditionally women
are obliged to do such chores. However, there was an increase in men’s participation in fetching
water for domestic use in households using the WCPT which was attributed to the fact that it was
no longer strongly culturally resisted as men were actively participating in fetching water for use
in wet coffee processing. Owing to the fact that workloads for females reduced due to males
increased participation in fetching water which is one of the most labor intensive domestic
activities as sources of water are downhill.
4. 11: Household Gender division of communal activities
In addition to participating in various on farm, off farm and domestic activities, the different
household members participated in communal activities since it was an obligation to serve the
community as a way of promoting community development and family social capital. Table 17
shows that both men and women among the wet and dry coffee processor participated in
communal road maintenance, building schools, churches and ceremonial activities.
Table 17: Gender division of communal activities within the coffee post harvest handling
technologies
Activity Type of coffee processors
Wet coffee processors (n=60) Dry coffee processors(n=60)
%
F
%
M
X2 Asymp.Sig % F % M X
2 Asymp.Sig
Communal 25 75 24.323 0.002* 33 67 3.632 0.008*

36
Road
maintenance
Community
school work
35 65 29.733 0.003* 35 65 32.733 0.001*
Church work 51 49 5.407 0.717 52 48 5.456 0.714
Ceremonial
Work
63 37 15.923 0.000* 65 35 11.325 0.012*
Key: X2- Chi square, * - Asymp. Significant at 0.05 (2 tailed), F -Females and M-Males
The trend of gender participation in communal work remained the same for both males and
females in the WCPT and DCPT technologies with males participating more in communal road
construction and school building than females while females participated more in church work
and ceremonial activities than males. However for communal road maintenance, there were
significant changes in the way of gender participation (See table 18)
Table 18: Gender provision of communal activities labor across the coffee post harvest
handling technologies
Activity Gender WCPT DCPT X2 Asymp.sig
communal road maintenance F 25 33 5.332 0.039*
M 75 67 5.419 0.025*
Community school work F 35 35 6.473 0.876
M 65 65 4.727 0.932
Church work F 51 52 2.978 0.226
M 49 48 5.048 0.080
Ceremonial work F 63 65 1. 803 0.406
M 37 35 2.356 0.269
Key: X2- Chi square, * -Significant at 0.05 (2 tailed), F -Females and M-Males

37
The study showed that DCPT user women were more involved in communal activities than their
counter parts participating in the WCPT. This could have been due the fact that the wet coffee
processing females were busy with the coffee work which reduced their participation in road
work. On the contrary the number of men participating in road construction was significantly
higher among the wet coffee processors than the dry coffee processors. This could have been due
the fact that men were hiring laborers to dig their assigned road portions.
4. 12 Relationship between access to income and gender among both the wet and dry coffee
processors.
Analysis of the relationship between access to resources and gender was carried out to determine
whether house hold members were benefiting from the labor invested in generating these
resources. The study, carried out among the wet and dry coffee processors intended to compare
how the members within the two categories accessed income generated both on and off farm.
The sources of income included coffee, cassava, civil service, small business enterprises and
selling labor (See table 19).
Table 19: Relationship between access to incomes and gender among wet and dry coffee
processors
Income Wet coffee processors Dry coffee processors
P. corr Sig.level P.corr Sig.level
Coffee 0.702 0.011* 0.785 0.002**
Cassava 0.370 0.004** 0.096 0.465
Civil service 0.361 0.142 0.226 0.083
Business 0.304 0.220 0.078 0.555
Selling labor 0.553 0.017* 0.081 0.234
Key: ** Correlation is significant at 0.01level (2 tailed), * Correlation is significant at 0.05 level
(2 tailed), P.corr- Pearson correlation, Sig.level –significance (2 tailed)
Among both the wet and dry coffee processors, there existed significant correlations between
access to coffee income with gender. This implies that gender determined how one would access

38
income earned from coffee. It is important to note that the strong positive correlation that existed
between access to coffee income and gender could have indicated that men were accessing
coffee cash more than women. Studies carried out in Mbale indicated that men were accessing
coffee income more than women. In one instance a woman in Mbale said,
“I can not put much effort in coffee production because the income may as be used to marry a
third wife” (PEAP, 2004)
In addition, the strong positive correlations that existed between gender and access to sell of
labor income among wet coffee processors could have indicated that men had more access to sell
of labor incomes than women among both the wet coffee processors. This is because WCPT men
were involved in selling labor among wet coffee processors than women. No significant
correlations exited between accesses to cassava, civil service, small business, sell of labor
incomes and gender among dry coffee processors indicating that one’s gender could not
influence access to this income. This was because civil servants tend to spend their incomes in a
way that all household members benefit while cassava where women had more stakes was
generating income to sustain all household members. Also the small businesses were being
operated by women which included vending fish, cassava flour, maize flour, ground nuts, and
onions among others. Since women are at the fore front to food provision in the household, then
it was more likely that all gender in the household could access their income relatively equally.
Important to note is the significant relationship between to cassava income and gender among the
wet coffee processors and not among the dry coffee processors. This could be due to the fact that
since men’s income had increased due to selling wet processed coffee at higher prices, they no
longer had a lot of interest in cassava which made women access more cassava income.
4. 13 Relationship between control of incomes and gender among wet and dry coffee
processors
Control of income is synonymous to ownership of income (PEAP, 2004). It is ones control of
resources that enables him or her to freely make decisions on how to allocate resources (Haddad,
1992). The study compared how income both on farm and off farm was being controlled with
respect to gender among both the wet and dry coffee processors (see table 20).

39
Table 20: Relationship between control of income and gender among wet and dry coffee
processors
Income Wet coffee processors Dry coffee processors
P. corr Sig.level P.corr Sig.level
Coffee 0.788 0.000** 0.891 0.002**
Cassava 0.519 0.000** 0.326 0.031*
Civil service 0.439 0.003** 0.358 0.005**
Business 0.304 0.020* 0.329 0.005**
Selling labor 0.673 0.013* 0.537 0.001**
Key: ** Correlation is significant at 0.01level (2 tailed), * Correlation is significant at 0.05 level
(2 tailed), P.corr- Pearson correlation, Sig.level –significance (2 tailed
Table 20 above shows that there were positive correlations between control of coffee, cassava,
civil service and sell of labor incomes with respect to gender among both the wet and dry coffee
processors. This shows how men were in control of coffee cash while women were in control of
cassava cash among the WCPT and DCPT users. This implies that men who use the WCPT were
richer than men using the DCPT since the wet processed coffee fetches higher price than the dry
processed coffee. Women among the WCPT users were poorer than the DCPT user women since
less cassava where women get income would be produced among WCPT users compared to
DCPT users since more land has been allocated to cassava production among DCPT than WCPT.

40
CHAPTER FIVE
CONCLUSIONS, IMPLICATIONS AND RECOMMENDATIONS
5.0 Summary
The purpose of the study was to find out how the WCPT has influenced gender division of labor
in households of Kasese District. The population of the study included all wet and dry coffee
processors in the study area. Both qualitative and quantitative data was collected using an
interview schedule through face to face interviews. A Chi square test was used to find out the
proportions of work done by males and females in households using the WCPT and the DCPT.
Pearson correlation coefficients were used to find out the relationship between gender and access
to income among both the wet and dry coffee processors.
5.1 Conclusions
Females in this area were more full time farmers compared to males among both the wet and dry
coffee processors. In terms of land holding, wet coffee processors had more land (2.7 acres on
average) than dry coffee processors (2.3 acres on average). Wet coffee processors had also
allocated more land to coffee farming (1.7 acre on average) than the dry coffee processors (1.3
acres on average). Wet coffee processors were also producing more clean coffee per acre
(490Kgs on average) than dry coffee processors (403Kgs). On the contrary, dry coffee
processors had allocated more land to cassava growing (0.7 acres on average) than wet coffee
processors (0.6 acres on average) which also made them produce more cassava than wet coffee
processors.

41
In terms of labor provision, females and males were doing different activities among the wet
coffee processors. Females were more in carrying water for coffee processing and transporting
coffee to the market while males were more in weeding, coffee picking, pulping and marketing.
The wet coffee post harvest handling technology had increased the work loads for females and
males as it involved more labor intensives activities including pulping and carrying water for
coffee processing which are not in the dry coffee post harvest handling technology. Females
were doing more work than males in terms food production in this area. Females work loads in
food production had increased among wet coffee processors than dry coffee processors as men
had with drawn most of the labor from food production to participate in wet coffee processing. In
addition females were doing more domestic work than males among both the wet and dry coffee.
Also among both the wet and dry coffee processors, females were doing more communal work in
church and ceremonies while males were doing more work in school and communal road
maintenance.
Men among both the wet and dry coffee processors had more access to coffee income than
females while females had more access to cassava incomes than males among both the wet
coffee and dry processors. the same trend was observed in terms of control over income where
by among both the wet and dry coffee processors, males had more control over coffee income
while women had more control over cassava income.
5.2 Implications

42
The fact that females were more full time farmers than males in this area indicate that females
were doing more on farm activities than males. Also allocating more land to coffee and less to
cassava by wet coffee processors meant more coffee harvest and income were generated.
However males had more access and control over coffee cash than women. Males in this area
rarely provide food for the household even if they get money. This meant that wet coffee
processing households would be food insecure as less land was available for food production
compared to dry coffee processing house holds. Females in wet coffee processing house holds
were worse off than those in dry coffee processing households since less land and labor was
available for cassava production where they have more access and control over compared to dry
coffee processors.
Females in wet coffee processing households had more work loads than females in the dry coffee
processing households. This was due to WCPT being more labor intensive than the DCPT as it
brought additional labor intensive activities for females like fetching water for coffee processing
as well as water for domestic use.
5.3 Recommendations
Since Uganda is on the path of agriculture modernization, innovations that improve the quality of
agricultural products like coffee are of high priority. The WCPT need to be modified. Strategies
that will make the technology less labor intensive need to be adopted for example house hold
water harvesting.
43
There is need for RFC which is promoting the technology to sensitize wet coffee processors on
how males and females can share work load equitably so as to avoid over loading females with
work.
There is need for RFC to sensitize males in this area on how they should equitably share coffee
income with females since males were benefiting more than females yet they are both actors in
coffee production.
This study was only done in a small area of two sub-counties of Kasese district due to resources
constraints. The study should be replicated in other wet coffee processing districts and agro
ecological zones. Information gathered in other districts could provide an appropriate yard stick
for making appropriate technology redesign recommendations
Costs benefit analysis of the technology to find out its economic importance need to be carried
out to find whether it is worth promoting for use by all farmers.

44
REFERENCES
Agrawal, B. (1980). Technological Change and Rural Women in Third World Agriculture. Some
Analytical Issues and an Empirical Analysis. London: University of Sussex. Pp58-70.
Agrawal, B. (1985). Women and Technological change in Agriculture: The Asian and African
experience; in Ahmed (ed) Technology and Rural women: conceptual empirical issues,
London: George Allen and Un win Ltd. Pp79.
Aryl, D., Jacobs, L. C., Ravavieh, A.(1972). Introductory Research in Education; Orlando,
Florida: Holt, Rinehart and Wiston, Inc.
Annabel, R. (1994). Women and the Environment .Zed Books; London, United Kingdom.
Banergie,J. (1985). Implications of Technology for Women in Rural Sector; In S.C Jain (ed.),
Women and Technology, India: Rawat Publications.Pp123.
Bhaduri, A.(1985).Technological Change and Rural Women: A conceptual Analysis in I. Ahmed
(ed.), Technology and Rural Women: Conceptual and Empirical Issues, London: George
Allen and Unwin Ltd.
Bibangamba, J.R. (1989). Managing Rural Development in Uganda: Uganda
Co-operative Alliance Development papers. Kampala – Uganda. Pp30-32.
Booth, D. (1998) Participation and combined Methods in African Poverty Assessment:
Renewing the Agenda; London: Social Development Division, Department.Pp89.
District Agriculture Office-Kasese (2006). Agriculture Situation Report. Kasese, Uganda. Pp10
Everts, S. (1998). Gender and Technology: Empowering Women, Engendering and
Development; Amsterdam Tool Consult. Netherlands. Pp102-103
Food Agriculture Organisation (2004). Post harvest handling and processing of Coffee in African
countries: Nairobi Kenya.Pp4-8
Food Agriculture Organisation (2002). The State of Food and Agriculture. Agriculture and
Global Public Goods. Ten years after the Summit. Rome, Italy; Information Division.
Pp25-62.
Haarer, A.E. (1962). Modern Coffee Production (2nd
Ed.) Ebbenezer Baylis and Sons Ltd.
London, UK. Pp2-6
45
Haddad, L. (1992). The impact of Women Employment status on House holds Food security at
Different Income levels in Ghana: Food and Nutritional Bulletin14, No.4. Pp 341-344.
Accra Ghana.
Howe, K.and Eisenhart, M. (1990). Standards for Qualitative and Quantitative Research; A
prolegomenon: Educational Researcher, 19(4): PP2-9
International Trade Council (1992). Coffee. An Exporter’s Guide. Community Hand Book:
UNCTAD/GATT Geneva. Pp39-46.
Jameson, J. D. (1970). Agriculture in Uganda (2nd
Ed.). Oxford University Press. London, UK.
Kabali, M. and Mwesigye, F. (2003). Basic business Statistics (1st Ed.) Basic Business Books,
Kampala- Uganda. Pp23.
MAAIF (1993). Clonal- Robusta Coffee Hand Book part III. Farming Systems Support Program.
Ministry of Agriculture, Animal Industry and Fisheries. Entebbe, Uganda.
MFED (1997). Back ground to the Budget. Ministry of Finance and Economic Development.
Kampala, Uganda.
National Environmental Management Authority (1998). Kasese District Environmental Profile.
Kampala Uganda.
Poverty Eradication Action Plan (PEAP), (2004). Ministry of finance, planning and Economic
Development: Kampala Uganda Dec; 2004.
Rwamaswamy, V. and Sengupta, S. (2002). The Treadle Pump Changing the Lives of Women
and Men; Bangalore: Human and Institutional Development Forum.PP123-131.
Rwenzori Finest Coffee Company (2006). Coffee Quality Improvement Annual Report for the
year 2005-2006. Kasese, Uganda. Pp13-20.
Schneider, K.D.(2005). Quantitative Data. Over view of statistical Methods and Coefficients.
IECFA, University of Geneva. Pp247-270
Scott, G. L. (1985). The Impact of Technological Choice on Rural Women in Bangladesh.
Problems and Opportunities. IBRD.
Ssekikoobo, A.C (1995). The role of women in food security in Uganda: A case study of
Masaka District. A report on A Case study sponsored by Win rock International USA.
Stamp, P. (1990). Technology, Gender and Power in Africa. Ottawa IDRC (International
Development Research Centre).

46
Uganda Bureau of Statistics (2002). Uganda Population and Housing Census.
www.ubos.org
Uganda Coffee Trade Federation (2003). Uganda’s Special Quality. The Coffee Year Book
2002-2003. Kampala, Uganda.Pp50 &54
Uganda Coffee Trade Federation (2001). The Pace for Uganda’s Coffee. Coffee Year Book
2000-2001.Kampala, Uganda. Pp32, 56-59 &67
Uganda Coffee Trade Federation (1999). Uganda Coffee News. Volume 2. No.2 Kampala,
Uganda. Pp8-12. No Author?
Upadhay, B.(2004). Gender Aspects of Small Holder Irrigation Technology: Insights from
Nepal; Journal of applied irrigation Science 39(2). Pp 300-330.
White head, A. (1985). Effects of Technological change on Rural women A review of
Analysis on concepts in Ahmed (ed), Technology, Rural women and Empirical issues,
London: George Allen and Unwin Ltd.
World Bank (1994). Enhancing Women’s Participation in Economic Development. Washington
D.C. Pp19.

47

48
INFLUENCE OF THE WET COFFEE POST HARVEST HANDLING TECHNOLOGY
ON GENDER DIVISION OF LABOUR WITH IN HOUSEHOLDS OF KASESE
DISTRICT.
INTERVIEW SCHEDULE FOR WET COFFEE PROCESSING FARMERS.
1. SECTION A: PERSONAL DATA
Circle or fill the blank spaces with the appropriate answers
a) Respondent number -----------------------------------------------------------
b) Sub County ----------------------------------------------------------------------
c) Parish ----------------------------------------------------------------------------
d) Village ----------------------------------------------------------------------------
e) Gender of respondent (01) male (02) female
f) Marital status of respondent
(01) Single (02) Married (03) Separated (04) Widowed
g) What is your age?..............(years)
g) Do you have children? (01) Yes (02) No
h) If yes, please indicate the number of children with respect to gender
……………………(boys)……………………(girls)
i) Do you stay with other relatives in this house hold?
j) If yes, indicate their number with respect to gender
……………………..( males)……………….(females)
SECTION B: INFORMATION ON FARMING STATUS, LAND TENURE
AND ENTERPRISE ALLOCATION
Tick the correct answer in the spaces provided in the table below
2) What is the farming status of members of this household?
Farming status Husband Wife Boy(s) Girl(s) Other
male(s)
Other
Female(s)

49
Full time
Part time
Not farming
For questions 3-11 Circle the appropriate answers
3) Do you own land? 01) Yes (go to 4) 02) No ( go to 9)
4) If yes, what is the tenure of your land?
01) Customary 02) Freehold 03) Squatter
5) What is the total area of your land? (Specify the acreage).. ………………………
6) Have you bought land after adopting the Wet Coffee Post harvesting handling
Technology? 01) Yes 02) No
7) If yes, what is the size of the land you bought after adopting the wet coffee post harvest
handling technology? (Specify the acreage)……………………………….
8) What is the size of your coffee garden? (Specify the acreage)……………………..
9) Do you borrow or rent land? (01) Yes (02) No
10) If yes, state the size of land that this household has currently borrowed or is renting
(Specify the acreage). Borrowed land……………Rented land…………..
11) State the other different crop enterprises grown by this household and
their associated acreage
Crop enterprise Size of land (acres)
12.State the among of clean coffee this household produced last season …. (kgs)

50
SECTION C: INFORMATION ON ADVANTAGES AND DISADVANTAGES OF
THE WET COFFEE POST HARVEST HANDLING TECHNOLOGY
13) What are the advantages of using the Wet Coffee Post harvest handling Technology over the
Dry Coffee Post harvest handling Technology?
………………………………………………………………………………………………
………………………………………………………………………………………………
14) What are the disadvantages of the using Wet Coffee Post harvest handling Technology?
……………………………………………………………………………………………
……………………………………………………………………………………………
……………………………………………………………………………………………..
…………………………………………………………………………………………….
…………………………………………………………………………………………….
……………………………………………………………………………………………
SECTION D: INFORMATION ON GENDER DIVISION OF LABOUR WITHIN
HOUSEHOLDS USING THE WET COFFEE POST HARVEST
HANDLING TECHNOLOGY.
15) On the scale of (1-5) where 1 indicates the lowest level of involvement and 5 the highest
level of involvement, indicate the level of involvement of various household members in coffee
activities in the table below.
Activity Wife Husband Daughters Sons Other
Males
Other
Females
Coffee weeding
Coffee picking
Carrying water for
coffee processing
Picking coffee

51
Pulping coffee
Carrying coffee to
market
16) On the scale of (1-5) where 1 indicates the lowest level of involvement and 5 the highest
level of involvement, indicate the level of involvement of various household members in staple
food activities in the table below.
Activity Wife Husband Daughters Sons Other
Males
Other
Females
Clearing land
Planting
Weeding
Harvesting
Carrying cassava
to market
17) On the scale of (1-5) where 1 indicates the lowest level of involvement and 5 the highest
level of involvement, indicate the level of involvement of various household members in
off farm activities in the table below.
Activity Wife Husband Daughters Sons Other
Males
Other
Females
Civil servant
Business person
Sells labor
Others specify

52
18) On the scale of (1-5) where 1 indicates the lowest level of involvement and 5the highest level
of involvement, indicate the level of involvement of various household members in reproductive
activities in the table below.
Activity Wife Husband Daughters Sons Other
Males
Other
Females
Fetching water
Harvesting food
Preparing food
Collecting
firewood
Child care
Home cleaning
19) On the scale of (1-5) where 1 indicates the lowest level of involvement and 5 the highest
level of involvement, indicate the level of involvement of various household members in
communal activities in the table below.
Activity Wife Husband Daughters Sons Other
Males
Other
Females

53
Road
maintenance
School duties
Church duties
Funeral duties
Wedding duties
(20) On the scale of (1-5 where 1 indicates the lowest level of access and 5 the highest level of
access, indicate the level of access of various household members to income in the table below.
Activity Wife Husband Daughters Sons Other
Males
Other
Females
Coffee cash
Cassava cash
Civil service cash
Business cash
Sell of labor cash
21) On the scale of (1-5) where 1 indicates the lowest level of control and 5 the highest level of
control, indicate the level of control over income of various household members in the table
below.
Activity Wife Husband Daughters Sons Other
Males
Other
Females

54
Coffee cash
Cassava cash
Civil service cash
Business cash
Sell of labor cash

55
INFLUENCE OF THE WET COFFEE POST HARVEST HANDLING TECHNOLOGY
ON GENDER DIVISION OF LABOUR WITH IN HOUSEHOLDS OF KASESE
DISTRICT.
INTERVIEW SCHEDULE FOR DRY COFFEE PROCESSING FARMERS.
1.SECTION A: PERSONAL DATA
Circle or fill the blank spaces with the appropriate answers
a) Respondent number -----------------------------------------------------------
b) Sub County ----------------------------------------------------------------------
c) Parish ----------------------------------------------------------------------------
d) Village ----------------------------------------------------------------------------
e) Gender of respondent (01) male (02) female
f) Marital status of respondent
(01) Single (02) Married (03) Separated (04) Widowed
g) Do you have children? (01) Yes (02) No
h) If yes, please indicate the number of children with respect to gender
……………………(boys)……………………(girls)
SECTION B: INFORMATION ON FARMING STATUS, LAND TENURE
AND ENTERPRISE ALLOCATION
Tick the correct answer in the spaces provided in the table below
2) What is the farming status of members of this household?
Farming status Husband Wife Boy(s) Girl(s) Other
male(s)
Other
Female(s)
Full time
Part time
Not farming
For questions 3-11 Circle the appropriate answers
3) Do you own land? 01) Yes (go to 4) 02) No ( go to 9)
4) If yes, what is the tenure of your land?

56
01) Customary 02) Freehold 03) Squatter
5) What is the total area of your land? (Specify the acreage).. ………………………
6) Have you bought land after adopting the Wet Coffee Post harvesting handling
Technology? 01) Yes 02) No
7) If yes, what is the size of the land you bought after adopting the wet coffee post harvest
handling technology? (Specify the acreage)……………………………….
8) What is the size of your coffee garden? (Specify the acreage)……………………..
9) Do you borrow or rent land? (01) Yes (02) No
10) If yes, state the size of land that this household has currently borrowed or is renting
(Specify the acreage). Borrowed land……………Rented land…………..
11) State the other different crop enterprises grown by this household and
their associated acreage
Crop enterprise Size of land (acres)
12. State the amount of clean coffee this household produced last season …(kgs)
SECTION C: INFORMATION ON ADVANTAGES AND DISADVANTAGES OF
THE DRY COFFEE POST HARV EST HANDLING TECHNOLOGY
13) What are the advantages of using the Dry Coffee Post harvest handling Technology over the
Wet Coffee Post harvest handling Technology?
………………………………………………………………………………………………
………………………………………………………………………………………………
……………………………………………………………………………………………..
………………………………………………………………………………………………

57
………………………………………………………………………………………………
………………………………………………………………………………………………
14) What are the disadvantages of the using Dry Coffee Post harvest handling Technology?
……………………………………………………………………………………………
……………………………………………………………………………………………
……………………………………………………………………………………………..
…………………………………………………………………………………………….
…………………………………………………………………………………………….
……………………………………………………………………………………………
SECTION D: INFORMATION ON GENDER DIVISION OF LABOUR WITHIN
HOUSEHOLDS USING THE WET COFFEE POST HARVEST
HANDLING TECHNOLOGY.
15) On the scale of (1-5) where 1 indicates the lowest level of involvement and 5 the highest
level of involvement, indicate the level of involvement of various household members in coffee
activities in the table below.
Activity Wife Husban
d
Daughte
rs
Sons Other
Males
Other
Females
Coffee weeding
Coffee picking
Carrying water for
coffee processing
Picking coffee
Pulping coffee
Carrying coffee to
market

58
16) On the scale of (1-5) where 1 indicates the lowest level of involvement and 5 the highest
level of involvement, indicate the level of involvement of various household members in staple
food activities in the table below.
Activity Wife Husband Daughters Sons Other
Males
Other
Females
Clearing land
Planting
Weeding
Harvesting
Carrying cassava
to market
17) On the scale of (1-5) where 1 indicates the lowest level of involvement and 5 the highest
level of involvement, indicate the level of involvement of various household members in
off farm activities in the table below.
Activity Wife Husband Daughters Sons Other
Males
Other
Females
Civil servant
Business person
Sells labor
Others specify

59
18) On the scale of (1-5) where 1 indicates the lowest level of involvement and 5 the highest
level of involvement, indicate the level of involvement of various household members in
reproductive activities in the table below.
Activity Wife Husband Daughters Sons Other
Males
Other
Females
Fetching water
Harvesting food
Preparing food
Collecting
firewood
Child care
Home cleaning
19) On the scale of (1-5) where 1 indicates the lowest level of involvement and 5 the highest
level of involvement, indicate the level of involvement of various household members in
communal activities in the table below.
Activity Wife Husband Daughters Sons Other
Males
Other
Females
Road
maintenance
School duties
Church duties
Funeral duties
Wedding duties
20) On the scale of (1-5) where 1 indicates the lowest level of access and 5 the highest level
of access, indicate the level of access of various household members to income in the table
below.

60
Activity Wife Husband Daughters Sons Other
Males
Other
Females
Coffee cash
Cassava cash
Civil service cash
Business cash
Sell of labor cash
21) On the scale of (1-5) where 1 indicates the lowest level of control and 5 the highest level
of control, indicate the level of control over income of various household members in the
table below.
Activity Wife Husband Daughters Sons Other
Males
Other
Females
Coffee cash
Cassava cash
Civil service cash
Business cash
Sell of labor cash


