
This article was downloaded by: [Umeå University Library]On: 07 October 2014, At: 08:38Publisher: Taylor & FrancisInforma Ltd Registered in England and Wales Registered Number: 1072954 Registeredoffice: Mortimer House, 37-41 Mortimer Street, London W1T 3JH, UK
Communications in Soil Science andPlant AnalysisPublication details, including instructions for authors andsubscription information:http://www.tandfonline.com/loi/lcss20
Influence of Integrated NutrientManagement on Soil Properties of OldAlluvial Soil under Mustard CroppingSystemArnab Banerjee a , Jayanta K. Datta a , N. K. Mondal a & T. Chanda aa Department of Environmental Science , The University ofBurdwan , West Bengal , IndiaPublished online: 25 Oct 2011.
To cite this article: Arnab Banerjee , Jayanta K. Datta , N. K. Mondal & T. Chanda (2011)Influence of Integrated Nutrient Management on Soil Properties of Old Alluvial Soil under MustardCropping System, Communications in Soil Science and Plant Analysis, 42:20, 2473-2492, DOI:10.1080/00103624.2011.609256
To link to this article: http://dx.doi.org/10.1080/00103624.2011.609256
PLEASE SCROLL DOWN FOR ARTICLE
Taylor & Francis makes every effort to ensure the accuracy of all the information (the“Content”) contained in the publications on our platform. However, Taylor & Francis,our agents, and our licensors make no representations or warranties whatsoever as tothe accuracy, completeness, or suitability for any purpose of the Content. Any opinionsand views expressed in this publication are the opinions and views of the authors,and are not the views of or endorsed by Taylor & Francis. The accuracy of the Contentshould not be relied upon and should be independently verified with primary sourcesof information. Taylor and Francis shall not be liable for any losses, actions, claims,proceedings, demands, costs, expenses, damages, and other liabilities whatsoever orhowsoever caused arising directly or indirectly in connection with, in relation to or arisingout of the use of the Content.
This article may be used for research, teaching, and private study purposes. Anysubstantial or systematic reproduction, redistribution, reselling, loan, sub-licensing,systematic supply, or distribution in any form to anyone is expressly forbidden. Terms &Conditions of access and use can be found at http://www.tandfonline.com/page/terms-and-conditions

Communications in Soil Science and Plant Analysis, 42:2473–2492, 2011Copyright © Taylor & Francis Group, LLCISSN: 0010-3624 print / 1532-2416 onlineDOI: 10.1080/00103624.2011.609256
Influence of Integrated Nutrient Management onSoil Properties of Old Alluvial Soil under Mustard
Cropping System
ARNAB BANERJEE, JAYANTA K. DATTA, N. K. MONDAL,AND T. CHANDA
Department of Environmental Science, The University of Burdwan, West Bengal,India
Field experiments were conducted at the fields of Crop Research and SeedMultiplication Farm of Burdwan University, Burdwan, West Bengal, India during thewinter seasons of 2005–2006, 2006–2007, and 2007–2008 in old alluvial soil (pH-6-7)to evaluate the influence of integrated nutrient management on soil physicochemicaland biological properties under mustard (Brassica campestris cv. ‘B9’) cropping sys-tem. In the first year (2005–2006), seven varieties of mustard were cultivated underrecommended dose of chemical fertilizer (100:50:50). In the second year of the exper-iment (2006–2007), six different doses of biofertilizer and chemical fertilizer wereapplied. In the third year (2007–2008), six different level of compost along with acombined dose of biofertilizer and chemical fertilizer (T3-3/4 Chemical fertilizer: 1/4biofertilizer) were applied. The results indicated significant improvement in the soilquality by increasing soil porosity and water holding capacity significantly, as well asgradual build-up of soil macronutrient status after harvesting of the crop. Applicationsof biofertilizers have contributed significantly toward higher soil organic matter, nitro-gen (N), available phosphorus (P), and potassium (K). The use of biofertilizers andcompost have mediated higher availability of iron (Fe), manganese (Mn), zinc (Zn),copper (Cu), and boron (B) in soil. The use of biofertilizers and compost significantlyimproved soil bacterial and fungal population count in the soil, thereby increasing thesoil health.
Keywords Biofertilizer, compost, mustard, soil quality
Introduction
Applications of chemical fertilizers have contributed significantly to the huge increase inthe world food production. As world population is increasing almost exponentially, thereis an urgent need to consider other novel ways of increasing food production that arecompatible with sustainability and the retention of environmental quality.
The requirement of nutrients has increased many fold with the adoption of improvedtechnology for obtaining higher yields per unit area. Continuous use of inorganic fertilizersresulted in deficiency of micronutrients, imbalance in soil physicochemical properties, andunsustainable crop production. With the increased cost of inorganic fertilizers, applicationof the recommended dose is difficult for small and marginal farmers to afford. Hence
Received 11 July 2010; accepted 15 May 2011.Address correspondence to Dr. Arnab Banerjee, Department of Environmental Science, The
University of Burdwan, Burdwan-713104, West Bengal, India. E-mail: [email protected]
2473
Dow
nloa
ded
by [
Um
eå U
nive
rsity
Lib
rary
] at
08:
38 0
7 O
ctob
er 2
014

2474 A. Banerjee et al.
renewable and low cost sources of plant nutrients for supplementing and complement-ing chemical fertilizers should be substituted which can be affordable to the majority ofthe farming community. In this context, integrated nutrient management would be a viablestrategy for advocating judicious and efficient use of chemical fertilizers with a matchingaddition of organic manures and biofertilizers.
Long-term additions of fertilizers along with manures helps to bring soil pH towardneutral, increasing soil organic carbon content, macronutrients [nitrogen (N), phosphate(P), potassium (K)], and micronutrient [iron (Fe), manganese (Mn), zinc (Zn), copper (Cu),and boron (B)] availability, and improved physical properties leading to sustainance of fer-tility (Maji and Mondal,2004). One hundred percent of NPK applied through chemicalfertilizers increased the bulk density significantly over the organic manure consisting of50% substitution of NPK through vermicompost, gliricidia, and farm yard manure (FYM)after harvest of rice, while later treatments did not show any increase in bulk densityover the initial value (Yadav, 1998). Application of 50% the recommended NPK of fertil-izer + 50% N through FYM significantly reduced the bulk density of the soil as comparedto initial status after harvest of rice, whereas it increased with 100% recommended NPKthrough fertilizers after harvest of maize and groundnut (Talathi et al., 2002). Applicationof 50% of the recommended nitrogen, phosphorous, and potassium (NPK) through fertiliz-ers + 50% N through FYM showed remarkable increase in water holding capacity (WHC)of soil after harvest of rice, while 75% of the recommended NPK through fertilizers notedhigher WHC after maize and groundnut reported significant effects of enriched compost onsoil nutrients (Kavitha & Subramanian, 2007). Chavan et al. (2007) reported that physico-chemical properties of the soil improved significantly by the addition of organic manuresand that there was very little change due to inorganic fertilizers. It is apparent that thereis a need to generate more information on integrated nutrient recommendations for crop-ping systems for sustained crop production through increased soil productivity in long termexperiments. Hence, an investigation was undertaken to determine the effect of integratednutrient management with biofertilizer, compost, and inorganic fertilizers on soil fertilityand health under mustard cropping system.
Material and Methods
Field experiments were conducted at Crop Research and Seed Multiplication Farm,Burdwan University, Burdwan, West Bengal, India at latitude 87◦50′12′′ E and longi-tude 23◦15′12′′ N during winter season of 2005–2006, 2006–2007, and 2007–2008. In2005–2006, the treatment comprised of the recommended dose of chemical fertilizer forseven available varieties of mustard (B9, B-54, TWC-3, Panchali, Malek-2, Sanjukta, andNathsona). In 2006–2007, the treatment combination includes T1-Recommended doses ofchemical fertilizer (100:50:50, i.e., 100 kg ha−1N: 50 kg ha−1P: 50 kg ha−1 K), T2-1/2chemical fertilizer (50 kg ha−1N+ 25 kg ha−1P: 25 kg ha−1 K): 1/2 biofertilizer (0.13kg ha−1 Azotobacter + 0.13 kg ha−1 Phosphobacter), T3-3/4th Chemical fertilizer(75 kg ha−1 N + 37.5 kg ha−1 P: 37.5 kg ha−1 K: 1/4th biofertilizer (0.06 kg ha−1
Azotobacter + 0.06 kg ha−1 Phosphobacter), T4-3/4th biofertilizer (0.19 kg ha−1
Azotobacter + 0.19 kg ha−1 Phosphobacter): 1/4th chemical fertilizer (25 kg ha−1
N + 12.5 kg ha−1 P: 12.5 kg ha−1 K), T5-recommended dose of biofertilizer (0.26kg ha−1 Azotobacter + 0.26 kg ha−1 Phosphobacter) and T6-Control (without any chemi-cal fertilizer). In 2007–2008 the treatment comprised of T1-Control without any compost,
Dow
nloa
ded
by [
Um
eå U
nive
rsity
Lib
rary
] at
08:
38 0
7 O
ctob
er 2
014

Integrated Nutrient Management 2475
T2-4.5mt.ha−1, T3-6.0 mt.ha−1, T4-7.5mt.ha−1, T5-9.0 mt.ha−1, and T6-10.5 mt.ha−1 alongwith T2 treatment of combined dose of biofertilizer and chemical fertilizer of the previousyear of 2006–2007. The experiments were laid out in a randomized block design (RBD)and the respective treatments were applied to each plot. Each treatment was replicated threetimes. The N, P, and K were applied in the form of urea, single super phosphate and muriateof potash (potassium chloride). A pure culture of Azotobacter chrococcum isolated fromthe rhizospheric soil of rice plants of local crop fields of Burdwan district, West Bengal,India was used, as was a pure culture of Phosphobacter (Bacillus sp) isolated from themunicipal garbage of Burdwan town, West Bengal, India. The strain A. chrococcum weregrown on selective hi media for Azotobacter and the Phosphobacter strain (Bacilus sp)were grown on Pikovskias medium at 30
◦c on a shaker incubator at 150 rpm. After 48
hours, cells were harvested by centrifugation (6000 × g for 10 minutes). Cell pellets werewashed twice with sterile water. Washed cells were mixed with sterilized charcoal and usedas inoculum for the seed treatments in the field trials.
For preparation of the compost, a pit comprising 4 feet × 6 feet in dimension and4 feet deep was prepared. Then the pit was filled with the cow dung collected from thesurrounding villages. A final layer of soil was applied over the compost pit and allowed toremain for three months for bacterial decomposition to take place. After three months thecompost was taken out from the pit and applied to the experimental field. The chemicalproperties of the experimental compost were pH 6.9, organic carbon (C) 9.85 %, availableN 1.15%, available P 35.91 kg ha−1, and available K 220.19 kg ha−1.
Soil samples were collected prior to layout of the experiment and after harvesting ofcrops for three consecutive years. Soil samples were collected from 0–30cm depth, ran-domly from three selected spots using a soil augur. After collection of the soil, it wastransferred into thick quality polythene bags and taken to the laboratory for further analy-sis. In the laboratory the soil sample was air dried and then ground by using a wooden pestleand mortar and sieved through the 2mm mesh size sieve. After sieving the refined materialit was used for soil physico-chemical analysis. Soil bulk density, particle density, porosity,and water holding capacity were determined by the standard methods as described by Black(1965). Soil pH was determined using 1:10 soil/water extract and conductivity measuredusing 1:2 soil/water extract. Available N by potassium permanganate (KMnO4)-oxidizableN (Subbiah & Asija, 1956); organic carbon by potassium dichromate oxidation by Walkley(1947) method, as modified by Jackson (1958). Available P of soil was estimated by theOlsen method (Olsen et al., 1954) and available K of soil was estimated by extraction withammonium acetate at pH 7.0 (MAPA, 1994). The available iron (Fe) content in soil wasestimated by extraction with ammonium acetate at pH 3.5 (Krishnamurthi, Mahavir, &Sharma, 1970), available manganese (Mn) by extraction with ammonium acetate at pH 7.0(Willard & Greathouse, 1917), available boron (B) by boron curcumin complex formationmethod (Dible, Truog, & Berger, 1954). The extractable elements (Cu and Zn) were deter-mined by using suitable extractants (0.5 M diethelenetriaminepentaaceticacid (DTPA) +0.01 M calcium chloride (CaCl2) + 0.1 M triethanolamine, adjusted to pH 7.3 (Lindsay &Norvell, 1978).
For a microbiological analysis of the experimental soil, fresh soil samples were col-lected both before land preparation and after harvesting and microbial assay were donefollowing the method of Walksman and Fred (1922) to enumerate the number of bacte-ria, fungi, Azotobacter, and Phosphobacter in the collected soil sample. All the replicateddata of three years were analysed by one way analysis of variance (ANOVA) and then therelevant data were statistically analysed for Duncan’s Multiple Range Test (DMRT) usingsoftware package STATISTICA (Stat Soft Inc.1998)
Dow
nloa
ded
by [
Um
eå U
nive
rsity
Lib
rary
] at
08:
38 0
7 O
ctob
er 2
014

2476 A. Banerjee et al.
Results and Discussion
Soil Physical Characteristics
Soil bulk density did not showed any significant change in soils both before sowing andafter harvesting irrespective of treatments during both the years2005–2006 and 2006–2007which may be due to application of different levels of chemical fertilizers. In 2007–2008,the bulk density value significantly reduced in soils from T2 to T6 treatments with respectto control (T1) both before sowing and after harvesting when compost were applied alongwith biofertilizers and chemical fertilizers. The addition of organic manure destroyed thedevelopment of hardpan in soil thus lowering the bulk density as was reported by Bavaskarand Zende (1973) (Table 1).
The particle density (g/cc) of soil reduced significantly in soil in all the treatmentsafter harvesting the crop in comparison to before sowing for all the three years of2005–2006, 2006–2007, and 2007–2008 which might be due to higher levels of organicmatter present in the soil after harvesting, contributing significantly toward the reductionof particle density values (Table 1).
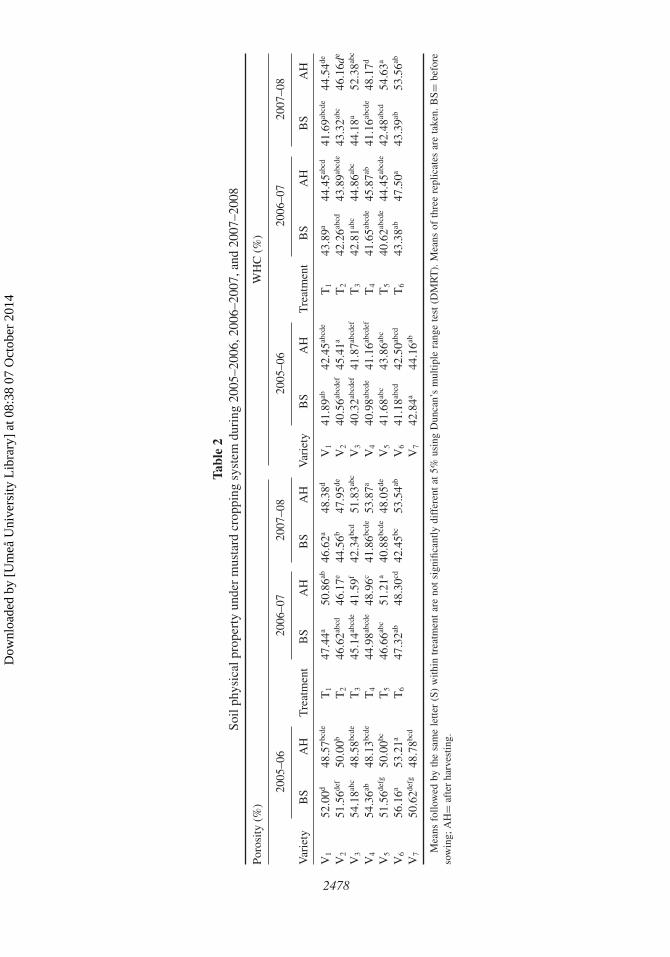
In 2005–2006, the porosity value reduced in soil samples after harvesting in com-parison to soil samples before sowing which may be attributed to the deterioration ofsoil structure by the applied nitrogenous fertilizer in the soil (Bhatia & Shukla, 1982). In2006–2007 and in 2007–2008, the increased porosity value in soil samples after harvestingin comparison to soil taken before land preparation for seed sowing may be attributed tobetter aggregation and decreased bulk density under the influence of high organic matteraddition leading to development of crumb structure with high soil porosity and better aera-tion. The results of the present investigation are in agreement with the findings of Biswas,Jain, and Mandal (1971). The maximum increase of the porosity value were observed dur-ing 2007–2008 which might be attributed to the simulative action of compost on nativeearthworms which might have had a build-up of worm population, leading to increases inthe soil macro pores through their burrowing action. The results of the present investigationare in agreement with the findings of Reddy and Reddy (1998) (Table 2).
Water holding capacity of soil samples increased after harvesting of crops more thanbefore sowing in all of the years, but significant change was found in 2007. In the first year,the balanced dose of NPK fertilizer (recommended dose) and the application of biofertilizerand compost for the second and third year of the experimental period may have contributedsignificantly toward the accumulation of organic matter, resulting in improved aggregationand favorable pore geometry in the soil. The results of the present investigation are inagreement with the findings of Biswas, Jain, and Mandal (1971). The increase in waterholding capacity for the subsequent three years may be partially attributed to the decreasein bulk density of the soil (Malewar & Hasnabade, 1995) (Table 2).
Soil Chemical Characteristics
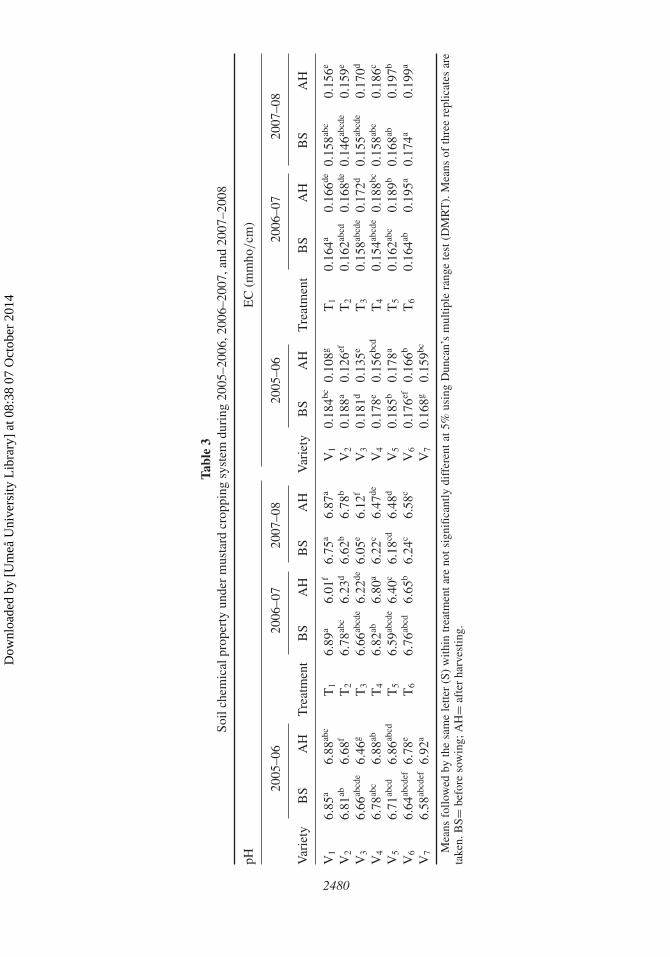
During 2005–2006, the pH showed both an increasing and decreasing trend due to applica-tion of recommended doses of chemical fertilizer (N:P:K—100:50:50). The results of thepresent investigation are in agreement with the findings of Ramteke, Mahadkar, and Yadav(1998). In 2006–2007, pH value before sowing ranged between 6.59 (T5) to 6.89 (T1) andafter harvesting the value ranged between 6.01 (T1) and 6.80 (T4). The pH value decreasedin all treatments of 2006–2007 except T6. In 2007–2008, the pH value showed an increas-ing trend after harvesting of crop with respect to soils before land preparation. Soil pH
Dow
nloa
ded
by [
Um
eå U
nive
rsity
Lib
rary
] at
08:
38 0
7 O
ctob
er 2
014

Tabl
e1
Soil
phys
ical
prop
erty
unde
rm
usta
rdcr
oppi
ngsy
stem
duri
ng20
05–2
006,
2006
–200
7,an
d20
07–2
008
Bul
kde
nsity
(g/cc
)Pa
rtic
lede
nsity
(g/cc
)
2005
–06
2006
–07
2007
–08
2005
–06
2006
–07
2007
–08
Var
iety
BS
AH
Tre
atm
ent
BS
AH
BS
AH
Var
iety
BS
AH
Tre
atm
ent
BS
AH
BS
AH
V1
1.35
a1.
28ab
cdT
11.
33ab
1.32
ab1.
32a
1.24
aV
12.
52a
2.10
bcde
T1
2.53
a2.
18ab
c2.
53a
2.18
a
V2
1.34
abc
1.23
abcd
efT
21.
34a
1.33
a1.
28ab
1.14
bV
22.
48ab
c2.
06f
T2
2.48
abcd
2.08
e2.
46ab
2.17
ab
V3
1.30
abcd
ef1.
29ab
cT
31.
32ab
cd1.
31ab
cd1.
24ab
cd1.
12bc
V3
2.46
abcd
e2.
12bc
T3
2.51
ab2.
19a
2.42
abc
2.14
abc
V4
1.32
abcd
1.31
abT
41.
30ab
cde
1.29
abcd
e1.
18e
1.10
bcd
V4
2.51
ab2.
14b
T4
2.42
abcd
e2.
11d
2.36
abcd
2.12
abcd
V5
1.29
abcd
ef1.
27ab
cde
T5
1.33
abc
1.32
abc
1.26
abc
1.07
bcde
V5
2.48
abcd
2.12
bcd
T5
2.49
abc
2.19
ab2.
28ab
cde
2.05
abcd
e
V6
1.35
ab1.
32a
T6
1.31
abcd
e1.
26ab
cde
1.16
e1.
02f
V6
2.46
abcd
ef2.
18a
T6
2.46
abcd
e2.
08e
2.24
abcd
e2.
09ab
cde
V7
1.31
abcd
e1.
25ab
cdef
V7
2.44
abcd
ef2.
05f
Mea
nsfo
llow
edby
the
sam
ele
tter
(S)
with
intr
eatm
ent
are
not
sign
ifica
ntly
diff
eren
tat
5%us
ing
Dun
can’
sm
ultip
lera
nge
test
(DM
RT
).M
eans
ofth
ree
repl
icat
esar
eta
ken.
BS
=be
fore
sow
ing;
AH
=af
ter
harv
estin
g.
2477
Dow
nloa
ded
by [
Um
eå U
nive
rsity
Lib
rary
] at
08:
38 0
7 O
ctob
er 2
014
Tabl
e2
Soil
phys
ical
prop
erty
unde
rm
usta
rdcr
oppi
ngsy
stem
duri
ng20
05–2
006,
2006
–200
7,an
d20
07–2
008
Poro
sity
(%)
WH
C(%
)
2005
–06
2006
–07
2007
–08
2005
–06
2006
–07
2007
–08
Var
iety
BS
AH
Tre
atm
ent
BS
AH
BS
AH
Var
iety
BS
AH
Tre
atm
ent
BS
AH
BS
AH
V1
52.0
0d48
.57bc
deT
147
.44a
50.8
6ab46
.62a
48.3
8dV
141
.89ab
42.4
5abcd
eT
143
.89a
44.4
5abcd
41.6
9abcd
e44
.54de
V2
51.5
6def
50.0
0bT
246
.62ab
cd46
.17e
44.5
6b47
.95de
V2
40.5
6abcd
ef45
.41a
T2
42.2
6abcd
43.8
9abcd
e43
.32ab
c46
.16d
e
V3
54.1
8abc
48.5
8bcde
T3
45.1
4abcd
e41
.59f
42.3
4bcd
51.8
3abc
V3
40.3
2abcd
ef41
.87ab
cdef
T3
42.8
1abc
44.8
6abc
44.1
8a52
.38ab
c
V4
54.3
6ab48
.13bc
deT
444
.98ab
cde
48.9
6c41
.86bc
de53
.87a
V4
40.9
8abcd
e41
.16ab
cdef
T4
41.6
5abcd
e45
.87ab
41.1
6abcd
e48
.17d
V5
51.5
6defg
50.0
0bcT
546
.66ab
c51
.21a
40.8
8bcde
48.0
5deV
541
.68ab
c43
.86ab
cT
540
.62ab
cde
44.4
5abcd
e42
.48ab
cd54
.63a
V6
56.1
6a53
.21a
T6
47.3
2ab48
.30cd
42.4
5bc53
.54ab
V6
41.1
8abcd
42.5
0abcd
T6
43.3
8ab47
.50a
43.3
9ab53
.56ab
V7
50.6
2defg
48.7
8bcd
V7
42.8
4a44
.16ab
Mea
nsfo
llow
edby
the
sam
ele
tter
(S)
with
intr
eatm
ent
are
not
sign
ifica
ntly
diff
eren
tat
5%us
ing
Dun
can’
sm
ultip
lera
nge
test
(DM
RT
).M
eans
ofth
ree
repl
icat
esar
eta
ken.
BS=
befo
reso
win
g;A
H=
afte
rha
rves
ting.
2478
Dow
nloa
ded
by [
Um
eå U
nive
rsity
Lib
rary
] at
08:
38 0
7 O
ctob
er 2
014
Integrated Nutrient Management 2479
decreased after harvesting of crops during 2006–2007, which may be due to the productionof organic acids (amino acid, glycine, cystein, and humic acid) during mineralization(ammonization and ammonification) of indigenous organic materials by heterotrophs andnitrification by autotrophs. The combined application of biofertilizer, chemical fertilizer,and compost for the third year contributed significantly to the increase in the soil pH afterharvesting (Ramteke, Mahadkar, & Yadav, 1998) (Table 3).
The results show that the electrical conductivity (EC) of soil was significantly influ-enced by the different treatments in all three years of experiment. During 2005–2006, adecreasing trend appeared in comparison to the level before preparation of the field thatmight be due to the accumulation of salts liberated from the chemical fertilizers (Khiani &Moore, 1984; Patil, 1997). During 2006–2007 and 2007–2008, there was a progressiveincrease in the level of EC in all treatments which may be attributed tothe combined effectof biofertilizer and chemical fertilizer which have contributed significantly tothe increasein buffering capacity of the soil. The decomposition of organic materials released acids oracid forming compounds that reacted with the sparingly soluble salts already present inthe soil and either converted them into soluble salts or at least increased their solubility,thus increasing the conductivity value. The results of the present investigation are in agree-ment with the findings of Khiani and Moore (1984) (Table 4). In 2005–2006, the organiccarbon level before preparation of the field lies between 0.708% (V7) and 0.785 (V1)and after harvesting of the crop the soil organic carbon content varies between 0.645%(V3) and 0.760% (V1). There was a significant amount of decrease in the level of soilorganic carbon under the recommended dose of chemical fertilizer during the first yearwhich may be attributed to the deleterious effect of chemical fertilizer leading to forma-tion of improper stable aggregates and therefore low organic carbon content in soil afterharvesting. In 2006–2007, the organic carbon (OC) level increased from T2 treatment toT6 treatment with gradual increase in the dose of biofertilizer. In 2007–2008, the OC levelincreased after harvesting more than before sowing from T2 treatment to T6 treatment incomparison to T1 treatment where no compost had been applied (Table 4). The gradualbuild-up of soil organic carbon status in 2006–2007 and 2007–2008 may be attributed toapplication of compost along with biofertilizer and chemical fertilizer.
Under the influence of biofertilizer, decomposition of complex organic matter in com-post and subsequent conversion to mineralized organic colloids took place, which wasadded to the soil organic carbon pool. The results of the present investigation are inagreement with the findings of Ramaswami and Son (1997).
In 2005–2006, the level of nitrogen content in the soil was greater after harvesting ofthe crop as compared to the nitrogen content in the soil before land preparation which maybe due to lack of a balanced dose of nutrients as well as low uptake by the crop plants,therefore increasing the nitrogen status of soil. The results of the present investigationare in agreement with the findings of Nephade and Wankhade (1987). The results of thepresent study showed that the available nitrogen was higher in soil after harvesting ofcrop than before sowing during 2006–2007 and 2007–2008 due to positive interactionbetween the applied biofertilizers (Azotobacter, Phosphobacter) and the soil components,as well as biological fixation of atmospheric nitrogen by bacterial fertilizers on one handand continuous release of nutrients from the applied compost on the other hand during thethird year. The results of the present investigation are in agreement with the findings ofDas, Dang, and Shivananda (2008) (Table 4).
The results of the present study showed that level of available potassium increased inthe post-harvesting soil as compare to soil before land preparation for sowing which may beattributed tothe differential rate of nutrient uptake capacity of the seven varieties of mustard
Dow
nloa
ded
by [
Um
eå U
nive
rsity
Lib
rary
] at
08:
38 0
7 O
ctob
er 2
014
Tabl
e3
Soil
chem
ical
prop
erty
unde
rm
usta
rdcr
oppi
ngsy
stem
duri
ng20
05–2
006,
2006
–200
7,an
d20
07–2
008
pHE
C(m
mho
/cm
)
2005
–06
2006
–07
2007
–08
2005
–06
2006
–07
2007
–08
Var
iety
BS
AH
Tre
atm
ent
BS
AH
BS
AH
Var
iety
BS
AH
Tre
atm
ent
BS
AH
BS
AH
V1
6.85
a6.
88ab
cT
16.
89a
6.01
f6.
75a
6.87
aV
10.
184bc
0.10
8gT
10.
164a
0.16
6de0.
158ab
c0.
156e
V2
6.81
ab6.
68f
T2
6.78
abc
6.23
d6.
62b
6.78
bV
20.
188a
0.12
6efT
20.
162ab
cd0.
168de
0.14
6abcd
e0.
159e
V3
6.66
abcd
e6.
46g
T3
6.66
abcd
e6.
22de
6.05
e6.
12f
V3
0.18
1d0.
135e
T3
0.15
8abcd
e0.
172d
0.15
5abcd
e0.
170d
V4
6.78
abc
6.88
abT
46.
82ab
6.80
a6.
22c
6.47
deV
40.
178e
0.15
6bcd
T4
0.15
4abcd
e0.
188bc
0.15
8abc
0.18
6c
V5
6.71
abcd
6.86
abcd
T5
6.59
abcd
e6.
40c
6.18
cd6.
48d
V5
0.18
5b0.
178a
T5
0.16
2abc
0.18
9b0.
168ab
0.19
7b
V6
6.64
abcd
ef6.
78e
T6
6.76
abcd
6.65
b6.
24c
6.58
cV
60.
176ef
0.16
6bT
60.
164ab
0.19
5a0.
174a
0.19
9a
V7
6.58
abcd
ef6.
92a
V7
0.16
8g0.
159bc
Mea
nsfo
llow
edby
the
sam
ele
tter
(S)
with
intr
eatm
enta
reno
tsig
nific
antly
diff
eren
tat5
%us
ing
Dun
can’
sm
ultip
lera
nge
test
(DM
RT
).M
eans
ofth
ree
repl
icat
esar
eta
ken.
BS=
befo
reso
win
g;A
H=
afte
rha
rves
ting.
2480
Dow
nloa
ded
by [
Um
eå U
nive
rsity
Lib
rary
] at
08:
38 0
7 O
ctob
er 2
014

Tabl
e4
Soil
chem
ical
prop
erty
unde
rm
usta
rdcr
oppi
ngsy
stem
duri
ng20
05–2
006,
2006
–200
7,an
d20
07–2
008
Org
anic
C(%
)A
vaila
ble-
N(k
g.ha
−1)
2005
–06
2006
–07
2007
–08
2005
–06
2006
–07
2007
–08
Var
iety
BS
AH
Tre
atm
ent
BS
AH
BS
AH
Var
iety
BS
AH
Tre
atm
ent
BS
AH
BS
AH
V1
0.78
5a0.
760a
T1
0.72
2abcd
e0.
715f
0.70
5f0.
615f
V1
206.
976de
225.
792d
T1
216.
88ab
cde
212.
83a
208.
976f
218.
16f
V2
0.74
6e0.
702d
T2
0.72
6abcd
0.74
5e0.
718e
0.78
5eV
220
1.11
8def
206.
976g
T2
210.
76ab
cde
220.
46b
214.
118e
226.
976e
V3
0.76
2d0.
645g
T3
0.73
2abc
0.76
1d0.
732d
0.79
6dV
321
0.37
2c22
8.75
2cT
322
2.18
abcd
251.
645c
218.
106cd
230.
112d
V4
0.74
4ef0.
702de
T4
0.73
8a0.
784ab
c0.
768c
0.81
6cV
420
2.56
8def
210.
112f
T4
229.
32ab
273.
18d
219.
134c
241.
472c
V5
0.78
2ab0.
758ab
T5
0.73
4ab0.
794ab
0.78
2b0.
836b
V5
216.
118b
282.
24b
T5
235.
36a
282.
59e
224.
116b
257.
152b
V6
0.76
9c0.
741c
T6
0.72
6abcd
e0.
798a
0.79
4a0.
856a
V6
208.
976d
213.
952e
T6
222.
48ab
c29
4.78
f23
1.11
8a26
4.01
6a
V7
0.70
8g0.
699de
fV
722
4.11
8a28
8.51
2a
Mea
nsfo
llow
edby
the
sam
ele
tter
(S)
with
intr
eatm
ent
are
not
sign
ifica
ntly
diff
eren
tat
5%us
ing
Dun
can’
sm
ultip
lera
nge
test
(DM
RT
).M
eans
ofth
ree
repl
icat
esar
eta
ken.
BS
=be
fore
sow
ing;
AH
=af
ter
harv
estin
g.
2481
Dow
nloa
ded
by [
Um
eå U
nive
rsity
Lib
rary
] at
08:
38 0
7 O
ctob
er 2
014

2482 A. Banerjee et al.
during 2005–2006. In 2006–2007, the declining trend in the level of available potassiumin the soil after harvesting of the crops may be attributed to the ready uptake of K by thecrops under greater mobilization in the soil and plant system under the influence of theapplied biofertilizer. During 2007–2008, the conjoint application of compost, biofertilizer,and chemical fertilizer resulted in an increase in the level of available potassium (K) in thepost-harvest soil. The results indicate that improvements in available potassium contentcame from K released from organic input of applied compost or from increased availabilityof native potassium following the addition of compost. Most of the simple cationic formsof nutrients present in the soil at any time are in exchangeable forms associated with clayminerals and the organic fractions of the soil, of which these can be rapidly exchanged withcations in the soil solution. The results of the present investigation are in agreement withthe findings of Das, Praad, and Goutam (2003) under cotton wheat sequence and Chavanet al. (2007) under sorghum wheat cropping sequences (Table 5).
During 2005–2006, the level of available P was higher in the soil samples col-lected after harvesting of crops, which may be attributed to the presence of phosphorousunder adsorbed conditions or insoluble inorganic forms under chemical fertilizer treatment(Sharpley, 2000). During 2006–2007, there is significant decrease in the available phospho-rous level in the soil after harvesting which may be due to higher amounts of crop uptakedue to higher mobilization of phosphorous in soil from bound form to available form medi-ated by the applied Phosphobacter as biofertilizer in the field. In 2007–2008, the combinedapplication of biofertilizer, chemical fertilizer, and compost have contributed significantlyto the increase in the level of available phosphorous which may be due to physico-chemicalrelease of inorganic and organic phosphorous by organic acids through the action of lowermolecular weight organic anions such as oxalate which can replace phosphorous absorbedat metal hydroxide surfaces through ligand exchange reactions and dissolved metal oxidesurfaces that absorb phosphorus (Fox, Comeford, & Fee, 1990).
The overall conclusions drawn from the observed data in 2007–2008 lead to com-post contributing more than chemical fertilizer in the building of the phosphorous status ofthe soil and when an organic source of nutrition is applied, the bond between phosphoruscompounds with calcium carbonate present in the soil is broken resulting in the release ofphosphorous in a higher available form. The authors findings corroborate with the earlierfindings of Singh et al. (2002). The results of the present study showed that in all threeyears the available iron content increased during post harvesting more than before sow-ing, which is attributed to high levels of indigenous organic matter being present in thesoil along with the applied organic matter in terms of compost bound sufficient quantityof iron as reducible and insoluble form of organic complexes and therefore rendering lowcrop uptake for all the three years of experimental period (Mandal and Mitra, 1982). Theiron can be in oxidized or reduced forms, therefore due to its acidic and reducing char-acteristics, an increase in soil organic matter could increase the more available reducedform of iron Fe+2. Soil iron has a strong tendency to form mobile organic complexes andchelates (Kabata–Pendias, 2000) and thus contributing to increased availability of iron insoil (Table 6).
The results of the present study show that the level of available manganese contentincreased in the soil taken after harvesting of the crop as compared to the manganesecontent in soil before land preparation for sowing of seeds in all three years of experimen-tal period. During 2007–2008 the available manganese content significantly influencedthe different treatments over control. The higher level of manganese content in soil sam-ples after harvesting may be attributed to the level of soil pH ranging between 6–7 ofthe respective soil samples and low uptake by crop plants. Under the said pH range the
Dow
nloa
ded
by [
Um
eå U
nive
rsity
Lib
rary
] at
08:
38 0
7 O
ctob
er 2
014

Tabl
e5
Soil
chem
ical
prop
erty
unde
rm
usta
rdcr
oppi
ngsy
stem
duri
ng20
05–2
006,
2006
–200
7,an
d20
07–2
008
Ava
ilabl
e-P
(kg.
ha−1
)A
vaila
ble-
K(k
g.ha
−1)
2005
–06
2006
–07
2007
–08
2005
–06
2006
–07
2007
–08
Var
iety
BS
AH
Tre
atm
ent
BS
AH
BS
AH
Var
iety
BS
AH
Tre
atm
ent
BS
AH
BS
AH
V1
420.
555de
455.
213d
T1
418.
99a
420.
92a
412.
555e
410.
363e
V1
148.
82a
158.
814a
T1
144.
37a
143.
19a
140.
815cd
e14
3.70
4f
V2
434.
116ab
494.
829ab
T2
416.
84b
385.
59b
417.
184e
443.
119e
V2
142.
18b
153.
704b
T2
142.
32ab
135.
33b
144.
728cd
e15
2.88
9e
V3
384.
388c
403.
333f
T3
412.
68bc
378.
59bc
422.
224d
473.
550d
V3
140.
034bc
148.
074cd
T3
138.
38ab
cde
128.
89bc
146.
118cd
155.
714d
V4
421.
544d
463.
504c
T4
408.
36bc
d36
7.26
bcd
438.
116c
498.
632c
V4
138.
082bc
d14
9.40
7cT
414
0.32
abcd
120.
29d
150.
121c
162.
296c
V5
428.
346g
396.
384g
T5
402.
18e
323.
62e
446.
668b
521.
837b
V5
126.
112ef
133.
185g
T5
136.
34ab
cde
115.
15de
159.
134ab
188.
815b
V6
436.
118a
495.
149a
T6
416.
62e
317.
68e
458.
148a
523.
764a
V6
132.
114e
141.
630ef
T6
141.
56ab
c10
5.25
f16
2.11
4a19
5.25
9a
V7
406.
008f
437.
777e
V7
129.
524ef
142.
370e
Mea
nsfo
llow
edby
the
sam
ele
tter
(S)
with
intr
eatm
enta
reno
tsig
nific
antly
diff
eren
tat5
%us
ing
Dun
can’
sm
ultip
lera
nge
test
(DM
RT
).M
eans
ofth
ree
repl
icat
esar
eta
ken.
2483
Dow
nloa
ded
by [
Um
eå U
nive
rsity
Lib
rary
] at
08:
38 0
7 O
ctob
er 2
014

Tabl
e6
Soil
mic
ronu
trie
ntst
atus
unde
rm
usta
rdcr
oppi
ngsy
stem
duri
ng20
05–2
006,
2006
–200
7,an
d20
07–2
008
Ava
ilabl
e-ir
on(p
pm)
Ava
ilabl
e-M
n(p
pm)
2005
–06
2006
–07
2007
–08
2005
–06
2006
–07
2007
–08
Var
iety
BS
AH
Tre
atm
ent
BS
AH
BS
AH
Var
iety
BS
AH
Tre
atm
ent
BS
AH
BS
AH
V1
4.26
1b4.
854e
T1
4.07
3bcde
4.02
8f4.
161ab
cde
4.30
6cde
V1
4.08
7f5.
174d
T1
4.05
9abcd
e4.
068f
4.28
7de4.
075f
V2
4.11
6cd5.
256c
T2
4.12
2bcde
4.85
9de4.
244ab
cde
4.45
2cdV
24.
384c
5.26
1bT
24.
042ab
cde
5.07
2e4.
342d
4.61
1d
V3
3.88
9e4.
005g
T3
4.24
6bcd
5.15
5abc
4.37
4abc
4.61
8cV
34.
556a
5.08
7eT
34.
224ab
c5.
349cd
4.31
2de4.
397de
V4
5.11
6a6.
161a
T4
4.34
6bc4.
909d
4.28
9abcd
4.40
7cde
V4
4.08
4f4.
261g
T4
4.31
2ab5.
436c
4.85
6abc
5.04
7bc
V5
3.20
9g4.
507f
T5
4.51
4a5.
115ab
4.61
2ab5.
055ab
V5
4.16
8e5.
222c
T5
4.21
6abcd
de5.
674b
4.87
8ab5.
222b
V6
3.35
8f5.
753b
T6
4.41
6ab5.
297a
4.64
6a5.
065a
V6
4.31
5d5.
523a
T6
4.34
8a5.
967a
4.94
6a5.
873a
V7
4.14
8c5.
206cd
V7
4.41
6b4.
698f
Mea
nsfo
llow
edby
the
sam
ele
tter
(S)
with
intr
eatm
ent
are
not
sign
ifica
ntly
diff
eren
tat
5%us
ing
Dun
can’
sm
ultip
lera
nge
test
(DM
RT
).M
eans
ofth
ree
repl
icat
esar
eta
ken.
BS=
befo
reso
win
g;A
H=
Aft
erH
arve
stin
g.
2484
Dow
nloa
ded
by [
Um
eå U
nive
rsity
Lib
rary
] at
08:
38 0
7 O
ctob
er 2
014

Integrated Nutrient Management 2485
available manganese (Mn+2) was converted into its higher oxides (Mn+3 and Mn+4) whichare insoluble in water and therefore unavailable to plants (Das, 2007).During the secondand third year of the experimental period the role of organic matter and microbial activityalso played a significant role toward increasing the concentration of Mn in the post-harvestsoil. The role of organic matter in complexing Mn is important because organic matter canaffect the redox status of soils. The microbial decomposition of added organic matter incontinuous crops creates reducing conditions that favor manganese solubilization (Mandaland Mitra, 1982) (Table 6).
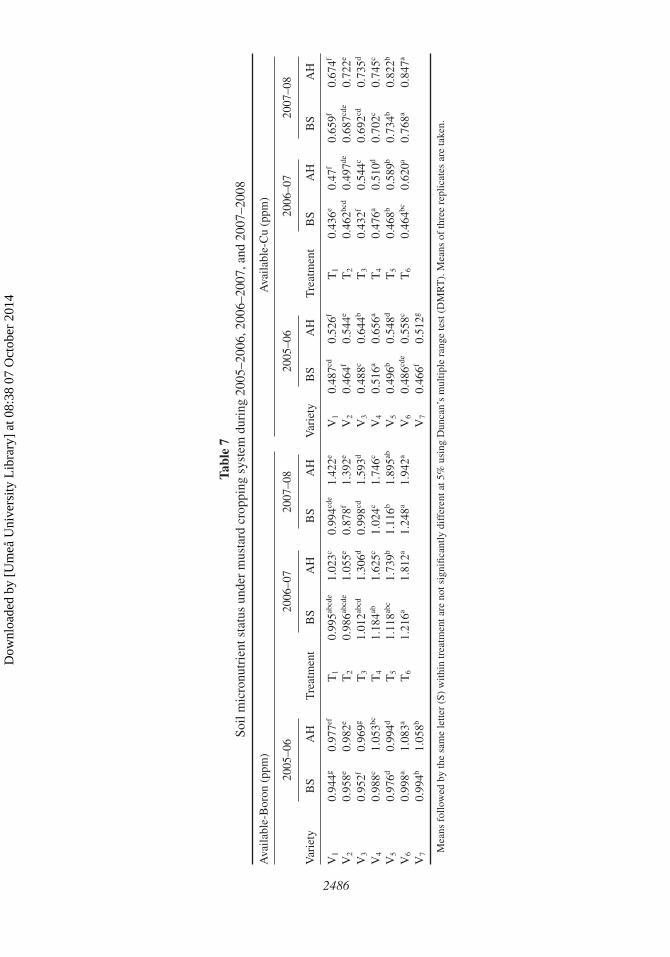
The status of available boron content was significantly higher in all three years of theexperimental period but the increase was significantly greater in 2006–2007 and 2007–2008 in all treatments, which may attribute to higher mobility of boron in the soil inpresence of biofertilizer and compost. The gradual build-up of boron in the soil samplesduring the three years of the experimental period might be attributed to lower uptake bythe crop plant (Das, 2007) (Table 7).
The results of the present investigation show that in all of the years, the level of copperincreased significantly in the soil post harvesting. The concentration of copper in the soil ismainly governed by the sorption and desorption from the surfaces of the oxides as well ason organic matter content (Jenne, 1968). In the present investigation the available coppercontent gradually increased, which may be due to binding of copper with manganese oxidesand organic matter present in the soil rendering it as non-exchangeable form and, therefore,not available for crop uptake. The increased level of copper in the post harvesting soil couldalso be due to formation of stable complexes of copper with humic acid and peat and themetal thus becomes immobilized. McLaren and Crawford (1973) reported that the organicfraction in particular seems to be a source of specific copper adsorption sites in the soil,because of its unique ability to form inner sphere complexes at wide range of pH levels(Das, Santra, and Mandal, 1995) (Table 7).
In the present investigation the available zinc content was higher in soil after harvest-ing of the crop as compared to the zinc content in soil before land preparation for sowingof seeds in all three years. The increased level of zinc in the post-harvested soil may be dueto formation of solid state organic matter. Zinc forming stable organic complexes with thesoil organic matter resulting into lesser availability for crop plants by the insoluble chela-tion reaction, causing resistance to exchange between plant soil system (Das, 2007). Theaddition of exogenous organic matter during the third year of experimental period may alsocontribute to the zinc level, which due to its ability to form complexes with zinc throughits functional groups promotes zinc availability in soils (Table 8).
Soil Biological Characteristics
In 2005–2006, there was an overall decrease in the soil bacterial population count afterharvesting, indicating the deleterious effect of the sole application of recommended dosesof chemical fertilizer affecting the population of bacteria in natural soil.
In 2006–2007, the results indicate that with the gradual increase in the dose of biofer-tilizer along with the reduced dose of chemical fertilizer have contributed significantly tothe increase in the bacterial population in the soil after harvesting than before land prepara-tion for sowing of seeds from treatment T2 to T5. This could be due to rapid multiplicationof bacteria applied through seed inoculation and soil application in a preferable medium.In 2007–2008, an application of compost along with Azotobacter and Phosphobacter asbiofertilizer significantly contributed toward increased bacterial population counts whichcould be due to rapid multiplication of bacteria applied through seed inoculation and soil
Dow
nloa
ded
by [
Um
eå U
nive
rsity
Lib
rary
] at
08:
38 0
7 O
ctob
er 2
014
Tabl
e7
Soil
mic
ronu
trie
ntst
atus
unde
rm
usta
rdcr
oppi
ngsy
stem
duri
ng20
05–2
006,
2006
–200
7,an
d20
07–2
008
Ava
ilabl
e-B
oron
(ppm
)A
vaila
ble-
Cu
(ppm
)
2005
–06
2006
–07
2007
–08
2005
–06
2006
–07
2007
–08
Var
iety
BS
AH
Tre
atm
ent
BS
AH
BS
AH
Var
iety
BS
AH
Tre
atm
ent
BS
AH
BS
AH
V1
0.94
4g0.
977ef
T1
0.99
5abcd
e1.
023c
0.99
4cde
1.42
2eV
10.
487cd
0.52
6fT
10.
436e
0.47
f0.
659f
0.67
4f
V2
0.95
8e0.
982e
T2
0.98
6abcd
e1.
055e
0.87
8f1.
392e
V2
0.46
4f0.
544e
T2
0.46
2bcd
0.49
7de0.
687cd
e0.
722e
V3
0.95
2f0.
969g
T3
1.01
2abcd
1.30
6d0.
998cd
1.59
3dV
30.
488c
0.64
4bT
30.
432f
0.54
4c0.
692cd
0.73
5d
V4
0.98
8c1.
053bc
T4
1.18
4ab1.
625c
1.02
4c1.
746c
V4
0.51
6a0.
656a
T4
0.47
6a0.
510d
0.70
2c0.
745c
V5
0.97
6d0.
994d
T5
1.11
8abc
1.73
9b1.
116b
1.89
5abV
50.
496b
0.54
8dT
50.
468b
0.58
9b0.
734b
0.82
2b
V6
0.99
8a1.
083a
T6
1.21
6a1.
812a
1.24
8a1.
942a
V6
0.48
6cde
0.55
8cT
60.
464bc
0.62
0a0.
768a
0.84
7a
V7
0.99
4b1.
058b
V7
0.46
6f0.
512g
Mea
nsfo
llow
edby
the
sam
ele
tter
(S)
with
intr
eatm
enta
reno
tsig
nific
antly
diff
eren
tat5
%us
ing
Dun
can’
sm
ultip
lera
nge
test
(DM
RT
).M
eans
ofth
ree
repl
icat
esar
eta
ken.
2486
Dow
nloa
ded
by [
Um
eå U
nive
rsity
Lib
rary
] at
08:
38 0
7 O
ctob
er 2
014

Integrated Nutrient Management 2487
Table 8Soil micronutrient status (available Zinc-ppm) under mustard cropping system during
2005–2006, 2006–2007, and 2007–2008
2005 2006-1st exp 2007
Variety BS AH Treatment BS AH BS AH
V1 2.046f 2.987a T1 2.145e 2.163f 2.122de 2.314cd
V2 2.112e 2.212f T2 2.344c 2.652c 2.134d 2.312cd
V3 2.142d 2.554c T3 2.688a 3.081a 2.169abc 2.356c
V4 2.216c 2.411d T4 2.312cd 2.534cde 2.175ab 2.456b
V5 2.022g 2.065g T5 2.218e 2.549cd 2.205a 2.552a
V6 2.312a 2.886b T6 2.474b 2.973ab 2.118de 2.198e
V7 2.264b 2.311e
Means followed by the same letter (S) within treatment are not significantly different at 5% usingDuncan’s multiple range test (DMRT). Means of three replicates are taken. BS = before sowing;AH = after harvesting.
application in preferable medium of organic matter, particularly compost. The organicmanure (compost) contributing to increase in the mineral nutrients, growth hormones, vita-mins, and improving other physical characters in soil might have significant influence onmicrobial population (Ismail, 1995). This therefore indicates that chemical fertilizer at therecommended dose is not congenial for growth of bacteria whereas its reduced dose alongwith seed inoculated biofertilizer resulted into more growth of bacterial population undersuch investigations (Table 9).
In the experimental results of soil fungal count, it was found that the fungal diversity inthe soil samples decreased in soils after harvesting with respect to the soil samples beforeland preparation for seed sowing in 2005–2006 and subsequently increased in 2006–2007and 2007–2008. The combined application of biofertilizer and compost has contributedsignificantly toward increases in the root biomass production, which resulted in higherproduction of root exudates increasing the fungal population count in the soil (Gunadi,Blount, & Edwards, 1999; Masciandaro, Ceccanti, & Ronchi Bauer, 2000) (Table 9).
In 2006–2007, applications of biofertilizer contributed significantly toward improve-ment in the soil with Azotobacter, Phosphobacter along with inherent species present inthe soil as well as a gradual increase of the biofertilizer doses that have contributed sig-nificantly to the increase in the Azotobacter and Phosphobacter population in soil afterharvesting of crop in all the treatments with respect to control. The results were found tobe similar in case of 2007 along with seed inoculation of Azotobacter and Phosphobacterbiofertilizer. This is in conformity with the findings of Bhavalker (1991). Therefore, itindicates that crop cultivation under recommended doses of chemical fertilizer rendersinconvenient medium of soil for growth of beneficial microorganisms in relation to cropproductivity. In all the years, data analysis showed significant variation among the differenttreatment combinations (Table 10).
Conclusion
The main conclusion of the present investigation includes the integrated nutrient manage-ment system, such as use of different combined doses of chemical fertilizer and biofertilizer
Dow
nloa
ded
by [
Um
eå U
nive
rsity
Lib
rary
] at
08:
38 0
7 O
ctob
er 2
014

Tabl
e9
Bac
teri
alan
dfu
ngal
popu
latio
nin
soil
(CFU
s)(b
efor
eso
win
gan
daf
ter
harv
estin
g)
Soil
Bac
teri
alco
unt(
CFU
.g−1
dry
soil)
Soil
Fung
alco
unt(
CFU
.g−1
dry
soil)
2005
–06
2006
–07
2007
–08
2005
–06
2006
–07
2007
–08
Var
iety
BS
AH
Tre
atm
ent
BS
AH
BS
AH
Var
iety
BS
AH
Tre
atm
ent
BS
AH
BS
AH
V1
87.4
85T
126
.18
24.1
880
.95
112.
19V
118
.32
21.2
5T
116
.16
19.1
620
.95
4.88
×10
−5de
×10
−5bc
de×
10−6
de×
10−6
e×
10−5
e×
10−5
f×
10−3
e×
10−3
a×
10−3
abcd
×10
−3ab
cd×
10−3
f×
10−3
f
V2
88.3
103.
70T
232
.34
68.1
788
.66
126.
25V
216
.31
8.64
T2
14.3
216
.32
28.3
847
.5×
10−5
d×
10−5
b×
10−6
abc
×10
−6d
×10
−5e
×10
−5e
×10
−3f
×10
−3g
×10
−3ab
cde
×10
−3ab
cde
×10
−3e
×10
−3e
V3
94.1
686
.74
T3
34.4
875
.19
105.
1213
8.75
V3
18.4
816
.87
T3
16.1
822
.16
34.1
857
.5×
10−5
abc
×10
−5bc
d×
10−6
ab×
10−6
abc
×10
−5d
×10
−5d
×10
−3d
×10
−3c
×10
−3ab
c×
10−3
abc
×10
−3d
×10
−3d
V4
164.
3215
8.02
T4
28.8
478
.48
114.
3615
3.45
V4
20.1
118
.07
T4
19.3
428
.39
42.6
662
.39
×10
−5a
×10
−5a
×10
−6d
×10
−6ab
×10
−5c
×10
−5c
×10
−3a
×10
−3b
×10
−3ab
×10
−3ab
×10
−3c
×10
−3c
V5
98.1
692
.30
T5
36.6
684
.16
128.
3816
8.15
V5
16.6
1215
.38
T5
23.3
235
.14
49.8
874
.57
×10
−5ab
×10
−5bc
×10
−6a
×10
−6a
×10
−5b
×10
−5ab
×10
−3g
×10
−3e
×10
−3a
×10
−3a
×10
−3a
×10
−3b
V6
69.3
861
.72
T6
24.8
616
.98
142.
1617
2.32
V6
18.9
914
.81
T6
15.4
85.
1648
.16
86.5
1×
10−5
f×
10−5
f×
10−6
de×
10−6
f×
10−5
a×
10−5
a×
10−3
c×
10−3
f×
10−3
abcd
e×
10−3
abcd
e×
10−3
b×
10−3
a
V7
48.3
244
.93
V7
19.3
416
.25
×10
−5g
×10
−5g
×10
−3b
×10
−3d
Mea
nsfo
llow
edby
the
sam
ele
tter
(S)
with
intr
eatm
enta
reno
tsig
nific
antly
diff
eren
tat5
%us
ing
Dun
can’
sm
ultip
lera
nge
test
(DM
RT
).M
eans
ofth
ree
repl
icat
esar
eta
ken.
BS
=be
fore
sow
ing;
AH
=af
ter
harv
estin
g.
2488
Dow
nloa
ded
by [
Um
eå U
nive
rsity
Lib
rary
] at
08:
38 0
7 O
ctob
er 2
014

Tabl
e10
Azo
toba
cter
and
Pho
spho
bact
erPo
pula
tion
inso
il(C
FUs)
(bef
ore
sow
ing
and
afte
rha
rves
ting)
unde
rm
usta
rdcr
oppi
ngse
ason
of20
06–2
007
and
2007
–200
8
Soil
Azo
toba
cter
coun
t(C
FU.g
−1dr
yso
il)So
ilP
hosp
hoba
cter
coun
t(C
FU.g
−1dr
yso
il)
2006
–07
2007
–08
2006
–07
2007
–08
Tre
atm
ent
BS
AH
BS
AH
Tre
atm
ent
BS
AH
BS
AH
T1
10×
10−6
acde
16.3
2×
10−6
abc
32.3
8×
10−5
f45
.85
×10
−5f
T1
14×
10−6
e4
×10
−6f
16.1
7×
10−6
cde
14.3
9×
10−6
e
T2
8.96
×10
−6ab
cde
11.3
8×
10−6
abcd
e38
.18
×10
−5e
65.1
5×
10−5
eT
216
.72
×10
−6cd
32.3
7×
10−6
d18
.18
×10
−6cd
24.3
9×
10−6
d
T3
12.3
8×
10−6
ab17
.51
×10
−6ab
48.6
2×
10−5
d86
.25
×10
−5cd
T3
20.3
6×
10−6
b48
.18
×10
−6c
14.3
2×
10−6
cde
17.5
×10
−6e
T4
10.8
4×
10−6
abcd
18.9
6×
10−6
a54
.14
×10
−5c
90×
10−5
cT
418
.14
×10
−6c
58.5
9×
10−6
ab18
.38
×10
−6c
36.8
4×
10−6
c
T5
12.5
4×
10−6
a15
.16
×10
−6ab
cd62
.12
×10
−5b
103.
95×
10−5
bT
524
.32
×10
−6a
61.1
6×
10−6
a24
.32
×10
−6b
89.7
5×
10−6
b
T6
11.1
8×
10−6
abc
14.3
2×
10−6
abcd
e78
.16
×10
−5a
122.
89×
10−5
aT
613
.72
×10
−6e
16.8
3×
10−6
e30
.36
×10
−6a
98.4
3×
10−6
a
Mea
nsfo
llow
edby
the
sam
ele
tter
(S)
with
intr
eatm
enta
reno
tsig
nific
antly
diff
eren
tat5
%us
ing
Dun
can’
sm
ultip
lera
nge
test
(DM
RT
).M
eans
ofth
ree
repl
icat
esar
eta
ken.
2489
Dow
nloa
ded
by [
Um
eå U
nive
rsity
Lib
rary
] at
08:
38 0
7 O
ctob
er 2
014

2490 A. Banerjee et al.
along with compost, significantly improved the soil fertility in terms of soil macronutrientand micronutrient status, as well as soil health in terms of increased microbial popula-tion in soil. The uses of biofertilizers have resulted in higher soil organic matter, nitrogen,available phosphorus, and potassium. The uses of biofertilizers and compost have mediatedhigher availability of Fe, Mn, Zn. Cu, and B in soil. The use of biofertilizers and compostsignificantly improved soil bacterial and fungal population counts in the soil. Thus, throughintegrated nutrient management practices such as application of biofertilizer and compostsoil can considerably improve the soil fertility and soil health.
Acknowledgements
This work was supported by University Grants Commission (UGC) under UGC majorresearch project having basic research grant from Government of India (Ref No.30-109/2004 (SR) dt. 10.11.2004). Author is highly grateful to Prof. J. K. Datta, thePrincipal Investigator of this project and to all staff members of Crop Research and SeedMultiplication Farm of Burdwan University, West Bengal, India for carrying out the fieldexperiments for subsequent three years.
References
Bavaskar, V. S., and G. K. Zende. 1973. Soil fertility under continuous manuring and ropping. IndianJournal of Agricultural Science 43 (5): 492–499.
Bhatia, K. S., and K. K. Shukla. 1982. Effect of continuous application of fertilizers and manureson some physical properties of eroded alluvial soil. Journal of Indian Society of Soil Science30 (1): 33–36.
Bhavalker, U. S. 1991. Vermiculture biotechnology for LEISSA seminar on low external inputsustainable agriculture, Amsterdam, Netherlands, pp. 1–6.
Biswas, T. D., B. L. Jain, and S. C. Mandal. 1971. Cumulative effect of different levels of manureson the physical properties of soil. Journal of Indian Society of Soil Science 19 (1) :31–37.
Black, C. A. (Ed.). 1965. Methods of Soil Analysis. Part I & Part II. Madison, WI: American Societyof Agronomy.
Chavan, D. A., M. S. Desmukh, S. S. More, and W. N. Narkhede. 2007. Impact of long term fer-tilizer application in yield and nutrient availability in sorghum-wheat-cropping system. Paperpresented at State level seminar on soil health enhancement for food and environmental security.Parbhani, Oct. 12–13.
Das, D. K., G. H. Santra, and L. N. Mandal. 1995. Influence of blue green algae on the availabilityof micronutrients in soils growing rice. Journal of the Indian Society of Soil Science 43 (1):145–146.
Das, D. K. 2007. Micronutrients: Their behavior in soils and plants.2nd revised edition: New Delhi,India.
Das, K., R. Dang, and T. N. Shivananda. 2008. Influence of biofertilizers on the availability of nutri-ents (N,P, and K) in soil in relation to growth and yield of Stevia rebaudiana grown in SouthIndia. International Journal of Applied Research in Natural Products 1 (1): 20–24.
Das, A., M. Praad, and R. C. Goutam. 2003. Residual effect of organic and inorganic sources of nitro-gen applied to cotton (Gossypium hirsutum) on succeeding wheat (Triticum aestivum). IndianJournal of Agronomy 49 (3): 143–146.
Dible, W. T., E. Truog, and K. C. Berger. 1954. Boron determination in plant and soils. AnalyticalChemistry 26: 418.
Fox, T. R, N. B. Comeford, and W. W. Fee. 1990. Kinetics of phosphorous release from spodosols:Effect of oxalate and formate. Soil Science Society of America Journal 54: 1441–1447.
Dow
nloa
ded
by [
Um
eå U
nive
rsity
Lib
rary
] at
08:
38 0
7 O
ctob
er 2
014

Integrated Nutrient Management 2491
Gunadi, B., C. Blount, and C. A. Edwards. 1999. The growth and fecundity of Eisenia fetida(Savigny) in cattle solids pre-composted for different periods. Pedobiologia 46 (1): 15–33.
Ismail, S. 1995. Earthworms in soil fertility management in organic agriculture. P. K. Thampan, ed.pp. 78–95. Cochin, India: Peekay Tree Crops Development Foundation.
Jackson, M. L. 1958. Soil Chemical Analysis London: Prentice Hall.Jenne, E. 1968. Trace inorganics in water. Advances in Chemistry Series 73:337–387.Kabata–Pendias, A. 2000. Trace Elements in Soils and Plants, 3rd edition. New York: CRC
Press LLC.Kavitha, R., and P. Subramanian. 2007. Effect of enriched municipal solid waste compost application
on soil available macronutrients in the rice field. Archives of Agronomy and Soil Science 53 (5):497–506.
Khiani, K. N., and D. A. Moore. 1984. Long-term effects of tillage operations and farmyard manureapplication on soil properties and crop yield in vertisol. Journal of the Indian Society of SoilScience. 32 (3): 392–393.
Krishnamurthi, G. S. R., A. V. Mahavir, and V. A. K. Sharma. 1970. Spectrophotometric determina-tion of Fe with orhophenanthroline. Micro Chemical Journal 15: 585–589.
Lindsay, W. L., and W. A. Norvell. 1978. Development of DTPA soil test for zinc, manganese andcopper. Soil Science Society America Journal 42: 421–428.
MAPA. 1994 Metados Oficiales de Analisis Tomo III Madrid: Ministerio de Agricultura. PescayAlimentacion.
Maji, N. C., and S. R. Mondal 2004. Effect of long term use of fertilizers and manures or soil fertility.Environment & Ecology. 22(2): 447–451.
Malewar, G. U., and A. R. Hasnabade 1995. Effect of long term application of fertilizers and organicsources on some properties of vertisol. Journal of Maharashtra Agricultural University. 20 (2):285–286.
Mandal, L. N., and R. R. Mitra. 1982. Transformation of iron and manganese in rice soils underdifferent moisture regimes and organic matter applications. Plant and Soil. 69: 45–56.
Masciandaro, G. B., Ceccanti, V., and Ronchi C. Bauer. 2000. Kinetic parameters of dehydrogenaseand inorganic fertilizers. Biology and Fertility of Soils, 32 (6): 579–587.
McLaren, R. H., and D. V. Crawford. 1973. Studies on soil copper, I: The fractionation of copper insoils. Journal of Soil Science 24: 172–181.
Nephade, D. S., and S. G. Wankhade.1987. Effect of varying levels of sulfur and molybdenum on thecontent and uptake of nutrients and yield of mung PVK Research Journal 11 (2): 139–143.
Olsen, S. R., C. V. Cole, F. S. Watnabe, and L. A. Dean. 1954. Estimation of available phosphorousin soils by extraction with sodium bicarbonate. U.S. Department of Agriculture Circular. 939.
Patil, B. D. 1997. Effect of integrated nutrient management on the forms of soil NPK and theiravailability under sorghum wheat sequence in vertisol. PhD thesis submitted to MPKV, Rahuri.
Ramaswami, P. P., and Son T. T. N. Son. 1997. Effect of organic wastes application on physical andchemical properties of heavy clay soil. Omon Rice 5: 48–55.
Ramteke, J. R., U. V. Mahadkar, and R. S. Yadav. 1998. Sustainable crop production through crop-ping system and organic farming. First International Agronomy Congress. Extended summariesNov., 23–27, 1998. New Delhi, India, pp. 393–394.
Reddy, G. B., and M. S. Reddy. 1998. Effect of organic manures and nitrogen levels on soil availablenutrient status in maize soybean cropping system. Journal of the Indian society of Soil Science46(3): 474–476.
Sharpley, A. N. 2000. Bio available phosphorus in soil. In ed. G. M. Pierzynski’s Methodsfor Phosphorus Analysis for Soils, Sediments, Residuals and Waters. pp. 38–43.SouthernCooperative Series Bulletin No. 396. Raleigh, NC: North Carolina State University.
Singh, S., R. N. Singh, J. Prasad, and B. Kumar. 2002. Effect of green manuring, FYM and biofertil-izer in relation to fertilizer nitrogen on yield and major nutrient uptake by upland rice. Journalof Indian Society of Soil Science. 50 (3): 313–314.
Stat Soft Inc. (1998) STATISTICA for Windows (computer programme manual) Stat Soft.Inc, Tulsa,Oklahoma.
Dow
nloa
ded
by [
Um
eå U
nive
rsity
Lib
rary
] at
08:
38 0
7 O
ctob
er 2
014
2492 A. Banerjee et al.
Subbiah, B. V., and G. L. Asija. 1956. A rapid procedure for determination of available nitrogen insoils. Current Science. 25: 259–260.
Talathi, M. S., J. R. Ramteke, U. V. Mahadkar, and S. S. Magar 2002 Integrated nutrient managementfor sustaining productivity dynamics under rice based cropping systems. Paper presented at 2ndInternational conference on sustainable agriculture for food, energy and industry at Beijing,China. Sept. 8–13.
Walksman, S. A., and E. B. Fred. 1922. A tentative outline of for the plate method for determiningthe number of microorganisms in soil. Soil Science. 14: 27–28.
Walkley, A. 1947. Critical examination of rapid method for determining organic carbon in soils,effect of variation in digestion conditions and of inorganic soil constituents. Soil Science.632: 251.
Willard, H. H., and L. H. Greathouse. 1917. The colorimetric determination of Manganese byoxidation with periodate. Journal of the American Chemical Society 39: 2366–2397.
Yadav, R. S. 1998. Performance of organic farming in rice based cropping system. M.Sc. (Agri.)Thesis, Dr. Balasaheb Sawant Konkan Krishi Vidyapeeth, Dapoli (India).
Dow
nloa
ded
by [
Um
eå U
nive
rsity
Lib
rary
] at
08:
38 0
7 O
ctob
er 2
014


